

Translate this page into:
Adsorption of malachite green by activated carbon derived from gasified Hevea brasiliensis root
⁎Corresponding author. chazmier@usm.my (Mohd Azmier Ahmad)
-
Received: ,
Accepted: ,
This article was originally published by Elsevier and was migrated to Scientific Scholar after the change of Publisher.
Abstract
One of the challenges in biomass gasification industry is the solid waste disposal mostly in the form of char. This article aims to prepare the gasified Hevea brasiliensis root based activated carbon (GHBRAC) for the sequestration of malachite green (MG) dye, to analyse the GHBRAC characteristics that are responsible for adsorption and to evaluate the MG uptake capacities of the prepared GHBRAC. The gasified Hevea brasiliensis root (GHBR) was obtained from commercial gasification plant and physiochemically treated with potassium hydroxide (impregnation ratios = 2.00) and carbon dioxide (flowrate = 150 cm3/min) via microwave irradiation (radiation power = 616 W). The total pore volume (TPV) and BET surface area (SBET) of GHBRAC were 0.273 cm3 and 477.74 m2/g respectively. The isothermal data best fitted to the n-BET model while the kinetic data followed the Avrami model equation, revealing a multilayer adsorption. The thermodynamic data of MG adsorption by GHBRAC showed that the process was spontaneous and endothermic. The Yoon–Nelson, Thomas and Yan models effectively predicted the adsorption of MG in fixed-bed column. GHBRAC was found to be economically feasible for commercialization owing to its low production cost and high adsorption capacity.
Keywords
Gasification waste
Adsorption kinetics
Activated carbon
Characterization
Adsorption

1 Introduction
Water pollution has become one of the most serious issues which threatens the sustainability of living organisms. Disposal of synthetic dyes into water bodies without proper treatment gives rise to severe problems and concerns. More than 10,000 dyes (Dahri et al., 2014) have been used in textile, paper, cosmetic and food industries, resulting in a large amount of dye wastewater. Malachite green (MG) dyes have been commonly used for dyeing of wool, silk and leather, paper, distilleries and food coloring agent (Ayuni, 2015). It is also utilized as fungicide, parasiticide and bactericide in aquaculture industries due to its efficacy and low cost (Oyelude et al., 2018). However, MG is toxic and can cause carcinogenesis, mutagenesis, destruction of respiratory system, liver, gill, kidney, intestine and gonads (Zhang et al., 2017). The use of MG is not permitted for aquaculture industries in Canada, United States, European Union and China and the environmental allowable limit of MG concentration in water was set around 0.5–100 µg/L (Zhang et al., 2017). Thus, it is essential to remove the high concentration of MG from water bodies.
Among several approaches of wastewater treatment such as coagulation, flocculation, chemical oxidation, membrane filtration, aerobic and anaerobic degradation, reverse osmosis, photocatalytic degradation and microbial processes (Qu et al., 2013), adsorption is the most facile, efficient, rapid, and low-cost for pollutants removal (Wong et al., 2018; Yagub et al., 2014). The global activated carbon (AC) market size was estimated at USD 4.72 billion in 2018 and is expected to expand owing to stringent environmental policies regarding water resources, air quality control and clean gas application (Grand View Research, 2019). Due to the excessive demand of AC, there is shortage of raw materials such as coconut shell charcoal which are used for making of AC. Owing to this, the prices of the raw materials mainly coconut shell charcoal and coal-based activated carbons have increased. Hence, many studies have been carried out to produce cheap and efficient AC from low-cost and renewable resources, such as oak wood (Hajati et al., 2015), coconut pitch (Saman et al., 2015), walnut wood, rice straw (Sangon et al., 2018), pomelo peel (Low and Tan, 2018), mussel shell (Van et al., 2019), sawdust (Khasri et al., 2018), oil palm waste (Rashidi and Yusup, 2017), orange peel (Pandiarajan et al., 2018) and cotton waste (Sartova et al., 2019; Tian, 2019). Most of the studies focused on agricultural waste due to its abundant availability. However, there are very limited number of studies on the utilization of gasification plant residues for adsorption application.
The rubber tree (Hevea brasiliensis) with its average height of 30 m has been cultivated for natural rubber production over 10 million hectares (Singh et al., 2020). The global natural rubber market is anticipated to reach USD 33.87 Billion by 2027, according to a new report by Reports and Data (R. and Data, 2020). Most of the global production is derived from plantations in Asia, which accounts for 83%, with Thailand, Indonesia, and Malaysia as the world’s largest natural rubber producers (Blagodatsky et al., 2016). The economic lifetime of rubber trees is between 20 and 30 years (Petsri et al., 2013; Haikal et al., 2019). Approximately 90 to 120 kilo hectares of mature rubber plantations are clear-cut annually for replanting in Thailand. Stumps and roots, which account for 15% of the total biomass are an attractive feedstock for power generation. The stumps and roots were approximated to be 23–40 tonnes on a dry weight basis per hectare, and these values increase with an increase of the tree age. The total dry mass (including leaves, stumps, and roots) of the mature rubber wood trees was 289 tonnes/ha for the 30-year-old trees (Hytönen et al., 2019).
The roots of Hevea brasiliensis can be used as a feedstock in gasification process for power generation. However, the disposal of gasification char residues which was generated approximately 5–10% of the initial feedstock is another environmental issue. Presently, gasification char (GC) is treated as waste which is considered as actual loss for the plant owners and no special disposal method has been employed. The growth of gasification industry, which is expected to increase up to US $126 Billion (IMARC Group, 2017) by 2023 will create a substantial increase in solid waste management problem. Hence, it is beneficial to develop the gasification residues as a precursor for AC. To date, there have been no reported studies on MG removal using Hevea brasiliensis carbon residues from biomass gasification plants.
This study aimed to prepare AC derived from Hevea brasiliensis root gasification residues for MG dye removal. To date, there have been no reported studies on MG removal using carbon residues from gasified Hevea brasiliensis root. The study was performed both in batch and continuous mode of operations to assess the equilibrium and kinetic behaviour of MG adsorption. A non-linear regression approach was applied as linear equations in regression analyses may lead to inaccuracies. The economic feasibility of GHBRAC was performed and compared with the existing AC.
2 Methodology
2.1 Precursor preparation and physiochemical activation
Gasification waste from Hevea brasiliensis root (GHBR) was obtained from a commercial gasification plant in Thailand. This plant generated 12 MW power from 4,800 kg/hr of rubber tree roots, which also produced 300–500 kg/hr of char residues. The char sample was washed, dried at 105 °C for 24 h and treated with potassium hydroxide (KOH) at impregnation ratios (IR) of 2.00 (WKOH/Wchar). 10 g of KOH pellet was dissolved in deionized water and mixed with 5 g of GHBR. The sample was dried in the oven overnight at 105 °C for 24 h. Activation via microwave irradiation (as shown in Fig. 1) was operated at 616 W for 1 min using CO2 gas with flowrate of 150 cm3/min. The activated product was then cooled to room temperature and finally rinsed repeatedly with deionised water and HCl (0.1 M) until the pH value of the sample achieved 7. The produced AC was then dried at 110 °C for 24 h before further uses.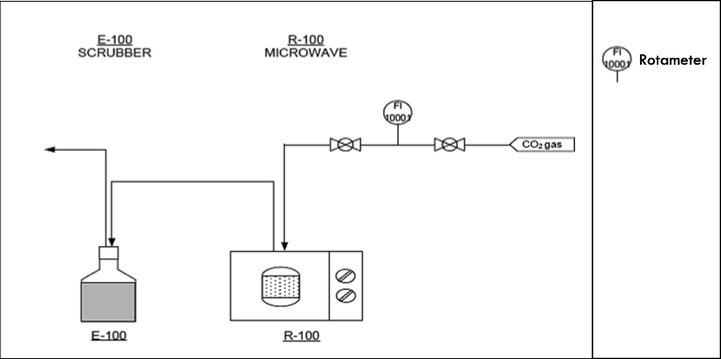
Process flow diagram of microwave activation.
2.2 Characterization
Nitrogen adsorption–desorption measurements (Model: Micromeritics ASAP 2020, USA) were performed to determine the Brunauer–Emmett–Teller (BET) surface area, Barrett-Joyner-Halenda (BJH) pore size distribution, total pore volume (TPV), and average pore diameter (APD) of the sample. The surface morphology of the samples was examined via scanning electron microscopy (SEM) (Model: LEO SUPRA 55VP, Germany). The proximate analysis was analyed using TGA equipment (Model: Perkin Elmer STA 6000, USA), while elemental analysis was conducted using a CHONS analyser (Model: Perkin Elmer Series II 2400, USA). Fourier-transform infrared (Model: Shimadzu Prestige 21, Japan) spectroscopy was used to evaluate the chemical structural properties.
2.3 Effect of pH
A 0.2 g of AC was agitated with 200 mL of 100 mg/L adsorbate solutions at five different solution pH (2, 4, 6, 8, and 10) in a separated Erlenmeyer flask. 0.1 M of HCl and NaOH were used for solution pH adjustment. The pH of solution was measured using pH meter (Model: Delta 320, Mettler Toledo, China). The adsorbate solution was withdrawn after 24 h and the concentration of the sample was analysed. Point of zero charge (pHPZC) of the AC was determined according to the method adapted from Essandoh et al (Essandoh et al., 2015). 0.1 g of AC was mixed with 10 mL of 0.01 M NaCl aqueous solutions with pH values ranging from 2 to 12 and the mixtures were swirled for 48 h. The value of pHPZC was obtained by plotting the change in pH against its initial pH.
2.4 Equilibrium study
The adsorption of MG was conducted at various initial MG concentrations (50–300 mg/L) and temperatures (40, 45 and 60 °C) using a water bath shaker for 24 h. In each test, GHBRAC with a mass of 0.2 g was added to the 200 mL MG solution. The experimental points were examined using the non-linear form of Langmuir, Freundlich and n-layer BET isotherm models (Ahmad et al., 2020). These equations were solved using a curve fitting tool provided in MATLAB R2019b.
2.5 Kinetic study
Similar steps in equilibrium study were applied for the contact time ranging from 15 to 1440 min. The non-linear form of Pseudo-first order (PFO), Pseudo-second order (PSO), Elovich and Avrami kinetic models (Ahmad et al., 2020) were used to evaluate the effects of contact time on MG adsorption. A curve fitting tool provided in MATLAB R2019b was used to solve the non-linear equations.
2.6 Thermodynamic study
Thermodynamic parameters of MG adsorption were studied according to Lima et al. (Lima et al., 2019) and applying the van’t Hoff equation (Sakin Omer et al., 2018):
2.7 Continuous adsorption study
The continuous adsorption of MG was assessed using a 14 mm inner diameter glass tube with a length of 160 mm. A peristaltic pump was used to control the MG solution (100 mg/L) influent with different flow rate of 0.5, 1 and 2 mL/min. The process flow diagram of MG adsorption in fixed-bed column is shown in Fig. 2. Samples were collected at the column exit, and the operation was stopped when Ct/C0 reached unity. The MG concentration was analysed using a UV/Vis spectrophotometer at 617 nm.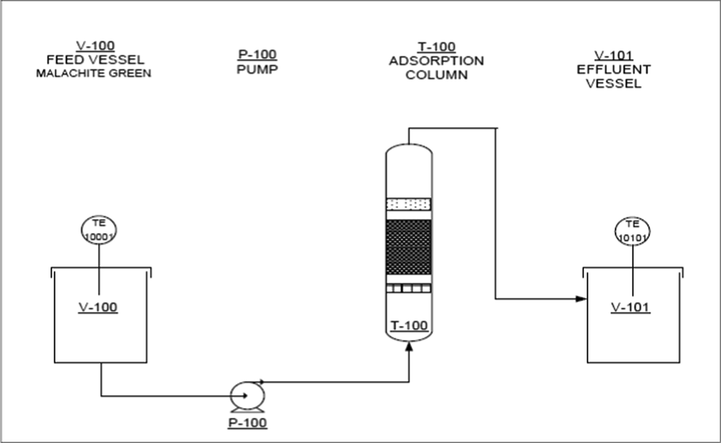
Process flow diagram of MG continuous adsorption.
Thomas, Yoon–Nelson, Bohart–Adams and Yan models were employed for the analysis of column breakthrough curves. These model equations are given in the supplementary information.
2.8 Economic analysis
The production cost of GHBRAC was estimated using the method adopted from Selvaraju and Bakar (2017), Lam (2017) and Liew (2018) to determine the feasibility of GHBRAC for commercialization. The estimation includes the cost of transportation, chemicals and gas consumed, and electrical consumption (for activation process) as shown in Table 1.
Component
Estimated cost (USD/kg)
Transportation cost
0.2
Chemicals (KOH & HCl)
KOH = USD 0.01, HCl = USD 0.01 (Selvaraju and Bakar, 2017)0.03
CO2 gas, USD 15/25 kg
1 standard refill of CO2 gas in Malaysia = 25 kg
Total consumption = 0.15 L0.0002
Electrical consumption (0.616 kW × 1 min)
*Charges rate of electricity in Malaysia (1 kWh) = USD 0.05 (Liew, 2018)0.0005
Total estimated production cost
0.2307
3 Results & discussion
3.1 Characterization of GHBR and GHBRAC
3.1.1 N2 Adsorption isotherm and physical properties
The N2 adsorption–desorption isotherm for GHBR and GHBRAC is illustrated in Fig. 3 (a). Initially, GHBR exhibited Type II adsorption isotherm. After activation process, GHBRAC illustrated a combination of Type I and II sorption isotherm with H4 type of loop (Lam et al., 2017; Du, 2016); indicating the presence of micropores and mesopores. The pronounced uptake at low P/P0 was seen due to adsorbent-adsorbate interactions in wider micropores and narrow mesopores (<∼2.5 nm), demonstrating a pore filling mechanism. Meanwhile, the characteristic of monolayer-multilayer adsorption was also observed as P/P0 increased. Similar trend was reported by Lam (2017), Yang and Hong (2018) and Soltani et al. (2019) who studied the characterization of AC.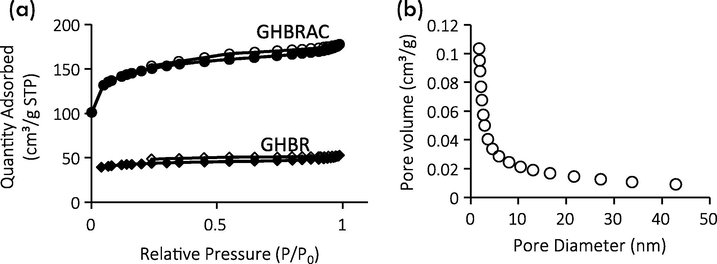
(a) N2 adsorption-desorption isotherms of GHBR and GHBRAC (b) PSD of GHBRAC.
Table 2 summarizes the BET surface area (SBET), total pore volume (TPV) and average pore diameter (APD). The GHBR initially possessed low SBET, and small TPV of 135.22 m2/g and 0.080 cm3/g, respectively. After physicochemical activation, both micropore and mesopore volume increased, thus resulting in larger SBET. The increase in the SBET values was due to pore development and widening of the existing pores during the microwave irradiation stage. Fig. 3 (b) presents the BJH pore size distribution of GHBRAC, which was between 1.82 and 42.97 nm, suggesting the possible adsorption of MG dye with molecular dimensions of 1.21 nm × 1.19 nm × 0.53 nm (Song et al., 2013). The pore size of GHBRAC was concentrated around 1.9–2.2 nm, indicating the formation of a greater number of small mesopores than big mesopores.
SBET (m2/g)
TPV (cm3/g)
APD (nm)
GHBR
135.22
0.080
3.49
GHBRAC
477.74
0.273
3.27
The development of pore structures involved the following reactions: 6KOH + 2C → 2K + 3H2 + 2K2CO3 K2CO3 + 2C → 2K + 3CO K2CO3 → K2O + CO2 K2O + 2C → 2K + CO
Meanwhile, the reaction occurred between CO2 gas and char is as follows: C + CO2 → 2CO C + H2O → CO + H2
CO2 gas also react with KOH to produce potassium ions of K2CO3: 2KOH + CO2 → K2CO3 + H2O
The formation of pores was improved by (i) the decomposition of K2CO3 to produce CO2 and K2O, (ii) the reduction of K2O by carbon to form K and CO and (iii) the diffusion of K. The metallic potassium K that formed during the gasification process would penetrate the inner structure of GHBR, resulting in the broadening of the existing pores and creation of new tiny pores (Hoseinzadeh Hesas et al., 2013). CO2 diffused into internal structure of GHBR char matrix, thus reacted with the active sites available on the carbon’s surface, creating new pores. The continuation of CO2 gasification also caused the widening effect of existing pores (Zhao-qiang et al., 2014). Furthermore, the interaction between MW irradiation and the KOH would further facilitate the formation of new pores and enlarge the existing pores due to the intercalation effect of the energized alkali metal atom (Liew, 2018).
3.1.2 SEM analysis
The surface morphology details of the samples are shown in Fig. 4. GHBR initially exhibits a dirt-covered and homogeneous porous structure with thick wall as shown in Fig. 4(a). After the activation step, the surface structures of the GHBRAC become cleaner with thinner wall and the formation of new tiny pores can be observed in Fig. 4(b), proving the heterogenous structures of GHBRAC (micropores and mesopores combination) as found in Section 3.11. This will aid the MG adsorption due to the existence of additional vacant sites for trapping the MG molecules. Similar structures were reported by Ahmed and Hameed (2018), Bello et al. (2020) and Sharma et al. (2019) who produced AC from barley straws, Gmelina aborea leaf, and Pinus roxburghii cone, respectively.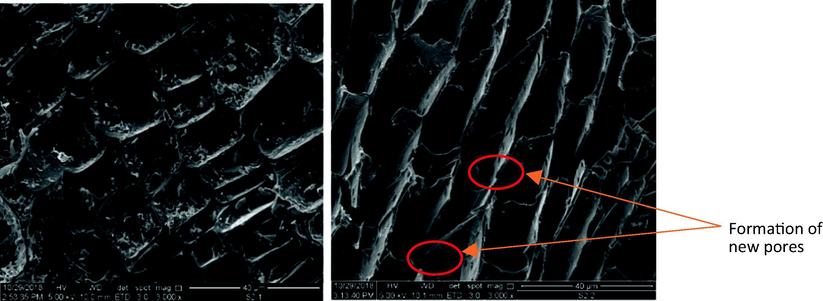
SEM images of (a) GHBR (b) GHBRAC.
3.1.3 Proximate and elemental analysis
Fig. 5 indicates the proximate and elemental composition of GHBR and GHBRAC. The produced GHBRAC generally followed the AC standard in SNI-06-3730-1995 (Pandia et al., 2018). It was expected that the amount of the volatile matter reduced after activation due to the devolatilization, thus increased the percentage of fixed carbon in the AC samples. However, the reverse trend was observed after activation, where the fixed carbon composition slightly decreased after activation process due to consumption of carbon matter in CO2-carbon reaction. Moisture content of GHBRAC increases due to water formation at high temperatures resulting from dehydration reactions (Bedia et al., 2018). Similar pattern was also observed for volatile matter. This could be due to the tendency of porous AC carbon to absorb the volatile matters after they have been rapidly released during the heat treatment. This increasing trend was also reported by Yang and Qiu (2011), who synthesized AC from herb residue using ZnCl2.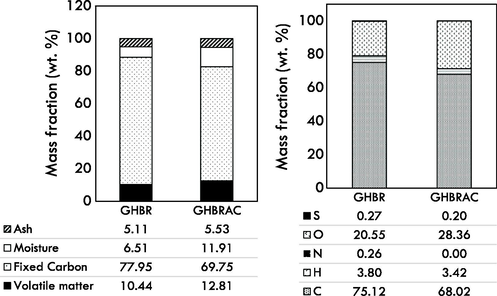
(a) Proximate analysis and (b) Elemental composition of GHBR and GHBRAC.
3.1.4 Sample functional groups
Fig. 6 illustrates the FTIR spectrum of GHBR and GHBRAC. The FTIR spectrum revealed the peaks at 3491 and 3522 cm−1, which could be ascribed to the presence of O—H stretching bands from alcohols and phenols group. The peaks around 1539 and 1602 cm−1 correspond to C⚌C stretching of the aromatic rings (Chen et al., 2011) and carboxyl-carbonate structures (Mopoung et al., 2015). The shoulder peaks at 1265 and 1290 cm−1 could be assigned to the stretching vibration of C—O in phenol and ether groups or in-plane vibration of O—H of carboxylic group (Gao, 2013). It was concluded that all of the functional groups presence in GHBR reduced in concentration after activation.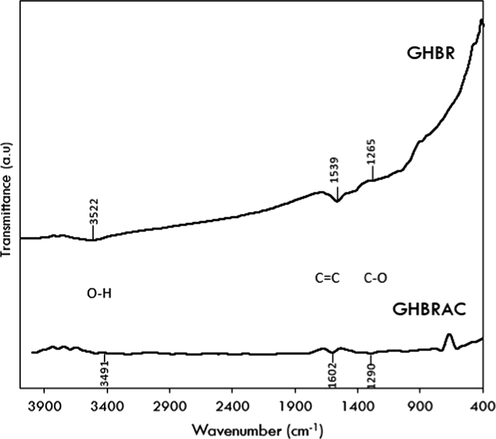
FTIR spectrum of GHBR and GHBRAC.
3.2 Effect of initial pH
Fig. 7 indicates the influence of pH on MG adsorption by GHBRAC. Results show that the equilibrium uptake of MG significantly increased with pH increase from 2 to 4. Beyond pH 4, there was no prominent change in the MG uptake capacity. The declined in MG uptake below pH 4 was attributed to electrostatic repulsion between positively charged GHBRAC and the positively charged MG dye. The surface charge of GHBRAC can be influenced by its pHPZC, which was found at pH 6.3. At pH below pHpzc, the surface charge of GHBRAC is mainly positive which tend to repel the positively charged MG dye (Makeswari and Santhi, 2013) since the number of the negatively charged groups at the GHBRAC surface decreased, while the positively charged groups increased. Hence the adsorption of MG onto the surface of the GHBRAC decreased as pH was reduced from 4 to 2. A significant removal of MG dye even at pH (4–6) < pHpzc was observed signifying the involvement of H-bonding and π- π interactions (Choudhary et al., 2020). Above pH 6, the favorable adsorption was also due to electrostatic attraction between positively charged MG and negatively charged ACs surface. Similar trend was found in the previous study (Ahmad et al., 2020) using gasified Glyricidia sepium woodchip.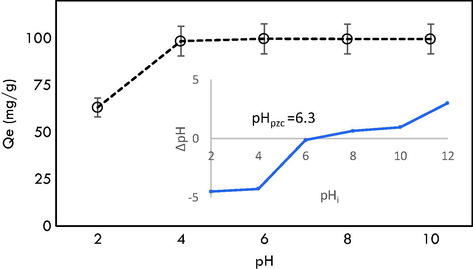
Effect of pH on MG adsorption.
3.3 Adsorption isotherm
Fig. 8 indicates the plots of Langmuir, Freundlich and n-BET isotherm models and Table 3 indicates the values of each model parameter and error function values. It was observed that the four-parameter n-BET model shows good agreement to the experimental data, with the highest values of R2 and the lowest values of
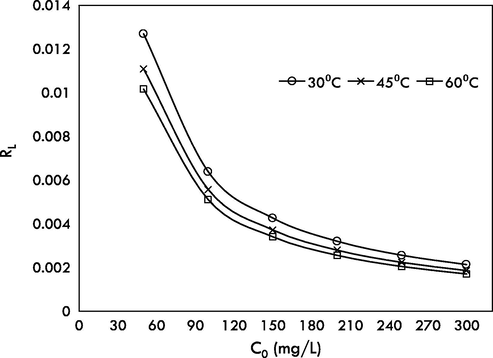
, RMSE, HYBRD, MPSD and ARE at all studied temperatures. This signified that the adsorption of MG followed multilayer adsorption with maximum number of layers, nBET equal to 3, 6 and 5 at 30, 45 and 60 °C. The equilibrium adsorption capacity predicted by the n-BET model at 30 °C was 259.49 mg/g, which is higher than Jeyagowri & Yamuna (125.00 mg/g) (Jeyagowri and Yamuna, 2016); Bouaziz et al. (172.41 mg/g) (Bouaziz et al., 2017) and Jiang et al. (212.7 mg/g) (Jiang et al., 2017); who also studied MG adsorption but used different types of adsorbents. GHBRAC recorded the highest MG uptake capacities compared to other types of adsorbent as shown in Table 4. The favorable behavior of MG adsorption by GHBRAC can be described by the value of separation factor (RL). The plot of RL versus MG initial concentration is indicated in Fig. 9. RL values were ranged from 0 to 1 for all concentrations proving the favorable of MG adsorption process. *Unit: Qm = mg/g , KL = L/mg, KF = mg/g (L/mg)1/n, QM,BET = mg/g, KL,BET = L/mg, KS = L/mg. *RMSE = residual root mean square error, HYBRD = hybrid fractional error function, MPSD = Marquardt’s percent standard deviation, ARE = average relative error.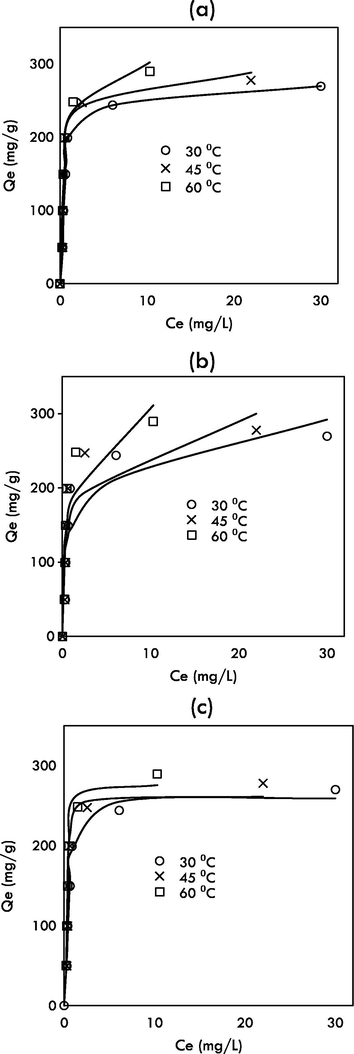
Fitting of (a) Langmuir (b) Freundlich (c) n-BET models isotherm models to experimental data.
Langmuir
Temp (°C)
Qm
KL
R2
χ2
RMSE
HYBRD
MPSD
ARE
30
278.7
1.555
0.9038
30.06
29.48
45.63
44.55
14.78
45
295.8
1.783
0.8593
45.16
36.73
71.44
55.23
18.21
60
317.5
1.947
0.8831
39.57
34.66
60.6
50.41
16.57
Freundlich
Temp (°C)
KF
nF
R2
χ2
RMSE
HYBRD
MPSD
ARE
30
146.8
4.949
0.7276
72.48
49.61
118.3
70.31
23.28
45
160.3
4.934
0.6617
89.51
56.95
153.31
79.74
26.31
60
175.1
4.061
0.7003
85.19
55.5
141.29
76
25
n-BET
Temp (°C)
QM,BET
KL,BET
KS
nBET
R2
χ2
RMSE
HYBRD
MPSD
ARE
30
73.5
2.484
0.8002
3.544
0.9806
6.58
13.24
6.81
21.41
4.46
45
42.3
2.913
0.685
6.205
0.9607
11.26
19.42
11.14
24.04
4.71
60
50.5
3.142
1.041
5.496
0.9877
2.21
11.23
2.22
7.58
0.75
Adsorbent
MG adsorption capacity (mg/g)
Ref
Glyricidia sepium woodchip
230.47
(Ahmad et al., 2020)
Pinus roxburghii cone
250
(Sharma et al., 2019)
Rice-bran
147.47
(Bhatti et al., 2017)
Luffa aegyptica peel
78.79
(Mashkoor and Nasar, 2019)
Rice husk
24.92
(Chowdhury et al., 2011)
Seed hull
8.40
(Mohammad et al., 2018)
Copperpod fruit shell
62.50
(Rangabhashiyam and Balasubramanian, 2018)
Date seed
158.98
(Al-Ahmary, 2013)
Solanum tuberosum
27.0–33.3
(Gupta et al., 2016)
Wood apple shell
34.56
(Sartape et al., 2014)
Annona squmosa seed
25.91
(Santhi et al., 2016)
GHBRAC
259.49
This study
Plots of separation factor, RL versus MG initial concentration at 30, 45 and 60 °C.
3.4 Adsorption kinetic
Table 5 summarizes the kinetic parameter values of the PFO, PSO, Elovich and Avrami models. The results revealed that the MG adsorption by GHBRAC followed the Avrami model, which recorded the highest values of R2 (0.969–0.999) and the lowest values of Δq (0.251–2.745). The calculated equilibrium adsorption capacity (Qe.cal, = 49.56, 99.17, 149.10, 197.80, 241.80, and 267.20 mg/g) agreed well with the experimental equilibrium adsorption capacity (Qe,exp, = 49.6, 99.61, 149.35, 199.12, 243.91, and 269.95 mg/g). This was followed by PFO model that gives reasonably high values of R2, which suggested a physisorption. The Elovich model show poor fitting with the lowest values of R2 (0.174–0.622) and highest values of Δq (6.307–11.535). This confirmed that Elovich model was not appropriate to describe the rate of MG adsorption, and the MG removal was not governed by chemisorption.
Parameter
Initial Concentration (mg/L)
50
100
150
200
250
300
PFO
k1 × 10-1 (1/min)
0.995
0.638
0.688
0.571
0.524
0.672
qe (mg/g)
49.50
99.08
148.00
196.30
240.50
265.50
R2
0.995
0.998
0.964
0.942
0.980
0.967
Δq (%)
0.525
0.520
2.529
4.318
2.815
2.453
PSO
k2 × 10-2 (g/mg min)
0.527
0.125
0.093
0.054
0.039
0.050
qe (mg/g)
50.48
102.50
152.80
203.70
250.50
274.50
R2
0.900
0.919
0.955
0.935
0.949
0.955
Δq (%)
2.334
4.189
2.436
3.586
3.616
2.555
ELOVICH
α × 105 (mg/g min)
11.460
3.686
9.718
1.296
0.453
10.990
β (g/mg)
0.380
0.174
0.120
0.078
0.059
0.065
R2
0.174
0.531
0.585
0.616
0.622
0.615
Δq (%)
6.307
10.824
8.192
9.804
11.535
8.361
AVRAMI
qe (mg/g)
49.56
99.17
149.10
197.80
241.80
267.20
nAV
0.870
0.955
0.714
0.735
0.819
0.746
kAV (1/min)
0.107
0.064
0.077
0.061
0.054
0.073
R2
0.999
0.999
0.993
0.969
0.990
0.988
Δq (%)
0.251
0.406
0.950
2.745
1.635
1.247
3.5 Thermodynamics
The thermodynamic parameters were determined separately for the first layer (monolayer) and subsequent layer (multilayer) using the values of n-BET constant KS and KL (Scheufele, 2016). As shown in Table 6, ΔG values were all negative, indicating that the adsorption of MG by GHBRAC was thermodynamically spontaneous. The multilayer ΔGL is greater than monolayer ΔGS, indicating a greater multilayer affinity towards MG-MG interactions rather than MG-GHBRAC interaction. The absolute values of ΔGL and ΔGS slightly increased as the temperatures of the adsorption conditions increased, indicating that the adsorption process was thermodynamically favorable at higher temperatures. The positive values of monolayer ΔHS and multilayer ΔHL revealed that each system experienced an endothermic process. The value of both monolayer ΔHS and multilayer ΔHL of less than 20 kJ/mol suggested the physisorption process. The positive value of ΔSS and ΔSL suggested that there was an increase in randomness at the solid/solution interface after dye adsorption onto adsorbent surfaces and implies that the adsorption process was energetically stable and spontaneous in nature (Bhatti et al., 2017).
Temperature (K)
ΔGS (kJ/mol)
ΔHS (kJ/mol)
ΔSS (J/K.mol)
ΔGL (kJ/mol)
ΔHL (kJ/mol)
ΔSL (J/K.mol)
303.15
−34.068
7.105
135.044
−36.919
318.15
−35.342
−39.171
6.655
143.832
333.15
−38.168
−41.227
3.6 Adsorption mechanism
The adsorption mechanism of MG onto GHBRAC can be discussed by two different processes, which are monolayer adsorption on the first layer and multilayer adsorption on the subsequent layers. The monolayer adsorption involved the interaction of MG and GHBRAC as shown in Fig. 10 (a). The possible interactions include i) electrostatic interactions between the deprotonated carboxylic groups on the GHBRAC surface (when pH > pHPZC) and the positively charged MG cations; ii) H-bonding between the carboxyl groups or hydroxyl groups (H-bond donors) of the GHBRAC and H-bond acceptor in MG; as well as H-bonding between hydroxyl group in MG and carbonyl group (H-bond acceptor) of the GHBRAC and iii) π- π interaction between aromatic groups in GHBRAC surfaces and MG molecules. The multilayer adsorption steps shown in Fig. 10 (b) indicates the interaction between MG-MG molecules which involved i) π-π interactions between the MG-MG aromatic rings and ii) H-bonding between H-bond donor and H-bond acceptor in hydroxyl groups of MG-MG molecules.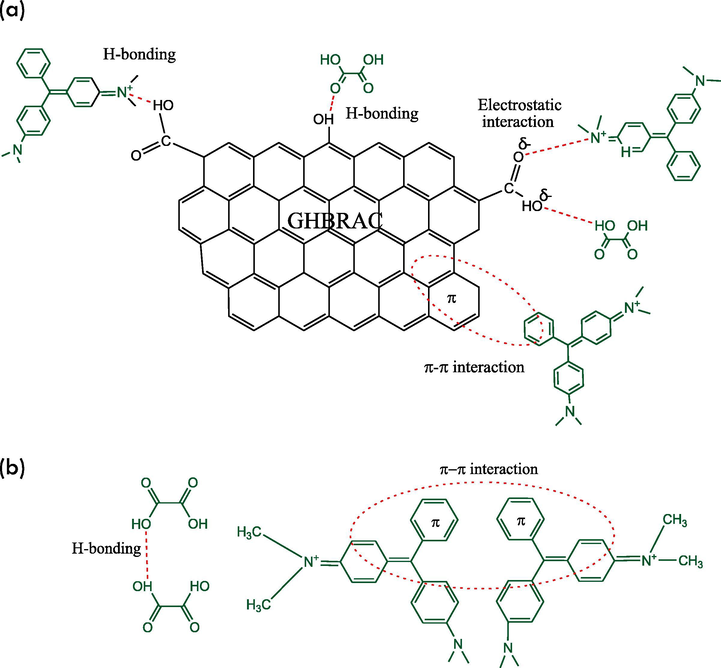
MG adsorption mechanism (a) MG-GHBRAC interaction, (b) MG-MG interaction.
3.7 Fixed-bed column adsorption
Table 7 indicates the column parameters for MG adsorption by GHBRAC at 30 °C. It was found that an increase in the MG initial concentration resulted in a decrease in the breakthrough time (tb), exhaustion time (te). Increasing MG initial concentration resulted to an increase in mass transfer driving force across the liquid film which accelerated the adsorption rate and led to earlier tb and te. The tb and te also declined from 190.1 to 32.0 h, and 109.0 to 11.0 h, respectively as the influent flow rate increased from 0.5 to 2.0 mL/min. These was due to insufficient residence time between the surface of adsorbate and adsorbent at higher flow rate, and thus limiting the diffusion of the solute into the pores of the adsorbent (Kumari and Dey, 2019). In contrast, the tb and te increase as the bed depth was raised from 1 to 3 cm. This was due to the longer distance of the mass transfer zone established by the 3 cm adsorbent bed. The residence time of the MG ions in the adsorbent increased and hence longer contact time facilitated better adsorption (Alardhi et al., 2020).
Q (mL/min)
C0 (mg/L)
H (cm)
Breakthrough time, tb (hr)
Exhaustion time, te (hr)
qbed (mg/g)
1.0
200
2
3.0
54.2
386.35
1.0
150
2
18.6
61.5
378.25
1.0
100
2
41.2
69.2
311.68
2.0
100
2
11.0
32.0
260.63
0.5
100
2
109.0
190.1
460.40
0.5
100
1
83.0
131.5
404.37
0.5
100
3
161.0
235.0
463.04
The breakthrough data were fitted using Thomas, Bohart–Adams, Yoon–Nelson and Yan models as shown in Table 8. Thomas model is one of the most widely used for estimating column performance. This model assumes that film diffusion controls the adsorption process and neglects axial dispersion (Sotelo et al., 2012). A simpler model was developed by Yan et al (Yan et al., 2001), which also predicted the maximum uptake capacity, similar to Thomas model. Yoon-Nelson (Sotelo et al., 2012; Yoon and Nelson, 1984) suggested that the rate of decrease in the probability for adsorption is proportional to its probability for adsorption and breakthrough, which can be observed from the changes in breakthrough concentration over time. Meanwhile, Bohart-Adams assumed that the adsorption reaction is not instantaneous, where the rate of adsorption is proportional to both the remaining sorption capacity of adsorbent and the concentration of the adsorbate (Bohart and Adams, 1920). The results demonstrated that Thomas, Yoon–Nelson and Yan models predicted the breakthrough curves better than the Bohart–Adams model based on their high values of regression coefficients (R2). In addition, the close values of maximum bed capacity (both Thomas and Yan models), and time required for 50% MG breakthrough (τ) (Yoon-Nelson) to the experimental data confirmed the validity of these model for MG adsorption. This result was in agreement with Khadhri et al. (2019), Nath et al. (2016) and Singh et al. (2015).
Model
Parameter
Flow rate (mL/min)
0.5
1
2
Thomas
kTH (mL/mg.hr)
1.819
2.137
3.463
qTH (mg/g)
483.2
320
284.5
R2
0.9828
0.9941
0.9844
Yoon-Nelson
kYN (1/hr)
0.1783
0.1906
0.4161
τ (hr)
177
59.12
26.51
R2
0.9810
0.9993
0.9829
Bohart–Adams
kBA × 10-4 (L/mg.hr)
4.784
7.56
9.504
N0 × 103 (mg/L)
188.8
139.2
136.7
R2
0.9852
0.9560
0.9515
Yan
qY (mg/g)
483
317.4
285.1
αY
33.59
12.48
10.44
R2
0.9817
0.9909
0.9784
3.8 Economic evaluation of GHBRAC
The production cost was calculated based on expenditures related to transportation, chemicals, and utilities. For producing 1 kg of GHBRAC, 1.14 kg of GHBR, 2 kg of KOH and 1.5 L of CO2 were used. The total GHBRAC production cost was 0.23 USD/kg, which was substantially lower than the AC market price as shown in Table 9. This suggests the feasibility of GHBRAC for commercialization.
Feedstock
Production cost (USD/kg)
Reference
GHBRAC
0.23
This study
Glyricidia sepium
0.54
(Ahmad et al., 2020)
Artocarpus integer
0.18–0.20
(Selvaraju and Bakar, 2017)
Orange peel
1.67
(Lam, 2017)
Banana peel
0.9
(Liew, 2018)
Empty fruit bunches
0.22
(Ahmad et al., 2020)
Commercial AC (Charcoal)
1.72–3.84
(Stavropoulos and Zabaniotou, 2009)
Commercial AC (Wood)
1.54
Commercial AC (Pet coke)
5.76
4 Conclusion
The GHBRAC which was prepared at a radiation power, time, and IR of 616 W, 1 min, and 2.0, respectively, possessed excellent characteristics to be used as MG adsorbent due to high SBET (477.74 m2/g) and TPV (0.273 cm3/g). The nitrogen adsorption-desorption data revealed that GHBRAC followed a combination of type I&II isotherm with H4 loop, suggesting the presence of micropores and mesopores. The MG adsorption onto GHBRAC followed n-BET isotherm model suggesting that the adsorption process involved monolayer and multilayer with limited number of layers, n. The n-BET model revealed that maximum monolayer adsorption capacity, Qm,BET and isotherm saturation capacity, Qe,calc were 73.5 and 259.49 mg/g, respectively. Kinetics study discovered that the MG adsorption best fitted to Avrami kinetic model. The Thomas, Yoon-Nelson and Yan were the best models to describe the MG adsorption in fixed-bed columns. The adsorption mechanisms involved are pore filling, hydrogen bonding, π-π interactions and electrostatic attraction. From the thermodynamic data, the MG adsorption involved physisorption. The estimated production costs were very low compared to commercial AC indicating its commercial feasibility.
Acknowledgments
The authors thankfully acknowledge the support obtained from the National Hydraulic Research Institute of Malaysia (NAHRIM), Universiti Sains Malaysia (304/PJKI- MIA/6050434/I136), and Universiti Malaysia Perlis (UniMAP) in the form of sponsorship and facilities.
Declaration of Competing Interest
The authors declare that they have no known competing financial interests or personal relationships that could have appeared to influence the work reported in this paper.
References
- Honeycomb-like porous-activated carbon derived from gasification waste for malachite green adsorption: equilibrium, kinetic, thermodynamic and fixed-bed column analysis. Desalin. Water Treat.. 2020;196:329-347.
- [Google Scholar]
- Atenolol sequestration using activated carbon derived from gasified Glyricidia sepium. Arab. J. Chem.. 2020;13(10):7544-7557.
- [Google Scholar]
- Adsorption of basic green 4 onto gasified Glyricidia sepium woodchip based activated carbon: Optimization, characterization, batch and column study. Arab. J. Chem.. 2020;13(8):6887-6903.
- [Google Scholar]
- Adsorption behavior of salicylic acid on biochar as derived from the thermal pyrolysis of barley straws. J. Clean. Prod.. 2018;195:1162-1169.
- [Google Scholar]
- Kinetics and thermodynamic study of malachite green adsorption on seeds of dates. Int. J. Basic Appl. Sci.. 2013;2(1):27-37.
- [Google Scholar]
- Adsorption of the methyl green dye pollutant from aqueous solution using mesoporous materials MCM-41 in a fixed-bed column. Heliyon. 2020;6(1):e03253
- [Google Scholar]
- Adsorption of malachite green dye on microwave and chemically treated Casuarina Equisetifolia seeds as an eco-friendly adsorbent. Adv. Environ. Biol.. 2015;9(927):216-223.
- [Google Scholar]
- A review on synthesis and characterization of biomass-derived carbons for adsorption of emerging contaminants from water. J. Carbon Res.. 2018;4(September)
- [Google Scholar]
- Rhodamine B dye sequestration using Gmelina aborea leaf powder. Heliyon. 2020;6(1):e02872
- [Google Scholar]
- Adsorptive behavior of rice bran-based composites for malachite green dye: Isotherm, kinetic and thermodynamic studies. J. Mol. Liq.. 2017;237:322-333.
- [Google Scholar]
- Carbon balance of rubber (Hevea brasiliensis) plantations : A review of uncertainties at plot, landscape and production level. Agric. Ecosyst. Environ.. 2016;221:8-19.
- [Google Scholar]
- Some aspects of the behavior of charcoal with respect to chlorine. J. Am. Chem. Soc.. 1920;42(3):523-544.
- [Google Scholar]
- Adsorptive removal of malachite green from aqueous solutions by almond gum: Kinetic study and equilibrium iesotherms. Int. J. Biol. Macromol.. 2017;105:56-65.
- [Google Scholar]
- On the preparation and characterization of activated carbon from mangosteen shell. J. Taiwan Inst. Chem. Eng.. 2011;42(5):837-842.
- [Google Scholar]
- Activated biochar derived from Opuntia ficus-indica for the efficient adsorption of malachite green dye, Cu+2 and Ni+2 from water. J. Hazard. Mater. (February) p. 122441
- [Google Scholar]
- Adsorption thermodynamics, kinetics and isosteric heat of adsorption of malachite green onto chemically modified rice husk. Desalination. 2011;265(1–3):159-168.
- [Google Scholar]
- Water remediation using low cost adsorbent walnut shell for removal of malachite green: Equilibrium, kinetics, thermodynamic and regeneration studies. J. Environ. Chem. Eng.. 2014;2(3):1434-1444.
- [Google Scholar]
- Microwave-assisted preparation of almond shell-based activated carbon for methylene blue adsorption. Green Process. Synth.. 2016;5(4):395-406.
- [Google Scholar]
- Sorptive removal of salicylic acid and ibuprofen from aqueous solutions using pine wood fast pyrolysis biochar. Chem. Eng. J.. 2015;265:219-227.
- [Google Scholar]
- Comparisons of porous, surface chemistry and adsorption properties of carbon derived from Enteromorpha prolifera activated by H4P2O7 and KOH. Chem. Eng. J.. 2013;232:582-590.
- [Google Scholar]
- Grand View Research, 2019. Activated carbon market size, share & trends analysis report by product (powdered, granular), by application (liquid, gas), by end use (water treatment, air purification), by region, and segment forecasts, 2019–2025. Mark. Res. Rep., p. 158.
- Application of potato (Solanum tuberosum) plant wastes for the removal of methylene blue and malachite green dye from aqueous solution. Arab. J. Chem.. 2016;9:S707-S716.
- [Google Scholar]
- An approach for the formulation of sustainable replanting policies in the Indonesian natural rubber industry. J. Clean. Prod.. 2019;241:118357
- [Google Scholar]
- Local, cheep and nontoxic activated carbon as efficient adsorbent for the simultaneous removal of cadmium ions and malachite green: Optimization by surface response methodology. J. Ind. Eng. Chem.. 2015;21:760-767.
- [Google Scholar]
- The effects of a microwave heating method on the production of activated carbon from agricultural waste: A review. J. Anal. Appl. Pyrolysis. 2013;100:1-11.
- [Google Scholar]
- Rubber tree (Hevea brasiliensis) biomass, nutrient content, and heating values in Southern Thailand. Forests. 2019;6381
- [Google Scholar]
- IMARC Group, 2017. Biomass gasification market: global industry trends, share, size, growth, opportunity and forecast 2018-2023. IMARC Group, United States. [Online]. Available: https://www.researchandmarkets.com/reports/4535020/biomass-gasification-market-global-industry.
- Potential efficacy of a mesoporous biosorbent Simarouba glauca seed shell powder for the removal of malachite green from aqueous solutions. Desalin. Water Treat.. 2016;57(24):11326-11336.
- [Google Scholar]
- Adsorption and desorption of cationic malachite green dye on cellulose nanofibril aerogels. Carbohydr. Polym.. 2017;173:286-294.
- [Google Scholar]
- Batch and continuous column adsorption of indigo carmine onto activated carbon derived from date palm petiole. J. Environ Chem. Eng.. 2019;7(1):102775
- [Google Scholar]
- Mesoporous activated carbon from Pentace species sawdust via microwave-induced KOH activation: Optimization and methylene blue adsorption. Res. Chem. Intermed.. 2018;44:5737-5757.
- [Google Scholar]
- A breakthrough column study for removal of malachite green using coco-peat. Int. J. Phytoremediation. 2019;21(12):1263-1271.
- [Google Scholar]
- Microwave-assisted pyrolysis with chemical activation, an innovative method to convert orange peel into activated carbon with improved properties as dye adsorbent. J. Clean. Prod.. 2017;162:1376-1387.
- [Google Scholar]
- Activated carbon for catalyst support from microwave pyrolysis of orange peel. Waste Biomass Valoriz.. 2017;8(6):2109-2119.
- [Google Scholar]
- Microwave pyrolysis with KOH/NaOH mixture activation: A new approach to produce micro-mesoporous activated carbon for textile dye adsorption. Bioresour. Technol.. 2018;266:1-10.
- [Google Scholar]
- A critical review of the estimation of the thermodynamic parameters on adsorption equilibria. Wrong use of equilibrium constant in the Van’t Hoof equation for calculation of thermodynamic parameters of adsorption. J. Mol. Liq.. 2019;273:425-434.
- [Google Scholar]
- Dye adsorption characteristic of ultrasound pre-treated pomelo peel. J. Environ. Chem. Eng.. 2018;6(2):3502-3509.
- [Google Scholar]
- Removal of malachite green dye from aqueous solutions onto microwave assisted zinc chloride chemical activated Epicarp of Ricinus communis. J. Water Resour. Prot.. 2013;05(02):222-238.
- [Google Scholar]
- Preparation, characterization and adsorption studies of the chemically modified Luffa aegyptica peel as a potential adsorbent for the removal of malachite green from aqueous solution. J. Mol. Liq.. 2019;274:315-327.
- [Google Scholar]
- Comparison of activated carbon and physic seed hull for the removal of malachite green dye from aqueous solution. Water. Air. Soil Pollut.. 2018;229(45):1-14.
- [Google Scholar]
- Mopoung, S., Moonsri, P., Palas, W., Khumpai, S., 2015. Characterization and properties of activated carbon prepared from tamarind seeds by KOH activation for Fe (III) adsorption from aqueous solution. 2015.
- Continuous removal of malachite green by calcium alginate immobilized Bacillus cereus M116 in packed bed column. Environ. Technol. Innov.. 2016;6:132-140.
- [Google Scholar]
- Removal of malachite green from aqueous solution using pulverized teak leaf litter: equilibrium, kinetic and thermodynamic studies. Chem. Cent. J.. 2018;12(1):1-10.
- [Google Scholar]
- Utilization of Cocoa Peel as biosorbent for oil and color removal in Palm Oil Mill Effluent (POME) IOP Conf. Ser. Mater. Sci. Eng.. 2018;300(1)
- [Google Scholar]
- OPAC (orange peel activated carbon) derived from waste orange peel for the adsorption of chlorophenoxyacetic acid herbicides from water: Adsorption isotherm, kinetic modelling and thermodynamic studies. Bioresour. Technol.. 2018;261:329-341.
- [Google Scholar]
- Greenhouse gas emissions and carbon stock changes in rubber tree plantations in Thailand from 1990 to 2004. J. Clean. Prod.. 2013;52:61-70.
- [Google Scholar]
- Applications of nanotechnology in water and wastewater treatment. Water Res.. 2013;47(12):3931-3946.
- [Google Scholar]
- R. and Data, 2020. Natural rubber market size, share and industry analysis by product type (RSS Grade, Latex Concentrate, Solid Block), by distribution channel (Online, Offline), by applications (Automobiles, Gloves, Footwear, Belting & Hose) and region, segment forecasts T.
- Bioresource technology reports performance of novel biosorbents prepared using native and NaOH treated Peltophorum pterocarpum fruit shells for the removal of malachite green. Bioresour. Technol. Reports. 2018;3:75-81.
- [Google Scholar]
- A review on recent technological advancement in the activated carbon production from oil palm wastes. Chem. Eng. J.. 2017;314:277-290.
- [Google Scholar]
- Adsorption thermodynamics of cationic dyes (methylene blue and crystal violet) to a natural clay mineral from aqueous solution between 293.15 and 323.15 K. Arab. J. Chem.. 2018;11(5):615-623.
- [Google Scholar]
- Adsorptive efficacy analysis of lignocellulosic waste carbonaceous adsorbents toward different. Process Saf. Environ. Prot.. 2015;96:33-42.
- [Google Scholar]
- Valorisation of waste rice straw for the production of highly effective carbon based adsorbents for dyes removal. J. Clean. Prod.. 2018;172
- [Google Scholar]
- A new alternative adsorbent for the removal of cationic dyes from aqueous solution. Arab. J. Chem.. 2016;9:S466-S474.
- [Google Scholar]
- Removal of malachite green dye from aqueous solution with adsorption technique using Limonia acidissima (wood apple) shell as low cost adsorbent. Arab. J. Chem. 2014:S3229-S3238.
- [Google Scholar]
- Activated carbon obtained from the cotton processing wastes. Diam. Relat. Mater.. 2019;91:90-97.
- [Google Scholar]
- Monolayer-multilayer adsorption phenomenological model: Kinetics, equilibrium and thermodynamics. Chem. Eng. J.. 2016;284:1328-1341.
- [Google Scholar]
- Production of a new industrially viable green-activated carbon from Artocarpus integer fruit processing waste and evaluation of its chemical, morphological and adsorption properties. J. Clean. Prod.. 2017;141:989-999.
- [Google Scholar]
- Honeycomb structured activated carbon synthesized from Pinus roxburghii cone as effective bioadsorbent for toxic malachite green dye. J. Water Process Eng.. 2019;32(August)
- [Google Scholar]
- Fixed bed column study and adsorption modelling on the adsorption of malachite green dye from wastewater using acid activated sawdust. Int. J. Adv. Res.. 2015;3(7):521-529.
- [Google Scholar]
- Review article A review on feedstocks, production processes, and yield for different generations of biodiesel. Fuel. 2020;262(November 2019) p. 116553
- [Google Scholar]
- Facile one-pot synthesis of thiol-functionalized mesoporous silica submicrospheres for Tl(I) adsorption: Isotherm, kinetic and thermodynamic studies. J. Hazard. Mater.. 2019;371(October 2018):146-155.
- [Google Scholar]
- High capacity adsorption of malachite green in a mesoporous tyre-derived activated carbon. Asia-Pacific J. Chem. Eng.. 2013;8:172-177.
- [Google Scholar]
- Modeling and elimination of atenolol on granular activated carbon in fixed bed column. Int. J. Environ. Res.. 2012;6(4):961-968.
- [Google Scholar]
- Minimizing activated carbons production cost. Fuel Process. Technol.. 2009;90(7–8):952-957.
- [Google Scholar]
- Micro-mesoporous carbon from cotton waste activated by FeCl3/ZnCl2: Preparation, optimization, characterization and adsorption of methylene blue and eriochrome black T. J. Solid State Chem.. 2019;269:580-587.
- [Google Scholar]
- Characteristics and mechanisms of cadmium adsorption onto biogenic aragonite shells-derived biosorbent: Batch and column studies. J. Environ. Manage.. 2019;241(April 2018):535-548.
- [Google Scholar]
- Recent advances in applications of activated carbon from biowaste for wastewater treatment: A short review. J. Clean. Prod.. 2018;175:361-375.
- [Google Scholar]
- Dye and its removal from aqueous solution by adsorption : A review. Adv. Colloid Interface Sci.. 2014;209:172-184.
- [Google Scholar]
- A new model for heavy metal removal in a biosorption column. Adsorpt. Sci. Technol.. 2001;19(1):25-43.
- [Google Scholar]
- Adsorption behavior of modified Glossogyne tenuifolia leaves as a potential biosorbent for the removal of dyes. J. Mol. Liq.. 2018;252:289-295.
- [Google Scholar]
- Development of high surface area mesoporous activated carbons from herb residues. Chem. Eng. J.. 2011;167(1):148-154.
- [Google Scholar]
- Application of gas adsorption kinetics I. A theoretical model for respirator cartridge service life. Am. Ind. Hyg. Assoc. J.. 1984;45(8):509-516.
- [Google Scholar]
- Highly effective removal of malachite green from aqueous solution by hydrochar derived from phycocyanin-extracted algal bloom residues through hydrothermal carbonization. RSC Adv.. 2017;7(10):5790-5799.
- [Google Scholar]
- Utilization of Crofton weed for preparation of activated carbon by microwave induced CO2 activation. Chem. Eng. Process. Process Intensif.. 2014;82:1-8.
- [Google Scholar]
Appendix A
Supplementary material
Supplementary data to this article can be found online at https://doi.org/10.1016/j.arabjc.2021.103104.
Appendix A
Supplementary material
The following are the Supplementary data to this article:


