

Translate this page into:
Alteration of Tecoma chip wood waste into microwave-irradiated activated carbon for amoxicillin removal: Optimization and batch studies
⁎Corresponding author. chazmier@usm.my (Mohd Azmier Ahmad)
-
Received: ,
Accepted: ,
This article was originally published by Elsevier and was migrated to Scientific Scholar after the change of Publisher.
Peer review under responsibility of King Saud University. Production and hosting by Elsevier.
Abstract
Amoxicillin (AMOX) in wastewater can promote antibiotic resistance in bacteria and affecting aquatic ecosystems, due to inadequate removal by conventional wastewater treatment plants. This study aimed to (i) optimizing Tecoma chip wood based activated carbon (TCAC) to adsorb amoxicillin (AMOX) using response surface methodology (RSM) and (ii) evaluating AMOX adsorption through batch and continuous modes. The RSM revealed the optimum conditions to be 657 W, 20 min and 0.99 g/g for radiation power, radiation time and impregnation ratio (IR), respectively. These optimum conditions resulted in AMOX removal efficiency of 88.07 mg/g and 27.68 % of TCAC’s yield. The BET surface area and total pore volume of TCAC were 924.85 m2/g and 0.3485 cm3/g respectively. The surface of TCAC was occupied with several functional groups namely primary amine, hydroxy, alkyl carbonate and terminal alkyne. These functional groups enhanced the adsorption process by forming hydrogen bond with AMOX molecules. The isotherm study revealed that AMOX-TCAC adsorption system obeyed the Langmuir model and the maximum monolayer adsorption capacity, Qm is 357.14 mg/g. Pseudo-second order (PSO) model fitted the best for the adsorption of AMOX by TCAC in the kinetic studies. Boyd plot divulged that the rate limiting step in the adsorption process was the film diffusion. Thermodynamic study confirmed the adsorption process to be endothermic, spontaneous and controlled by physisorption. In bed column studies, the percentage removal of adsorbates was found to increase when the adsorbates flowrate decreased, adsorbates initial concentration decreased, and bed height increased. For the breakthrough curve model, the adsorption is best fitted to Yoon Nelson model. TCAC demonstrated its efficacy in the removal of AMOX, proving successful in both batch mode and continuous mode operations. These findings suggest the potential for scaling up TCAC production for industrial purposes, indicating its suitability for larger-scale applications.
Keywords
Activated carbon
Adsorption process
Response surface methodology
Amoxicillin
Bed column
Mechanism

1 Introduction
Emerging pollutant such as antibiotics have been detected in the water bodies which given threat to the environment. The government stakeholders and related agencies need to confront these issues for better water resources management for future. Antibiotics from pharmaceutical products is one of the numerous pollutants that have been detected in different water systems (A et al., 2021). Many researchers have indicated that most antibiotics were very difficult to be adsorbed by living organisms. Poorly treated effluent discharges from the wastewater treatments was one of the factors that lead to the accumulation of antibiotics pollutant in the water bodies (Lien et al., 2016). Antibiotic toxicity significantly impacted the water ecosystem, jeopardizing aquatic life survival. There are many advantages of antibiotics and one of them is being used as drugs to treat bacterial infections. Amoxicillin (AMOX) is widely used to treat bacterial infections inside nose, ear, throat and skin. Nowadays, AMOX is widely being found in the surface water, hospital disposal waste and effluent from wastewater treatment (Aryee et al., 2022). Many treatments such as adsorption, electro-degradation and oxidation were used for removing antibiotics from water bodies. The pharmaceutical remnant may travel into the aquatic environment and the food chain if wastewater treatment does not sufficiently remove them. Despite being polar, soluble in water, non-volatile, and non-biodegradable, a lot of medications frequently evade in sewage water treatment facilities especially, biological treatment which later contaminates the environment (Kumar and Pal, 2018).
The best way to remove the pollutants such as antibiotics is by using the activated carbon (AC) which can be produced from agricultural wastes. In literature, various biomass waste was converted to AC through different methods. For instance, Zayed et al., (2023), Borghei et al., (2021) and (Ilnicka et al., 2020) produced AC from sugar beet leaves, oak seeds and Egyptian wood, respectively, via chemical activation. Lopes et al., (2021) produced AC from malt bagasse via physical activation. Firdaus et al., (2022) and Veerakumar et al., (2020) convert teak wood and paper flower, respectively, to AC via physicochemical activation. Ahmad et al., (2021) produced adsorbent from sludge biomass through continuously rotating carbonization process. Yusop et al., (2022a) and Yusop et al., (2022b) produced AC from coconut shell via single-stage microwave irradiation technique. AC derived from biomass wastes were proven to be excellent in adsorbing wide range of pollutants. For examples, the works on adsorption of crystal violet dye, Congo red dye and malachite green dye were done by Goswami and Kumar Dey (2022), (He et al., 2023) and (Yusop et al., 2021), respectively. Adsorption of heavy metals such as Cu(II) and Zn(II) was performed by Murtazaoğlu et al., (2023). Antibiotics adsorption namely metronidazole and tetracycline were carried out by Yurtay and Kılıç (2023) and Zhou et al., (2022), respectively. The adsorption of benzene compounds such as phenol, p-nitrophenol and toluene were investigated by Alam et al., (2023), Jović et al., (2020) and Xie et al., (2022), respectively. Koyuncu et al., (2022) utilized capsicum based AC to treat dyes, herbicide, diclofenac sodium drug, nitrate and heavy metals.
In this research, Tecoma chip wood, a waste from landscape was used to form into AC by implicating the microwave-irradiation technique. The process was enhanced with the chemical activation using potassium hydroxide (KOH) combined with gasification process using CO2 gas. The landscaping process uses wooden planters such as Tecoma. To the best concern of authors, this is the first study on the implementation of Tecoma chip wood-based AC (TCAC) which has been produced from the landscaping waste of Seberang Perai City Council Landscaping Depo. The TCAC was used to remove AMOX from water bodies, and it was prepared by using the optimum preparation conditions via the assist of response surface methodology (RSM). This is the best method to conserve the environment by using the principle of zero waste which reducing the volume of landscaping waste generated by using TCAC to adsorb the AMOX which being dumped directly to the final discharge as effluent from pharmaceutical industries.
In literature, works that related with antibiotics removal by AC were revolved around batch mode of adsorption only. The examples of these works were removal of AMOX by pomegranate peel based AC coated with zero-valent iron nanoparticles (AC-nZVI) (Ali et al., 2020), AMOX removal by durian shell based AC (Yazidi et al., 2020), AMOX removal by vegetal powdered based AC (Berges et al., 2021), removal of sulfamethoxazole by magnetic AC (Lv et al., 2023), removal of sulfamethoxazole, trimethoprim, and ciprofloxacin by brewery residues based AC (Sousa et al., 2023) and removal of tetracycline, penicillin and erythromycin by Sargassum sp. magentic based AC (Francoeur et al., 2023). Though batch mode can be a valuable approach for certain adsorption applications, particularly in small-scale or laboratory settings where simplicity and flexibility are desired, it has several limitations. These limitations include (i) inefficient use of adsorbent since the adsorbent is often used in excess to ensure that sufficient adsorption occurs during the batch process, (ii) lack of process control since batch mode does not offer real-time control over the adsorption process and (iii) variability in adsorbate concentration over time as the adsorption process occurs, which can affect the accuracy and reproducibility of the experimental results. As one of the novelties, besides batch mode, this study also explores the adsorption of AMOX by TCAC through continuous mode. The findings in continuous mode are important for scaling up purpose from laboratory scale to industry scale. Furthermore, the possible interaction mechanism between AMOX molecules and the functional groups in TCAC was also provided in this study. Rodrigues et al. (2020) found that olive biomass-based AC with plenty of oxygenated groups was helpful for fast adsorption of AMOX. Hashemzadeh et al. (2022) found that the mechanism for AMOX adsorption by aloe vera leaf based AC is mainly due to external mass transfer. The interaction mechanism between the adsorbent and adsorbate provides insights into the fundamental behaviour of the adsorption process. By understanding the interaction mechanism, researchers can better design and optimize adsorption systems for specific applications.
2 Materials and methods
2.1 Materials
The Tecoma wood chip was obtained from Seberang Perai City Council Landscaping Depo in Permatang Tengah, Seberang Perai Utara, Malaysia. Chemicals of KOH pellet (85%) and HCl (37% assay) were purchased from Sigma-Aldrich. The AMOX in a powder form was supplied by Y.S.P Industries, Malaysia. Nitrogen gas (N2) and carbon dioxide gas (CO2) of 99.99 % purity were acquired from MOX Gases Berhad, Malaysia.
2.2 TCAC preparation
Tecoma chip (precursor) was rinsed with distilled water before being oven-dried for about 48 h. The precursor was converted to char through carbonization process at 550 °C for 1 h under the flow of N2 gas at 150 cm3/min. The resulted char was impregnated with KOH for chemical activation at different the impregnation ratio (IR). IR was calculated using Eq. (1).
where WKOH is the mass of KOH and Wchar is the mass of the char.
Firstly, 250 mL of deionized water was used to dissolve KOH in a beaker. Then, the precursor was inserted inside the beaker to mix it with KOH. After that, the beaker was kept in an oven at 110 °C for 24 h for impregnation process to take place. Impregnated char was activated by using CO2 gasification which was being heated in microwave (EMM2001W, Sweden). The samples were activated at various radiation power (365 – 735 W) and radiation time (4 – 25 min), under the flow of CO2 at 150 cm3/min. The resulted samples were washed with deionized water and HCl solution until the pH achieve between 6.5 and 7.5. The value of pH was determined by using a pH probe (Delta 320, Mettler Toledo, China). Finally, the samples were dried in an oven for 24 h with the temperature of 110 °C. The yield of samples (TCAC) is determined from Eq. (2):
where Wf is the dried TCAC mass, and Wi is the precursor dried mass.
2.3 Characterization methods
The characteristics of the TCAC were studied based on the surface area (BET and mesopores), pore size and pore volume, which conducted by utilizing Micromeritics volumetric adsorption analyser (ASAP 2010). Secondly, elemental analysis was obtained from Perkin Elmer Series II 2400, USA using the technique of Inductively Coupled Plasma-Optical Emission Spectroscopy (ICP-OES). Thirdly, surface morphology in terms of SEM image was acquired from scanning electron microscopy (SEM) (Quanta 450 FEG, Netherland). Last but not least, surface chemistry in terms of FTIR spectrum was gained from Fourier transforms infrared spectroscopy (FTIR) (Shidmazu Prestige 21, Japan).
2.4 Experimental design
The RSM was utilized to provide the optimum preparation conditions for TCAC. Design Expert (STAT-EASE Inc. Minneapolis, USA) is a software that was employed to evaluate the experimental data. The preparation conditions were investigated by using the central composite design (CCD). The variables selected were radiation power (X1), radiation time (X2) and IR (X3), whilst the responses studied were AMOX uptakes (Y1) and TCAC’s yield (Y2).
2.5 Study of equilibrium and isotherm
Equilibrium study investigated AMOX uptake under three effects: AMOX initial concentration, solution temperature, and solution pH. To study the effect of AMOX initial concentration, 6 different initial concentrations of 25, 50, 100, 200, 250, and 300 mg/L were prepared in Erlenmeyer flasks each. These ranges of AMOX initial concentration were selected based on the ranges used in previous studies (Mohammed et al., 2020); (Yazidi et al., 2020). These flasks were assembled in a water bath shaker with rotation speed of 80 rpm. The volume of solution, TCAC weight and solution temperature were fixed at 200 mL, 0.20 g and 30 °C, respectively, whilst the solution pH is not altered. To study the effect of solution temperature, AMOX solution with initial concentration of 300 mg/L was used at three different temperature (30, 45 and 60 °C), whilst other parameters remained the same. To study the effect of solution pH, AMOX solution with initial concentration of 100 mg/L were utilized at 6 different solution pH (2, 4, 6, 8, 10 and 12), whilst other parameters remained the same. The pH of AMOX solution was altered using 0.1 M HCl and/or 0.1 M NaOH. The solution pH was measured using pH meter (Model Delta 320, Mettler Toledo, China). After 24 h, the adsorbate solution was measured through a UV–Vis spectrophotometer (Agilent Cary 60, USA) at a maximum wavelength of 295 nm. The calibration curve for AMOX is provided in supplementary material 1. Eqs. (3) and (4) are used to calculate the AMOX uptakes and percentage removal, respectively:
where qe is the AMOX adsorption uptakes at equilibrium (mg/g), Co denotes as concentration of AMOX at initial (mg/L), Ce stands for the concentration of AMOX at equilibrium (mg/L), W indicates the weight of TCAC (g) and V is the volume of AMOX solution (mL). In isotherm study, Langmuir, Freundlich and Temkin models were utilized, and their equations are given by Eqs. (5), (6) and (7), respectively:
Langmuir (Langmuir, 1918):
Freundlich (Freundlich, 1906):
Temkin (Temkin and Pyzhev, 1940):
where Qm is the Langmuir adsorption uptakes (mg/g), KL is the constant of Langmuir which relates to the adsorption capacity (mg/g), KF stands for Freundlich constant ((mg/g)(L/mg)1/n). nF (dimensionless) shows to the ferocity of the surface heterogeneity. A and B refer to the Temkin constants.
2.6 Study of kinetic
The kinetic study was performed with a similar procedure as in equilibrium study. However, the AMOX concentration was determined within the pre-determined time interval. Six AMOX solutions (25 – 300 mg/L), 0.20 g of TCAC weight, 30 °C of solution temperature, original pH solution and rotation speed of 80 rpm were applied. The kinetic data were fitted on 3 models namely pseudo-first order (PFO), pseudo-second order (PSO) and Boyd plot. Their equations are given by Eqs. (8), (9) and (10), respectively:
Pseudo-first order (PFO) (Langergren, 1898)
Pseudo-second order (PSO) (Ho and McKay, 1998):
Boyd plot (Boyd et al., 1947):
where k1 and k2 are the PFO and PSO rate constant, respectively and Bt denoted as Boyd number. Besides correlation coefficient, R2, root mean square error (RMSE) was used to find the best model describing the adsorption data. The RMSE is calculated using Eq. (11):
where n refers to the number of points.
2.7 Study of thermodynamic
Thermodynamic study was executed to understand the variation in adsorption process under the influence of different solution temperature. Change of enthalpy, ΔH° (kJ/mol) and change of entropy, ΔS° (kJ/mol.K) can be computed using Vant Hoff equation (Achmad et al., 2012) given by Eq. (12):
where R implies the gas constant (8.314 J/mol.K), T denoted as absolute temperature (K) and Kc represents the dimensionless equilibrium constant. Kc can be computed using Eq. (13) (Lima et al., 2019):
where [adsorbate]° denotes the standard concentration which can be assumed as 1 mol/L at standard state, ϒ denotes the activity coefficient of adsorbate (dimensionless) whilst KL denotes the adsorption constant obtained from the Langmuir model (L/mg). The other two thermodynamic parameters of ΔG° and Ea can be calculated by using the following equations, respectively: The [adsorbate]° value can be considered as 1 mol/L under the standard state, and the activity coefficient of the adsorbate is denoted by ϒ, which is dimensionless. KL (L/mg) represents the adsorption constant derived from the Langmuir model. The two remaining thermodynamic parameters, ΔG° (kJ/mol) and Ea (kJ/mol) can be determined using Eqs. (14) and (15), respectively:
where k2 implies the rate constant acquired from PSO model and A stands for Arrhenius factor.
2.8 Adsorption in bed column
In bed column adsorption, the performance for the TCAC towards AMOX adsorption was studied under the effects of (i) AMOX initial concentrations (50, 100 and 200 mg/L), (ii) inlet flow rate (10, 20 and 30 mL/min) and (iii) bed height (40, 60 and 80 mm). The bed column experiment was performed using a Perspex filter column (2.50 cm internal diameter). A peristaltic pump was utilised to pump the AMOX solution from the inlet point to the outlet point. Breakthrough curves were plotted, and the breakthrough time (Tb) and exhaustion time (Tex) were calculated. Tb was evaluated at the point of 0.10 Ct/Co whilst Tex was determined at the point of 90 % of Ct/Co.
3 Results and discussions
3.1 Study of optimization
3.1.1 Development of the regression model
A full design matrix for the TCAC’s preparing conditions is given in Table 1. Both responses of AMOX uptakes and TCAC’s yield were best described by the quadratic model. The finalized form of empirical models of these equations in terms of coded factors are expressed in Eqs. (16) and (17), respectively:
Run
TWAC’s preparation variables
Responses
Radiation power, X1 (W)
Radiation time, X2 (min)
IR, X3
(g/g)
AMOX uptakes, Y1 (mg/g)
TWAC’s yield,
Y2 (%)
1
550.00 (0)
12.00 (0)
0.33 (-1.68)
73.33
31.42
2
440.00 (-1)
20.00 (+1)
0.50 (-1)
78.06
30.97
3
440.00 (-1)
4.00 (-1)
1.00 (+1)
78.22
31.04
4
550.00 (0)
12.00 (0)
0.75 (0)
79.31
28.33
5
440.00 (-1)
20.00 (+1)
1.00 (+1)
78.29
30.80
6
550.00 (0)
12.00 (0)
0.75 (0)
77.11
28.87
7
550.00 (0)
12.00 (0)
1.17 (+1.68)
81.46
30.56
8
735.00 (+1.68)
12.00 (0)
0.75 (0)
87.99
25.11
9
660.00 (+1)
4.00 (-1)
1.00 (+1)
84.66
29.58
10
550.00 (0)
12.00 (0)
0.75 (0)
76.35
27.55
11
550.00 (0)
0.00 (-1.68)
0.75 (0)
70.53
32.58
12
440.00 (-1)
4.00 (-1)
0.50 (-1)
72.43
31.79
13
550.00 (0)
25.45 (+1.68)
0.75 (0)
83.27
30.46
14
660.00 (+1)
4.00 (-1)
0.50 (-1)
75.83
30.26
15
660.00 (+1)
20.00 (+1)
0.50 (-1)
85.53
29.58
16
550.00 (0)
12.00 (0)
0.75 (0)
77.29
27.98
17
550.00 (0)
12.00 (0)
0.75 (0)
79.16
27.11
18
660.00 (+1)
20.00 (+1)
1.00 (+1)
88.02
29.13
19
365.00 (-1.68)
12.00 (0)
0.75 (0)
76.80
29.11
20
550.00 (0)
12.00 (0)
0.75 (0)
78.19
28.02
AMOX uptakes, Y1:
TCAC’s yield, Y2:
For the responses of AMOX uptakes and TCAC’s yield, their regression plots (predicted versus actual) are shown in Fig. 1(a) and (b), respectively. Both responses produced relatively high R2 (0.9576 and 0.9450), relatively high Adj-R2 (0.9194 and 0.8956) and relatively low S.D. (1.37 and 0.59), respectively, signifying good agreement between actual data and predicted data. The A.P. value for both responses are above 4, signifying the models developed were sufficient to explore the design space.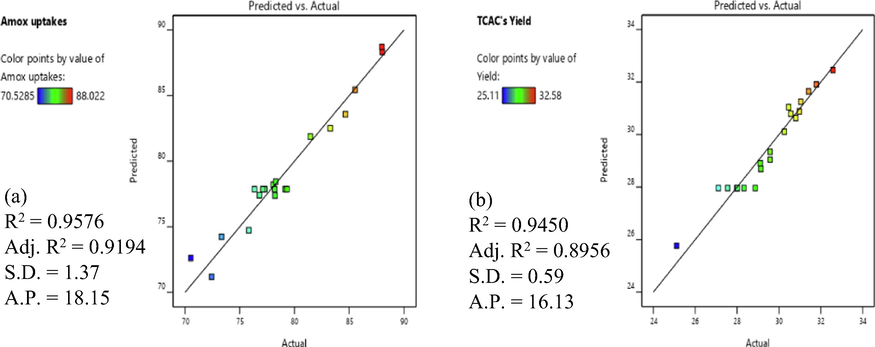
Plots of actual data versus predicted data for (a) AMOX uptakes and (b) TCAC’s yield responses.
Table 2 shows the optimum variables and responses for TCAC’s preparation. The optimum variables were 657 W (radiation power), 20 min (radiation time) and 0.99 g/g (IR). The optimum responses were 88.07 mg/g (AMOX uptakes) and 28.73% (TCAC’s yield). The percentage error for both responses were less than 5 %, indicating the models developed were excellent to predict the experimental data (Amdoun et al., 2018).
Variables
Responses
AMOX uptakes, Y1 (mg/g)
TCAC’s yield, Y2 (%)
Radiation power, X1 (W)
Radiation time, X2 (min)
IR, X3 (g/g)
Predicted
Actual
Error
Predicted
Actual
Error
657
20
0.99
88.07
84.06
4.77
28.73
27.68
3.79
3.1.2 Analysis of variance (ANOVA)
The purpose of analysis of variance (ANNOVA) is to verify the adequacy of the developed models. The ANOVA result for AMOX uptakes and TCAC’s yield are provided in Table 3 and 4, respectively. P-value below than 0.0050 indicates significant terms. Models for both responses were significant since P-value was less than 0.0001 and the model F-value was relatively high. For the AMOX uptakes response, the significant model terms were X1, X2, X3, X2X3 and X12. Based on F-value, AMOX uptakes response was significantly influenced by radiation power (82.66), followed by radiation time (63.45) and lastly, IR (37.77). For the TCAC’s yield response, the significant terms for this response were X1, X2, X22 and X32. Based on F-value, TCAC’s yield response was highly affected by radiation power (34.73), followed by radiation time (6.99) and IR (2.56). Similar findings were obtained in the works performed by Mohamad Yusop et al., (Mohamad Yusop et al., 2023) and Mohamad Yusop et al., (Mohamad Yusop et al., 2023) where both responses (adsorbate uptakes and AC’s yield) were influenced by radiation power the most. For all of the responses examined, the lack of fit test was not significant, indicating that the models adequately accounted for the data (Melliti et al., 2021).
Source
Sum of squares
df
Mean square
F-value
P-value
Model
420.62
9
46.74
25.08
< 0.00010
A-Power
154.05
1
154.05
82.66
< 0.00010
B-Time
118.25
1
118.25
63.45
< 0.00010
C-IR
70.39
1
70.39
37.77
0.00010
AB
6.80
1
6.80
3.65
0.085
AC
3.52
1
3.52
1.89
0.20
BC
17.71
1
17.71
9.51
0.012
A2
48.57
1
48.57
26.06
0.00050
B2
0.17
1
0.17
0.089
0.77
C2
0.066
1
0.066
0.036
0.85
Residual
18.64
10
1.86
Lack of fit
11.58
5
2.32
1.64
0.30
Pure error
7.06
5
1.41
Cor Total
439.25
19
Source
Sum of squares
df
Mean square
F-value
p-value
Model
59.20
9
6.58
19.10
< 0.00010
A-Power
11.96
1
11.96
34.73
0.00020
B-Time
2.41
1
2.41
6.99
0.025
C-IR
0.88
1
0.88
2.56
0.14
AB
0.00060
1
0.00060
0.0017
0.97
AC
0.0052
1
0.0052
0.015
0.90
BC
0.083
1
0.083
0.24
0.63
A2
0.70
1
0.70
2.04
0.18
B2
25.85
1
25.85
75.07
< 0.00010
C2
19.11
1
19.11
55.50
< 0.00010
Residual
3.44
10
0.34
Lack of fit
1.59
5
0.32
0.85
0.57
Pure error
1.86
5
0.37
Cor Total
62.64
19
3.1.3 3-dimensional (3D) surface plots
The effects of variables on responses studied can be visualized clearly through three-dimensional (3D) surface plot. Fig. 2 provides the 3D plot for AMOX uptakes for (a) effect of radiation power and radiation time and (b) effect of radiation time and IR, whilst Fig. 3 shows the 3D plot for TCAC’s yield for (a) effect of radiation power and radiation time and (b) radiation power and IR.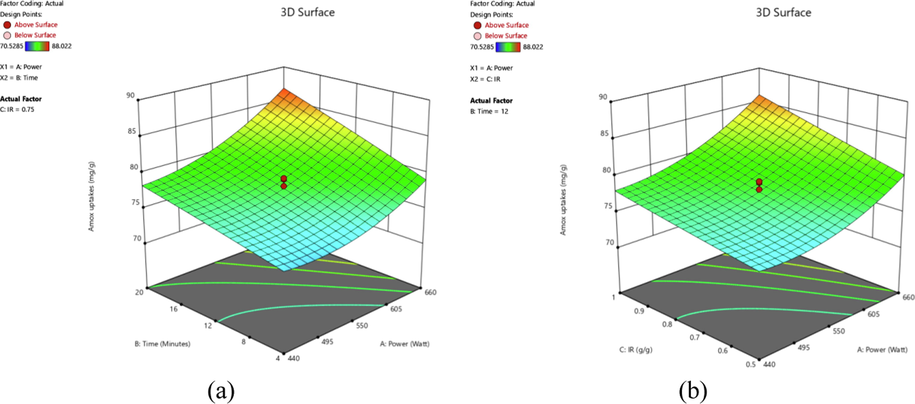
3D plots for AMOX uptakes response (a) radiation power versus radiation time (IR = 0.75 g/g) and (b) radiation power versus IR (radiation time = 12 min).
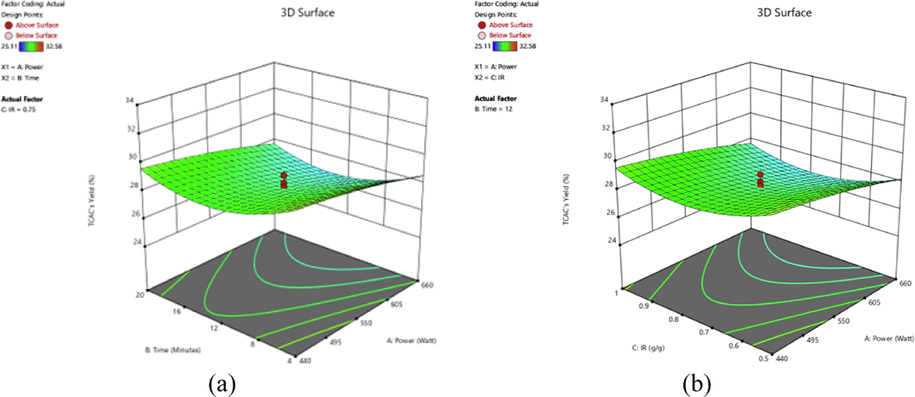
3D plots for TCAC’s yield response (a) radiation power versus radiation time (IR = 0.75 g/g) and (b) radiation power versus IR (radiation time = 12 min).
Based on Fig. 2(a), the highest AMOX uptakes of 88.02 mg/g occurred at radiation power of 660 W and radiation time of 20 min. On the other hand, the lowest uptakes of 70.53 mg/g for AMOX were obtained as the power of radiation and time of radiation were at the lowest value studied of 440 W and 0.50 g/g., respectively. These trends signified that these two variables showed positive effects on the uptakes of the AMOX. The positive effect of radiation power (or activation temperature) were showcased in the uptakes of methylene blue dye by durian seed based AC (Ahmad et al., 2017) and adsorption of sulfamethoxazole, trimethoprim and ciprofloxacin by spent brewery grains based AC (Sousa et al., 2022). When radiation power increased, more moisture and volatile matter evaporated, leaving the sample with more vacant spaces. These vacant spaces became pores which contribute to the adsorption process, increasing the uptakes of the AMOX. The positive effect of radiation time on adsorbate uptakes can be observed in the study performed by Firdaus et al., (Firdaus et al., 2022). When radiation time increased, the evaporation process was also increased, more moisture and volatile matter can be eliminated from the samples. As the consequences, more pores were produced, causing the uptakes of adsorbate became greater. Based on the Fig. 2(b), radiation power and IR showed positive effect on the uptakes of the adsorbate as well. Highest adsorbates uptake occurred at highest radiation power (660 W) and IR (1.00 g/g). The higher IR value, more metallic potassium ions had the ability to enter the skeletal matrix of samples, developing more pores. As the result, adsorption process enhanced and increasing the adsorption uptakes of the AMOX.
The variables studied were found to affect TCAC’s yield response differently. From Fig. 3(a), the highest yield of TCAC (32.58 %) occurred at the lowest radiation power (440 W) and radiation time (4 min). As the radiation power and radiation time increased, TCAC’s yield was found to be decreased. Similar finding was reported by Yirdaw et al., (Yirdaw et al., 2023) where the yield of Noug stalk based AC dropped as the activation temperature increased from 550 to 650 °C; and activation time increased from 105 min to 150 min. Another study performed by Mohamad Yusop et al., (Mohamad Yusop et al., 2023) found that the yield of jackfruit peel based AC decreased when activation temperature increased from 700 to 850 °C and activation time increased from 1 to 3 h. At higher radiation power (or activation temperature), more moisture and volatile materials evaporated, resulting in a decrease in TCAC weight. Based on Fig. 3(b), IR variable was also noted to pose a negative effect on TCAC’s yield response. At higher IR, more K+ ions penetrated the inner structure of samples. As the consequences, more vacant spaces or pores were developed, which reduce the weight of the sample.
3.2 Samples characteristics
Table 5 presents the surface area and pore characteristics of the samples. The precursor had low BET surface area (0.98 m2/g), mesopores surface area (0.0010 m2/g) and overall pore volume of 0.00010 cm3/g. The pore diameter in average for the precursor was found to be 1.48 nm, indicating micropores. After the carbonization and activation were completed, the BET surface area, mesopores surface area and total pore volume of TCAC were found to be increased significantly to 924.85 m2/g, 815.96 m2/g and 0.39 cm3/g, respectively. The average pore diameter for TCAC was found to be 2.42 nm which lies in the mesopores region.
Sample
BET surface area (m2/g)
Mesopores surface area (m2/g)
Total pore volume (cm3/g)
Average pore diameter (nm)
Precursor
0.98
0.00
0.00010
1.48
Char
406.52
337.85
0.19
1.75
TCAC
924.85
815.96
0.39
2.42
During carbonization process, water molecules and light volatile matter were evaporated from the samples, creating pores network on the sample. During chemical treatment with KOH, metallic potassium ions, K+ penetrate the skeleton matrix of sample, causing the development of more pores on the sample. Similar finding was observed in a study performed by Xue et al., (Xue et al., 2022). During microwave heating process with CO2 gasification, more moisture and heavy volatile matter including tar were removed from the sample through evaporation process. The samples became more porous and had higher surface area. CO2 gas molecules bombarded the pores in the sample, widening the average pore diameter from micropores region to mesopores region (Aziz et al., 2021). The chemical reaction that took place are as follows (Norouzi et al., 2018); (Xu et al., 2019):
Table 6 presents the proximate and elemental analysis of the samples. The elemental C for precursor was found to be 41.45 % and this value was considered relatively high. After carbonization and activation process were completed, the percentage of C element in TCAC rose significantly to 80.12 %. Conversely, other elements such as H, S and N + O undergone reduction from 10.11 to 7.33 %, from 0.12 to 0.07 % and from 48.32 to 12.48 % respectively. Proximate analysis revealed the moisture and volatile matter reduced extremely from 13.05 to 3.25 % and from 58.22 to 16.25 %, respectively. This reduction occurred since carbonization and activation processes were effective for removing the water molecules and volatile matter components such as lignin, cellulose, hemicellulose and tar from the sample through the evaporation and thermal cracking processes. Fixed carbon percentage rose significantly from 22.85 to 76.92 %. Since fixed carbon formed the TCAC's matrix structure, a high fixed carbon value was preferred (Firdaus et al., 2022). Finally, ash percentage in precursor, char and TCAC were found to be 5.88, 4.11 and 3.58 % respectively. The low percentage of ash is a good trait of AC since ash has no pores and did not contribute to the process of adsorption.
SamplesProximate analysis (%)
Elemental analysis (%)
Moisture
Volatile matter
Fixed carbon
Ash
C
H
S
(N + O)
Precursor
13.05
58.22
22.85
5.88
41.45
10.11
0.12
48.32
Char
5.89
35.78
54.22
4.11
64.21
8.21
0.09
27.49
TCAC
3.25
16.25
76.92
3.58
80.12
7.33
0.07
12.48
SEM images of precursor and TCAC given in Fig. 4(a) and (b), respectively. Based on Fig. 4(a), the precursor surface was dense without pores. This result was expected since the precursor was packed with components such as lignin, cellulose, hemicellulose and tar. On contrary, the surface of TCAC in Fig. 4(b) was observed to be more porous and contained more empty holes. These sites were once occupied by the volatile matter and moisture components. These components evaporated and left the sample during the carbonization and activation process.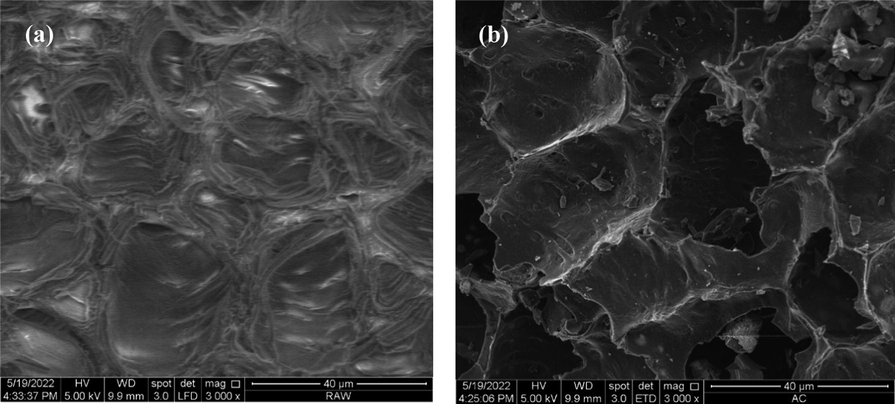
SEM images of (a) precursor (b) TCAC (3000x magnificent level).
Figs. 5(a) and 5(b) show the spectrum for the precursor and TCAC respectively. The precursor surface was seen to be filled with variety of functional groups such as vinyl C–H out-of-plane bend (890 cm−1), primary amine C-N stretch (1030 and 1627 cm−1), aryl -O stretch (1251 cm−1), methylene C–H asymmetric (2915 cm−1) and alkyne C–H stretch (3320 cm−1). After activation process, all of these functional groups diminished (except primary amine) due to their inability to bear the high temperature. In TCAC, it was found that primary amine C-N stretch survived the activation process, but its peak has shifted to 1076 cm−1. Other functional groups existed on TCAC’s surface were alkyl carbonate (1760 cm−1), secondary amine, >N–H bend (1650 cm−1), C≡C terminal alkyne (monosubstituted) (2140 cm−1), C≡C medial alkyne (disubstituted) (2190 cm−1) and hydroxy, OH group (3200 cm−1). These new functional groups on TCAC’s surface were formed due to the interaction with KOH molecules, CO2 gas molecules and other molecules from volatile matter during the evaporation stage.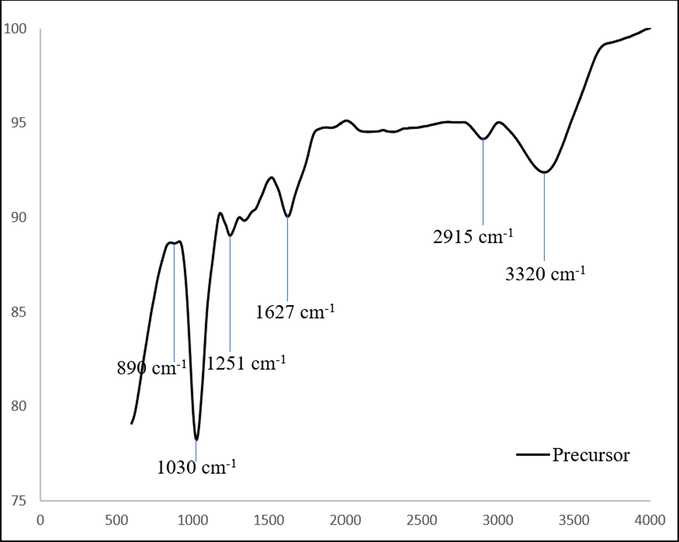
FTIR spectrum for precursor.
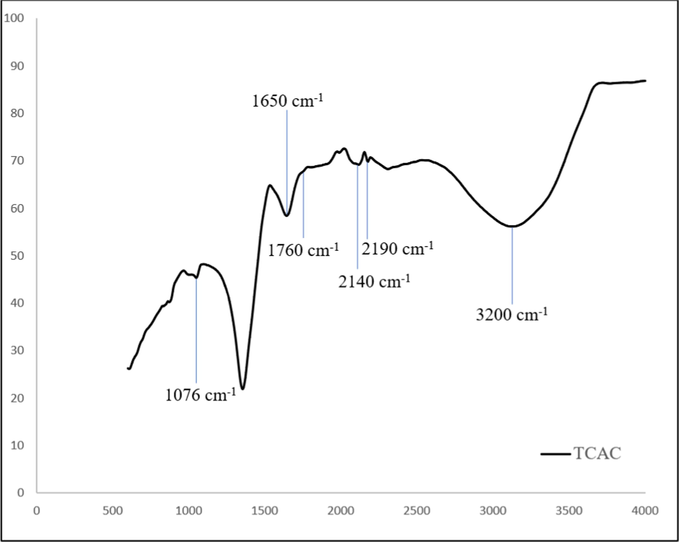
FTIR spectrum for TCAC.
Fig. 6 shows the possible attraction mechanism between the functional groups in TCAC’s surface and AMOX molecules. It was found that the elements of H, N and O in these functional groups have the potential to form hydrogen bond with H, S, N and O elements in AMOX molecules. The formation of hydrogen bond makes TCAC to be a good adsorbent. Fig. 7 provides a zeta potential graph for TCAC. It was found that the zeta potential value for TCAC is −13.80 mV. A negative zeta potential indicates that the surface of the particle has an excess of negatively charged particles or groups.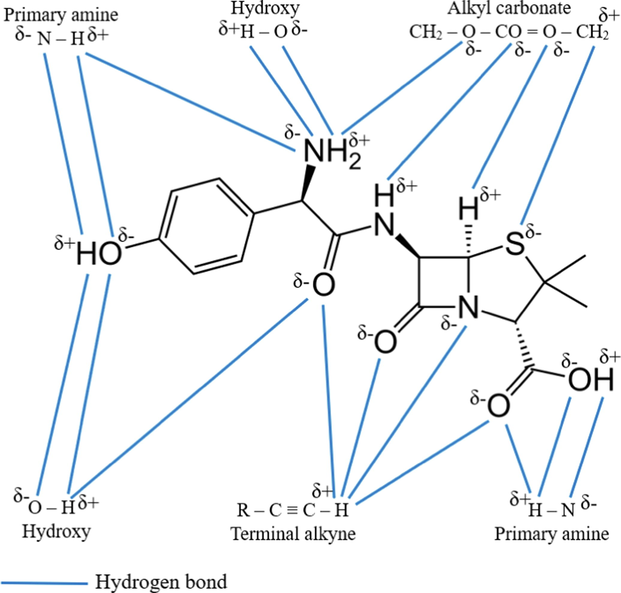
Possible mechanism attraction between functional groups and AMOX molecules.
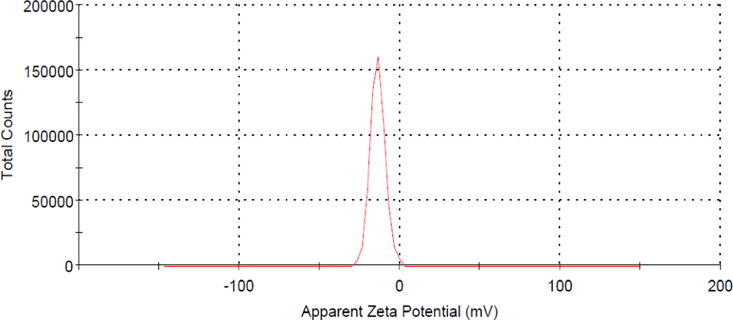
Zeta potential plot for TCAC.
3.3 Adsorption equilibrium
3.3.1 Effect of contact time and AMOX initial concentration
Fig. 8 shows the AMOX adsorption uptakes by TCAC for different concentration against time. Fig. 9 shows the percentage removal of AMOX for different initial concentration versus time. Based on Fig. 8, when the AMOX initial concentration increased from 25 to 300 mg/L, the AMOX adsorption uptakes increased from 21.76 to 217.69 mg/g. At a higher AMOX initial concentration, a higher quantity of AMOX molecules available in the solution, causing more AMOX molecules can be adsorbed by the TCAC. Besides that, at higher initial concentration, greater mass transfer driving force is formed to triumph the mass transfer resistance that occurred between adsorbates molecules in bulk and solid phases (Marrakchi et al., 2017); (Ashraf et al., 2019). Based on the Fig. 9, as the initial concentration of AMOX increased from 25 to 300 mg/L, the percentage removal of AMOX decreased from 87.03 to 72.56 %. Higher initial concentrations of AMOX led to a higher ratio of AMOX molecules to available sites, resulting in increased uptake but lower percentage removal, and vice versa (Ahmad et al., 2021).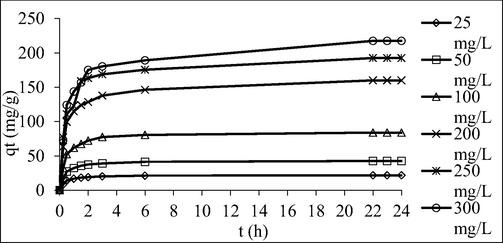
Plots of adsorption uptakes by TCAC versus time for different initial concentrations of AMOX at 30˚C.
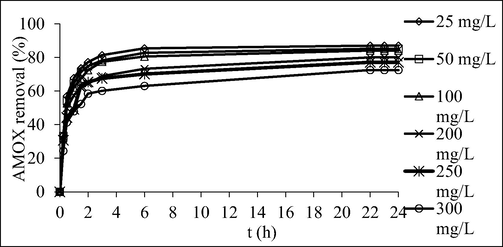
Plots of percentage removal by TCAC versus time for different initial concentrations of AMOX at 30˚C.
3.3.2 Effect of solution temperature
Fig. 10 shows the plots of AMOX adsorption uptakes versus different solution temperature. It was found that when solution temperature increased from 30 to 60 °C, adsorption uptakes of AMOX increased from 241.82 to 266.95 mg/g. The adsorption process of AMOX was favoured at higher solution temperature, which signifies an endothermic nature.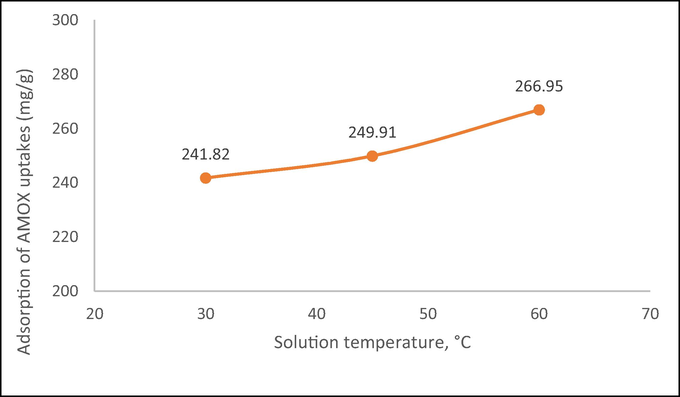
Plot on adsorption of AMOX uptakes against solution temperatures (initial concentration: 300 mg/L).
3.3.3 Effect of solution pH
Fig. 11 presents the AMOX uptakes by TCAC versus different solution pH. The lowest adsorption uptakes of AMOX by TCAC occurred at pH 2 with 78.91 mg/g. At pH 2, existence of excess H+ ions in the solution compete with H element in AMOX molecules to form hydrogen bond with N and O elements in TCAC’s functional groups (see Fig. 6). As the solution pH increased to 4 and 6, AMOX uptakes increased to 82.25 and 87.60 mg/g, respectively. At pH 4 and 6, H+ ions dropped in quantity, causing the competition to be less intense. At pH 8, AMOX uptakes further increased to 93.37 mg/g. The existence of excess OH– ions in solution induced the surface of TCAC to be negatively charged, causing H element in AMOX molecules to be attracted to the surface. At pH 10, AMOX uptakes increased to 95.86 mg/g due to the increased of OH– ions induction effect. At pH 12, only tiny changes were observed for AMOX uptakes (96.77 mg/g). This small increment is because the induction effect of OH– had reached its optimum value at pH 10 and 12. Adding more OH– ions in the solution can no longer increase the AMOX uptakes. Chowdhury et al., (Chowdhury et al., 2021) also found that the adsorption uptakes of antibiotic by AC loaded with Ni-Co-S nanoparticle was peaked at alkaline condition (pH 9). Adsorption of AMOX by coffee waste based AC was favoured at pH above 10 (Laksaci et al., 2023).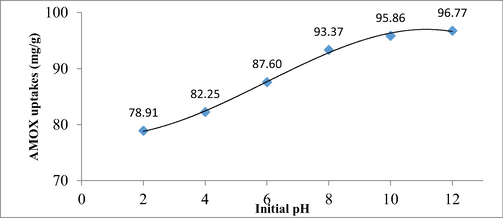
Plot of AMOX uptakes against different solution pH.
3.4 Adsorption isotherm
Fig. 12(a), (b) and (c) show the isotherm plots of Langmuir, Freundlich and Temkin models, respectively whilst Table 7 summarizes the isotherm parameters for the AMOX-TCAC adsorption system at 30 °C. The AMOX-TCAC adsorption system followed Langmuir model the best, due to highest R2 obtained of 0.9946. This indicated that AMOX molecules developed a monolayer coverage on the surface of the TCAC (García et al., 2018). Adsorption of AMOX by pomegranate peel based AC (Ali et al., 2020) and coffee waste based AC (Laksaci et al., 2023) were also obeyed Langmuir model. Langmuir maximum monolayer adsorption uptakes, Qm for AMOX by TCAC was found to be 357.14 mg/g. This value can be considered as good in comparison to AMOX removal by pomegranate peel based AC of 40.28 mg/g (Ali et al., 2020), coffee waste based AC of 370 mg/g (Laksaci et al., 2023) and bituminous based AC of 313.30 mg/g (Dolfini et al., 2022). The heterogeneity factor, nF for AMOX-TCAC was found to be 1.37. This value is between 1 and 10, so the adsorption system studied was found to be favorable (Firdaus et al., 2022).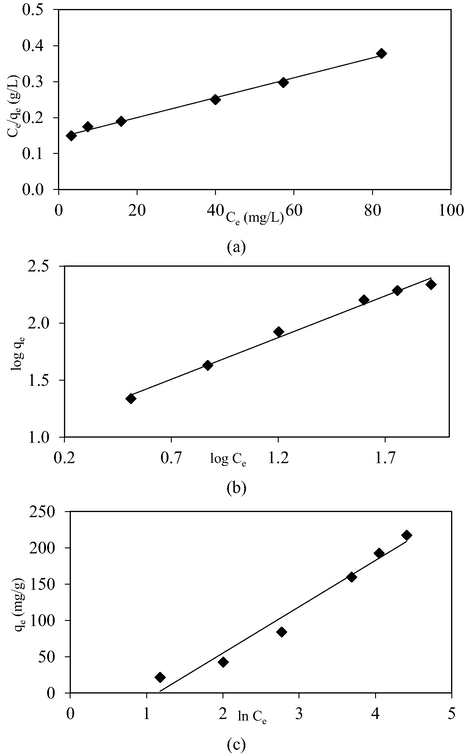
Isotherm plots of (a) Langmuir, (b) Freundlich and (c) Temkin for AMOX-TCAC adsorption system at 30 °C.
AMOX-TCAC
Langmuir
Qm (mg/g)
357.14
KL (L/mg)
0.019
R2
0.9946
Freundlich
nF
1.37
KF (mg/g)(L/mg)1/n
9.92
R2
0.9897
Temkin
B (L/mg)
63.82
A (L/mg)
0.32
R2
0.9679
3.5 Adsorption kinetic and mechanism study
Kinetic plots of PFO and PSO for AMOX-TCAC system are shown in Fig. 13(a) and (b), respectively whilst Table 8 presents the summary of kinetic parameters. The adsorption system followed PSO kinetic model the best due to highest R2 of 0.9990 and low error percentage of 4.00 %. The PSO was also revealed to be the best model to fit the adsorption of AMOX by vegetal powdered AC (Berges et al., 2021), adsorption of tetracycline, oxytetracycline and chlortetracycline antibiotics onto iron loaded corn stalk based (Song et al., 2020) and removal of sulfadiazine, metronidazole and tetracycline antibiotics by Prosopis juliflora based AC (Manjunath et al., 2020). The reaction rate, k2 dropped from 0.12 g mg−1 min−1 to 0.037 g mg−1 min−1 as the AMOX initial concentration increased from 25 to 300 mg/L. At a higher AMOX initial concentration, more AMOX molecules were existed on the solution. The competition between these molecules to be adsorbed by TCAC was more intense, resulted in lower reaction rate.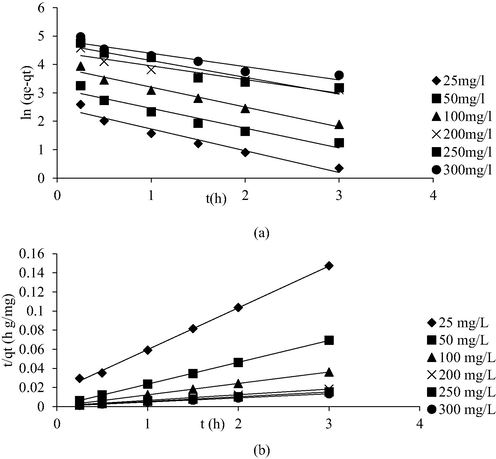
Kinetic plots for (a) PFO and (b) PSO for AMOX-TCAC adsorption system at 30 °C.
Initial adsorbates concentration (mg/L)
qe, exp
(mg/g)Pseudo-first order
Pseudo-second order
qe, cal (mg/g)
k1 (min−1)
R2
Error (%)
qe, cal (mg/g)
k2
(g mg−1 min−1)
R2
Error (%)
AMOX25
21.76
12.08
0.77
0.9511
44.48
22.83
0.92
0.9985
4.93
50
42.58
23.28
0.70
0.936
45.33
43.67
0.87
0.9999
2.57
100
84.06
49.52
0.70
0.9692
41.09
84.03
0.35
0.9999
0.03
200
160.04
84.04
0.48
0.9057
47.49
169.49
0.070
0.9987
5.91
250
192.71
112.83
0.59
0.8933
41.45
200.00
0.063
0.9992
3.78
300
217.69
128.75
0.47
0.8986
40.85
232.56
0.037
0.9977
6.83
Average
0.9257
43.45
0.9990
4.00
Fig. 14 shows the intraparticle diffusion plot for AMOX-TCAC adsorption system whilst Table 9 showed the summary for intraparticle diffusion parameters. Based on Fig. 14, the lines did not passing through the origin, therefore the rate limiting step was not contributed by the intraparticle diffusion solely (Björklund and Li, 2017). Instead, Fig. 14 shows multi-linear plots with three different regions which signifies the existence of three mechanism pathways. The first region (t0.5 = 0 to t0.5 = 1) was dominated by the film layer diffusion where the electrostatic forces play a major role between AMOX and TCAC’s surface (Sun et al., 2015). The second region (t0.5 = 1 to t0.5 = 2.50) is known as the slow adsorption stage, when intraparticle diffusion played a major role in the rate limiting phase (Wang et al., 2015). The last stage (t0.5 = 2.50 to t0.5 = 5) indicates the final equilibrium stage, where a very low of AMOX molecules left in the solution (Wang et al., 2010). Based on Table 9, the values of Kp1 for all adsorption systems studied were higher as compared to the Kp2 and Kp3, signifying that intraparticle diffusion were dominant in the first region as compared to the second and third region (Jung et al., 2016). Besides that, Kp1, Kp2 and Kp3 values increased when AMOX initial concentration increased from 25 to 300 mg/L. Greater adsorbates initial concentration produced greater mass transfer driving force, producing greater adsorption rate. Furthermore, it was also observed that C1, C2 and C3 increased when AMOX initial concentrations increased. These increments of C1, C2 and C3 indicate the increased in thickness boundary layer (Marrakchi et al., 2017).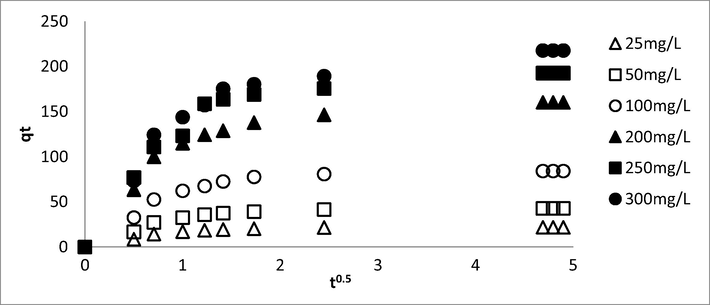
Intraparticle plot for AMOX-TCAC adsorption systems at 30 °C.
Adsorption system
Adsorbates initial concentration (mg/L)
Kp1
(mg/g h1/2)
Kp2
(mg/g h1/2)
Kp3
(mg/g h1/2)
C1
C2
C3
R12
R22
R32
AMOX-TCAC
25
19.55
4.61
0.17
0.30
12.56
20.94
0.9839
0.9708
0.9948
50
37.54
9.10
0.51
0.47
23.90
40.12
0.9890
0.9370
0.9948
100
72.65
21.10
1.47
0.86
41.55
77.00
0.9902
0.9860
0.9948
200
138.31
30.59
5.78
1.30
85.32
132.33
0.9938
0.9859
0.9948
250
156.04
57.29
7.32
0.25
76.59
157.58
0.9998
0.7331
0.9948
300
170.31
51.97
12.08
2.70
94.28
159.72
0.9828
0.9077
0.9948
Fig. 15 shows the Boyd plots for AMOX-TCAC adsorption system at 30 °C. The rate-limiting stages for all of the analyzed adsorption systems were found to be controlled by film diffusion since these plots were discovered to not pass the origin (Garba and Rahim, 2016).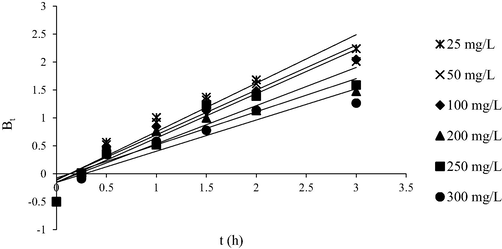
Boyd plot for AMOX-TCAC adsorption systems at 30 °C.
3.6 Adsorption thermodynamic
Table 10 presents the thermodynamic parameters for AMOX-TCAC adsorption system. The Δ H° for AMOX-TCAC adsorption system was found to be 5.48 kJ/mol. Positive sign of Δ H° values depict the endothermic nature of the adsorption systems where higher adsorbates uptake occurred at higher solution temperature. This result is consistent with the finding obtained in Section 3.3.2. The endothermic nature of adsorption process was also observed in the removal of various antibiotics (tetracycline, oxytetracycline and chlortetracycline) by the nanocomposites of zero-valent iron loaded AC derived from the corn stalk (Song et al., 2020). The Δ S° for AMOX-TCAC adsorption system was found to be 0.04 kJ/mol.K, indicating the amount of randomness at the solid to liquid boundary increased. The Δ G° values obtained for AMOX-TCAC adsorption systems were found to be in the range between −5.78 to −6.90 kJ/mol. Negative sign of this parameter indicates that the adsorption process was spontaneous in nature. The Ea value for AMOX-TCAC adsorption system was 15.62 kJ/mol. This value is below 42 kJ/mol, signifying the adsorption process was governed by physisorption (Hao et al., 2020).
Adsorption systems
Δ H° (kJ/mol)
Δ S° (kJ/mol.K)
Δ G° (kJ/mol)
Ea (kJ/mol)
303 K
318 K
333 K
AMOX-TCAC
5.48
0.04
−5.78
−6.36
−6.90
15.62
3.7 Bed column studies
3.7.1 Effect of inlet initial concentration
The breakthrough curve for AMOX-TCAC system at different inlet concentrations is provided in Fig. 16 whilst the corresponding parameters are tabulated in Table 11. When the inlet initial concentration increased from 50 to 150 mg/L, the breakthrough time, Tb and the exhaustion time, Tex for AMOX-TCAC adsorption system had reduced from 11 to 5 h and 32 to 20 h, respectively. It can be stated that the inlet initial concentration is inversely proportional towards the breakthrough time, Tb and exhaustion time, Tex. Tb is the period corresponding to a point on the breakthrough curve when the solute concentration approaches the maximum permissible concentration. Breakthrough point is typically associated with the treatment objective and occurs when the output concentration becomes 10 % from the input concentration, or 0.10 Ct/Co. Tex occurs when the outlet concentration is 90 % of the inlet concentration (0.9 Ct/Co). At this stage, the optimised TCAC are nearly saturated and removal efficiency rapidly declines. Higher intake concentrations caused the binding sites in the column to become saturated more quickly, which resulted in earlier breakthrough and exhaustion points. This was confirmed by the fact that a greater concentration gradient gives a stronger driving force for the development of mass transfer, enhancing the adsorption process.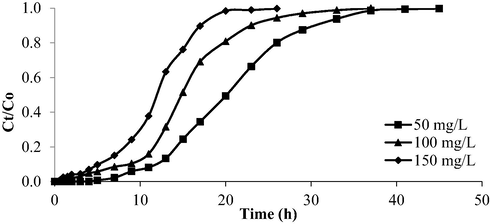
Breakthrough curve for AMOX-TCAC at different inlet concentration (flow rate = 10 mL/min and bed height = 2 cm).
Inlet concentration, Co (mg/L)
Mass of adsorbent (g)
Breakthrough point, Tb
(h)
Exhaustion time, Tex
(h)
Total adsorption uptake, qT (mg)
Maximum adsorption uptake, qmax
(mg/g)
AMOX-TCAC
50
2.08
11
32
959.40
461.25
100
3.32
7
26
1470.00
442.77
150
3.53
5
20
1524.00
431.72
3.7.2 Effect of inlet flow rate
The breakthrough curve for AMOX-TCAC adsorption system under the influence of different inlet flow rate is provided in Fig. 17 whilst Table 12 presents the corresponding parameters. As the inlet flow rate increased from 5 to 15 mL/min, the Tb and Tex declined from 15 to 2 h and 34 to 17 h, respectively. Low flow rate prolonged Tb and Tex. At a higher inlet flow rate, the molecules of AMOX experience a restricted timeframe to travel from the solution to the TCAC’s surface, penetrating the pores, and binding with active sites. These AMOX molecules exited the column even before the adsorption process can occur effectively, leading to a low percentage of removal. Besides that, weak mass transfer and contact between adsorbates and adsorbents occurred as a result of greater turbulence at a higher inlet flow rate, which led to poor adsorbate removal efficiency, and vice versa (Dwivedi et al., 2008).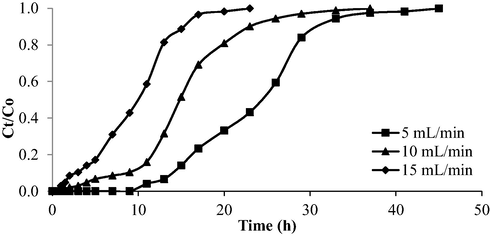
Breakthrough curve for AMOX-TCAC at different flow rate (inlet concentration = 100 mg/L and bed height = 2 cm).
Flow rate
(mL/min)
Mass of adsorbent (g)
Breakthrough time, Tb
Exhaustion time, Tex (h)
Total adsorption uptake, qT (mg)
Maximum adsorption uptake, qmax
(mg/g)
AMOX-TCAC
5
1.62
15
34
883.50
545.37
10
3.32
5
26
1461.00
440.06
15
2.65
2
17
809.10
305.32
3.7.3 Effect of TCAC bed height
The breakthrough curve for AMOX-TCAC adsorption system under the effect of different TCAC bed height is presented in Fig. 18 whilst Table 13 provides the corresponding parameters. As the TCAC bed height in column increased, the Tb and Tex increased from 5 to 15 h and from 26 to 57 h, respectively. Bed height posed positive effect on Tb and Tex. As the bed height increased, more surface area became accessible for the adsorption process to occur. Consequently, it took more time for the adsorbents to be exhausted (Kazemi et al., 2016). Moreover, longer contact times between adsorbates and adsorbents improved the adsorption process.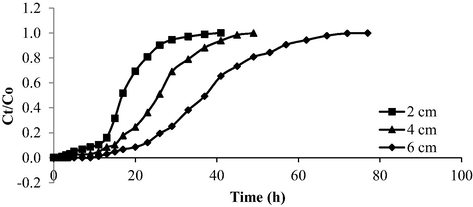
Breakthrough curve for AMOX-TCAC at different bed height (inlet concentration = 100 mg/L and flow rate = 10 mL/min).
Bed height (cm)
Mass of adsorbent (g)
Breakthrough time, Tb
(h)
Exhaustion time, Tex
(h)
Total adsorption uptake, qT (mg)
Maximum adsorption uptake, qmax
(mg/g)
AMOX- TCAC
2
3.32
5
26
1470.00
442.77
4
3.73
11
37
2052.60
550.29
6
4.87
15
57
3372.60
692.52
3.7.4 Breakthrough modelling
The bed column adsorption data were fitted to three models namely Adams-Bohart, Thomas and Yoon-Nelson models. The parameters for these models are given in Table 14, 15 and 16, respectively. The Yoon-Nelson model was found to predict the breakthrough curve extremely well for AMOX-TCAC adsorption system with R2 values of 0.9637. The 50 % breakthrough time (t0.5) estimated values were almost with the experimental values. The Adams-Bohart model has the lowest R2 value of 0.8156, reflecting poor correlation with experimental data. This shows that the rate-limiting stage in the adsorption process is not the intraparticle diffusion. This outcome is consistent with the batch adsorption mechanism investigation, which demonstrates that film diffusion is the rate-limiting step.
Antibiotic
adsorbedkA (L/mg min)
No (mg/L)
R2
AMOX
0.0015
7350.42
0.8157
Antibiotic
adsorbedkTH (mL/min mg)
qTH (mg/g)
R2
AMOX
0.0084
5855.52
0.8662
Antibiotic
adsorbedt0.5
(min)τ (min)
kY (1/min)
R2
AMOX
1010
1164
0.0048
0.9637
4 Conclusions
TCAC was produced successfully via physicochemical activation consists of KOH and CO2 activation, coupled with microwave irradiation technique. The TCAC was able to remove AMOX with maximum adsorption capacity, Qm of 357.14 mg/g. The optimum preparation conditions for TCAC were 657-W, 20 min and 0.99 g/g of radiation power, radiation time and IR, with 88.07 mg/g of AMOX uptakes and TCAC’s yield of 27.68 %. High BET surface area, mesopores surface area, total pore volume and fixed carbon content were found for TCAC (924.85 m2/g, 815.96 m2/g, 0.3485 cm3/g and 76.92 %, respectively). In equilibrium study, as the AMOX initial concentration increased from 25 to 300 mg/L, the adsorption uptakes increased whilst percentage removal decreased. The greatest removal of AMOX was achieved at pH 12 (96.77 mg/g) and at solution temperature of 60 °C (266.95 mg/g). The adsorption data for AMOX-TCAC obeyed Langmuir isotherm model and PSO kinetic model the best. The rate determining step was found to be film diffusion, as revealed by Boyd plot. The adsorption process studied was enhanced by the hydrogen bond formed between AMOX molecules and functional groups in TCAC namely primary amine, hydroxy, alkyl carbonate and terminal alkyne. Thermodynamic parameters revealed the adsorption process to be endothermic, spontaneous and physically controlled. In bed column studies, highest values for Tb, Tex and qmax were obtained at 50 mg/L, 5 mL/min and 6 cm of AMOX inlet initial concentration, inlet flow rate and TCAC bed height, respectively. The Yoon-Nelson model was best fitted to the AMOX-TCAC. The TCAC produced posed good characteristics an as adsorbent and it can be applied in a large-scale antibiotic treatment system through continuous mode of operation.
Acknowledgments
Ministry of Higher Education Malaysia has supported this research under the Fundamental Research Grant Scheme (Project code: FRGS/1/2021/TK0/USM/01/3).
Declaration of Competing Interest
The authors declare that they have no known competing financial interests or personal relationships that could have appeared to influence the work reported in this paper.
References
- A, A. F., Narayanan, S., Begum, M.S. et al., 2021. Green synthesis strategy for producing doped and undoped ZnO nanoparticles: their photocatalytic studies for industrial dye degradation. Water Sci Technol. 84, 2958-2967. Doi: 10.2166/wst.2021.308.
- Equilibrium, kinetic and thermodynamic studies on the adsorption of direct dye onto a novel green adsorbent developed from Uncaria gambir extract. J. Phys. Sci.. 2012;23:1-13.
- [Google Scholar]
- Optimization of microwave-assisted durian seed based activated carbon preparation conditions for methylene blue dye removal. Sustainable Technology And Practice For Infrastructure and Community Resilience 2017 IGNITE-AICCE'17
- [Google Scholar]
- Optimization and batch studies on adsorption of Methylene blue dye using pomegranate fruit peel based adsorbent. Chem. Data Collect.. 2021;32
- [CrossRef] [Google Scholar]
- Carbonization of sludge biomass of water treatment plant using continuous screw type conveyer pyrolyzer for methylene blue removal. IOP Conference Series: Earth and Environmental Science.. 2021;765:012112
- [CrossRef] [Google Scholar]
- Response surface methodology approach of phenol removal study using high-quality activated carbon derived from H3PO4 activation of Acacia mangium wood. Diam. Relat. Mater.. 2023;132:109632
- [CrossRef] [Google Scholar]
- Green preparation of activated carbon from pomegranate peel coated with zero-valent iron nanoparticles (nZVI) and isotherm and kinetic studies of amoxicillin removal in water. Environ. Sci. Pollut. Res.. 2020;27:36732-36743.
- [CrossRef] [Google Scholar]
- The Desirability Optimization Methodology; a Tool to Predict Two Antagonist Responses in Biotechnological Systems: Case of Biomass Growth and Hyoscyamine Content in Elicited Datura starmonium Hairy Roots. Iran J Biotechnol.. 2018;16:e1339.
- [Google Scholar]
- Occurrence, detection and removal of amoxicillin in wastewater: A review. J. Clean. Prod.. 2022;368:133140
- [CrossRef] [Google Scholar]
- Adsorption Studies of Textile Dye (Chrysoidine) from Aqueous Solutions Using Activated Sawdust. Int. J. Chem. Eng.. 2019;2019:9728156.
- [CrossRef] [Google Scholar]
- Single-Stage Microwave-Assisted Coconut-Shell-Based Activated Carbon for Removal of Dichlorodiphenyltrichloroethane (DDT) from Aqueous Solution: Optimization and Batch Studies. Int. J. Chem. Eng.. 2021;2021:9331386.
- [CrossRef] [Google Scholar]
- Antibiotics removal from aquatic environments: adsorption of enrofloxacin, trimethoprim, sulfadiazine, and amoxicillin on vegetal powdered activated carbon. Environ. Sci. Pollut. Res.. 2021;28:8442-8452.
- [CrossRef] [Google Scholar]
- Adsorption of organic stormwater pollutants onto activated carbon from sewage sludge. J. Environ. Manage.. 2017;197:490-497.
- [CrossRef] [Google Scholar]
- Synthesis of multi-application activated carbon from oak seeds by KOH activation for methylene blue adsorption and electrochemical supercapacitor electrode. Arab. J. Chem.. 2021;14:102958
- [CrossRef] [Google Scholar]
- The Exchange Adsorption of Ions from Aqueous Solutions by Organic Zeolites. Ion-exchange Equilibria. J. Am. Chem. Soc.. 1947;69:2818-2829.
- [CrossRef] [Google Scholar]
- Activated carbon loaded with Ni-Co-S nanoparticle for superior adsorption capacity of antibiotics and dye from wastewater: Kinetics and isotherms. Colloids Surf A Physicochem Eng Asp. 2021;611:125868
- [CrossRef] [Google Scholar]
- Amoxicillin removal from water by adsorption on activated carbon of mineral sources: discussion of experimental data, mechanisms and modeling. Environ. Technol. 2022:1-15.
- [CrossRef] [Google Scholar]
- Column performance of granular activated carbon packed bed for Pb(II) removal. J. Hazard. Mater.. 2008;156:596-603.
- [CrossRef] [Google Scholar]
- Conversion of teak wood waste into microwave-irradiated activated carbon for cationic methylene blue dye removal: Optimization and batch studies. Arab. J. Chem.. 2022;15:104081
- [CrossRef] [Google Scholar]
- Removal of antibiotics by adsorption and catalytic ozonation using magnetic activated carbons prepared from Sargassum sp. J. Water Process Eng.. 2023;53:103602
- [CrossRef] [Google Scholar]
- Evaluation of optimal activated carbon from an agricultural waste for the removal of para-chlorophenol and 2,4-dichlorophenol. Process Saf. Environ. Prot.. 2016;102:54-63.
- [CrossRef] [Google Scholar]
- Preparation, characterization, and dye removal study of activated carbon prepared from palm kernel shell. Environ. Sci. Pollut. Res.. 2018;25:5076-5085.
- [CrossRef] [Google Scholar]
- Synthesis and application of treated activated carbon for cationic dye removal from modelled aqueous solution. Arab. J. Chem.. 2022;15:104290
- [CrossRef] [Google Scholar]
- Functionalized diatomite/oyster shell powder doped electrospun polyacrylonitrile submicron fiber as a high-efficiency adsorbent for removing methylene blue from aqueous solution: Thermodynamics, kinetics and isotherms. J. Mol. Liq.. 2020;298:112022
- [CrossRef] [Google Scholar]
- Evaluation of Cephalexin and Amoxicillin removal from aqueous media using activated carbon produced from Aloe vera leaf waste. Chem. Phys. Lett.. 2022;800:139656
- [CrossRef] [Google Scholar]
- Adsorption enhancement of Congo red dye from wastewater based on edamame shell originated activated carbon by the cations: Experimental and theoretical studies. Diam. Relat. Mater.. 2023;136:109930
- [CrossRef] [Google Scholar]
- Sorption of dye from aqueous solution by peat. Chem. Eng. J.. 1998;70:115-124.
- [CrossRef] [Google Scholar]
- Manufacture of activated carbons using Egyptian wood resources and its application in oligothiophene dye adsorption. Arab. J. Chem.. 2020;13:5284-5291.
- [CrossRef] [Google Scholar]
- Amides as a model system of low molar mass algal organic matter. Influence on the adsorption of p-nitrophenol on activated carbon. Arab. J. Chem.. 2020;13:59-66.
- [CrossRef] [Google Scholar]
- Fabrication of granular activated carbons derived from spent coffee grounds by entrapment in calcium alginate beads for adsorption of acid orange 7 and methylene blue. Bioresour. Technol.. 2016;219:185-195.
- [CrossRef] [Google Scholar]
- Thiol-incorporated activated carbon derived from fir wood sawdust as an efficient adsorbent for the removal of mercury ion: Batch and fixed-bed column studies. Process Saf. Environ. Prot.. 2016;100:22-35.
- [CrossRef] [Google Scholar]
- High surface area and supermicroporous activated carbon from capsicum (Capsicum annuum L.) industrial processing pulp via single-step KOH-catalyzed pyrolysis: Production optimization, characterization and its some water pollutants removal and supercapacitor performance. Diam. Relat. Mater.. 2022;124:108920
- [CrossRef] [Google Scholar]
- Antibiotic resistance and wastewater: Correlation, impact and critical human health challenges. J. Environ. Chem. Eng.. 2018;6:52-58.
- [CrossRef] [Google Scholar]
- Elimination of amoxicillin by adsorption on coffee waste based activated carbon. J. Mol. Struct.. 2023;1274:134500
- [CrossRef] [Google Scholar]
- About the Theory of So-called Adsorption of Soluble Substances. Sven. Vetenskapsakad. Handingarl. 1898:1-39.
- [Google Scholar]
- The adsorption of gases on plane surfaces of glass, mica and platinum. J. Am. Chem. Soc.. 1918;40:1361-1403.
- [Google Scholar]
- Antibiotics in Wastewater of a Rural and an Urban Hospital before and after Wastewater Treatment, and the Relationship with Antibiotic Use—A One Year Study from Vietnam. Journal. 2016;13
- [CrossRef] [Google Scholar]
- A critical review of the estimation of the thermodynamic parameters on adsorption equilibria. Wrong use of equilibrium constant in the Van't Hoof equation for calculation of thermodynamic parameters of adsorption. J. Mol. Liq.. 2019;273:425-434.
- [CrossRef] [Google Scholar]
- Steam-activated carbon from malt bagasse: Optimization of preparation conditions and adsorption studies of sunset yellow food dye. Arab. J. Chem.. 2021;14:103001
- [CrossRef] [Google Scholar]
- Insights on enhanced antibiotic sulfamethoxazole removal by magnetic activated carbon-ballasted coagulation: Efficacy and floc properties. Sep. Purif. Technol.. 2023;315:123643
- [CrossRef] [Google Scholar]
- Antagonistic and synergistic analysis of antibiotic adsorption on Prosopis juliflora activated carbon in multicomponent systems. Chem. Eng. J.. 2020;381:122713
- [CrossRef] [Google Scholar]
- Mesoporous-activated carbon prepared from chitosan flakes via single-step sodium hydroxide activation for the adsorption of methylene blue. Int. J. Biol. Macromol.. 2017;98:233-239.
- [CrossRef] [Google Scholar]
- Date Palm Fiber as a novel precursor for porous activated carbon: Optimization, characterization and its application as Tylosin antibiotic scavenger from aqueous solution. Surf. Interfaces. 2021;24:101047
- [CrossRef] [Google Scholar]
- Malachite green dye adsorption by jackfruit based activated carbon: Optimization, mass transfer simulation and surface area prediction. Diam. Relat. Mater.. 2023;136:109991
- [CrossRef] [Google Scholar]
- Mass transfer simulation on remazol brilliant blue R dye adsorption by optimized teak wood Based activated carbon. Arab. J. Chem.. 2023;16:104780
- [CrossRef] [Google Scholar]
- Optimization and mass transfer simulation of remazol brilliant blue R dye adsorption onto meranti wood based activated carbon. Arab. J. Chem.. 2023;16:104683
- [CrossRef] [Google Scholar]
- Simultaneous adsorption of tetracycline, amoxicillin, and ciprofloxacin by pistachio shell powder coated with zinc oxide nanoparticles. Arab. J. Chem.. 2020;13:4629-4643.
- [CrossRef] [Google Scholar]
- Facile hydrogen peroxide modification of activated carbon particles produced by potassium hydroxide activation for removal of heavy metals from aqueous solutions. Diam. Relat. Mater.. 2023;136:110049
- [CrossRef] [Google Scholar]
- Preparation, characterization and Cr(VI) adsorption evaluation of NaOH-activated carbon produced from Date Press Cake; an agro-industrial waste. Bioresour. Technol.. 2018;258:48-56.
- [CrossRef] [Google Scholar]
- Adsorption of amoxicillin onto high surface area–activated carbons based on olive biomass: kinetic and equilibrium studies. Environ. Sci. Pollut. Res.. 2020;27:41394-41404.
- [CrossRef] [Google Scholar]
- Nanocomposites of zero-valent Iron@Activated carbon derived from corn stalk for adsorptive removal of tetracycline antibiotics. Chemosphere. 2020;255:126917
- [CrossRef] [Google Scholar]
- Multivariable optimization of activated carbon production from microwave pyrolysis of brewery wastes - Application in the removal of antibiotics from water. J. Hazard. Mater.. 2022;431:128556
- [CrossRef] [Google Scholar]
- Insights into matrix and competitive effects on antibiotics removal from wastewater by activated carbon produced from brewery residues. Environ. Technol. Innov.. 2023;30:103074
- [CrossRef] [Google Scholar]
- Activation of graphene aerogel with phosphoric acid for enhanced electrocapacitive performance. Carbon. 2015;92:1-10.
- [CrossRef] [Google Scholar]
- Kinetics and ammonia synthesis on promoted iron catalyst. Acta Physiochimica USSR.. 1940;12:327-356.
- [Google Scholar]
- Paper flower-derived porous carbons with high-capacitance by chemical and physical activation for sustainable applications. Arab. J. Chem.. 2020;13:2995-3007.
- [CrossRef] [Google Scholar]
- Removal of Reactive Blue 21 onto magnetic chitosan microparticles functionalized with polyamidoamine dendrimers. React. Funct. Polym.. 2015;91–92:43-50.
- [CrossRef] [Google Scholar]
- Adsorption of basic dyes on activated carbon prepared from Polygonum orientale Linn: Equilibrium, kinetic and thermodynamic studies. Desalination. 2010;254:68-74.
- [CrossRef] [Google Scholar]
- Zanthoxylum bungeanum branches activated carbons with rich micropore structure prepared by low temperature H3PO4 hydrothermal pretreatment method for toluene adsorption. Diam. Relat. Mater.. 2022;130:109474
- [CrossRef] [Google Scholar]
- Template-free preparation of nitrogen-doped activated carbon with porous architecture for high-performance supercapacitors. Microporous Mesoporous Mater.. 2019;276:280-291.
- [CrossRef] [Google Scholar]
- Efficient adsorptive removal of ciprofloxacin and carbamazepine using modified pinewood biochar – A kinetic, mechanistic study. Chem. Eng. J.. 2022;450:137896
- [CrossRef] [Google Scholar]
- Adsorption of amoxicillin and tetracycline on activated carbon prepared from durian shell in single and binary systems: Experimental study and modeling analysis. Chem. Eng. J.. 2020;379:122320
- [CrossRef] [Google Scholar]
- Optimization of process variables to prepare activated carbon from Noug (Guizotia abyssinica cass.) stalk using response surface methodology. Heliyon.. 2023;e17254
- [CrossRef] [Google Scholar]
- Biomass-based activated carbon by flash heating as a novel preparation route and its application in high efficiency adsorption of metronidazole. Diam. Relat. Mater.. 2023;131:109603
- [CrossRef] [Google Scholar]
- Scavenging malachite green dye from aqueous solution using durian peel based activated carbon. Malaysian Journal of Fundamental and Applied Sciences.. 2021;17:95-103.
- [CrossRef] [Google Scholar]
- Single-stage microwave assisted coconut shell based activated carbon for removal of Zn(II) ions from aqueous solution – Optimization and batch studies. Arab. J. Chem.. 2022;15:104011
- [CrossRef] [Google Scholar]
- Single-Stage Optimized Microwave-Induced Activated Carbon from Coconut Shell for Cadmium Adsorption. Chem. Eng. Technol.. 2022;45:1943-1951.
- [CrossRef] [Google Scholar]
- Facile synthesis of eco-friendly activated carbon from leaves of sugar beet waste as a superior nonconventional adsorbent for anionic and cationic dyes from aqueous solutions. Arab. J. Chem.. 2023;16:104900
- [CrossRef] [Google Scholar]
- Preparation of Quercus mongolica leaf-derived porous carbon with a large specific surface area for highly effective removal of dye and antibiotic from water. Arab. J. Chem.. 2022;15:104031
- [CrossRef] [Google Scholar]
Appendix A
Supplementary data
Supplementary data to this article can be found online at https://doi.org/10.1016/j.arabjc.2023.105110.
Appendix A
Supplementary data
The following are the Supplementary data to this article:Supplementary Data 1
Supplementary Data 1


