

Translate this page into:
Amorphous content on the photocatalytic performance of micrometer-sized tungsten trioxide particles
⁎Corresponding author. nandiyanto@upi.edu (Asep Bayu Dani Nandiyanto)
-
Received: ,
Accepted: ,
This article was originally published by Elsevier and was migrated to Scientific Scholar after the change of Publisher.
Peer review under responsibility of King Saud University.
Abstract
The purpose of this study was to investigate the correlation between amorphous content and the characteristics of micrometer-sized photocatalyst particles. As a model of photocatalyst, tungsten trioxide (WO3) particles with controllable amorphous contents were used. To comprehend the amorphous content parameter precisely, the experiments were conducted by heating amorphous WO3 powders at a specific temperature without additional chemicals or solvents. Thus, the percentage of amorphous in the WO3 particles was controlled independently in the constant particle outer sizes and morphology. Micrometer-sized catalyst was used to avoid the misleading photocatalytic measurements due to the over-dominancy of other catalytic parameters (such as excessive surface area and quantum confinement effect). The results revealed that in the constant process condition, the photocatalytic properties were strongly dependent on the amorphous content in the catalyst. Decreases in this parameter had a strong influence to the enhancement of the photodecomposition rate of organic material. The tendency for the influence of amorphous content was also confirmed by varying the number of catalysts in the photocatalytic process. The study was also completed with the theoretical consideration for the phenomenon happening during the WO3 crystallization (transformation of amorphous into hexagonal and monoclinic crystal structure) and the photocatalytic process.
Keywords
Amorphous
Crystallite size
Tungstate material
Curcumin
Photodecomposition rate

1 Introduction
Recently, photocatalytic process has attracted a tremendous amount of attention since it is prospective in degrading and destroying pollutants in water (Barka et al., 2010). To obtain an excellent photocatalytic process, consideration of principal parameters must be performed:
-
Types of catalyst (Alshammari et al., 2014; Arutanti et al., 2014a; Rashad et al., 2014),
-
Catalyst size and morphology (Arutanti et al., 2014b; Nandiyanto et al., 2009a, 2013),
-
Surface chemistry of catalyst (Barka et al., 2010),
-
Crystallite size and structure inside the catalyst (Arutanti et al., 2014b; Nandiyanto et al., 2017a),
-
Additional co-catalyst and doped material (Abdennouri et al., 2016; Arutanti et al., 2014a, 2015, Badli et al., 2017; Kadi et al., 2016; Nadarajan et al., 2018; Rashad et al., 2014; Singh et al., 2016),
-
Photocatalytic process condition (e.g. pH, temperature, illumination time, radiation intensity) (Barka et al., 2010; Benjamin et al., 2011; Lodha et al., 2011; Nandiyanto et al., 2017a; Rajamanickam and Shanthi, 2016),
-
Stoichiometrical composition between reactant and catalyst in the photodecomposition process (Barka et al., 2010; Benjamin et al., 2011).
One of the most considered parameters is the amorphous content. Studies on the amorphous have been well reported (Yoon and Cocke, 1986). However, understanding the impact of amorphous content on the photocatalytic performance is still not fully understood. Some reports confirmed that the amorphous phase gives a positive impact on the improvement of the catalytic rate (Bergmann et al., 2015; Cao and Suib, 1994; Merki et al., 2011; Yokoyama et al., 1981; Yoon and Cocke, 1986), whereas the other showed the opposite results (Changlin et al., 2011; Cong and Xu, 2011; Gao and Zhang, 2001; Tian et al., 2009; Wang et al., 2002).
The main problems in the uncompromised issue for the influence of the amorphous content on the photocatalytic performance are due to the difficulties in the analysis. For example, controlling amorphous content cannot be separated with the change of other parameters such as material size, structure, and morphology. In fact, the involvement of many parameters in the measurement of photocatalytic process leads the misleading analysis results.
Another problem for the difficulties in the amorphous content analysis is due to the use of inappropriate type of catalyst, for example the use of nanoparticles. Although nanoparticles are effective to be used as a tool for analyzing catalytic parameters, the nanoparticle has shortcomings regarding over dominance in surface area and quantum confinement effects (Xue et al., 2012). Indeed, this effect creates problems for getting precise analysis of some parameters independently (Nandiyanto et al., 2017a; Zhang, 1997). To against the use of nanomaterial, film-typed catalyst has been reported as an alternative tool. It is argued that the film catalyst can be easily separated after the process. However, one of the drawbacks of this type of catalyst is that it has the embedded catalytic site on specific positions, resulting in limited reactant-catalyst interaction, restricted light penetration, and obstructing impurities/byproducts that cannot be removed easily on the film surface.
In addition to the above shortcomings, current reports have some limitations. The amorphous and the crystalline phases in the material are compared without any considerations on the singular impact of the amorphous content itself in the catalyst.
In our previous studies (Arutanti et al., 2014a, 2014b, 2015; Nandiyanto et al., 2009a, 2016a, 2017a, 2017b, 2018), the strategies for gaining excellent photocatalytic performance have been demonstrated by preparing materials with controllable outer diameters, shapes, and crystallinity. However, those previous reports did not focus on the parameter related to amorphous content in detail. Specifically, the studies did not consider how to control the transformation of amorphous into crystalline and the impact of the percentage of amorphous in the catalyst. Thus, the purpose of this study was to report a systematic experimental evaluation regarding the singular effect of amorphous content on the photocatalytic performance. This study was conducted to confirm a current uncompromised issue regarding the amorphous phase in the catalyst.
As a model of photocatalyst, the present study used tungsten trioxide (WO3) particles. WO3 was used due to its excellent performance (i.e., active under visible light, relatively harmlessness, chemical and thermal stable, good photostability, as well as chemical and biological inertness) (Arutanti et al., 2014b).
To ensure the analysis of amorphous content on the photocatalytic performance precisely, the experiments were conducted using a direct heat treatment to high purity of micrometer-sized amorphous material. In short, the process was done by heating the amorphous WO3 micropowder without involving other chemicals and solvents. This method is effective to control amorphous content under constant particle morphology and outer size as well as to avoid inhibition from the existence of impurities to the photochemical reaction. Different from other reports that typically compared amorphous and crystal phases only (without considering the amount of amorphous phase in the catalyst), the present study varied the amorphous content of every 20% by changing calcination temperature in small step of every 10 °C.
To precisely uncover the amorphous content associating with the obtainment of change in photocatalytic performances, a micrometer-sized catalyst was used. The utilization of particles in micrometer range is rarely found and typically disregarded in current reports. In fact, the micrometer-sized particles can bring exceptional outcomes that differ markedly from those of nanoparticles or film material. Unlike film-typed catalysts, the microparticles can easily mix, sink, and fly in the solution, which is prospective for preventing problems in the light penetration and the reactant-catalyst interaction. Different from nanoparticles that need specific techniques for removing them from the characterized sample, the micrometer-sized particles can be collected easily because this type of particle can be spontaneously settled and precipitated after the process. This advantage brings positive consequences for getting precise photocatalytic measurement as the microparticles do not contaminate the characterized sample. Although the microparticles have less photocatalytic performance than the nanoparticles, microparticles are free from over dominance in surface area and quantum confinement effects, resulting analysis of the amorphous content can be obtained precisely (Nandiyanto et al., 2017a).
When using the direct heat treatment method for controlling percentage of amorphous in the catalyst, micrometer-sized particles have great advantages. Micrometer-sized particles are the best since the heat transfer can be distributed completely, reaching to the center of the particle. The cracking and sintering phenomena in the microparticle can be also avoided. This makes the prospective control of amorphous content inside the catalyst under constant material outer diameter and morphology. However, this method cannot be implemented with other types of materials. For instance, when applying this method to the nanoparticles, nanoparticles have shortcomings in the excess heat effect phenomena that can create the particle sintering process (Changlin et al., 2011; Shah et al., 2016). When applying this method to bulk material, problems in the incomplete heat transfer distribution to the deepest position inside the material are created. Regarding the film material, limitations have been found in the film crack phenomena.
To comprehend the explanation of the control of amorphous content in the material, all samples were analyzed using an X-ray diffraction (XRD), fourier transform infra red (FTIR), scanning electron microscope (SEM), as well as thermal analysis. To clarify the investigation precisely, the amorphous content was controlled independently in the constant particle outer size. To ensure the influence of amorphous content on the catalytic performance, the impact of initial catalyst loading was tested. The results were also investigated in detail along with the theoretical consideration for the phenomenon occurring during the WO3 crystallization (transformation of amorphous into hexagonal and monoclinic crystal structure) and the photocatalytic process.
2 Experimental method
2.1 Chemicals
Experiments were conducted using ammonium tungstate pentahydrate (ATP; (NH4)10[W12O41]. 5 H2O; >99%; Kanto Chemical Co., Inc., Japan). ATP was purchased and used without further purification. As a sample for organic material used in the photocatalytic process, curcumin was used. Curcumin was obtained from extraction process of turmeric (Curcuma longa L; collected from Bandung, Indonesia), in which the extraction process is described in detail in elsewhere (Nandiyanto et al., 2016a, 2017b, 2018).
2.2 Preparation of amorphous WO3 microparticles
The amorphous WO3 microparticles were obtained by applying heat treatment to the ammonium tungstate pentahydrate (ATP; >99%; Kanto Chemical Co., Inc., Japan) at 235 °C under atmospheric condition for 30 min. The heated material was then cooled to room temperature directly. Detailed experimental procedure for the preparation of the amorphous WO3 microparticles is described in detail in elsewhere (Nandiyanto et al., 2016b, 2017a).
2.3 Preparation of WO3 microparticles with controllable amorphous contents
To produce WO3 microparticles with a specific amorphous content, the amorphous WO3 particles were put into an electrical furnace and calcined at a specific temperature for 30 min. The present study varied the calcination temperature in a small step of almost every 10 °C: i.e. 235, 245, 250, 255, 260, 270, 280, 300, and 320 °C. Then, the calcined material was cooled to room temperature directly (cooling rate of about 30 °C/min).
2.4 Characterizations
Several analyses were employed to characterize the physicochemical properties of the calcined samples. Thermal Gravimetry (TG) and Differential Thermal Analysis (DTA) (DTG-60A, Shimadzu Corp., Japan; conducted at a heating rate of 5 °C/min and a specific flow of air (200 mL/min)) was used to analyze the mass transformation profile of ATP into WO3 during the heating process. FTIR (FTIR-4600, Jasco Corp., Japan) and XRD (XRD; PANalytical X’Pert PRO; Philips Corp., The Netherland) were utilized to analyze the chemical composition and the amorphous/crystalline ratio, respectively. SEM (JSM-6360LA; JEOL Ltd., Japan) was used to characterize the particle outer diameter and morphology. The nitrogen sorption analysis (BET Nova 4200e; Quantachrome Instruments Corp., US; operated at 77 K) was conducted to analyze the surface area and porous structure of the sample.
In addition, regarding the measurement of the amorphous content in the sample, the amorphous and crystalline ratio was calculated using a software that is equipped with the XRD measurement apparatus. In simplification, the calculation was defined by dividing the area of “amorphous” and the area of “total of amorphous and crystalline” (Tahara et al., 2014). An example of the calculation method for gaining the amount of the amorphous is presented in Fig. 1.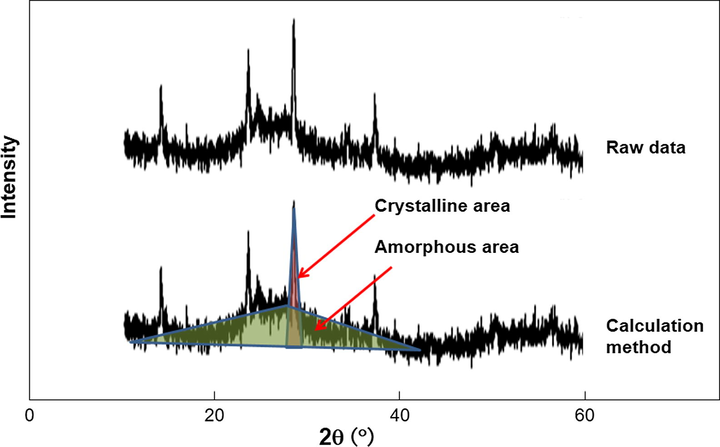
Definition of the percentage of amorphous content calculation in the XRD analysis.
2.5 Photocatalytic performance analysis
In the photocatalytic experimental procedure, 1 g of WO3 powder with a specific crystallinity was put into 300 mL of aqueous solution containing 100 ppm of curcumin. The solution was vigorously stirred (600 rpm) for 10 min in the dark condition to provide the saturation conditions for the adsorption of curcumin-photocatalyst.
The mixed WO3-curcumin suspension was then put in the photocatalytic reactor system. The photocatalytic reactor consists of 400-mL capacity of borosilicate photochemical batch glass reactor (having dimension of 10 and 8 cm for height and diameter, respectively) equipped with illumination lamps (36 W of neon lamp) and a gas bubbler. The experiments were performed at ambient temperature between 25 and 30 °C at atmospheric condition under 1 L/min of air bubbled into the reactor (to maintain the concentration of dissolved oxygen in the solution during the photodecomposition process). All experiments were stirred using a magnetic stirrer with a mixing rate of 600 rpm. Detailed information for the photocatalytic processing apparatus is explained in the previous report (Nandiyanto et al., 2017a).
The photocatalytic process was conducted for 6 h. The progress of the process was monitored by withdrawing definite quantity of aliquot in every 30 min, centrifuged at 15,000 rpm for 5 min, and measured using a portable spectrophotometer (Vis-spectro, Indonesia; see reference (Nandiyanto et al., 2016a)) for decoloration of curcumin. In addition, to ensure the influence of amorphous amount on the photocatalytic performance, the mass of WO3 powders in the process was varied from 0.30 to 2.00 g.
3 Results
3.1 Preparation of amorphous WO3 microparticles
Fig. 2 shows the TG-DTA analysis results for the obtainment of the temperature profile of ATP during the decomposition process. The result confirmed the impact of temperature on the change of material mass. The detection of mass loss increased as the increase in temperature, which is in a good correlation with the DTA analysis for the appearances of some peaks (i.e. 4 endothermic peaks and 1 exothermic peak; at temperatures of 120, 190, 280, and 420 °C). The decreases in mass are in a good agreement with the theoretical line calculated by stoichiometry, as shown in horizontal dashed line. Based on previous studies (Nandiyanto et al., 2016b, 2017a), the change of amorphous to crystalline is effective in the range of temperature of between 230 and 320 °C.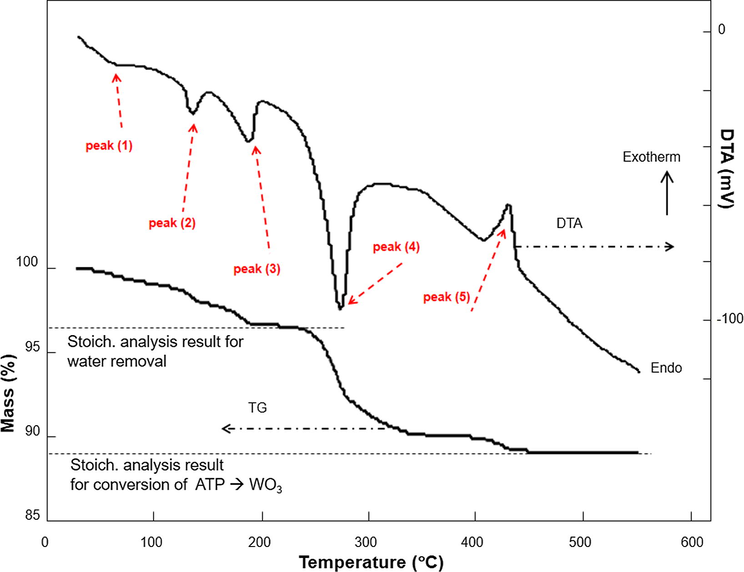
TG-DTA analysis results of ATP.
To ensure the effectiveness in the preparation of amorphous WO3 microparticles, Fig. 3 shows the XRD analysis results of ATP calcined at temperatures of between 25 and 235 °C. The XRD pattern of the initial ATP is identical to literature (Nandiyanto et al., 2016b). The use of temperature at 175 °C resulted in the appearance of some patterns in addition to ATP peaks, and the use of temperature of 200 °C led to the decreases in peak intensities. Moreover, the use of temperature of 235 °C permitted to the formation of amorphous material. The change in the XRD pattern confirms that there is a change in the elemental structure in the sample. ATP converted into WO3 by releasing ammonia (NH3) and water (H2O) (see the reaction route in the right side in Fig. 3 based on previous work (Nandiyanto et al., 2017a)).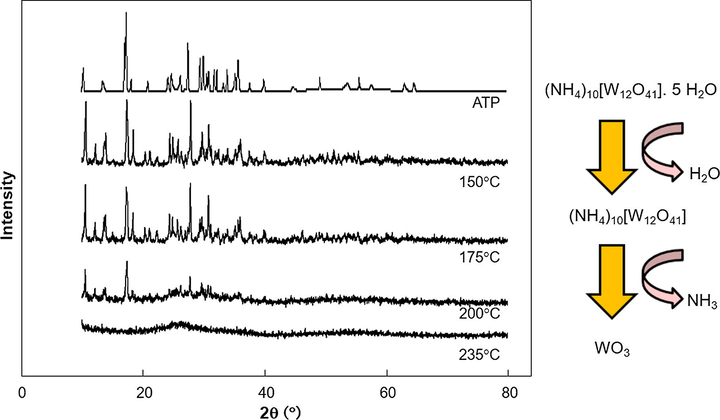
The XRD analysis of the ATP calcined from 25 to 235 °C.
3.2 Control of amorphous content in the WO3 microparticles
To produce material with specific amorphous content without changing other parameters, the direct heat treatment to the amorphous WO3 microparticles was performed. The direct heat treatment was applied at a specific temperature (from 235 to 320 °C).
Fig. 4 shows the XRD analysis results of the calcined amorphous WO3 particles at various temperatures. As shown in the figure, changes in the XRD patterns along with the selection of temperature were identified. Initial XRD pattern of sample (prior to adding calcination) is amorphous without any peaks. When the amorphous powder was calcined at temperature of 245 °C, small peaks appeared. The peak intensities become more prominent with the increasing temperature, responding the decreases in the amorphous content and the transformation of amorphous into crystalline structure. The percentage of amorphous in the material decreases with increasing the temperature. The use of temperature of 320 °C on the amorphous sample resulted in the formation of fully crystalline materials (0% of amorphous content). In addition, temperature at higher than 320 °C was not tested because higher temperature has a correlation to the increases in crystallite size (Nandiyanto et al., 2017a), while this crystallite size is not the focus in this study.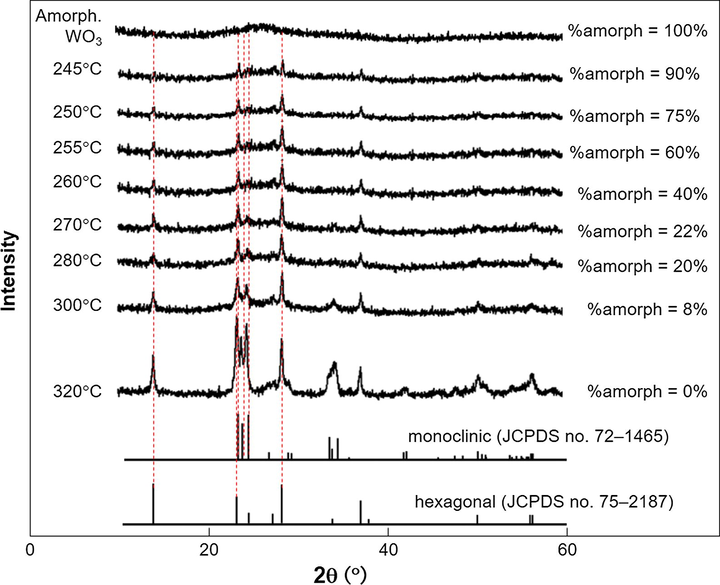
The XRD analysis results of the amorphous WO3 calcined from 235 to 320 °C.
To confirm the crystal structure in the sample, the joint committee for the powder diffraction system (JCPDS) no. 75–2187 and 72–1465 (corresponded to hexagonal and monoclinic WO3 patterns, respectively) were used and shown as vertical dashed lines. No impurity peaks instead of both types of crystal were detected, indicating that the products are pure. The phase transformation from amorphous to crystal structure followed by the change of crystalline type composition was detected. Until heating at temperature of 260 °C, the hexagonal structure dominates. The monoclinic structure starts to appear from temperature of 270 °C. The number of hexagonal structure decreases with increasing temperature.
Fig. 5 shows the FTIR analysis results of amorphous WO3 microparticles calcined at various temperatures. The results detected that all samples have almost similar FTIR peaks and patterns, confirming no change in the chemical composition during the additional heat treatment to the amorphous WO3. The FTIR of the samples identified the tungstate-related specific bond peaks (in the range below 1000 cm−1) (Alaya and Rabah, 2017a). There are no O—H molecules peaks (at the band of about 1600 and 3600 cm−1) and N—H bond (at the band of about 1400 and 3200 cm−1) (Nandiyanto et al., 2016b), confirming that OH and NH are not chemically bonded with the particles. The major difference of the FTIR pattern was found in the wavenumber of between 2800 and 300 cm−1. Amorphous material has three peaks, and the fully crystalline has two.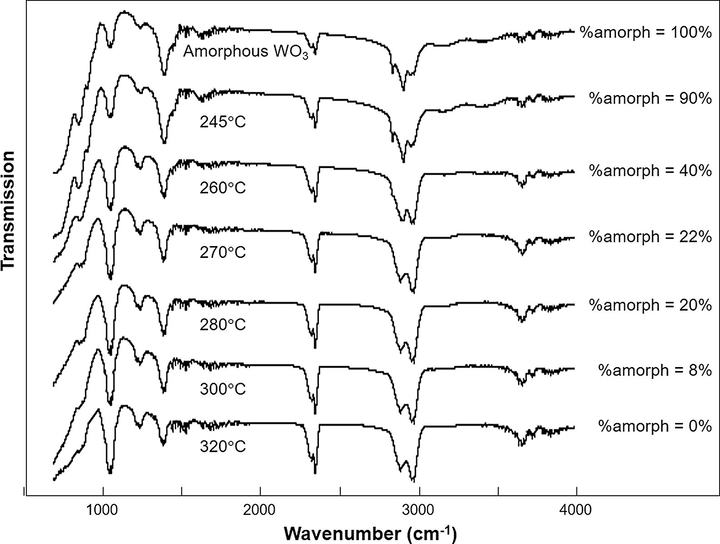
The FTIR analysis results of the amorphous WO3 calcined from 25 to 235 °C.
To confirm precise analysis of the chemical structure transformation in the material, Fig. 6 shows the FTIR analysis results of amorphous WO3 microparticles calcined at temperatures of 245, 250, 255, and 260 °C in the wavenumber of between 2600 and 3200 cm−1. In this range of wavenumber, there is a change in the FTIR peaks and intensities. The peaks at about 2900 and 2980 cm−1 are in a good agreement with literature that apply low-heat treatment process to the ammonium-based tungsten raw materials (Alaya and Rabah, 2017b; Mkhize et al., 2015). The appearance of the peak at about 2850 cm−1 is possibly due to the existence of trapped NH3 in the material. The peak intensity decreased gradually with increasing the processing temperature and completely disappeared after 270 °C.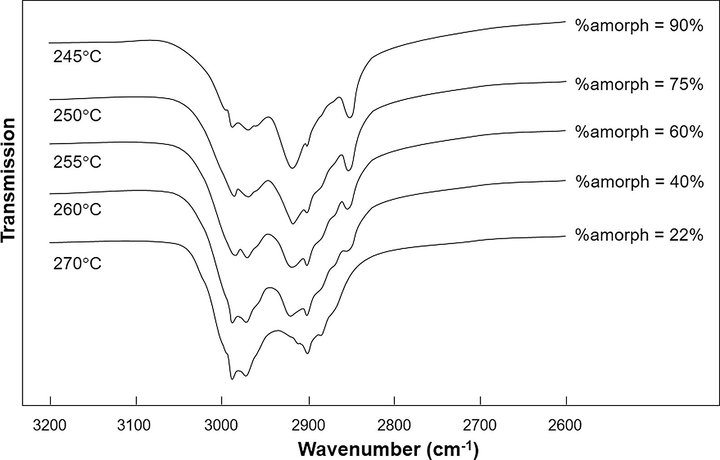
The FTIR analysis results of the amorphous WO3 calcined from 245 to 270 °C.
The hypothesis in the existence of trapped NH3 is in a good agreement with the TG-DTA analysis in Fig. 2 and XRD analysis in Figs. 3 and 4. The XRD analysis detected the formation of amorphous after 235 °C, confirming all ammonium tungstate materials have been converted into tungsten oxide completely. The TG-DTA informs the occurrence of mass degradation in the range of between 245 and 270 °C, verifying that the formed NH3 from the decomposition of ATP trapped and released from the material gradually.
Fig. 7 depicts the SEM images of amorphous WO3 microparticles before and after calcined at temperature of 320 °C. The results showed that agglomerated-free microparticles with polyhedra shapes were observed for all samples. Almost no change in either the particles outer size or particle morphology was observed. The mean outer diameters of amorphous WO3 particles before (Fig. 7a) and after heat treatment (Fig. 7b) were about 90 μm.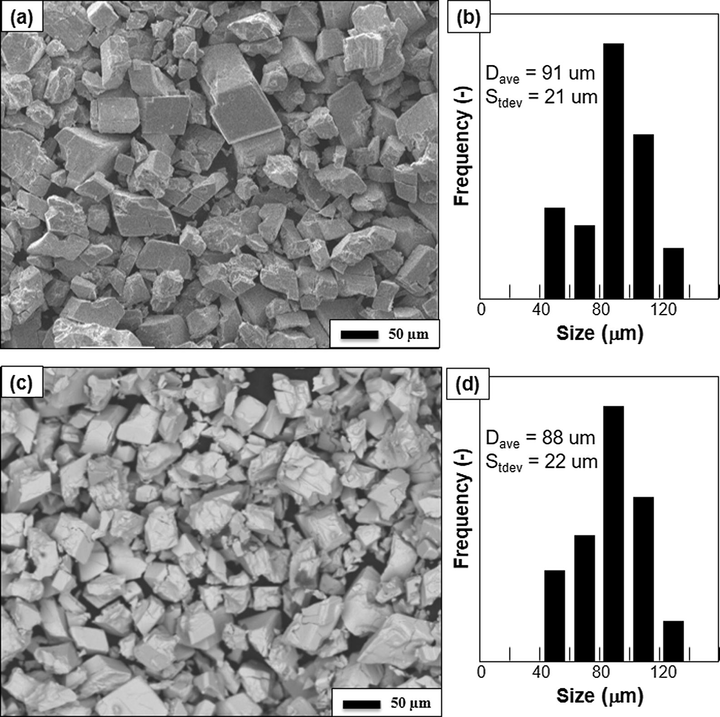
The SEM analysis images of the amorphous WO3 before (a) and after (b) calcination at 320 °C.
Fig. 8 shows the nitrogen adsorption/desorption isotherms of amorphous WO3 calcined at various temperatures. Although there is a change in the maximum volume adsorbed values, the values are relatively small (less than 6 m2/g in STP condition). The calcined particles exhibited a characteristic type-II curves (Fig. 8a–c). However, when the particles are fully crystalline, the BET curve showed type-III curve (Fig. 8d). The curves indicate that all samples were dense (non-mesoporous structured material).
The nitrogen adsorption analysis results of samples containing 100, 95, 22, and 0% of amorphous content. Figures (a) is the initial amorphous WO3 particles. Figures (b), (c), and (d) are prepared by heating amorphous WO3 at temperatures of 240, 270, and 320 °C, respectively.
To confirm detailed information gained from the nitrogen sorption analysis, Table 1 shows the characteristics of the samples (i.e., surface area, pore volume, micropore volume, and average pore radius). The values of surface area are between 1 and 5 m2/g. However, the values of surface area are relatively low compared to common particles (Badli et al., 2017) and porous particles (Nandiyanto et al., 2009b, 2013). This low surface area is because the particles have dense structure and the size is in the range of micrometer. Although there is an increase in the surface area and a decrease in pore size as a function of amorphous content, this is due to the elemental conformation inside the particles. However, the change is insignificant for the catalytic reaction.
Amorphous content
Heating temp. (°C)
Surface area (m2/g)
HK micropore volume (cc/g)
Average pore radius (nm)
BJH average pore radius (nm)
Adsorption
Desorption
0%
320
1.256
0.0049
6.01
1.54
3.88
8%
300
2.106
0.0030
5.54
4.95
2.12
22%
270
2.956
0.0011
5.07
2.48
2.43
90%
245
2.225
0.0058
5.21
1.55
1.69
95%
240
3.051
0.0009
4.26
1.54
1.68
100%
235
4.927
0.0016
2.60
1.54
1.69
3.3 Effect of amorphous content in the WO3 microparticles on the photocatalytic activity
To investigate the effect of amorphous content on the photocatalytic activity of WO3, WO3 microparticles with a specific amorphous content was added into the photoreactor system with 100-ppm curcumin solution as a model of dye. Various WO3 microparticles with the amorphous amount of between 0 and 100% were evaluated.
Fig. 9 presents the normalized curcumin concentrations (with respect to the initial concentration) over time during the photocatalysis experiments. Photodegradation was measured for 6 h, which was an ample amount of time to distinguish the photocatalytic performances of WO3 with various amorphous contents.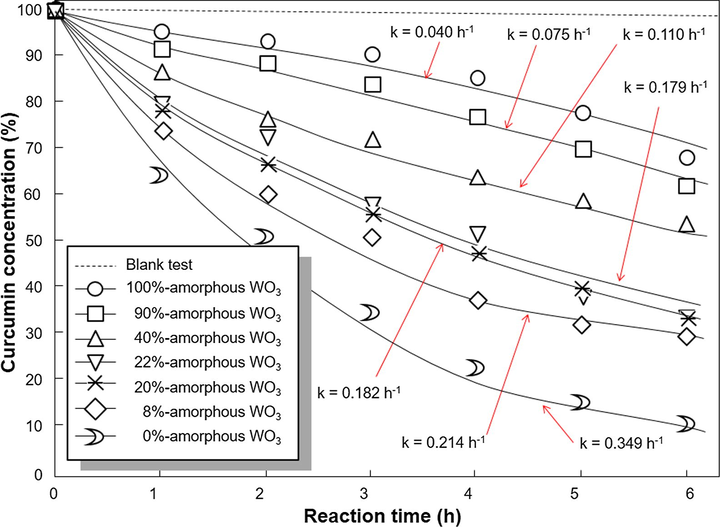
The photodecomposition profile of curcumin using WO3 catalyst with various amorphous amounts.
The decomposition rates of curcumin corresponded to the type of WO3 catalysts used. Insignificant discoloration (the final curcumin concentration of 98%) was found for blank test (irradiated curcumin without additional WO3). However, the change of curcumin concentration was obtained when adding WO3 into irradiated curcumin solution.
The fastest degradation of curcumin (shown by the lowest final curcumin concentration) was obtained when using WO3 with the lowest amorphous content. The final concentration of the curcumin when using WO3 particles with percentage of amorphous of 100, 90, 40, 22, 20, 8, and 0% were 78, 61, 52, 32, 32, 29, 10%, respectively.
Fig. 10 presents the correlation of photocatalytic rate and amorphous amount under various catalyst loadings. The results showed that the more additional catalysts gave positive correlation to the increases in the photocatalytic rate (shown by solid lines). However, excess catalyst (concentration of more than 3.30 g/L) has a negative impact to the lowering photocatalytic performance (shown by dashed lines). The idea obtained from Fig. 10 is the tendency for the amorphous amount parameter in photocatalytic rate. All catalyst loading parameters agreed that the decreases in the amorphous amount have a direct correlation to the increases in the photocatalytic rate.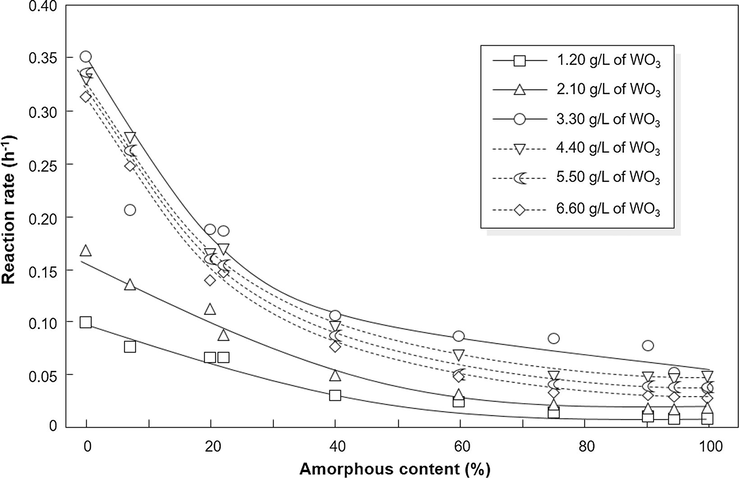
The correlation between amorphous content and reaction rate under various catalyst loading.
4 Discussion
Based on the XRD and FTIR analysis results (see Figs. 3–5), heating sample at temperature of 235 °C is effective to convert ATP into amorphous WO3 material. All samples calcined at 235–320 °C exist in pure WO3. The increase in calcination temperature causes the appearance of crystal peaks and the increases in peak intensities, which signify control the amount of amorphous. The impact of temperature on the transformation of amorphous to crystal state are in a good agreement with literature (Nadarajan et al., 2018; Nandiyanto et al., 2016b).
The SEM analysis images depicted in Fig. 7 confirmed that there is almost no change in the catalyst morphology when heating amorphous material. This result confirmed that the use of amorphous WO3 as a raw material is effective to control the amorphous-to-crystalline amount ratio without any change in physical properties, such as size and morphology. Indeed, the calcined samples can be used for the investigation of the singular effect of amorphous amount on photocatalytic activity of material.
The influence of the amorphous amount on the photocatalytic performance was verified in Figs. 9 and 10. As shown in Fig. 9, the blank test demonstrated that the degradation of curcumin is extremely slow without WO3 under light illumination, whereas the curcumin with WO3 gives responses in the degradation. This confirms that the curcumin is stable against light irradiation and the main degradation factor for the bleaching curcumin solution is due to the existence of WO3 catalyst (Nandiyanto et al., 2018).
Different decomposition rates of curcumin were obtained, depending on the type of WO3 catalysts. The slowest decomposition rate was found for fully amorphous, whereas the fastest was for samples with fully crystalline. To ensure the influence of amorphous content parameter on the photocatalytic performance empirically, the Langmuir–Hinshelwood kinetic model for solid–solute reactions was used (Nandiyanto et al., 2009a). In short, the correlation is expressed by
To ensure the effect of amorphous on the photocatalytic performance, analysis of the decomposition rate under various WO3 catalyst loadings was conducted (See Fig. 10). Similar to other reports (Barka et al., 2010), the photodegradation rate was a function of the number of catalyst loading. More catalyst loading leads to the more active site for production of OH* species, allowing the better photocatalytic performance (Rajamanickam and Shanthi, 2016). However, too much catalyst loading has a negative impact on the increases in the turbidity (Nandiyanto et al., 2017a). This condition reduces the light transmission through the solution, while this light is crucial as a main energy source in the photodecomposition process. Indeed, this gives idea for the further investigation for gaining the optimum initial catalyst loading. Although various catalyst loadings were applied, the tendency regarding the amorphous was consistent. All catalyst loading variations agree for the negative impact of the amorphous amount on the improvement of the photocatalytic rate.
To understand the main reason for the catalytic rate as a function of amorphous, Fig. 11 depicts the correlation of the amorphous amount with the reaction rate. To ensure the evaluation precisely, investigation of the surface area and the crystalline type is also added. To clarify the discussion, figure was divided into three zones based on the percentage of amorphous content in the particle: (1) less than 20% (the first zone); (2) between 20 and 90% (the second zone); and (3) more than 90% (the third zone).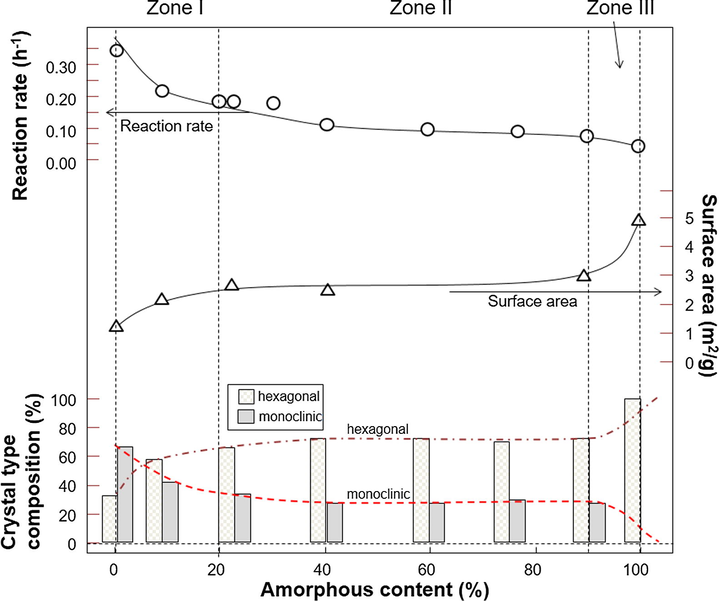
The correlation among amorphous content, reaction rate, surface area, and crystal type composition.
In the first zone, the photocatalytic rate decreases exponentially as increases in amorphous content. The surface area increases, informing that this amorphous parameter has no relation to the deterring reaction rate. The change of crystalline phase was found. The sample with 0% of amorphous contains mostly monoclinic, whereas that with 20% of amorphous has domination of hexagonal. Domination of monoclinic phase decreases with increases in the amorphous content, giving ideas that the main reason for the change in the photocatalytic rate is mostly due to the decreases in the number of monoclinic phase in the material. As explained in the literature (Zhang et al., 2014), the monoclinic phase is the most stable and the most active WO3 crystal pattern. Thus, because the major parameter affected the reaction rate change is the composition of crystal types, this zone cannot be used to predict the influence of amorphous content.
In the second zone, an increase in amorphous content corresponds to a decrease in photocatalytic activity. The zone contained identical hexagonal and monoclinic structure amount ratio with composition of 75 and 25%, respectively. The surface area and the composition of crystalline type were constant, informing that this zone can be used for the investigation of the effect of amorphous content on the photocatalytic activity.
In the third zone, there is a decrease in photocatalytic activity as an impact of amorphous amount. However, since the changes in the photocatalytic rates are insignificant, the effect of amorphous composition on the reaction rate cannot be distinguished clearly.
Based on above results, specifically in the second zone in Fig. 11, since the phodecompositon parameters (e.g. outer size, and crystal phase in the catalyst, as well as the concentration ratio of curcumin/WO3) were the same and the catalyst was classified as non-porous material (as confirmed by BET analysis in Fig. 8 and Table 1), the fundamental reason behind the difference in photocatalytic performance is purely from the amorphous amount in the catalyst. In short, the present study demonstrated that the amorphous has a negative impact on the catalytic process, in which this trend was in a good agreement with other reports (Gao and Zhang, 2001).
The mechanism constituting the photocatalytic process is shown in Fig. 12. The photocatalytic process can be done only after light irradiation. When light energy attaches catalyst, catalyst absorbs its energy (as photon; see route R1). (Barka et al., 2010) Then, when its energy is equal to or greater than catalyst bandgap energy (for example, WO3 has bandgap energy of about 2.98 eV) (Arutanti et al., 2014a, 2014b), electron (e−) is promoted from valence band (VB) to conduction band (CB) (see route R2) (Rajamanickam and Shanthi, 2016). The migrating e− leaves an electron vacancy or a hole (h+) in the VB, resulting charge separation. Once the charge separation is maintained, e− as the light-generated carrier travels to the catalyst surface (see route R3) (Nandiyanto et al., 2017a). As a counterpart to stabilize the accumulation of light-generated carriers on the surface, adsorbed species (i.e. water (H2O), hydroxide (OH−), and oxygen (O2) molecules) on the outer surface of catalyst contact, interact, and participate in the redox reaction with e− and h+ (Rashad et al., 2014).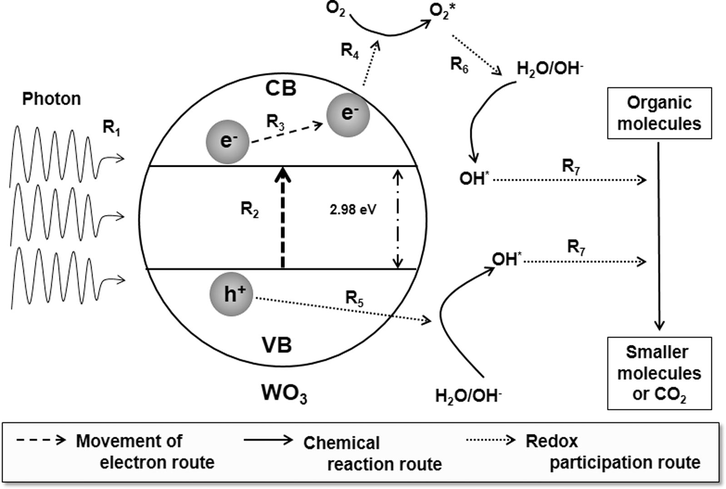
Proposal mechanism for the photocatalytic process.
In short, e− takes electron-accepting species (i.e. O2) to generate radical anion as superoxide (O2*) (see route R4), whereas h+ breaks the surface-bound H2O or OH− to form hydroxyl radical (OH*) (see route R5) (Barka et al., 2010). In the case of radical anion, the radical anion endorses the conversion of other H2O molecule into OH* (see route R6) (Arutanti et al., 2015). The existence of OH*, which can be produced from e− and h+ routes, leads to the conversion of organic molecule into smaller organic component (Nandiyanto et al., 2017a). Further, the decomposition can lead to the formation of carbon dioxide and water (see route R7). This mechanism can be found for the bleaching color in the photocatalytic of dye.
Theoretically, the improvement of photocatalytic performance depends on the activation of the light-generated carriers and the effectiveness of average diffusion time of the light-generated carriers to reach the surface of catalyst and interact with oxygen and water molecules (see routes R3 and R4). One of the equations for describing the movement of light-generated carriers is (Nandiyanto et al., 2017a)
-
The less number of active coordinate in the material for catalytic reaction (Yoon and Cocke, 1986);
-
The need of high energy for creating e− and h+ (because the binding energy seems to be higher than the crystalline structure) (Castillo et al., 2010);
-
The high opportunity for the recombination phenomenon (i.e. re-position of light-generated carriers to its originated state) (Castillo et al., 2010);
-
The problems in transfer of light-generated carriers to the surface of particle for participating the redox reaction (because amorphous is a disorder arranged structure) (Wang et al., 2002).
In addition, the present photocatalytic rate was relatively slower than other nanoparticle-typed WO3 samples (Arutanti et al., 2014b). The main problem is due to the limitation of excessive light penetration. The present micrometer-sized catalyst is dense (as confirmed by BET analysis in Fig. 8), leading the WO3 catalytic sites are on the surface of the catalyst only. The catalytic sites inside the particle cannot be activated (Nandiyanto et al., 2013). However, micrometer-sized catalyst is the best choice for understanding the correlation between amorphous content and photocatalytic performance since the obstacles in the measurement (i.e. the particle size and quantum effect, as well as contamination from nano-catalyst to the characterized sample (Nandiyanto et al., 2017a)) can be minimized.
5 Conclusion
Correlations between the amorphous content and the photocatalytic characteristics of WO3 particles have been systematically investigated and discussed along with the theoretical consideration for the phenomena occurring during the photocatalytic process. To ensure the analysis, the amorphous content was controlled independently in the constant particle morphology and outer sizes by changing the temperature of the amorphous WO3 microparticles. The results showed that the amorphous content plays an important role in the photocatalytic process, where decreases in the percentage of amorphous have a direct impact on the enhancement of catalytic performance. The tendency for the influence of this parameter has been also confirmed by varying the catalyst loadings in the photocatalytic process.
Acknowledgements
RISTEK DIKTI (Grant-in-aid Penelitian Terapan Unggulan Perguruan Tinggi (PTUPT) and Penelitian Unggulan Strategies Nasional (PUSN)) is acknowledged.
References
- Photocatalytic degradation of pesticides by titanium dioxide and titanium pillared purified clays. Arabian J. Chem.. 2016;9:S313-S318.
- [Google Scholar]
- Some physico-chemical properties and catalytic activity of sulfate ion supported on WO3/SnO2 catalyst. Arabian J. Chem.. 2017;10:S439-S449.
- [Google Scholar]
- Preparation, characterization and catalytic activity of WO3 supported on sulfated tin oxide catalysts. Arabian J. Chem.. 2017;10:S705-S718.
- [Google Scholar]
- Photodegradation of rhodamine B over semiconductor supported gold nanoparticles: the effect of semiconductor support identity. Arabian J. Chem. 2014
- [Google Scholar]
- Synthesis of composite WO3/TiO2 nanoparticles by flame-assisted spray pyrolysis and their photocatalytic activity. J. Alloy. Compd.. 2014;591:121-126.
- [Google Scholar]
- Controllable crystallite and particle sizes of WO3 particles prepared by a spray-pyrolysis method and their photocatalytic activity. AIChE J.. 2014;60(1):41-49.
- [Google Scholar]
- Influences of porous structurization and Pt addition on the improvement of photocatalytic performance of WO3 particles. ACS Appl. Mater. Interfaces. 2015;7(5):3009-3017.
- [Google Scholar]
- Role of heterojunction ZrTiO4/ZrTi2O6/TiO2 photocatalyst towards the degradation of paraquat dichloride and optimization study by Box-Behnken design. Arabian J. Chem.. 2017;10(7):935-943.
- [Google Scholar]
- Photocatalytic degradation of an azo reactive dye, Reactive Yellow 84, in water using an industrial titanium dioxide coated media. Arabian J. Chem.. 2010;3(4):279-283.
- [Google Scholar]
- Enhancing photocatalytic activity of zinc oxide by coating with some natural pigments. Arabian J. Chem.. 2011;4(2):205-209.
- [Google Scholar]
- Reversible amorphization and the catalytically active state of crystalline Co3O4 during oxygen evolution. Nat. Commun.. 2015;6:8625.
- [Google Scholar]
- Highly efficient heterogeneous photooxidation of 2-propanol to acetone with amorphous manganese oxide catalysts. J. Am. Chem. Soc.. 1994;116(12):5334-5342.
- [Google Scholar]
- Flame-assisted synthesis of nanoscale, amorphous and crystalline, spherical BiVO4 with visible-light photocatalytic activity. Appl. Catal. B. 2010;95(3–4):335-347.
- [Google Scholar]
- Preparation of WO3/ZnO composite photocatalyst and its photocatalytic performance. Chin. J. Catal.. 2011;32(3–4):555-565.
- [Google Scholar]
- Explaining the high photocatalytic activity of a mixed phase TiO2: a combined effect of O2 and crystallinity. J. Phys. Chem. C. 2011;115(43):21161-21168.
- [Google Scholar]
- Effects of amorphous contents and particle size on the photocatalytic properties of TiO2 nanoparticles. Scr. Mater.. 2001;44(8–9):1195-1198.
- [Google Scholar]
- The effect of Pt nanoparticles distribution on the removal of cyanide by TiO2 coated Al-MCM-41 in blue light exposure. Arabian J. Chem. 2016
- [Google Scholar]
- A novel route for waste water treatment: photocatalytic degradation of rhodamine B. Arabian J. Chem.. 2011;4(4):383-387.
- [Google Scholar]
- Amorphous molybdenum sulfide films as catalysts for electrochemical hydrogen production in water. Chem. Sci.. 2011;2(7):1262-1267.
- [Google Scholar]
- Heterogeneous acid-catalyzed biodiesel production from crude tall oil: a low-grade and less expensive feedstock. J. Wood Chem. Technol.. 2015;35(5):374-385.
- [Google Scholar]
- Photocatalytic degradation of 1, 2-dichlorobenzene using immobilized TiO2/SnO2/WO3 photocatalyst under visible light: application of response surface methodology. Arabian J. Chem.. 2018;11(1):34-47.
- [Google Scholar]
- Macroporous anatase titania particle: aerosol self-assembly fabrication with photocatalytic performance. Chem. Eng. J.. 2009;152(1):293-296.
- [Google Scholar]
- Synthesis of spherical mesoporous silica nanoparticles with nanometer-size controllable pores and outer diameters. Microporous Mesoporous Mater.. 2009;120(3):447-453.
- [Google Scholar]
- Synthesis of spherical macroporous WO3 particles and their high photocatalytic performance. Chem. Eng. Sci.. 2013;101:523-532.
- [Google Scholar]
- Photodecomposition profile of organic material during the partial solar eclipse of 9 March 2016 and its correlation with organic material concentration and photocatalyst amount. Indonesian J. Sci. Technol.. 2016;1(2):132-155.
- [Google Scholar]
- Influences of temperature on the conversion of ammonium tungstate pentahydrate to tungsten oxide particles with controllable sizes, crystallinities, and physical properties. Indonesian J. Chem.. 2016;16(2):124-129.
- [Google Scholar]
- Correlation between crystallite size and photocatalytic performance of micrometer-sized monoclinic WO3 particles. Arabian J. Chem. 2017
- [Google Scholar]
- Decomposition behavior of curcumin during solar irradiation when contact with inorganic particles. IOP Conf. Ser.: Mater. Sci. Eng.. 2017;180:012135
- [Google Scholar]
- Photodecomposition profile of curcumin in the existence of tungsten trioxide particles. IOP Conf. Ser.: Mater. Sci. Eng.. 2018;306:012002
- [Google Scholar]
- Photocatalytic degradation of an organic pollutant by zinc oxide–solar process. Arabian J. Chem.. 2016;9:S1858-S1868.
- [Google Scholar]
- Photocatalytic decomposition of dyes using ZnO doped SnO2 nanoparticles prepared by solvothermal method. Arabian J. Chem.. 2014;7(1):71-77.
- [Google Scholar]
- In situ synthesis of copper nanoparticles on SBA-16 silica spheres. Arabian J. Chem.. 2016;9(4):537-541.
- [Google Scholar]
- Photocatalytic mineralization of antibiotics using 60% WO3/BiOCl stacked to graphene sand composite and chitosan. Arabian J. Chem. 2016
- [Google Scholar]
- Low-energy bead-milling dispersions of rod-type titania nanoparticles and their optical properties. Adv. Powder Technol.. 2014;25(5):1492-1499.
- [Google Scholar]
- Synthesis and photocatalytic activity of stable nanocrystalline TiO2 with high crystallinity and large surface area. J. Hazard. Mater.. 2009;161(2–3):1122-1130.
- [Google Scholar]
- The preparation and properties study of photocatalytic nanocrystalline/nanoporous WO3 thin films. Mater. Des.. 2002;23(3):331-336.
- [Google Scholar]
- Raman investigation of nanosized TiO2: effect of crystallite size and quantum confinement. J. Phys. Chem. C. 2012;116(15):8792-8797.
- [Google Scholar]
- Potential of amorphous materials as catalysts. J. Non-Cryst. Solids. 1986;79(3):217-245.
- [Google Scholar]
- Template-free facile preparation of monoclinic WO3 nanoplates and their high photocatalytic activities. Appl. Surf. Sci.. 2014;305:274-280.
- [Google Scholar]
- Ultrafast studies of electron dynamics in semiconductor and metal colloidal nanoparticles: effects of size and surface. Acc. Chem. Res.. 1997;30(10):423-429.
- [Google Scholar]


