

Translate this page into:
Amphipathic anionic surfactant modified hydrophilic polyethylene glycol-nanosilica composite as effective viscosifier and filtration control agent for water-based drilling muds
⁎Corresponding author at: Department of Petroleum Engineering, School of Chemical and Energy Engineering, Universiti Teknologi Malaysia, 81310 Johor Bahru, Malaysia. anam@utm.my (M.N.A. Mohd Norddin),
-
Received: ,
Accepted: ,
This article was originally published by Elsevier and was migrated to Scientific Scholar after the change of Publisher.
Peer review under responsibility of King Saud University.
Abstract
Highly stabilized and dispersible composites of polyethylene glycol and silica nanoparticle in aqueous drilling mud can provide desirable rheological and filtration properties for drilling jobs. Therefore, high-quality hydrophilic polyethylene glycol-nanosilica composite modified by amphipathic anionic sodium dodecyl sulfate (PEG-SiO2 NC-SDS) to improve the rheological and filtration properties of water-based muds (WBMs) was submitted. Test of zeta potential, functional groups, morphology, elemental composition, and temperature stability together with rheology and filtration tests were undertaken to assess the wide-ranging mud properties of the SDS modified PEG-SiO2 NC drilling muds. Zeta potential, FTIR, FESEM, EDX, and TGA results indicate that the SDS modified PEG-SiO2 NC was effectively formed and modified; it embodies exceptional thermal stability and is efficiently dispersed. The SDS modified PEG-SiO2 NC has a narrow size distribution range between 82 nm and 410 nm, and a specific surface area of 41.4 m2/g that is sufficiently high for particle-molecule interactions. Its rheological variables are notably shear-thinning and did not undergo notable fluctuation. The filtrate loss of 1.5 g SDS bearing PEG-SiO2 NC at 78 °F and 250 °F was only 5.4 ml and 9.6 ml, against 10.2 ml and 20.5 ml of the WBMs, respectively. High dispersion stability and high thermal stability aided its excellent viscosity and filtration control performance. Moreover, optimum rheological properties for the SDS modified PEG-SiO2 NC drilling muds with Bingham plastic and Ostwald-de-Waele models occurred with mud composition CD3 (CD3 = 1.5 g SDS modified PEG-SiO2 NC + WBM). Thus, this study can help to understand the applications of this nanocomposite as a potential viscosifier and filtrate loss control material for WBMs.
Keywords
Polyethylene glycol-nanosilica composite
Rheological and filtration properties
Bingham plastic model
Ostwald de Waele model
PEG-SiO2 NC-SDS

Nomenclature
- API FCT
-
API filter cake thickness
- API FL
-
API filtrate loss volume
- API
-
American petroleum institute
- AV
-
Apparent viscosity
- BaSO4
-
Barite
- BM
-
Base mud
- CD0
-
Complex base mud
- CD1
-
CD0 + 0.5 g NC
- CD2
-
CD0 + 1.0 g NC
- CD3
-
CD0 + 1.5 g NC
- CD4
-
CD0 + 2.0 g NC
- DI
-
Deionized water
- EDX
-
Energy dispersive X-ray
- FESEM
-
Field emission scanning electron microscopy
- FTIR
-
Fourier transform infrared spectrophotometer
- GS
-
Gel strength
- HPHT FCT
-
HPHT filter cake thickness
- HPHT FL
-
HPHT filtrate loss volume
- HPHT
-
High pressure high temperature
- Na2CO3
-
Soda ash
- NaOH
-
Caustic soda
- NC
-
Nanocomposite
- NC
-
PEG-SiO2 NC
- NP
-
Nanoparticle
- NPs
-
Nanoparticles
- PAC-R
-
Polyanionic cellulose reagent grade
- PEG
-
Polyethylene glycol
- PEG-SiO2 NC
-
Polyethylene glycol-nanosilica composite
- PEG-SiO2 NC-SDS
-
Polyethylene glycol-nanosilica composite with SDS
- PNC
-
Polymer nanocomposite
- PSD
-
Particle size distribution
- PV
-
Plastic viscosity
- S0
-
Spud mud
- S1-U
-
S0 + 0.5 g NC
- S2-U
-
S0 + 1.0 g NC
- S3-U
-
S0 + 1.5 g NC
- S4-M
-
S0 + 0.5 g NC
- S5-M
-
S0 + 1.0 g NC
- S6-M
-
S0 + 1.5 g NC
- SDS
-
Sodium dodecyl sulphate
- SiO2 NP
-
Silica nanoparticle
- SSA
-
Laser specific surface area
- TGA
-
Thermogravimetric analysis
- WBM
-
Water-based mud
- YP
-
Yield point
- ZP
-
Zeta potential
1 Introduction
An increase in the demand for energy globally has urged different energy-producing companies, in particular, the oil and gas industry to continually seek ways to improve the drilling fluid architecture. The success of drilling for oil and gas from underground natural reservoirs significantly depends on the type and performance of the drilling fluids (Caenn et al., 2017; Barrett, 2011). To simplify the drilling job, the performance of the circulation system of the rotary drilling rig is essential. The incorporation of drilling muds for the circulation process is an integral influence in the drilling process, in which a deep hole is drilled to the pay zone to create a wellbore (Darley and Gray, 1986; Gatlin, 1960).
Drilling mud is mixed in the mud pit (mud tank) and moved to the swivel by the action of the mud pump. Then, it flows via the Kelly, the Kelly bushing, the blow out preventer (BOP), down through the hollow drill string and bottom-hole assembly (BHA). It then flows through the jet nozzles in the drill bit; whereupon, it starts its trip back to the surface, picking up and transporting drilled cuttings up the hole through the annular space (annulus) between the drill string and the wellbore. Once the mud gets to the surface, it passes via the mud return-line to the solids control system and the gas-mud separator (Caenn et al., 2017; Chilingarian and Vorabutr, 1983).
Typically, drilling muds in carrying out the aforementioned obligations, has performed some tasks. It has provided support in the cooling of drill bit and its lubrication, lifting and suspending rock cuttings, ensuring wellbore stability to avoid rock caving into the wellbore, controlling the pore pressure of the formation to assure required well control, and ensuring formation of a low permeable mud cake, etc. (Al-Hameedi et al., 2019; Agwu and Akpabio, 2018; Barrett, 2011). To ensure that the aforementioned tasks and others are met and preserved, sufficient and suitable additives must be used to formulate the drilling muds for the desired rheological and filtration properties.
There are many workable additives applied today to formulate drilling muds that have exhibited outstanding qualities; these additives are xanthan gum, carboxyl methyl cellulose, partially hydrolyzed polyacrylamide, starch, guar gum, hydroxyl ethyl cellulose, etc. Nonetheless, these additives might have failed to perform desirably at higher drilling depth or when in contact with brine (Fuhua et al., 2012). Consequently, investigators have searched for substitute additives that are sustainable, cost effective, brine tolerance, and with high temperature stability, while also preserving the characteristics of efficient drilling muds (Fuhua et al., 2012). Drilling muds must solve the numerous obstacles encountered during the drilling process. For example, the drilling muds formulated with polymers at greater drilling depths and higher temperatures often displayed a reduction in viscosity and yield stress thereby reducing the muds ability to lift cuttings to the surface (Oseh et al., 2020a). Also, the undue loss of drilling muds into the filtrate channel without return (loss circulation) is another drilling issue being addressed in the oil and gas industry today. These issues are relatively easier to prevent and very costly to solve when they occur. Therefore, it is safer to build drilling fluids with smart additives that can provide reasonable control of the mud’s circulation, formation, viscosity, fluid loss, thickness of the filter cake, and clay swelling (Oseh et al., 2018; Ismail et al., 2016). Another challenge is that the drilling assemblies created during the drilling process are formed from metal, and as a result are vulnerable to corrosion. This scenario impacts the whole drilling process (Oseh et al., 2019a; Gbadamosi et al., 2018). An additive of drilling mud that has the desired corrosion inhibiting property can ably solve the corrosion problem.
Today, water-based mud (WBM) is more favoured to drill oil and gas wells since it is less costly and more ecologically friendly compared to non-aqueous drilling muds. Another unique attribute of WBM is its ability to accommodate different molecules, surfactants, or particles like nanoparticles (NPs) in its formulation to improve its basic properties. Within the NPs research for drilling muds, inorganic solid NPs like silicon dioxide or silica (SiO2) is the most examined. This is because of its several unique qualities. For example, SiO2 is easy to process and modified. It has high temperature resistance, strong bonding and adhesion feature, and less harmful to the environment (Davoodi et al., 2019; Fakoya and Shah, 2017). SiO2 NP can adsorb water to increase the viscosity of WBMs. Interaction force between the particles can increase to enhance the viscosity of drilling muds (Davoodi et al., 2019). It can also provide better sealing of the formation pores due to its smaller size compared to micro or macro particles. It is highly efficient to prevent stuck pipe incident, reducing torque and drag, and improving the stability of the wellbore (Majid et al., 2019; Ismail et al., 2016).
In recent times, the blending of polymer and NPs to form polymer nanocomposites (PNCs) is one field of interest that have yielded success within the petroleum research community. The advantages of combining polymeric functionality and nano-scale entity to improve different processes, more importantly the drilling muds have been reported in many studies (Kök and Bal, 2019; Davoodi et al., 2019; Aftab et al., 2017). These studies established that lubricity, rheology, lost circulation, and filtration control property of WBMs are enhanced with PNC agents. The high thermal stability and effective dispersion of PNCs increased their mud’s performance in terms of rheology and fluid loss control (Kök and Bal, 2019). The surface properties of PNCs and the level of their interaction with water molecules and other mud additives like sodium bentonite are vital for the performance of drilling muds (Fakoya and Shah, 2017). However, a suitable balance in the hydrophobic and hydrophilic feature of PNC materials must be maintained to facilitate their clustering at the interface and strong dispersion in aqueous medium (Oseh et al., 2020a).
Polyethylene glycol (PEG) is a water-soluble copolymer of alkaline oxide that can efficiently improve the rheological, filtration, and shale inhibiting properties of WBMs. It is a hydrophilic polymer of ethylene oxide and has low toxicity. It have been found to successfully replaced the earlier polyglycerols (Xu et al., 2018). It is a shear thinning additive that can self-assemble to help keep drilled cuttings together and improve mud properties. It was also found to effectively insert within the formation clay matrix to prevent filtrate loss thereby enhancing wellbore stability (Mech and Sangwai, 2016). It has strong inhibiting property and possesses tunable features that can easily combine with NPs such as SiO2 NPs (Oseh et al., 2019b; Abdollahi et al., 2018). Nevertheless, SiO2 NPs either used alone or in combination with a polymer matrix like PEG are often prone to aggregation and agglomeration due to its large surface energy and high hydroxyl (–OH) functionality (Mao et al., 2015). The agglomerates of SiO2 NP can lead to the composite poor performance and weak affinity with the polymer in application. Thus, a modification to endow stable surface is indispensable to enhance its dispersion in suspension and good contact with water molecules (Oseh et al., 2019b). These physical instabilities often result in the reduction of mud efficiency and thus has limited their on-field applications.
Going by the reports of different authors, polymer-SiO2 composites provide satisfactory performance in WBMs, such as increased thermal stability and resistance to brine if they are efficiently dispersed and stable in the drilling mud (Cao et al.; 2019; Oseh et al., 2019c; Qiao et al., 2016; Gradzik et al., 2011). To increase polymer-SiO2 composites dispersion, performance, and interaction with water molecules, the attachment of amphipathic anionic sodium dodecyl sulfate (SDS) solution on their surface was found to have efficiently contributed in ensuring these properties (Qiao et al., 2016). This is because if the surface modification of SiO2 NP is effective, the negative charge on the SiO2 surface will shift to the stable region (±30 mV according to zeta potential stability standard for colloids) depending on the modifier (surfactant) used.
SDS substance acts as a surfactant when it lowers the interfacial tension between the solution in which it is dissolved, and other phases that are present (e.g., solid particles like SiO2 in a liquid dispersion) (Ng et al., 2003; Touhami et al., 2001a). For polymer and SDS association, it causes micellization of the SDS though disturbed in the presence of the polymer (Rana et al., 2002; Amaya et al., 2002). When polymers interact with SDS, the SDS binds to the polymer in the form of aggregates (Touhami et al., 2001b). For the case of NPs like inorganic SiO2, SDS association with SiO2 NP results in hydrophobic interaction causing particles adsorption (Pengxiang and Munehide, 2016). Electrostatic repulsion occurred when SDS associates with nanocomposites (Pengxiang and Munehide, 2016).
Considerable studies conducted on surface modified SiO2 NPs focused mainly on the modification of only the commercial SiO2 NPs powder (Mahmoud et al., 2016; Elochukwu et al., 2017) and only a few of these studies conducted, modified the surface of synthesized hydrophobic polymer-SiO2 NPs for WBMs (Oseh et al., 2019b; 2019c). However, none of these studies available in open literature used SDS to modify composite of hydrophilic PEG and inorganic SiO2 NP. Therefore, this study tends to provide possibly new ways to prevent or reduce the aggregation or agglomeration, oxidation, and isolation of polyethylene glycol-nanosilica composite (PEG-SiO2 NC) particles with SDS in WBMs to accomplish three major conditions: first, that the surface of PEG-SiO2 composites is modified with anionic SDS to increase the mud’s dispersion, stability, and interaction with water molecules; second, that the modified additive provides the desired properties of drilling muds; and third, that the mud properties of the modified PEG-SiO2 NC outperformed that of the unmodified composites (synthesized PEG-SiO2 NC without SDS).
Hence, this study presents the impacts of SDS modified PEG-SiO2 NC material in WBMs towards rheology, filtrate loss control, filter cake thickness and permeability, pH, and density. To meet the three outlined conditions and fulfil the specified objective, the following tasks were carried out: the study goal was set; then, the materials were selected and the procedures including several laboratory characterizations and testings were carried out. Following that, the results reached and their interpretations were presented. Next, a conclusion was drawn by making a summary of the key findings based on the objectives and results obtained.
A summary of some of the PEG and SiO2 NP limitations in WBM that were addressed in this research through the use of SDS surface-modified (PEG-SiO2 NC) is presented in Fig. 1.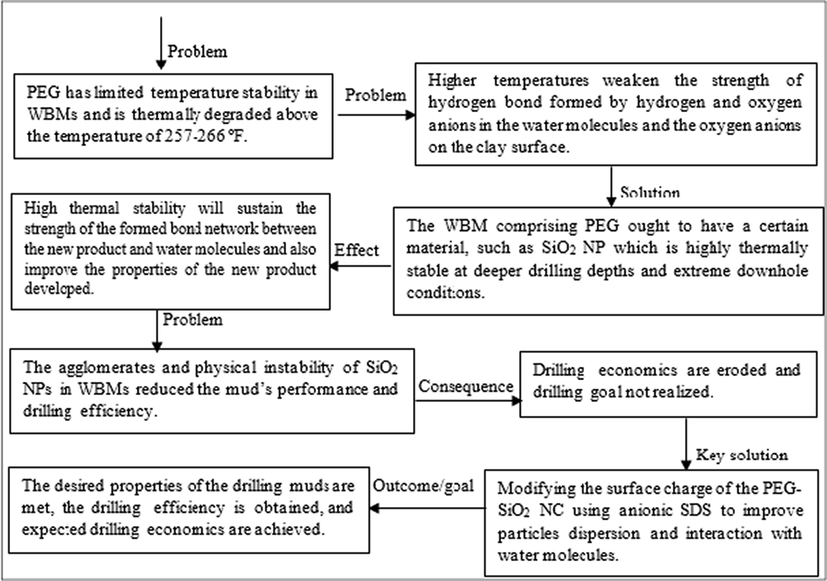
A summary of the PEG and nanosilica limitations in WBM.
2 Experimental
2.1 Materials
The chemicals used in the formulation of a spud mud and complex WBMs before incorporating the studied composites are bentonite, caustic soda (NaOH), soda ash (Na2CO3), xanthan gum (XG), polyanionic reagent (PAC-R), and barite (BaSO4). For the PEG-SiO2 NC, the following chemicals were used in its synthesis and modification: tetraethyl orthosilicate (TEOS reagent grade, 98%), polyethylene glycol (PEG 400), ammonium hydroxide solution (NH4OH) (ACS reagent, 28.0–30.0% NH3 basis; CAS number: 1336-21-6), ethanol (CH3CH2OH) (96%, AR grade; CAS number: 64-17-5), and sodium dodecyl sulfate (SDS; 100% concentration). These chemicals were all acquired from Sigma-Aldrich (Chemie, GmbH) and were used in their original state except SDS that was procured from QRëC quality reagent chemical (Asia Chemie Co., Ltd. Thailand). The physical and chemical properties of TEOS, SDS, and PEG are reported in Table 1.
Properties
Product specifications
TEOS
SDS
PEG
Function
Alkoxide of SiO2
Modifier
Viscosifier
CAS number
78–10–4
151–21–3
25322–68–3
Chemical formula
C8H20O4Si
NaC12H25SO4
C2nH4n+2On+1 (n = 8.2 to 9.1)
Appearance (form)
Liquid
Crystal solid
Liquid
Appearance (colour)
Colourless
White to yellowish
Colourless
Average molecular weight (g/mol)
208.34
288.3
400
Density (g/cm3) at 20 °C (lit.)
0.933
1.01
1.13
Melting point °C
− 77
206
4.0–8.0
Boiling point °C at 760 mmHg
168
—
greater than 200
Flash point °C
No data
No data
240
Dispersion properties
No data
Stable in cold and hot water
—
Solubility in water
Soluble (1.5 g/L)
Soluble (1.0 g/10 ml)
Soluble
Surface charge
Negative
Negative
—
Stability
No data
stable
No data
2.2 Laboratory procedures
2.2.1 Measurement of zeta potential of the procured TEOS
TEOS is a chemical compound with the formula Si(OC2H5)4 and is the most common alkoxide of silicon. It was used as a precursor for SiO2 and a SiO2 source in synthesizing PEG–SiO2 NC. Before it is used in the synthesis process, the magnitude of its zeta potential (ZP) was checked by dispersing 0.001 ml TEOS in 100 ml deionized (DI) water, as reported by Wang et al. (2006) to find out the inherent charge on its surface. The ZP level of the procured TEOS was examined using Malvern Instruments Inc., USA (ZSP Malvern Nano Zetasizer), and Fig. 2 shows the result from such examination. The result in Fig. 2 indicates that the TEOS has a high negative ZP of –0.7 mV magnitude, which epitomizes incipient instability that can cause rapid agglomeration of composite fluid.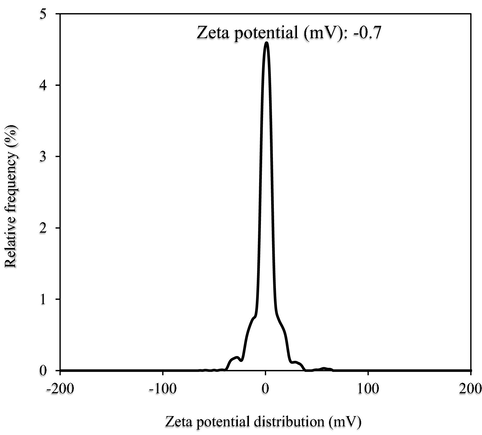
Surface charge of procured TEOS.
2.2.2 Synthesis and formation of PEG-SiO2 nanocomposites
PEG-SiO2 NC was prepared by a simple one-step protocol which includes the hydrolysis and condensation of TEOS in EtOH and water mixture under alkaline conditions at room temperature. This technique is chosen due to the simplicity in using hydrophilic ethanol solvent. An overview of the synthesis protocol is illustrated in Fig. 3. To synthesize, 10.5 ml TEOS was added into 100 ml EtOH and stirred for 10 mins at 149 °F (65 °C) and 300 rpm using a mechanical stirrer. Then, 28 ml NH4OH and 34 ml DI water was measured into a beaker and poured into the reactor. Next, 5 ml of PEG was introduced slowly into the reaction mixture dropwise. The mixture was stirred vigorously for 3 h at 149 °F (65 °C). After that, the mixture was centrifuged at 4000 rpm for 40 min, and the obtained composite was washed with DI water. Finally, the resulting composite was dried in an oven at 149 °F (60 °C) for 24 h to obtain the PEG-SiO2 NC. Fig. 4 presents the formation mechanism of the particles of the PEG-SiO2 NC.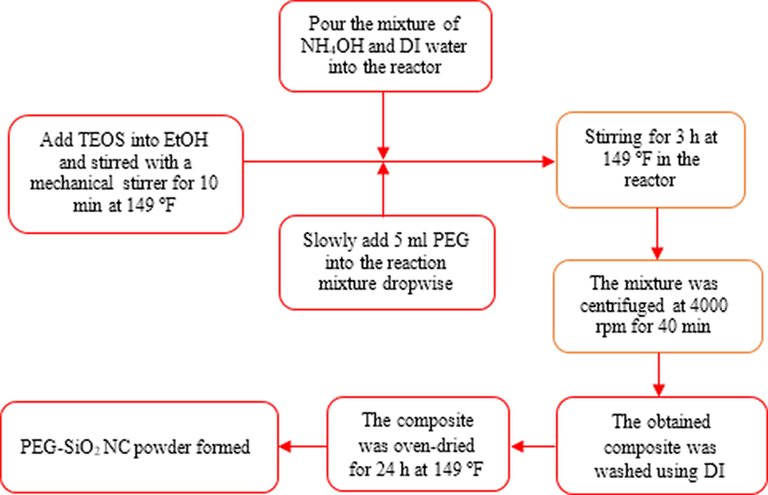
Synthesis process of PEG-SiO2 NC.
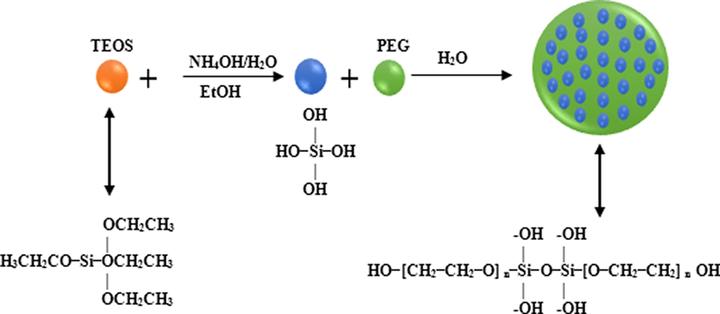
The formation mechanism of particles of the PEG-SiO2 NC.
2.2.3 Evaluating the zeta potential of synthesized PEG-SiO2 nanocomposites
After synthesizing the PEG-SiO2 NC, its ZP level was checked with a ZSP Malvern Nano Zetasizer at ambient temperature by dispersing 0.001 g NC in 100 ml DI water having 0.1 M NaOH and 0.1 M HCl and the pH was fixed at 4.0, as suggested by Jesionowski and Krysztafkiewicz (2001). The result of this investigation is shown in Fig. 5 and it shows that the ZP level of −24.6 mV is present on the surface of the synthesized PEG-SiO2 NC (unmodified), indicating slight instability approaching the stability region of −30 mV. With this ZP, the propensity of fast particles gelling and agglomeration in a dispersion can occur. This charge confirms that enough –OH groups are present on the PEG-SiO2 NC surface. The negative surface of the unmodified PEG–SiO2 NC is because of silanol groups deprotonation (Aissaoui et al., 2012). The implication of this charge in a WBM containing bentonite is the occurrence of possible electrostatic repulsive force between SiO2 NP and bentonite (Aissaoui et al., 2012); that is, mud deflocculation that can reduce the yield point and gel strength will occur. This is disadvantageous to the mud’s drilled cuttings lifting ability and suspension. For this purpose, anionic SDS was used to modify the SiO2-bearing surface of the synthesized PEG-SiO2 NC to prevent particle’s agglomerates and to cause effective mud’s dispersion.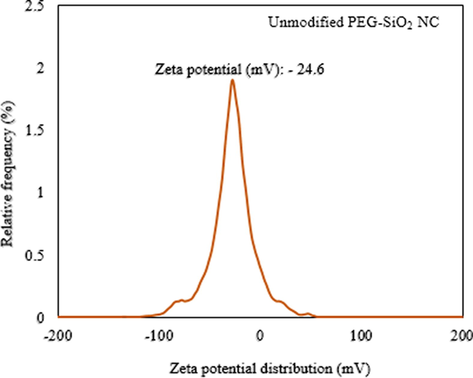
Average ZP of synthesized PEG-SiO2 NC (unmodified).
2.2.4 Functionalization of PEG-SiO2 nanocomposites
The often used organic modifier to modify the surface of SiO2 NP is the silane coupling agents (Daniel and Francis, 1998; Posthumus et al., 2004) and anionic SDS molecules (Qiao et al., 2016). Through condensation reaction, the –OH groups on the SiO2 surface reacts with silane or SDS molecules, at times with the support of a catalyst (Choi and Chen, 2003). This makes organic hydrophobic compounds to adhere to the hydrophobic phase to cause an adherence and modification at the surface (Xie et al., 2010). In this study, amphipathic anionic SDS surfactant that utilized aqueous mixing was used to modify the SiO2-bearing surface of the produced PEG-SiO2 NC. SDS is a surfactant with a polar head and a non-polar tail that enables it to self-associate or micellize in solution (Xie et al., 2010). It is a salt and organosulfate synthetic organic compound. Since SDS is soluble in water, the aqueous mixing technique is without an organic solvent and it provided a complete SDS and SiO2 dispersion. That is, there was perfect interaction (contact) between SiO2 and SDS in the functionalization reaction (Xie et al.,2010). The modification can participate to endow stabilized dispersed surface to the PEG-SiO2 NC.
The technique utilized for SDS functionalized PEG-SiO2 NC is based on previous study by Qiao et al. (2016), that uses the aqueous mixing technique. The aqueous mixing technique was conducted as follows: 3.5 vol% commercial SDS powder was added to 150 ml DI water in an Erlenmeyer flask. After that, the solution was subjected to magnetic stirring for 10 min until it dissolved. Next, the solution was vigorously stirred for 1 h to provide a good dispersion followed by centrifugation at 4000 rpm and spray drying at 150 °C after washing thoroughly with anhydrous EtOH to obtain the modified PEG-SiO2 NC-SDS. As SDS is rather soluble in anhydrous EtOH, any unreacted SDS can be removed completely by the thorough EtOH washing. Fig. 6 shows the SDS modification mechanism of the PEG-SiO2 NC.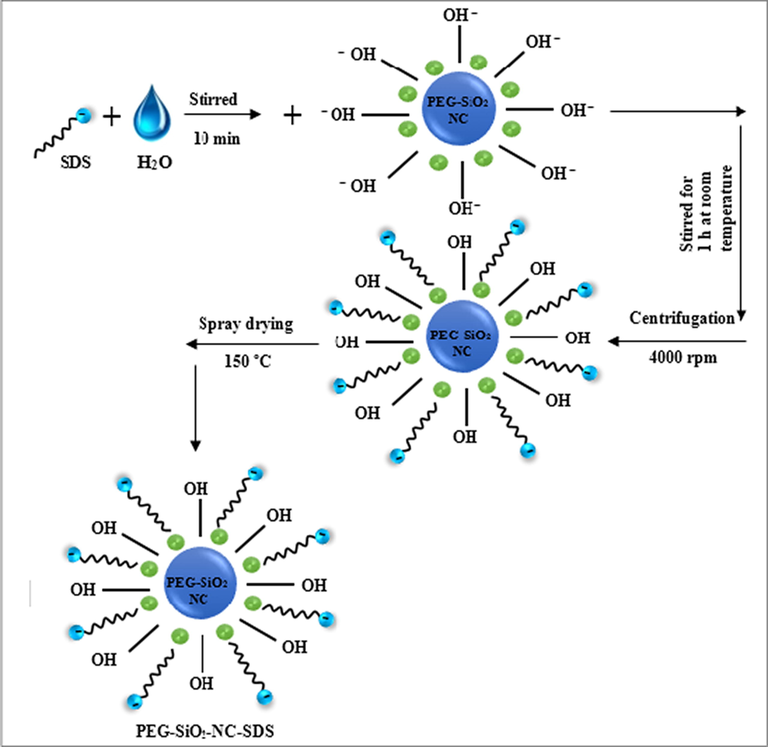
Surface modification of PEG-SiO2 NC by SDS.
2.2.5 Evaluating the effect of SDS on PEG-SiO2 nanocomposites
After the modification process, the influence of SDS on the studied PEG-SiO2 NC was checked through ZP to ascertain the nature of the charge present on the SiO2-bearing surface of the PEG-SiO2 NC. This check was to understand how SDS affects the stability of the PEG-SiO2 NC particles. From all the anionic surfactants, SDS is the most often applied and preferred due to its low-cost and ability to prevent particles oxidation and isolation. It has a C12 alkyl chain, which infiltrates the oil droplet and increase in the concentration of SDS in micro-emulsion electrolyte lessen the electro-osmotic flow (EOF) because of the increase in the ionic strength of the electrolyte. As an anionic surfactant, SDS can increase the hydrophilicity of PEG and can further partake in stabilizing the charge of SiO2 suspension (Qiao et al., 2016). As SDS absorbs water, it unsettles non-covalent bonds and break their interactions. As the intermolecular forces between aqueous molecule and SDS are much lower than those between two aqueous molecules, there will be reduction in surface and interfacial tension; hence, a stabilized interface will be obtained.
A ZSP Malvern Nano Zetasizer at ambient temperature was used to check the ZP of the modified material. 0.001 g PP–SiO2 NC-SDS in 100 ml DI water having 0.1 M NaOH and 0.1 M HCl at a constant pH of 4.0, as suggested by Jesionowski and Krysztafkiewicz (2001) was applied. The result obtained from this analysis is shown in Fig. 7, and it showed a ZP level of −51.5 mV, which indicates propensity of high stability of the particles in a dispersion (refer: Table 2) (Oseh et al., 2019a). By inserting –OH molecules, an anionic reaction took place between the SiO2-bearing negative surface of the PEG-SiO2 NC and the –OH molecules on the surface of the SDS, causing a shift in the negativity from −24.6 mV of PEG-SiO2 NC (Fig. 5) to −51.5 mV (Fig. 7) of the PEG-SiO2 NC-SDS. Consequently, a steric repulsive force between –OH molecules and silanol group (Si-OH) increases, resulting in a stabilized-dispersed system (Xie et al., 2010). For smaller size particles with high specific surface area, high magnitude of ZP (positive or negative) will confer stability. This is attributed to the ability of attractive forces to exceed forces of repulsion (Hanaor et al. 2012). Colloids or colloidal particles with low ZP (positive or negative) are liable to coagulation, whereas colloidal particles with high ZP (positive or negative) are stabilized electrically, and the description of ZP indicator is shown in Table 2 (Oseh et al., 2019a).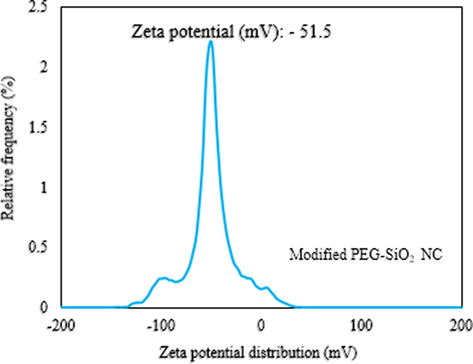
Average ZP of PEG-SiO2 NC-SDS (modified).
Stability character of colloids
ZP (mV).
Rapid coagulation
Between 0 and ± 5
Emerging instability
Between ± 10 and ± 30
Moderately stable
Between ± 31 and ± 40
Good (high) stability
Between ± 41 and ± 60
Exceptionally stable
Greater than ± 61
Thus, it can be stated that with the ZP data, the SDS modified PEG-SiO2 NC have a high stability that can confer good dispersion and effective interaction with WBM molecules as compared to the unmodified product, confirming the fulfilment of one of the research goals, which was to design a stable and dispersible material. This stability was further examined by different characterization techniques to understand the overall performance and attributes of the PEG-SiO2 NC-SDS.
2.2.6 Material characterization tests
2.2.6.1 Particle size distribution and laser surface area measurement
Briefly, the size distribution (PSD) of the studied PEG-SiO2 NC (modified and unmodified) and its specific surface area (SSA) were checked using Mastersizer-Malvern 3000, USA that utilizes particle size instrument (LD-laser diffraction). The LD analyzer uses PSD and allows the measured sample PSD for direct measurement. In this measurement, dried NC powders were allowed to be dispersed in 100 ml DI water. After the dispersion, 1.0 ml of the wet powders were put into the LD analyzer cell and as a light beam of LD flowed across the cell, the light got scattered by the wet powders and a scattered pattern at 52 indicators was achieved. Thus, the PSD of spheres that provide an equivalence in the scattering pattern and the laser SSA based on the distribution of the spherical particles diameter were obtained.
2.2.6.2 Fourier transform infrared spectrophotometer and energy dispersive X-ray spectrophotometer
The Fourier transform infrared spectrophotometer (FTIR) spectra of PEG-SiO2 NC with/without SDS were carried out by FTIR analyzer SHIMAD 24 IR Tracer-100 instrument. Briefly, 0.002 g of the solid samples (PEG-SiO2 NC with/without SDS) were mixed with a dried KBr pellet of 0.02 g. The specimens were pressed into 0.001 KBr pellets. The measurement spectra were registered at a scan resolution of 4 cm−1 against KBr from 400 cm−1 to 4000 cm−1. The reason for this measurement is to understand the chemical bonds and functional groups present in the PEG-SiO2 NC-SDS and PEG-SiO2 NC.
2.2.6.3 Field emission scanning electron microscopy
To explicate the molecular structures and morphological changes of the PEG-SiO2 NC (modified and unmodified), field emission scanning electron microscopy (FESEM-Zeiss, Germany) of 6.0 KX magnification was used and the amount of sulphur, sodium, silicon, oxygen, and carbon in the samples of PEG-SiO2 NC-SDS and PEG-SiO2 NC were studied by energy dispersive X-ray (EDX).
2.2.6.4 Thermogravimetric analysis
The attached amount of SDS on PEG-SiO2 NC was examined in a thermal gravimetric analyzer (TGA-Build 39, Q500V20.13, German). In the TGA, the rate of heating of 0.002 g of the PEG-SiO2 NC (modified and unmodified) from 30 °C to 600 °C was 10 °C/min heated under a nitrogenous flow. In this analysis, the weight of the PEG, SDS, PEG-SiO2 NC-SDS, and PEG-SiO2 NC samples were measured and plotted against temperature to evaluate the thermal behaviour of the materials.
2.3 Drilling fluids formulation
Two systems of WBMs were formulated to achieve the objectives of this study. These drilling muds are spud mud and complex drilling muds formulated with different additives.
2.3.1 Spud mud formulation
The first drilling mud formulated is an unweighted water-bentonite-NaOH spud mud. This mud is used to start the drilling of a well after the rig has been examined and all of the systems tested. Its application can continue up to the drilling of first-hundred feet of hole (Nyland et al., 1988). After its formulation, different concentrations of the synthesized PEG–SiO2 NC with or without SDS modification were added into the water-bentonite-NaOH spud mud to test for their mud properties, such as pH, density, rheological and API fluid loss volume without aging at 78 °F. The formulation of this muds is according to the API recommended standard bulletin of fluid test conditions for water-based drilling fluids (API RP 13B-1, 2017). The following concentration in grams (g) and sequence were followed to formulate the water-bentonite-NaOH-based spud mud:
Spud mud (base mud) = 320 ml tap water + 25 g sodium bentonite + 0.15 g NaOH.
After the spud mud formulation, other drilling muds which are the unmodified and SDS modified PEG–SiO2 NC were formulated and represented as shown in Table 3.
Mud samples
Composition
Operating Temperature
78 °F
S0
Spud mud
S1-U
S0 + 0.5 g NC
S2-U
S0 + 1.0 g NC
S3-U
S0 + 1.5 g NC
S4-M
S0 + 0.5 g NC
S5-M
S0 + 1.0 g NC
S6-M
S0 + 1.5 g NC
2.3.2 Rheological properties measurements of spud muds with Fann 35 viscometer
To characterize the rheological properties, such as plastic viscosity (PV), apparent viscosity (AV), Yield point (YP), and gel strength (GS), Fann 35-viscometer model was applied. The viscometer dial data were then changed to equivalent shear stresses by applying befitting conversion factors. Afterwards, the shear stresses and effective viscosities were estimated with a non-Newtonian fluid model. The Fann 35-viscometer model consist of a plane concentric cylindrical surface and is broadly utilized in the industry for inspecting drilling fluid viscosity (Kelessidis et al., 2006). Fluids tests conducted with a 6-speed Fann 35-viscometer can achieve efficient approximations of fluid flow behaviour and yield stress. Fann viscometers are typically used and often selected to understand the lifting and suspension capabilities and to indicate solids accumulations, solids flocculations or deflocculations; it is also needed for drilling fluid hydraulic estimation. Furthermore, it is predominantly applied for the measurement of drilling fluid shear-stress/shear strain-rate relationship-from which viscosities and yield stress can be evaluated directly with a two-parameter Bingham plastic model. The instrument is also used to measure fluid thixotropic character and gelation can also be determined using this equipment. The two controlling viscometer readings of Fann 35-viscometer are the spinning rotor and deflection bobs, which are required for wall shear-rate prediction. Dial readings obtained by bob deflection in a known spinning rotor are equivalently changed into shear-stress with practicable precision (Kelessidis et al., 2006).
The data applying to shear-stress at several shear-rates between 5.11 s−1 and 1022 s−1 were registered along with the equivalent dial readings tested between 3 rpm and 600 rpm. Thereafter, the rheological properties were fitted using Eqs. (1) – (3). The measurements were conducted thrice to validate accuracy and the average data obtained were recorded.
2.3.3 Complex drilling mud formulation
The formulation of complex drilling mud without NC (base mud system) was planned to reach a density of approximately 9.5 ppg, as reported by Fattah and Lashin (2016) to be within the domain of optimal density (9.0 to 10 ppg) for WBMs. To formulate the base mud, 450 cm3 of mud, which is equivalent to one laboratory barrel was prepared to meet the objectives of this study. Tap water (base liquid), sodium bentonite (for viscosity and control filtrate loss), NaOH (to modify pH), and Na2CO3 (to disperse sodium bentonite) were used to formulate the base-aqueous mud. Other additives used are XG (to serve as viscosifier and suspend drilled solid particles), PAC-R (to control filtrate loss), and BaSO4 (for weight control). After the base mud formulation, only SDS modified NC were added to check the impact of this concentrations on the base mud rheological and filtration properties behaviour. The SDS bearing NC was used because the spud mud data of the SDS modified NC (MS-4, MS-5, and MS-6) showed better stability and enhancement of the water-bentonite-NaOH spud mud (S0) properties than the unmodified NC (US-1, US-2, and US-3). Prior to the formulation, the four concentrations of the SDS modified NC were dispersed into 100 ml of distilled water and sonicated for 2 h before they are introduced into the base mud system immediately after barite blending. The added 100 ml of distilled water was subtracted from the total volume of the water used to formulate the SDS modified NC drilling muds.
The following concentration in grams (g) and sequence and were followed to formulate the complex drilling mud (base mud) system:
Complex drilling mud (base mud) system = 450 ml tap water + 15 g sodium bentonite + 0.25 g NaOH + 0.25 g Na2CO3 + 0.20 g XG + 2.0 g PAC-R + 34 g BaSO4.
After the base mud formulation, different concentrations (0.5 g, 1.0 g, 1.5 g, and 2.0 g) of only the NC with SDS modification were formulated and represented in Table 4.
Mud samples
Composition
Operating Temperatures
78 °F and 250 °F
CD0
Base mud system
CD1
CD0 + 0.5 g NC
CD2
CD0 + 1.0 g NC
CD3
CD0 + 1.5 g NC
CD4
CD0 + 2.0 g NC
2.4 Rheological properties characterization of complex drilling muds
This section presents the test of rheological behaviour of all the complex drilling mud samples using a standardized rotational rheometer.
2.4.1 Rheological properties test with rotational rheometer
Rheometry technique is applied to examine the rheological performance of a material and rheology involves the study of a material when it flows or distorts. Thus, rheology defines forces and distortions of a material over a period of time (Caenn et al., 2017). The NC’s rheological description is essential to provide adequate understandings into the flow characteristics against distortion and physical stability of a material. Therefore, rheological tests of SDS bearing NC mud samples were examined using a Rotational Rheometer (Cylindrical Coaxial Brookfield RST Rheometer) armed with water bath and temperature regulator for high temperature environments. The rheometer is branded with a robust and fast couple system attached for trouble-free spindle, and a testing compartment to hold the cylindrical coaxial spindle and mud sample for rheological examination. It has the capacity to generate results of shear-rate/viscosity and shear-rate/shear-stress at a specified temperature conditions. All the rheological testings of SDS bearing NC mud samples were performed under the shear-rate range of 1.0 s−1 to 250 s−1 and temperatures varied up to 78 °F and 250 °F in triplicate to establish data precision. Before making any test, the rheometer arrangement was standardized by measuring with tap water at variable temperatures. Afterwards, the NC samples with SDS were transferred into the cylindrical coaxial apparatus and tested. The uncertainty of this test is that in the rotational rheometer, the shear-rates were fixed and the mud viscosity was tested. However, in the borehole drilling environment, the shear-rate quite varies and it depends on both the inherent geometry and the fluid saturation hindering the aqueous flow.
2.5 API filtration properties tests
A filtrate loss test defines the relative efficiency of a drilling mud to preserve its aqueous phase or to lose a part of its aqueous phase as a filtrate (Khalifeh et al., 2019). The static fluid loss amount and filter cake thickness of all the mud samples were determined using an API-approved filter press (Fann filter press-300 series). The test was carried out at 78 °F and at 100 psi introduced via a cylinder-containing nitrogen from the top and the mud samples pass via a filter paper positioned at the bottom of the cylinder. The test for each mud sample was performed for 30 min and the muds that seep via the filter paper were obtained in a test tube. The amount of the muds that seep via the filter paper was visually checked and recorded in ml as the API fluid loss amount (API FL). Vernier caliper was used to check how thick was the filter paper containing the deposited muds and recorded as the API filter cake thickness (API FCT) in mm.
2.6 High pressure high temperature filtration properties tests
High pressure high temperature (HPHT) filtration properties tests of all the mud samples were measured to determine the HPHT FL and HPHT FCT using HPHT Fann filter press-series 3000. The procedure used to achieve the API filtration properties tests was followed, but in this case, the differential test pressure applied across the filtration equipment is 500 psi (that is at a regulated pressure of 600 psi and a backpressure of 100 psi) and temperature in the heating jacket was 250 °F. After 30 min, the HPHT FL was checked and subsequently the formed filter cake (HPHT FCT) was recorded. For precision, the measurements both under API and HPHT conditions were carried out twice before registering the average value of each sample.
3 Results and discussions
The results obtained from this study are sub-divided into three categories, namely detailed material characterization results, spud mud results, and complex drilling mud results. These results are presented and discussed next.
3.1 Material characterization results
3.1.1 PSD and laser SSA results
The PSD and laser SSA data of SDS-free PEG–SiO2 NC and PEG–SiO2 NC with SDS are presented in Fig. 8a, b, and c, respectively. The nature of the curves is identical, but PEG–SiO2 NC with SDS sample (Fig. 8b) indicated a slight broader distribution of particles as compared to the SDS-free PEG–SiO2 NC sample (Fig. 8a) because of increase in micro molecules (SDS molecules) in the modified particles (Fig. 8b) (Mao et al., 2015). Furthermore, the particles of both NCs are largely found not beyond 410 nm, wherein the SDS-free PEG–SiO2 NC particles ranged between 65 nm and 380 nm with a D50 (median diameter) of 182 nm and 118 nm mean diameter (Fig. 8a). For the SDS bearing PEG–SiO2 NC sample, the particles are distributed within the range of 82 nm to 410 nm with a D50 (median diameter) of 195 nm and 144 nm mean diameter (Fig. 8b). This data point out that both PEG–SiO2 NC particles with/without SDS contain narrow range of size distribution within the nanometer domain.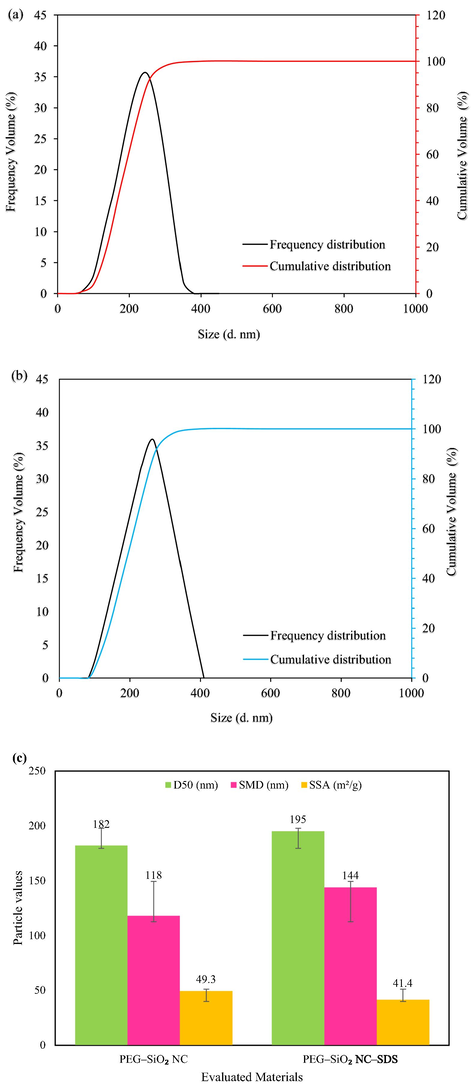
PSD data of PEG-SiO2 NC (a) without SDS (b) with SDS, and (c) Laser diffraction D50, SMD, and SSA of PEG-SiO2 NC with and without SDS.
A particle SSA is the means solid particles adopt to interact with the drilling fluid system. The particle SSA per unit mass or volume rises with a reduction in the size of the particles. A larger particle SSA implies better grip of particles, higher cohesion, and the larger contact area of the particles with other particles or molecules (Mao et al., 2017). The data of laser SSA of SDS-free PEG–SiO2 NC and PEG–SiO2 NC with SDS are summarized in Fig. 8c. The evaluated PEG–SiO2 NC both with/without SDS showed a significantly high average SSA of 49.3 m2/g for unmodified and 41.4 m2/g for modified. These SSA values are practically sufficient to cause strong interaction with the base mud additives.
3.1.2 FTIR result
The FTIR peak assignments were represented in Figs. 9 and 10 plotted in transmittance (%) and wavenumber (cm−1). Fig. 9 presents the difference in FTIR spectra of SiO2 and SDS-free PEG-SiO2 NC. These spectra clarify whether the synthesis of the newly-developed PEG-SiO2 NC was effectively conducted in aqueous medium and if PEG and SiO2 are combined successfully through bonding network. In Fig. 9, the transmittance peak at 3441 cm−1 was allocated to –OH groups on the particle surface of both SiO2 (Fig. 9a) and PEG-SiO2 NC (Fig. 9b) (Oseh et al., 2020a). The small peak that appeared at 1701 cm−1 in both particles was ascribed to H-O-H bond, in which the hydrogen atom from a C–H group (alkane) was replaced with an –OH groups thereby permitting the association of the molecules via H–bonding (Qiao et al., 2016). The transmission peak at 1101 cm−1 that appeared in both the spectra of SiO2 (Fig. 9a) and PEG-SiO2 NC (Fig. 9b) was due to the Si–O–Si groups stretching vibration. Two other transmittance peaks found at 490 cm−1 and 800 cm−1 belonged to the Si–O stretching vibration (Xu et al., 2018). All these transmission peaks belonged to SiO2 (Fig. 9a) and were found in the peak assignment of PEG-SiO2 NC (without SDS) shown in Fig. 5b. Moreover, the characteristic peaks that appeared at 1400 cm−1 and 3001 cm−1 (Fig. 9b) belonged to the alkyl groups due to bending and stretching vibrations, respectively. A classic characteristic peak that occurred at 960 cm−1 of C–H (methylene) group corresponds to –CH2 of PEG. These peaks occurred in the spectrum of PEG-SiO2 NC in pink spotted lines (Fig. 9b) but were absent in SiO2 spectrum depicted in (Fig. 9a), validating the successful formation of the PEG-SiO2 NC particles.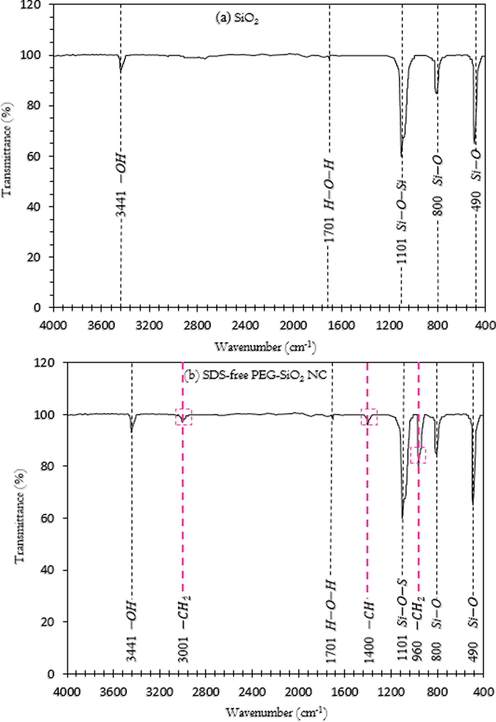
FTIR spectra of (a) SiO2 and (b) SDS-free PEG-SiO2 NC.
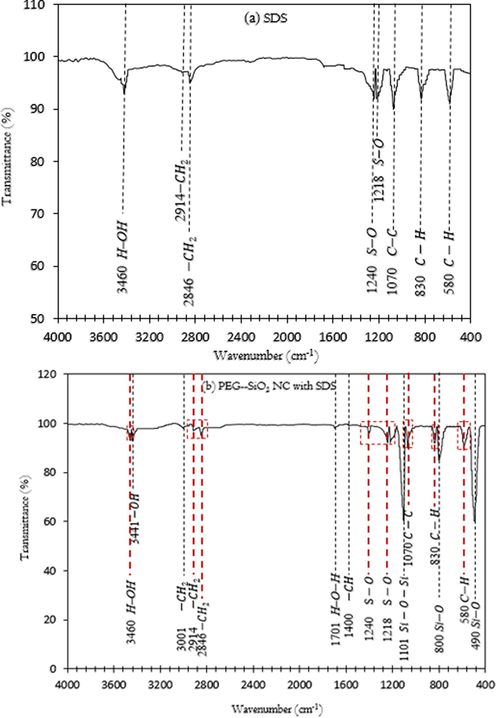
FTIR spectra of (a) SDS powder and (b) PEG-SiO2 NC with SDS.
The FTIR spectra of SDS and PEG-SiO2 NC with SDS investigated to verify the success of inserting SDS molecules on the PEG-SiO2 NC surface are shown in Fig. 10. In Fig. 10a, the spectrum ascribed to SDS has the following characteristic peaks: the transmission peak at 3460 cm−1 belonged to H–OH stretching vibration, while the two peaks at 2914 cm−1 and 2846 cm−1 belonged to CH2 group of SDS molecules stretching and bending vibrations. The peaks at 1240 cm−1 and 1218 cm−1 encompass the S–O stretch bridge and they correspond to the skeletal mode. The transmittance peak found at 1070 cm−1 belonged to C–C stretch, while the two peaks that occurred at 580 cm−1 and 830 cm−1 were ascribed to C–H asymmetric bending mode of the CH2 group (Qiao et al., 2016). These peaks all belonged to the SDS spectrum (Fig. 10a) and they are all found in the spectrum assignment of PEG-SiO2 NC with SDS indicated in red spotted lines, as shown in Fig. 10b. Through the FTIR analysis, it was found that SDS molecules are present on the synthesized PEG-SiO2 NC surface. Thus, newly-developed PEG-SiO2 NC was dispersed by using SDS surfactant; protecting the PEG-SiO2 NC from oxidation and isolation.
3.1.3 FESEM and EDX results
The FESEM technique was introduced to investigate the morphology of the newly-developed PEG–SiO2 NC with/without SDS. The motive for this investigation is to comprehend the morphological features of these materials and to ascertain the performance of SDS in the modified PEG–SiO2 NC. The morphological configuration of these materials are depicted in Fig. 11. The FESEM micrograph of PEG–SiO2 NC without modification depicted in Fig. 11a showed that the particles of PEG-SiO2 NC is spherical with partial aggregation. The particles tend to stick and cluster to each other to form an aggregates. The particle’s aggregation may possibly be the results of non-uniform TEOS self–assembly (Qiao et al., 2016). According to the FESEM morphology, the particle size of PEG-SiO2 NC was around 200 nm.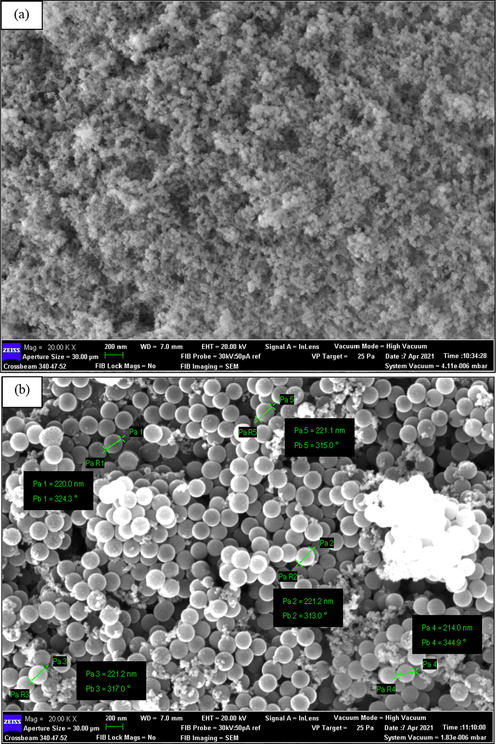
FESEM morphology of PEG–SiO2 NC (a) without SDS, and (b) with SDS.
In Fig. 11b of the PEG-SiO2 NC with SDS, the particle’s morphology was a general particulate, which is a SiO2–PEG core shell particles supported by SDS (Xu et al., 2018). The particles are well–dispersed and the morphology mainly contain individual separated particles because of the support from SDS. The few clustered white spot that appeared in the morphology could be unreacted SDS or SiO2 and this cannot adversely impact the physical properties of the newly-developed PEG–SiO2 NC with SDS (Qiao et al., 2016). Moreover, the morphology indicates a particle size of about 200 nm, which is consistent with the PSD results.
EDX method is an accessory to electron microscopy like FESEM or TEM gadgets. The EDX examination was introduced to detect the elements that constitute the newly-developed PEG–SiO2 NC with/without SDS. Fig. 12a and b presents the elemental composition of (a) PP–SiO2 NC without SDS and (b) PEG–SiO2 NC with SDS. The elemental composition showed that the synthesis and modification protocols were effective. The elements that occured in both tables (insets) in Fig. 12a and b are O (Oxygen), C (Carbon), and Si (Silica). From this examination, H (hydrogen) which is the lightest of all elements was not found, nonetheless a notable amount of the element possibly exists. From the table (inset) displayed in Fig. 12b, the newly-developed PEG–SiO2 NC with SDS exhibits the presence of Na (Sodium) and S (Sulphur), which were not seen in the EDX spectroscopy of synthesized PEG–SiO2 NC without modification (Fig. 12a). The EDX spectra further corroborate that PEG and SiO2 were combined successfully to form the PEG–SiO2 NC and effectively modified to produce PEG–SiO2 NC–SDS.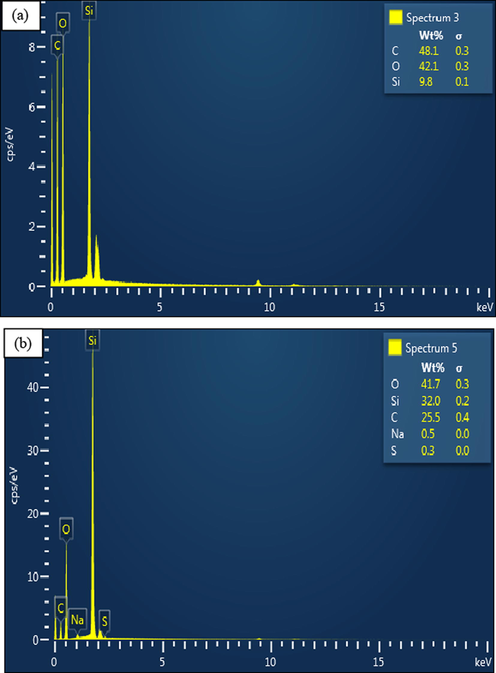
EDX spectra of PEG–SiO2 NC (a) without SDS, and (b) with SDS.
3.1.4 TGA results
The TGA data of PEG, SDS, and PEG-SiO2 NC with/without SDS are shown in Fig. 13. When examining the Fig. 13, it seems that two thermogravimetric stages occurred overall. There is no weight loss for both PEG and SDS from 30 °C to 100 °C. The first (initial) weight loss occurred between 101 °C and 250 °C for PEG, while that of SDS occurred between 151 °C and 200 °C, and this phase recorded a small margin of weight loss, which may perhaps, is due to complete exclusion of moisture content in the PEG and anionic SDS, since the boiling point of water is 100 °C (Xu et al., 2018; Qiao et al., 2016). A very sharp decrease in the thermogravimetric curve was observed for the PEG and SDS, and this stage represents the final weight loss; the weight loss is from 251 °C to 400 °C for PEG, and between 201 °C and 326 °C for SDS. For the SDS, the weight loss is due to its phase change as it has a melting point range between 205 °C and 210 °C (Qiao et al., 2016), while the degradation of PEG molecules is the cause of PEG weight loss (Xu et al., 2018).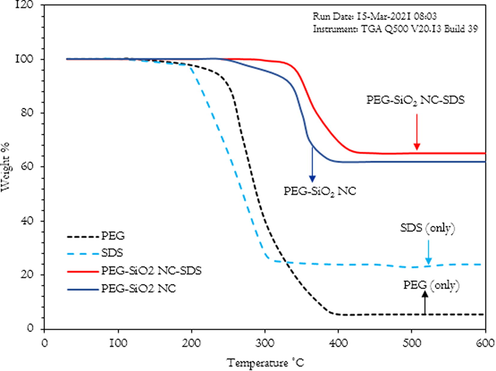
Thermal stability of PEG, SDS, PEG–SiO2 NC, and PEG–SiO2 NC–SDS.
For the PEG–SiO2 NC, there is no weight loss from 30 °C to 240 °C; its initial weight loss occurred from 270 °C to 350 °C, which is due to the disintegration of –OH ions and its final thermogravimetric curve occurred from 351 °C to 400 °C, and remains constant from 400 °C up to 600 °C, and this phase suffered a quite severe weight loss, which is as a result of deterioration of PEG molecules (Xu et al., 2018). For the SDS modified PEG-SiO2 NC, there is no weight loss from 30 °C to 340 °C and the only weight loss observed occurred between 341 °C and 450 °C, and in this phase, the weight loss is quite sharp. It remains unchanged from 450 °C to 600 °C; it is caused by the degradation of the particles of SDS and PEG molecular chains (Qiao et al., 2016). Thus, the increase in the SDS modified PEG-SiO2 NC residual weight validates the inclusion of SDS on the surface of the modified PEG-SiO2 NC. In general, the newly-developed PEG-SiO2 NC with/without SDS possess satisfactory thermal stability.
3.2 Spud mud results
Tables 5 and 6 present the Viscometer data and estimated rheological properties of water-bentonite-NaOH spud mud with different contents of SDS-free PEG-SiO2 NC and PEG-SiO2 NC with SDS at 78 °F. Spud mud used onshore is typically a WBM purposely formulated for drilling a well to a shallow depth from surface.
Operating temperature = 78 °F
Fann 35 Viscometer dial readings
Concentration (g)
Acronyms
1022
511
340
170
10.2
5.11
0.0
S0
22
14
11
8
5
3
0.5
S1-U
23
13
12
10
6
4
1.0
S2-U
28
17
14
11
7
5
1.5
S3-U
33
21
14
11
7
5
0.5
S4-M
33
22
15
12
8
6
1.0
S5-M
38
25
17
14
9
7
1.5
S6-M
40
26
20
16
11
9
Operating temperature = 78 °F
Compositions of spud mud samples
Properties
Units
S0
S1-U
S2-U
S3-U
S4-M
S5-M
S6-M
pH
8.5
8.5
8.5
8.5
8.5
8.5
8.5
Density
ppg
8.6
8.6
8.6
8.6
8.7
8.8
8.8
AV
cP
11
11.5
14
16.5
16.5
19
20
PV
cP
8
10
11
12
11
13
14
YP
lb/100ft2
6
7
8
9
11
12
12
YP/PV
0.75
0.70
0.73
0.75
1.0
0.92
0.86
10 s GS
lb/100ft2
4.2
4.5
5.0
5.7
4.7
5.2
6.2
10 min GS
lb/100ft2
5.5
5.8
6.1
6.4
5.9
6.4
7.1
3.2.1 pH and density data of spud mud
pH level indicates the liquid hydrogen ion concentration (H+) and it is a measure of how acidic or alkaline is the drilling fluid. The study of pH is integral in the control of drilling fluids properties, especially the rheology. Fluids pH impacts the effectiveness and solubility of chemicals and clay dispersion (Singh and Dutta, 2018). A modification in the level of pH during drilling often represents contamination by materials, such as gypsum, cement, or carbon dioxide. Studies revealed that drilling mud pH ought to be preserved at level between 8 and 10, because increasing mud pH will raise its rheological parameters (Singh and Dutta, 2018). Table 6 presents the pH data of water-bentonite-NaOH spud mud with different contents of SDS-free PEG-SiO2 NC and PEG-SiO2 NC with SDS at 78 °F. The pH level of the spud mud at 8.5 remained unchanged with both SDS-free PEG-SiO2 NC and PEG-SiO2 NC with SDS, which is due to PEG inability to alter the pH of aqueous solution as it is not a surfactant.
Also presented in Table 6 is the density of the spud mud with three concentrations (0.5 g, 1.0 g, and 1.5 g) of PEG-SiO2 NC-SDS. For the mud density, precise data on the changing character of fluid variables, especially the density of drilling mud is indispensable for designing a fruitful drilling program under such environment. The mud density constantly changes along with reduction in temperature and rise in pressure for HPHT wells. In typical conventional drilling, the mud density ought to be in surplus of the equivalent fluid pressure of the drilled formation to avert any incursion of formation fluids into the drilled hole (referred to as kicks) (Fattah and Lashin, 2016). As shown in Table 6, the density of the spud mud at 8.6 ppg was constant with SDS-free PEG-SiO2 NC, but slightly changed to 8.7 ppg (S4-M) and remain constant at 8.8 ppg for S5-M and S6-M. The little variation in density could be due to more solids content of the PEG-SiO2 NC-SDS (Oseh et al., 2020a).
3.2.2 Rheological properties data of the spud mud
The rheological data of all the spud muds showed that the interaction of PEG-SiO2 NC with or without SDS and base mud additives generally changes the rheological parameters (AV, PV, YP, YP/PV, and GS), as presented in Table 6.
3.2.2.1 Apparent and plastic viscosity data
The applied fluid shear-stress upon shear-rate defines the AV and is a strong indicator of the fluid ability to flow (Caenn et al., 2017). PV indicates the measure of internal friction of a transporting fluid. Fluids having high viscosities oppose flow because their molecular compositions provide the molecules with much internal friction. The larger the shear-stress resistance, the larger the viscosity (Luo et al., 2017). Naturally, fluids with more solids content possess higher viscosity thus making it more viscous. In contrast, less solids content fluids make the mud thinner. As represented in Table 6, the base-spud mud displayed an increment in viscosities-both AV and PV. For S1-U, an increase in PV was observed by 25%. Also, it increases by 37.5% and 50% for S2-U and S3-U, respectively, whereas the modified samples, S4-M, S5-M, and S6-M showed a higher PV increase by 37.5%, 62.5%, and 75%, respectively. The AV data follow the same trend like the PV where it increases by 4.5% S1-U, 27.3% S2-U, and 50% S3-U, and a larger percent increment was observed with the SDS modified NC; it showed a very interesting phenomenon in which the base mud (S0) viscosity increases with S4-M, S5-M, and S6-M by 50%, 72.7%, and 81.8%, respectively. It has been found that viscosities normally increase when PEG content increases or PEG average molecular weight increases (Xu et al., 2018).
Furthermore, PEG can be used to improve the dispersion stability of aqueous solution. At low concentrations, PEG can increase the viscosities of the aqueous-based mud by imparting the viscosities of the base mud (Xu et al., 2018). After PEG-SiO2 modification by SDS, the –OH amounts on the surface of the PEG-SiO2 NC-SDS particles are less than that on the PEG-SiO2 NC particles due to the SDS ability to decrease the hydroxyls (Qiao et al., 2016). As reported in earlier works, the surface of SiO2 particle has both Lewis and Brønsted acid locations, and only the sites of Brønsted acid is capable of providing protons needed for the interaction between the aqueous solution and silanols at the surface with the association of Si–O–H groups and the modifier (Wang et al., 2006; Poncet-Legrand et al., 2001; Mathieu et al., 1971). This interaction will assure increased intermolecular forces of drilling muds resulting in viscosities increment. Besides, the viscosities of SiO2 are found to be improved when anionic surfactant, such as SDS is introduced; the improved viscosities is ascribed to the SDS molecules adsorption on the PEG chains and SiO2 layer which led to conformational modifications in the molecular chains that are stimulated because of electrostatic forces (Choi and Chen, 2003; Poncet-Legrand et al., 2001; Daniels and Francis, 1998).
3.2.2.2 Yield point data
The next rheological data that is of interest to drillers is the YP. YP can be described as the shear-stress needed to induce fluid flow or the resistance to initial fluid flow. Typically, it represents the forces of attractions between the colloidal particles in the mud (Caenn et al., 2017). The YP is essentially required when the circulating drilling fluids are needed to carry rock cuttings out of the hole to the surface. Table 6 shows the YP of the PEG-SiO2 NC-SDS drilling muds compared with SDS-free PEG-SiO2 NC muds. The inclusion of SDS-free PEG-SiO2 NC does not display strong increasing impact on the YP of the spud mud (S0) compared to PEG-SiO2 NC with SDS. The inclusion of 0.5 g SDS-free NC (S1-U) improved the YP of spud mud (S0) by 16.7%, whereas the inclusion of 1.0 g (S2-U) and 1.5 g (S3-U) SDS-free NC displayed a higher improvement in YP by 33.5% and 50%, respectively. Conversely, the NC with SDS at 0.5 g (S4-M, S5-M, and S6-M) exhibited significant increment in YP by 83.3% and even more with 1.0 g (S5-M) and 1.5 g (S6-M) by a constant level of 100%. The delight with this newly-developed NC (i.e. both the ones with SDS and without SDS) is that it demonstrated enhancement character in viscosities and YP. Nevertheless, the YP of the SDS-free NC is significantly lower compared to that of the NC with SDS. Thus, it can be established that along with the increment in the level of viscosities, NC with SDS displayed beneficial YP property more suitable for efficient hole cleaning compared with the SDS-free NC. The higher increase in YP by the NC with SDS than the SDS-free NC is due to the addition of freshly dispersed NC particles having inorganic SiO2 clay. At low concentration of anionic SDS, PEG and SDS molecules along with SiO2 particles are dispersed and stable in the aqueous system contributing to enhanced YP (Medhi et al., 2020; Wang et al., 2006).
3.2.2.3 YP/PV data
The PV slope against YP line often referred to as YP/PV ratio that can also be expressed in lb/100ft2/cP unit is a strong indicator for understanding the conditions of drilling muds. A measure of the fluid lifting capacity parameter (YP/PV) is used to quantify how stable is the drilling mud (Luo et al., 2017). Generally, YP/PV higher than 0.75 signifies suitable mud’s lifting and suspension capacity and the tendency for the mud to drill a well as fast as possible. High YP/PV ratios will often lead to higher flow distribution and efficient hole cleaning program (Chilingarian and Vorabutr, 1983). Table 6 presents the YP/PV ratios of different spud mud samples tested at 78 °F without aging. The results showed that the estimated ratios of all the mud samples met the recommended range of 0.75 suggested except the mud samples S1-U and S2-U at 0.70 and 0.73, respectively. It can be seen that the YP/PV ratios of all the SDS bearing NC mud samples decreases with increasing concentration but the ratios (1.0 for S4-M), (0.92 for S5-M), and (0.86 for S6-M) are higher when compared to the base mud (S0) ratio, which is 0.75. This data exemplify that mud stabilization is more effective with SDS bearing NC samples compared to the SDS-free NC samples (Chilingarian and Vorabutr, 1983). Therefore, the studied newly-developed SDS bearing NC samples possess a beneficial and desirable attribute for drilling jobs.
3.2.2.4 Gel strength data
GS indicates the shear-stress tested at a low shear-rate after drilling mud has been quiescent for a period of time. It describes the suspension capability of rock cuttings for drilling fluids under quiescent conditions. A very low GS will cause rock chips to drop to the bottom of the hole. On the other hand, the mud will become static and obstruct solids from flowing out of the hole if the GS is unnecessarily high (Chilingarian and Vorabutr, 1983). The 10 s gel and 10 min gel data of spud mud (S0) with and without NC bearing SDS are shown in Table 6. The inclusion of NC causes modification in the water-bentonite-NaOH mud but the margin of modification is greater in NC with SDS mud samples compared to SDS-free NC. Nevertheless, the margin of modification between the gels applicable to SDS-free NC and NC with SDS samples is not big to cause any problem of recirculation. Apart from detecting the gel increment with the concentrations of NC with/without SDS, it also prompted the character of low-flat gels (i.e. the gels variation between 10 s and 10 min is not even up to 2 lb/100ft2), as presented in Table 6. This gel behaviour indicates that gels formations are not progressive and can easily be broken when recirculation commences after a prolonged quiescent conditions. This action will assure appropriate rock cuttings suspension and barite to prevent sagging problems (Blkoor et al., 2021).
Analyzing the gel data further, an increase in the 10 s gels of SDS-free NC mud samples was found to be by 7.1% (S1-U), 19% (S2-U), and 35.7% (S3-U). For the NC with SDS mud samples, the 10 s gel increase is by 11.9% (S4-M), 23.8% (S5-M), and 47.6% (S6-M). The SDS modified NC displayed a larger margin of gel increment compared to the SDS-free NC because of the well-dispersed solids content in the mud system and the interaction of the SDS with the bentonite clay plates to promote electrostatic forces (Wang et al., 2006). The increasing feature of the NC with/without SDS with respect to viscosity, YP, and GS is consistent with the earlier data of Aftab et al. (2017) and Mao et al. (2015). Overall, the impact of NC with/without SDS on viscosity, GS, and YP of the water-bentonite-NaOH spud mud (S0) was thickening.
3.2.3 Filtration control properties data
Today, drillers are concentrating more on ground-breaking technologies to apply in drilling operations to prevent or reduce fluid loss into the reservoir formation and fluid invasion towards the porous and permeable media. It was found that to obtain a homogenous and stabilized NPs or NC-based muds for fluid loss control, highly efficient polymers or surfactants containing large neutralizing potentials are to be used (Medhi et al., 2020). Therefore, investigation of the filtration properties performance of NC with/without SDS surfactant in a water-bentonite-NaOH mud system was evaluated in this study and the data obtained are summarized in Table 7.
Temperature = 78 °F
Compositions of spud mud samples
Properties
S0
S1-U
S2-U
S3-U
S4-M
S5-M
S6-M
API FL (ml)
18.5
17.7
16.2
15.4
16.3
14.8
13.2
API FL (σ)
1.1
1.3
1.2
1.0
1.2
1.0
0.9
API FCT (mm)
2.4
2.2
2.0
1.8
2.1
1.7
1.5
API FCT (
)
0.7
0.6
0.8
1.0
0.9
1.1
1.0
3.2.3.1 API filtrate loss data of spud mud
The filtrate loss volume property of drilling fluids is significant for providing a relative measure of the volume of filtrate intrusion into the formation (Ismail et al., 2016). Table 7 presents the filtrate loss volume data of water-bentonite-NaOH spud mud systems containing NC with/without SDS at a temperature of 78 °F. The data for both NC with/without SDS showed a reduction in filtrate loss amount with the SDS bearing NC mud samples demonstrating greater filtrate loss control capability as compared to the SDS-free NC. For the SDS-free NC mud samples S1-U and S2-U, the filtrate loss control enhancement of the base mud (S0) is by 4.3% and 12.4%, while for the S3-U, the enhancement is by 16.8%. The filtrate loss enhancement property increases with increasing concentration of the SDS-free NC. Similar results are also found for the SDS bearing NC mud samples recording the lowest filtrate loss volume of 13.2 ml (S4-M) with the highest concentration of 1.5 g. This mud sample showed the highest filtrate loss control of the base mud by 28.6%, which is more than twice the sealing ability of S3-U mud sample. S5-M and S6-M mud samples of the modified NC also recorded the highest margin of sealing potential by 11% and 20% compared to S1-U and S2-U of the unmodified. This phenomenon take place because the SDS modified NC is able to participate in the rearrangement of clay platelets in suspension because of its ability to shift the surface charge to the stable region. This act makes less filtrate to seep via its hydrophilic layer when it clogs the pore spaces of the filter paper (Yunita et al., 2016; Mahto and Jain, 2013).
3.2.3.2 API filter cake thickness data of spud mud
Naturally, filter cakes are formed as drilling muds go into the wellbore during drilling activities; some solid particles known as filter cakes are deposited along the wall of the borehole wall because of differential pressure. In the event of the filter cake formation, drilling mud residues are created named mud filtrate (Khalifeh et al., 2019). Table 7 showed the API FCT of the spud mud having different concentrations of NC with/without SDS modification. Small changes were observed in the API FCT of the spud mud with the concentrations of SDS-free NC. With an increase in SDS-free NC concentration, the cake thickness of the base mud (2.4 mm) was reduced by 8.3%, 16.7%, and 25% for S1-U, S2-U, and S3-U compositions, respectively. Like the API FL, the spud mud systems bearing the SDS modified NC displayed a larger margin of decrease in the API FCT of the base mud in an increasing concentration as compared to SDS-free NC mud systems. These mud systems reduced the cake thickness by 12.5% for S4-M, 29.2% for S5-M, and 37.5% for S6-M. According to these data, the mud compositions of NC with/without SDS can minimize the problems of pipe sticking. Following earlier studies (Medhi et al., 2020; Khalifeh et al., 2019; Lecolier et al., 2005), it was observed that adding a low concentration of NC can make the NC to insert arbitrarily in the structure of clay platelets and act as a seal between the wellbore and the formation. The calculated standard deviation in Table 7 shows that the data are clustered around the mean and are close to one another.
3.3 Complex drilling mud results
In this section, the results of different complex drilling mud systems obtained after testing with rotational rheometer are presented to characterize the rheological behaviour in terms of viscosity, shear stress, fluid flow index, and fluid consistency factor.
3.3.1 Rheological properties characterization of complex drilling mud systems
The universal phrase ‘rheology’ denotes the science relating to the study of flow behaviour and distortion of materials. It is governed by its features, principally the viscosity. The rheological characterization of a material provides a holistic knowledge on the material viscoelastic flow character. Undoubtedly, rheology is very vital to every drilling fluid material because the responses of rheological properties are analogous to the ultimate configurations of the material (Luo et al., 2017).
Rheological properties tests for mud samples are indicator of the nature and rate of deformation or degradation that take place when the mud’s materials are stressed (Nelson and Guillot, 2006). Fluids exhibit different characters with stress after a while. Overtime, as stress increases, fluid decreases in viscosity. This is known as thixotropic fluids. Most drilling muds used in the circulation process are thixotropic, shear thinning, and non–Newtonian with a yield stress having an increasing shear-rate with a decreasing viscosity (Nelson and Guillot, 2006). Drilling mud show an internal arrangement because of its compositions which is liable to modification giving to shear and flow environments (Sayindla et al., 2017). The non-Newtonian flow character of drilling mud has been ascribed to the transmission of the shear-stress through the continuous medium; distortion or orientation of the suspended particles opposing the random influence of Brownian motion (Nelson and Guillot, 2006).
Nowadays, in drilling programs, the shear-rate hardly ever go beyond 250 s−1, essentially for a hole section of 8.5 in. and equivalent. If a hole section of 17.5 in. and equivalent is considered, the shear-rate hardly go above 50 s−1. Hence, for higher precision and to checkmate the rheological variables against over-approximation during the course of drilling, fluid rheological behaviour and description can give a suitable approximation of the necessary possible pump rates required (Oltedal et al., 2015). Therefore, Bingham plastic and Ostwald-de-Waele models were employed in this study to describe the rheological fluid behaviour of all the complex mud samples obtained from a rotational rheometer tests ranging from 1.0 s−1 to 250 s−1 shear-rates.
3.3.2 Bingham rheological Characterization-Shear stress/shear rate relationship
In conventional drilling, Bingham plastic and Power law (Ostwald-de-Waele) models are two mathematical models predominantly applied in the field for description of rheological behaviour. The Bingham plastic model is a theoretical model that specifies the elements that impacts rheological variables (Nelson and Guillot, 2006). This model is widely introduced to describe the features of different forms of drilling fluids. Typically, drilling muds obeying this model demonstrate a linear shear-rate/shear-stress relationship after the threshold, initial shear-stress (YP) is surpassed. Thus, the shear-rate/shear-stress relationship and shear-rate/viscosity relationship of the complex drilling muds were fitted using Bingham plastic model according to Eq. (4):
τ symbolizes shear stress (cP), denotes the threshold stress (intercept) known as the YP (lb/100ft2), signifies the shear rate (s−1), and which indicates the PV (cP) symbolizes the slope of the line.
Fig. 14a and b shows the rheometer data of shear-rate and shear-stress of formulated complex mud samples tested at two temperatures (T = 78 °F and 250 °F), respectively. With an increase in shear-rate from 1.0 s−1 –250 s−1, the shear-stress of all the mud samples was increased at the temperature of 78 °F (Fig. 14a). This increase in shear-rate/shear-stress is substantially higher when SDS modified NC samples were used. SDS bearing NC increases the shear-stress of the base mud (CD0) with shear-rate with an increase in concentration from CD1 – CD3 and drop a little from CD3 – CD4. At mud composition CD3 (29.5 cP) relating to 250 s−1 shear-rate, the margin of increase over mud composition CD0 (17.8 cP) is in the margin of 65.7%, while that of mud composition CD4 (25.8 cP) registered 44.9% over CD0. According to the trend lines of the SDS modified NC mud samples, there is a drop in shear-stress beyond 1.5 g concentration of the modified NC which is due to the reduction in the internal friction between the molecules (Boyou et al., 2019). Mud composition CD2 (23.7 cP) displayed 33.1%, while the lowest margin of increase over CD0 was found in CD1 (21.9 cP) by 23.6%. The positive hydrogen ions (H+) present in the SDS modified NC created hydrogen bonds with aqueous mud molecules to increase the strength of the intermolecular interaction between the aqueous molecules and the SDS modified NC; resulting in the improvement of shear-stress of the base mud (CD0) (Boyou et al., 2019; Qiao et al., 2016). Furthermore, the negative hydroxyl ions (OH−) in the SDS modified NC surface are adsorbed on the surface of bentonite clay platelets to form strong hydrogen bridges that increased the rheological properties of the SDS bearing NC mud samples (Mao et al., 2015).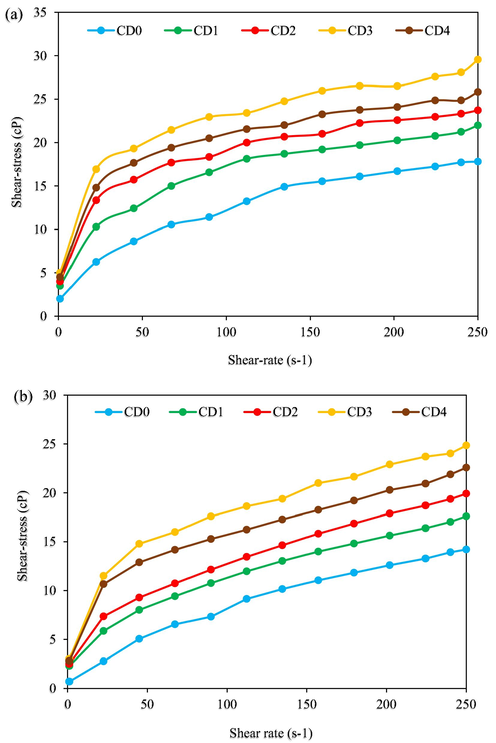
Shear-stress of drilling muds against shear-rate ((a): T = 78 °F; (b): T = 250 °F).
After oven treatment, the inclusion of SDS bearing NC in the complex base mud also cause the shear-stress to increase over CD0 (Fig. 14b). The observed trend lines of shear-stress in Fig. 14b at 250 °F are similar to those represented in Fig. 14a at 78 °F. For example, the mud compositions CD1 – CD4 containing SDS modified NC raised the shear-stress of the CD0 (14.2 cP) by 23.7% for CD1 at 17.6 cP, 40.1% for CD2 at 19.9 cP, and recorded the highest increasing margin with CD3 (24.8 cP) by 74.6% and a little drop by 59.2% with CD4 (22.6 cP) at a shear-rate of 250 s−1. For the rest shear-stress, similar trend lines to that of 250 s−1 shear-rates were observed. In the Fig. 14, it was observed that a very little change occurred despite the change in temperatures. This is because of the high dispersion, good physical stability and thermal stability of the SDS bearing NC particles (Qiao et al., 2016). This is a confirmation of the ZP and TGA data shown in Figs. 5 and 13, respectively.
3.3.3 Bingham rheological characterization-shear rate/viscosity relationship
Fig. 15a and b presents the rheometer viscosity character of SDS bearing NC in complex base mud at 78 °F and 250 °F, respectively. The rheogram shown in Fig. 15a illustrates that the base mud (CD0) and all the SDS bearing NC concentrations (CD1 – CD4) display a non-Newtonian fluid character. The viscosity of all the drilling mud samples decreases with increasing shear-rate, therefore, establishing a pseudoplastic character at low, moderate, and high shear rates considered (Oseh et al., 2020a; Boyou et al., 2019). According to the trend lines shown in Fig. 15a, the SDS bearing NC samples exhibited a momentous margin of increase in the viscosity of the base mud (CD0) at 3.35 cP at the lowest shear-rate of 1.0 s−1. For CD1 (4.43 cP) and CD2 (5.57 cP), the margin of increase was lower by 32.2% and 66.3%, respectively, compared to the one recorded with CD4 (6.72 cP) by 100.6%, that drop behind CD3 of 7.85 cP. This mud composition (CD3) recorded a significantly largest increase by 134.3% over CD0 at the lowest shear-rate of 1.0 s−1. The viscosity trend lines of all the mud samples at other shear-rates greater than 1.0 s−1 up to 250 s−1 exhibited similar flow pattern from lowest to highest shear-rates. The resistance due to internal friction is highest at the lowest shear-rate of 1.0 s−1; thus, highest viscosity. Also, as shear-rate increases, more particles, molecules, and polymer chains orient in the flow direction reducing the internal friction resulting in decrease in viscosity with increasing shear-rate (Gbadamosi et al., 2019; Mao et al., 2015). Thus, the pseudoplastic character shown on the plot of shear-rate/viscosity in Fig. 15. This interprets that the SDS bearing NC particles possess a beneficial viscosifying component for drilling operations. The viscosifying component of the SDS bearing NC particles is the ability of the dispersed particles (as was confirmed by FESEM results in Fig. 11) to embed in the particle pore structure on the clay surface and conferred links with sodium bentonite clay platelets, that in effect supports clay particles gelation; hence, the viscosity (Aftab et al., 2017).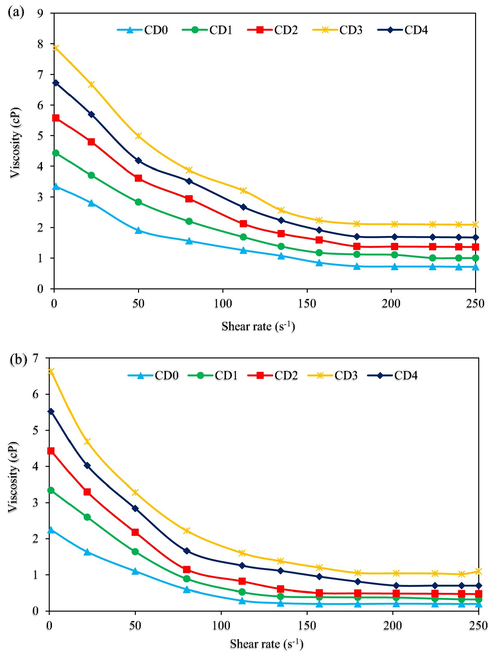
Viscosity of drilling muds against shear-rate ((a): T = 78 °F; (b): T = 250 °F).
As shown in Fig. 15b, the trend lines of the viscosities of CD1 – CD4 at 250 °F temperature are analogous to that of CD0 and the CD1 – CD4 displaying more improved viscosyfing character. These compositions represented in Fig. 15b showed little lower viscosities with increasing shear-rates as compared to the ones presented in Fig. 15a. With higher temperature, the intermolecular attraction existing between the mud’s molecules tends to deteriorate resulting in reduced viscosities of all the mud samples (Aftab et al., 2017). As observed earlier at 1.0 s−1 shear-rate, the behaviour of the mud samples with/without aging is alike. CD1 (3.34 cP) and CD2 (4.43 cP) improved the viscosity of CD0 of 2.25 cP by 48.4% and 96.9%. For CD3 (6.62 cP), the highest margin of improvement by 194.2% was achieved, while a drop in the viscosity to 145.3% by CD4 of 5.52 cP over CD0 was recorded at 1.0 s−1 shear-rate. With this rheological trend lines demonstrated by the SDS bearing NC particles, the mud may not be thick enough to induce high ECD in a deep water low–temperature formations. Due to a narrow safe–density hole-in-the-wall of such formations, a high ECD will cause formation fracture and lost circulation (Alsaba et al., 2014). This is a problem in drilling operation that often requires huge capital to address or can even lead to loss of entire well. Moreover, the viscosities of the SDS modified NC mud samples are stable and did not undergo notable fluctuations, largely due to its enough small size, sufficient high SSA (refer: Fig. 8), and high dispersion stability (refer: Fig. 5).
3.3.4 Ostwald-de-Waele rheological characterization of flow index and consistency factor
The Power law (Ostwald-de-Waele) model was also used to fit the rheological parameters using Eq. (5) and the data achieved are presented in Figs. 16 and 17. This model is an empirical model derived from analysis of laboratory data (Casson, 1959). Today, this rheological model gets greater attention in the field because it gives a high precision of fluids behaviour (Casson, 1959).
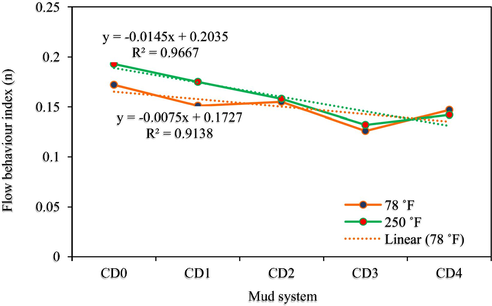
Flow behaviour index of drilling mud samples (T = 78 °F and 250 °F).
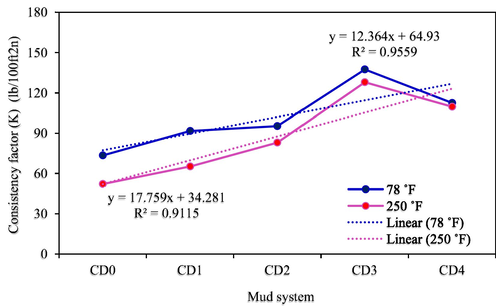
Fluid consistency factor of drilling mud samples (T = 78 °F and 250 °F).
μ = viscosity (cP), γ̇ = shear rate (s−1), n = dimensionless flow behaviour index, and K = fluid consistency factor (lb/100ft2n).
Fig. 16 presents the results of the Ostwald-de-Waele rheological characterization of flow index (n) of all the mud samples at temperatures of 78 °F and 250 °F. According to Fig. 16, SDS bearing NC concentration reduces from CD0 to CD1 and increases to CD2, then drops from CD2 to CD3 before increasing again to CD4 at 78 °F. Similar observation was seen at 250 °F but in this case the reduction is from CD0 to CD3 before a little increase from CD3 to CD4. The range of the values of n from CD0 to CD4 is between 0.172 and 0.126 at 78 °F and between 0.193 and 0.132 at 250 °F, indicating a flat viscosity-profile. For the observed highest shear-thinning character (CD3), it improved the shear-thinning property of the base mud (CD0) by 26.7% and 31.6% at 78 °F and 250 °F, respectively. For the two evaluated temperature conditions, all the drilling mud systems are much below one (n ; specifying all the mud compositions to possess high shear-thinning character, suitable for drilling operations.
For the fluid consistency factor (K) depicted in Fig. 17 for both temperature conditions (T = 78 °F and 250 °F), the SDS modified NC mud samples increases with an increasing concentration from CD1 to CD3 over CD0, but decreased a little from CD3 to CD4. The highest margin of increase occurred with mud composition CD3 by 87.2% and 145.2% at 78 °F and 250 °F, respectively. All the mud samples exhibited beneficial rheological properties for drilling operations; they lie between 73.42 lb/100ft2n and 113.3 lb/100ft2n for 78 °F and between 52.14 lb/100ft2n and 109.6 lb/100ft2n for 250 °F, indicating an improvement in the fluid’s viscosity for better lifting and suspension of drilled solids (Ismail et al., 2016).
3.4 Filtration control properties data of complex drilling muds
This section discusses the filtrate loss control performance, nature of formed filter cake and deposited cake permeability of base mud sample and mud samples related to SDS bearing NC at two temperature conditions of API (78 °F) and HPHT (250 °F) to ascertain the impact of the newly-developed SDS bearing NC on the filtration control capacity of the complex drilling mud system.
3.4.1 Filtrate loss control data of complex drilling mud systems
Having a low loss of filtrates into the drilled formation is important to achieving optimal hole stability while drilling. Drilling muds are tested to investigate the filtrates that seeps via a certain medium (filter paper), leaving formed or deposited cake on the medium (filter paper). A low permeable and thin filter cake is desirable in drilling jobs; it prevents differential stuck pipe problems. Thick and high permeable filter cake is undesirable while drilling; the effective hole diameter is reduced and subsequently, the contact area between the drill string and filter cake is increased resulting in a greater problems of differential stuck pipe (Caenn et al., 2017). The filtrate loss control of different drilling mud systems under API and HPHT conditions are represented in Fig. 18. The data displayed in Fig. 18 show that the base mud sample (CD0) recorded the highest filtrate loss into the reservoir formation under both API and HPHT conditions. The API FL of the CD0 was 10.2 ml, and with the SDS bearing NC, it decreased by 15.7% for CD1 at 8.6 ml and 24.5% for CD2 at 7.7 ml. It was best controlled by mud composition of CD3 by 47.1% at only 5.4 ml, while mud composition CD4 with 2.0 g (highest concentration of the NC) showed 33.3% control at 6.8 ml and drop behind CD3 of 1.5 g. The newly-developed SDS bearing NC was efficiently dispersed in aqueous phase and it was able to permit less filtrate to seep via its hydrophilic film that offered a passage for filtrates to escape into the permeable formation (Oseh et al., 2020c).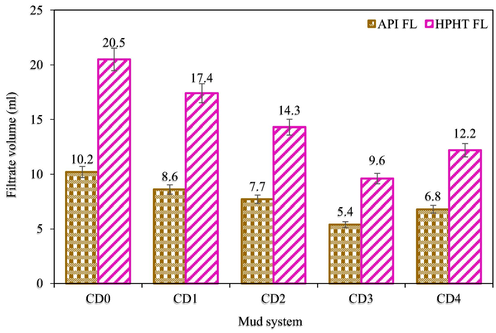
Filtrate loss control data of drilling mud samples at API and HPHT conditions.
Increasing temperature can participate to reduce the aqueous phase viscosity, thus raising the amount of filtrate loss. According to Fig. 18, the filtrate loss of all the mud samples tested under HPHT conditions were increased with the base mud (CD0) exhibiting the highest loss. It can be said that, at 250 °F, molecules of the base mud tend to degrade faster and needs the support of effective filtrate loss control material to support the PAC-R used, if not high loss of filtrate may happen. The margin of reduction in the filtrate loss volume of the CD0 at 20.5 ml is highest with mud composition CD3 by 53.2% at only 9.6 ml followed by 40.5% for mud composition CD4 at 12.2 ml. Mud compositions CD1 and CD2 showed a decrease of 15.1% and 30.2% at 17.4 ml and 14.3 ml, respectively. The reduction in the filtrate loss control performance of the SDS modified NC samples at 250 °F is likely to have come from the PEG that has the poorest thermal resistance compared to SiO2 and SDS; thus, the particles could no more offer enough to seal the pore spaces of the formation (Medhi et al., 2020). From this data, similar behaviour of filtrate loss control was experienced in the rheological characterization of all the mud samples using the Bingham plastic and Ostwald-de-Waele models.
3.4.2 Filter cake thickness data of complex drilling mud systems
Filter cakes indicate the residues that are deposited on filter papers (permeable media) when drilling muds under a certain pressure are compelled against the media. The liquid that seeps via the media, leaving the cake on the media is the filtrate. Filter cake performs essential task to making permeable porous formation to become stable. The ideal filter cake should be tough, thin, flexible, and low permeable (Mao et al., 2015). Filter cake properties, such as thickness and permeability were studied in this research; they are vital because the deposited cake on permeable regions in the wellbore can induce incident of differential pipe sticking and wellbore damage. Wellbore damage is associated with less petroleum production when a poor filter cake permits high filtrate intrusion. A certain level of filter cake thickness ( 2.0 mm) and permeability range (10-2 to 10-4 mD) is desired for drilling under API conditions (Bageri et al., 2015).
Fig. 19 contains the API FCT and HPHT FCT of the drilling mud samples. The cake thickness of all the mud systems is very low and is found to be
2.0 mm for API and within the recommended field range for HPHT conditions. Mud composition CD3 has the lowest cake thickness at both API and HPHT conditions with about 61.5% and 36.7% less thick than CD0 (base mud), respectively. The rest SDS bearing NC mud systems (CD1, CD2, and CD4) displayed less thickness of 14.4%, 23.7%, and 30.7% (API conditions) and 25.6%, 31.1%, and 33.3% (HPHT conditions) over that of CD0 (base mud), respectively. Drillers often prefer this property to be as low as possible to permit less filtrate loss to protect the wellbore and reservoir formation.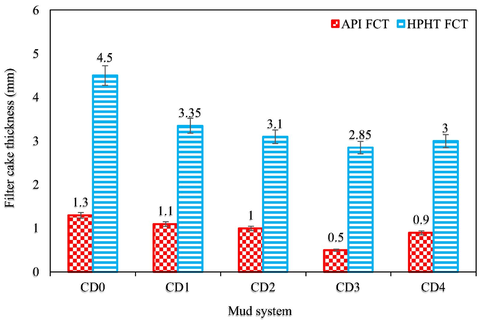
Filtrate loss control data of drilling mud samples at API and HPHT conditions.
3.4.3 Filter cake permeability data of complex drilling mud systems
The estimated cake permeabilities of the filter paper used for all the mud samples are shown in Fig. 20 under API and HPHT conditions. These permeabilities are calculated from Darcy’s law using the following relations (Eqs. (6) – (8)) proposed by Hubbert (1957):
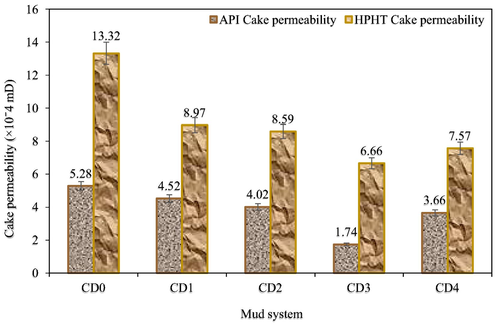
Filter cake permeability data of drilling mud samples at API and HPHT conditions.
From Eq. (6),
represents the rate of filtration,
indicates the proportional constant representing the cake permeability,
defines the cross-section area,
defines the differential pressure,
represents the mud (dynamic) viscosity, and
represents the thickness of the filter cake accomplished using Eq. (7).
From Eq. (7),
represents the deposited fraction amount of solids in the filter cake,
represents the fraction amount of solids in the drilling mud, and
is the time used in the filtration test. The filter cake area of cross-section was set constant at 31.2 cm2 and
represents the viscosity of the filtrate that was calculated at a 500 psi differential pressure
using Eq. (8). Po is the outlet fluid pressure and Pi is the inlet fluid pressure.
From Fig. 20, the SDS modified NC samples (CD1 to CD4) displayed more permeable filter cakes as compared to the base mud (CDO). Mud compositions CD1 to CD4 will be more preferred in drilling operations for the protection of wellbore integrity. The base mud (CD0) has the highest cake permeability at both conditions, while mud composition CD3 has the lowest; being less permeable than CD0 with about 67% (API conditions) and 50% (HPHT conditions). Furthermore, the permeabilities of all the mud samples at both conditions are found to be within the suggested range of 0.01 – 0.0001 mD by Bageri et al. (2015). With these filtration data, the newly-developed SDS modified NC reduced the filtrate loss volume of the base mud; has less cake thickness and is more permeable than the base mud. Along with the rheological characterization data, the optimum concentration of the newly-developed SDS bearing NC in the complex drilling mud system is found to occur at mud composition CD3 (CD3 = CD0 + 1.5 g SDS modified NC); it displays much improved drilling mud properties. This translates that beyond the 1.5 g concentration under the studied prevailing conditions, the drilling job program may possibly no longer be optimized.
4 Conclusions
This research was undertaken to design a novel drilling mud additive using the hybrid of PEG and SiO2 NP. The designed PEG-SiO2 NC was modified by SDS to produce PEG-SiO2 NC-SDS material. Several characterization tests were carried out with these materials with/without SDS modification to critically examine their intrinsic features, components, microstructure, morphology, and stability. Moreover, the efficacy of introducing this novel material for drilling operation was investigated by formulating spud muds using different concentrations of the PEG-SiO2 NC with and without SDS particles. Thereafter, four concentrations (0.5 g, 1.0 g, 1.5 g, and 2.0 g) of SDS bearing PEG-SiO2 NC were adopted to formulate complex drilling muds of five compositions (CD0 for base mud, CD1 for 0.5 g, CD2 for 1.0 g. CD3 for 1.5 g, and CD4 for 2.0 g) to scrutinize their rheological and filtration properties impact on the base mud. Based on the research objectives and the results obtained, the ensuing conclusions are attained:
-
FTIR, FESEM, EDX, and TGA analyses indicate that the SDS modified PEG-SiO2 NC particles were effectively formed and modified; it embodies exceptional thermal stability and is efficiently dispersed, which contributed to rheology improvement.
-
PSD results stipulate that it has a narrow size distribution range between 82 nm and 410 nm, and a SSA of 41.4 m2/g that is sufficiently high for particle-molecule interactions.
-
The magnitude of the zeta potential of about −51.5 mV confirmed that the SDS modified NC is electrically stable and has a prospect of long-term stability in drilling fluids.
-
Spud mud data indicate a better improvement in the properties of the base mud with SDS bearing NC than with SDS-free NC. The rheological properties and filtrate loss volume of the based mud showed higher percent rate of improvement with the SDS modified NC compared with the unmodified NC.
-
Bingham plastic and Power law models confirmed that the rheological variables are notably shear-thinning and did not undergo notable fluctuation. Mud composition CD3 improve the value of n by 26.7% and 31.6% and that of K by 87.2% and 145.2% at 78 °F and 250 °F, respectively.
-
The optimum concentration of SDS bearing NC was found at mud composition CD3 and it recorded a significantly largest increase in viscosity by 134.3% and 194.2% over CD0 at the lowest shear-rate of 1.0 s−1 at both 78 °F and 250 °F, respectively.
-
The filtrate loss of the base mud was reduced by all the SDS bearing NC concentrations from 10.2 ml to 5.4 ml (API conditions) and 20.5 to 9.6 ml (HPHT conditions).
-
The filter cake properties, such as cake thickness and permeability showed that all the mud samples exhibited thin, tough, flexible, and low permeable character.
-
The cake permeabilities of the SDS modified NC (CD3 composition) both at API and HPHT conditions were found to be 1.74 × 10⁻⁴ mD and 6.66 × 10⁻⁴ mD compared to the base mud (CD0 composition) of 5.78 × 10⁻⁴ mD and 13.2 × 10⁻⁴ mD, respectively.
-
Overall, the use of newly-developed SDS modified NC material is recommended for drilling fluid because of its physical stability and mud enhancement property.
CRediT authorship contribution statement
Shafeeg O. Blkoor: Writing – review & editing. M.N.A. Mohd Norddin: Conceptualization, Methodology, Validation, Data curation, Supervision, Project administration, Funding acquisition. Issham Ismail: Conceptualization, Methodology, Validation, Supervision, Project administration, Funding acquisition. Jeffrey O. Oseh: Conceptualization, Methodology, Validation, Formal analysis, Writing – original draft, Writing – review & editing. Augustine Agi: Validation, Visualization. Afeez O. Gbadamosi: Validation, Visualization. Nnanna O. Okoli: Validation, Visualization. Ifeanyichukwu M. Onyejekwe: Writing – review & editing. Abdul R. Risal: Writing – review and editing.
Acknowledgements of Funding Source
The authors hereby extend their appreciations to the Malaysia Ministry of Higher Education and Universiti Teknologi Malaysia, Skudai, Johor State, Malaysia for financing this research under the Fundamental Research Grant Scheme (FRGS) (Ref: FRGS/1/2021/TK0/UTM/02/73).
Declaration of Competing Interest
The authors declare that they have no known competing financial interests or personal relationships that could have appeared to influence the work reported in this paper.
References
- Synthesis and characterization of lignosulfonate/acrylamide graft copolymers and their application in environmentally friendly water-based drilling flui. J. Pet. Sci. Eng.. 2018;171:484-494.
- [CrossRef] [Google Scholar]
- Nanoparticles based drilling muds a solution to drill elevated temperature wells : A review. Renew. Sustain. Energy Rev.. 2017;76:1301-1313.
- [Google Scholar]
- Using agro-waste materials as possible filter loss control agents in drilling muds: A review. J. Petrol. Sci. Eng.. 2018;163:185-198.
- [Google Scholar]
- Silane layers onsilicon surfaces: mechanism of interaction, stability, and influence on proteinadsorption. Langmuir. 2012;28(1):656-665.
- [Google Scholar]
- Insights into the application of new eco-friendly drilling fluid additive to improve the fluid properties in water-based drilling fluid systems. J. Pet. Sci. Eng.. 2019;183:106424
- [Google Scholar]
- Alsaba, M., Nygaard, R., Saasen, A., Nes, O., 2014. Lost circulation materials capability of sealing wide fractures. In: SPE deepwater drilling and completions conference, Galveston, 10–11 Sept. https://doi.org/10.2118/17028 5-MS
- Dynamic interfacial tension behavior of water/oil systems containing in situ-formed surfactants. J. Solution Chem.. 2002;31(2):139-148.
- [Google Scholar]
- API recommended practice 13B-1., 2017. API standard practice for field testing water-based drilling fluids, 5 ed(s). pp. 1–121.
- Bageri, B.S., Mahmoud, M.A., Almutairi, A.W., Abdulraheem, A., 2015. Filter Cake Porosity and Permeability Profile Along the Horizontal Well and Their Impact on Filter Cake Removal. International Petroleum Technology Conference, 6-9 December, Doha, Qatar. DOI: 10.2523/IPTC-18465-MS
- International Symposium on The History of The Oil Industry Marietta, Ohio, June 23. Oil-Industry History 2011:161-168.
- [Google Scholar]
- Influence of polypropylene beads and sodium carbonate treated nanosilica in water-based muds for cuttings transport. J. Pet. Sci. Eng.. 2021;200:108435
- [CrossRef] [Google Scholar]
- Boyou, N.V., Ismail, I., Wan Sulaiman, W.R., Sharifi Haddad, A., Husein, N., Hui, H.T., Nadaraja., K., 2019. Experimental investigation of hole cleaning in directional drilling by using nano-enhanced water-based drilling fluids. J. Pet. Sci. Eng, 176, 220–231
- Composition and properties of drilling and completion fluids (7th Ed.). Oxford, UK: Gulf Professional Publishing; 2017.
- Modification of TiO2 nanoparticles with organodiboron molecules inducing stable surface Ti3+ complex. IScience. 2019;20:195-204.
- [Google Scholar]
- The Rheology of Disperse Systems. London: Pergamon Press; 1959.
- Drilling and Drilling Fluids. Updated (textbook ed.). Amsterdam: Elsevier Science Publishers B.V; 1983. p. :705-718.
- Surface-modified silica colloid for diagnostic imaging. J. Colloid Interf. Sci.. 2003;258:435-437.
- [Google Scholar]
- Silane adsorption behavior, microstructure, andproperties of glycidoxypropyltrimethoxysilane-modified colloidal silicacoatings. J. Colloid Interf. Sci.. 1998;205:191-200.
- [Google Scholar]
- Darley, H.C.H., Gray, G.R., 1986. Composition and Properties of Oil Well Drilling Fluids, fifth ed.Gulf Publishing Company, Houston.
- Davoodi, S., A, A. R. S., Soleimanian, A., Fellah, A., 2019. Application of a novel acrylamide copolymer containing highly hydrophobic comonomer as filtration control and rheology modifier additive in water- based drilling mud. J. Pet. Sci. Eng., 180, 747–755.
- An approach to improve the cuttings carrying capacity of nanosilica based muds. J. Pet. Sci. Eng.. 2017;152:309-316.
- [Google Scholar]
- Emergence of nanotechnology in the oil and gas industry: Emphasis on the application of silica nanoparticles. Petroleum 2017:1-15.
- [Google Scholar]
- A comprehensive investigation on the performance of durian rind as a lost circulation material in water based drilling mud. Petroleum. 2019;5(3):285-294.
- [CrossRef] [Google Scholar]
- Investigation of mud density and weighting materials effect on drilling fluid filter cake properties and formation damage. J. Afr. Earth Sc.. 2016;117:345-357.
- [CrossRef] [Google Scholar]
- High temperature and high-pressure rheological properties of high-density water-based drilling fluids for deep wells. Pet. Sci.. 2012;9:354-362.
- [Google Scholar]
- Petroleum Engineering: Drilling and Well Completions. Englewood Cliffs: Prentice Hall Inc; 1960.
- Experimental investigation of the effects of silica nanoparticle on hole cleaning efficiency of water-based drilling mud. J. Pet. Sci. Eng.. 2018;172:1226-1230.
- [CrossRef] [Google Scholar]
- Synergistic application of aluminium oxide nanoparticles and oilfield polyacrylamide for enhanced oil recovery. J. Pet. Sci. Eng. 2019
- [CrossRef] [Google Scholar]
- Surface modification of TiO2 and SiO2 nanoparticles for application in polymeric nanocomposites. Chemik. 2011;2(7):4-6.
- [Google Scholar]
- The effects of carboxylic acids on the aqueous dispersion and electrophoretic deposition of ZrO2. J. Eur. Ceram. Soc.. 2012;32(1):235-244.
- [Google Scholar]
- Hubbert, M., King., 1957. Darcy's Law and The Field Equations Of The Flow Of Underground Fluids, Hydrological Sciences Journal, 2 (1), 23-59, DOI: 10.1080/02626665709493062
- The novel approach for the enhancement of rheological properties of water-based drilling fluids by using multi-walled carbon nanotube, nanosilica and glass beads. J. Pet. Sci. Eng.. 2016;139:264-275.
- [Google Scholar]
- Influence of silane coupling agents onsurface properties of precipitated silicas. Appl. Surf. Sci.. 2001;172:18-32.
- [Google Scholar]
- Flow of dilute solid-liquid mixtures in horizontal concentric and eccentric annuli. J. Can. Pet. Technol.. 2006;46(5):56-61.
- [Google Scholar]
- Khalifeh, M., Klungtvedt, K.R., Vasshus, J.K., Saasen, A., 2019. Drilling Fluids - Lost Circulation Treatment. SPE-195609-MS. Paper presented at the SPE Norway One Day Seminar, Bergen, Norway.
- Effects of silica nanoparticles on the performance of water-based drilling fluids. J. Pet. Sci. Eng.. 2019;180:605-614.
- [CrossRef] [Google Scholar]
- Lecolier, E., Herzhaft, B., Rousseau, L., Neau, L., 2005. Development of a Nanocomposite Gel for lost Circulation Treatment. Paper SPE 94686, presented at SPE Formation Damage Conference 25-27 May, Scheveningen, Netherlands.
- Influence of an ionic liquid on rheological and filtration properties of water-based drilling fluids at high temperatures. Appl. Clay Sci.. 2017;136:96-102.
- [Google Scholar]
- Mahmoud, O., Nasr-El-Din, H.A., Vryzas, Z.nKelessidis, V.C., 2016. Using Ferric Oxide and Silica Nanoparticles to Develop Modified Calcium Bentonite Drilling Fluids. SPE-178949-PA, SPE Drilling and Completion. pp. 456-462.
- Effect of fly ash on the rheological and filtration properties of water based drilling fluids. Int. J. Res. Eng. Technol.. 2013;2(8):50-156.
- [Google Scholar]
- Hydrophobic associated polymer based silica nanoparticles composite with core–shell structure as a filtrate reducer for drilling fluid at utra-high temperature. J. Petrol. Sci. Eng.. 2015;129:1-14.
- [Google Scholar]
- Hydrophobic associated polymer based silica nanoparticles composite with core–shell structure as a filtrate reducer for drilling fluid at ultra-high temperature. J. Pet. Sci. Eng.. 2015;129:1-15.
- [Google Scholar]
- Infrared study of the surface of titaniumdioxides II. Acidic and basic properties. J. Phys. Chem.. 1971;75(9):1221-1226.
- [Google Scholar]
- Effect of molecular weight of polyethylene glycol (PEG), a hydrate inhibitive water-based drilling fluid additive, on the formation and dissociation kinetics of methane hydrate. J. Nat. Gas Sci. Eng.. 2016;35:1441-1452.
- [Google Scholar]
- An investigation on the effects of silica and copper oxide nanoparticles on rheological and fluid loss property of drilling fluids. J. Pet. Explor. Prod. Tech.. 2020;10:91-100.
- [Google Scholar]
- Nelson, E.B., Guillot, D., 2006. Well Cementing, Schlumberger 2nd ed. pp. 1-799. ISBN-13: 978- 097885300-6
- Physicochemical behavior of mixed surfactant systems: petroleum sulfonate and lignosulfonate. J. Appl. Polym. Sci.. 2003;88(4):860-865.
- [Google Scholar]
- Additive effectiveness and contaminant influence on fluid-loss control in water-based muds. SPE Drilling Engineering. 1988;3(02):195-203.
- [Google Scholar]
- Rheological Properties of Oil Based Drilling Fluids and Base Oils. OMAE2015-41911, V010T11A042. Petroleum Technology. 2015;10:1-8.
- [Google Scholar]
- Transports of different cuttings sizes in a wellbore using henna and lignite materials. J. Eng. Res. Dev. (AJERD). 2018;3:351-365.
- [Google Scholar]
- Experimental investigation of cuttings transportation in deviated and horizontal wellbores using polypropylene–nanosilica composite drilling mud. J. Pet. Sci. Eng.. 2020;106958:1-24.
- [Google Scholar]
- A novel approach to enhance rheological and filtration properties of water–based mud using polypropylene– silica nanocomposite. J. Pet. Sci. Eng.. 2019;181(106264):1-25.
- [Google Scholar]
- Influence of (3–Aminopropyl) triethoxysilane on entrapped polypropylene at nanosilica composite for shale swelling and hydration inhibition. J. Pet. Sci. Eng. 2020:194.
- [Google Scholar]
- Effect of the surface charge of entrapped polypropylene at nanosilica-composite on cuttings transport capacity of water-based muds. Appl. Nanosci.. 2019;10(1):61-82.
- [Google Scholar]
- Investigating almond seed oil as potential biodiesel-based drilling mud. J. Pet. Sci. Eng.. 2019;181(106201):1-16.
- [Google Scholar]
- Enhanced cuttings transport efficiency of water-based muds using (3– Aminopropyl) triethoxysilane on polypropylene-nanosilica composite. Arabian J. Chem.. 2020;13(8):6904-6920.
- [CrossRef] [Google Scholar]
- Adsorption of anionic surfactant (sodium dodecyl sulfate) on silica. Soil Sci. Plant Nutr.. 2016;62(3):223-229.
- [Google Scholar]
- Surface modification of colloidal silicaparticles. Colloid Polym. Sci.. 2001;279:114-121.
- [Google Scholar]
- Surface modification of oxidic nanoparticles using 3-methacryloxy propyl trimethoxy silane. J. Colloid. Interf. Sci.. 2004;269:09-116.
- [Google Scholar]
- Surface modification to produce hydrophobic nano-silica particles using sodium dodecyl sulfate as a modifier. Appl. Surf. Sci.. 2016;364:103-109.
- [CrossRef] [Google Scholar]
- Surface tension of mixed surfactant systems: lignosulfonate and sodium dodecyl sulfate. Colloid Polym. Sci.. 2002;280:775-778.
- [CrossRef] [Google Scholar]
- Hole-cleaning performance comparison of oil- based and water-based drilling fluids. J. Pet. Sci. Eng.. 2017;159:49-57.
- [Google Scholar]
- Synthesis and characterization of solar photoactive TiO2 nanoparticles with enhanced structural and optical properties. Adv. Powder Technol.. 2018;9(2):211-219.
- [CrossRef] [Google Scholar]
- Effects of added surfactant on the dynamic interfacial tension behavior of acidic oil/alkaline systems. J. Colloid Interface Sci.. 2001;239(1):226-229.
- [CrossRef] [Google Scholar]
- Study of polymer-surfactant interactions via surface tension measurements. Colloid Polym. Sci.. 2001;279(3):297-300.
- [CrossRef] [Google Scholar]
- The adsorption and reaction of a titanatecoupling reagent on the surfaces of different nanoparticles in supercriticalCO2. J. Colloid Interf. Sci.. 2006;304:152-159.
- [Google Scholar]
- Silane coupling agents used fornatural fiber/polymer composites: a review. Compos. Part A: Appl. Sci. Manufac.. 2010;41:806-819.
- [Google Scholar]
- Xu, J. gen, Qiu, Z. song, Zhao, X., Zhong, H. yi, Li, G. rang, Huang, W. an., 2018. Synthesis and characterization of shale stabilizer based on polyethylene glycol grafted nano-silica composite in water-based drilling fluids. J. Pet. Sci. Eng. 163, 371–377.
- Optimization of water-based drilling fluid using non-ionic and ionic surfactants additives. Procedia Eng.. 2016;148:1184-1190.
- [Google Scholar]


