

Translate this page into:
An innovative impurity profiling of Avanafil using LC and LC-MS/MS with in-silico toxicity prediction
⁎Corresponding author at: Department of Pharmaceutical Analysis, Institute of Pharmacy, Nirma University, Sarkhej-Gandhinagar Highway, Post: Chandlodia, Via –Gota, Ahmadabad 382 481, Gujarat, India. charmy.kothari@nirmauni.ac.in (Kothari Charmy)
-
Received: ,
Accepted: ,
This article was originally published by Elsevier and was migrated to Scientific Scholar after the change of Publisher.
Peer review under responsibility of King Saud University.
Abstract
Abstract
Degradation of the drug can lead to the formation of toxic substance hence drug quality and stability is a major concern by pharma regulators. A Selected phosphodiesterase type 5 inhibitor drug Avanafil (AV) structure has amide, arylchloro and hydroxide as functional groups which can easily eliminated during hydrolysis. Henceforth, thoroughly chemical stability of AV was carried out according to ICH guideline Q1A (R2). The drug and marketed tablet formulation undergoes degradation in hydrolytic (acid, base, neutral), thermal, photolytic, oxidative conditions and forms a total new sixteen degradation products (D.P.s) which were identified by LC, characterized by LC-MS/MS and probable degradation mechanism for each stress conditions are proposed. All sixteen D.P.s were identified by optimized LC conditions; C18 column using 10 mM ammonium acetate: ACN (60:40, v/v), pH 4.5 as mobile phase at 0.9 mL min−1 of flow rate, 239 nm wavelength at 20 °C column temperature and the method being LC-MS compatible characterized by LC-MS/MS confirmed by relative retention time (RRT). The structure of D.P.s was confirmed from the fragmentation pattern obtained by LC-MS/MS and further probable degradation mechanism for each stress condition is proposed. The drug and its marketed tablet formulation showed similar degradation peaks which were confirmed using RRT, photodiode array (PDA) and LC-MS. Drug degradation happens due to nucleophilic substitution reaction, amide hydrolysis, electron withdrawing properties of amide, dechlorination and bond cleavage due to energy. The amide group in AV structure can undergo hydrolysis, while due to aryl chloride and hydroxide group in structure it undergoes photodecomposition. A comprehensive stress study reveals that AV is more prone to degrade in light, temperature and moisture; hence AV requires proper storage condition temperature below 25 °C with protection to light and moisture. In silico toxicity prediction of physicochemical properties revealed that all the physicochemical parameters of impurities were within the acceptable limit which indicates that no impurity is at any risk of toxicity. In detail, the LC-MS/MS compatible AV degradation study is fully validated as per ICH Q2 (R1) guideline.
Keywords
Avanafil
LC-MS/MS
Impurity profile
Fragmentation
Stability indicating method

- ACN
-
Acetonitrile
- API
-
Active pharmaceutical ingredient
- AV
-
Avanafil
- D.P.
-
Degradation product
- ED
-
Erectile dysfunction
- ICH
-
International Conference on harmonization
- LC
-
Liquid chromatography
- MS
-
Mass spectroscopy
- PDE
-
Phosphodiesterase
- Rt
-
Retention time
- RRT
-
Relative retention time
- SIAM
-
Stability indicating analytical method
Abbreviations
1 Introduction
Building blocks of the pharmaceutical industry are quality, safety and efficacy. Stability of active pharmaceutical ingredient (API) and formulation is a prime requirement for any industry to study half-life, shelf life and expiry period of the drug. As per ICH Q1A (R2) (ICH, 2005a) stress degradation is the process to find out the stability of drug molecule in presence of variable chemical and environmental conditions. Further identification and characterization of degradation products (D.P.s) will help to find out inherent stability study of a drug, half-life, shelf life and expiry period of the drug (Bakshi and Singh, 2002). All the drug substances and drug products tend to degrade in different environmental conditions (light, temperature, moisture, heat, etc.) as discussed by the Bakshi in a harmonized way. In detail drug stress testing by LC-MS/MS provides information about structures of D.P.s, and plausible degradation mechanisms which aids to know the toxicity and side effects. In literature, there are many reports on forced degradation study and structural elucidation of drugs by analytical methods including hyphenated techniques. (Jain and Basniwal, 2013; Kalariya et al., 2015b; Kurmi et al., 2016; Narayanam et al., 2013; Ramesh et al., 2014; Shankar et al., 2019; Singh et al., 2012). From degradation study data plausible degradation mechanism can establish. The degradation can be due to hydrolysis, oxidation, rearrangement, substitution, dimerization, and removal of halo atoms. (Bandichhor, 2014; Li et al., 2014; Modhave et al., 2011; Narayanam and Singh, 2014; Rao et al., 2014; Srinivasu et al., 2010). The drug substance degradation profile is handy for clinical study, preclinical study, drug product manufacturing, and marketing. (Kalariya et al., 2015a; Shankar et al., 2019).
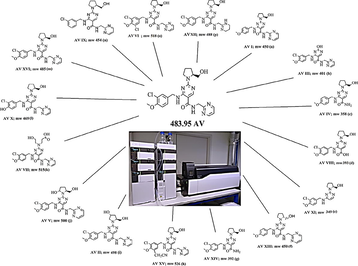
Phosphodiesterase type 5 (PDE 5) inhibitors are used in the treatment of erectile dysfunction (ED) and explored for the treatment of pulmonary hypertension (Ferguson and Carson, 2013). Avanafil (AV) as PDE 5 inhibitor drug, developed by Mitsubishi Tanabe Pharma Corporation (Osaka, Japan) to treat erectile dysfunction. Chemically it is [(s) - (4-[(3chloro-4-methoxybenzyl) amino]-2-[2-(hydroxymethyl)-1pyrrolidinyl] - N - (2 pyrimidinyl methyl) − 5-pyrimidine carboxamide)] (Kotera et al., 2012; Zurawin et al., 2016). AV is soluble in acetonitrile (ACN), methanol, and dimethyl sulfoxide (DMSO) but insoluble in water. AV has two pKa values, which are 11.84 (acidic) and 5.5 (basic).
The detail AV literature review reveals that few reports were published related to pharmacological action as PDE 5 inhibitor (Ferguson and Carson, 2013), tolerability and pharmacokinetic study of AV with LC-MS/MS method (Jung et al., 2010). Several analytical methods have been reported for the AV determination by UV spectroscopy method (Savaliya et al., 2013), simultaneous estimation of Avanafil and Dapoxetine with the HPLC method (Mangukiya et al., 2014) and multivariate analysis of Avanafil and Dapoxetine (Patel and Kothari, 2016). A Few reports on HPLC stability methods have been reported for the determination of AV (Bhumik et al., 2015; Kumar et al., 2017; Can, 2018). Bhumik et. al have developed a stability LC method for AV which can merely identify AV peak, hence it does not fulfill the purpose of the stability-indicating analytical method (SIAM). Report by Kumar et al. focused on an AV stability study in certain degradation conditions via gradient method. The reported method reveals the separation of AV but not effective for the separation of all degradation peaks. Recently published report by Can focused on the identification of two related substances and one degradation product of AV by LC-MS-IT-TOF (Can, 2018). However, the reported method was not efficient to separate degradation products due to a lack of method sensitivity. The reported method identified two related substances and one degradation product using LC-MS/MS and had predicted structures.
To best of our knowledge to date, not a single report available for a comprehensive impurity profile with full validation exists for AV, which is crucial for quality control of drugs, to establish critical steps during synthesis and to maintain quality of AV during the pharmaceutical process. Hence, the key aim of this study is to develop a method for better identification and characterization of D.P.s of AV, elseways AV monograph is not available in any pharmacopeias. The major rewards of the developed method over reported one were of use of a single method to separate and identify new sixteen D.P.s, method LC-MS/MS compatible, method sensitivity and applicability for marketed formulation. A novel, isocratic, analytical, LC-MS/MS compatible method was developed to separate all possible AV degradation products in different conditions; subjected aimed at LC-MS/MS characterization and plausible fragmentation.
2 Experimental
2.1 Chemical and reagent
Analytically pure (99.9%) reference standard of Avanafil (AV) was received as a gratis sample from Sunrise Remedies Pvt., Ltd. (Ahmedabad, India) and Om laboratory (Ahmedabad) along with a certificate of analysis. The marketed tablet formulation of Avanafil (Avana) was procured as a gratis sample from Sunrise Remedies Pvt., Ltd. (Ahmedabad, India). HPLC grade acetonitrile (ACN) and glacial acetic acid were procured from Merck, Mumbai, India. Ammonium acetate of HPLC grade was purchased from Finar Chemicals Pvt. Ltd. (Ahmedabad, India). HPLC grade water (triple distilled water) was prepared in the laboratory by distillation assembly. Hydrochloride acid, sodium hydroxide and hydrogen peroxide (30% w/v) used for stress degradation studies were of analytical grade procured from CDH chemicals, Delhi, India.
2.2 Apparatus and instrumentation
pH meter (Accurate scientific, Ahmedabad) was used to check the pH of all solutions. Other equipment used for studies were melting point apparatus (T060160, EIE Instruments Pvt. Ltd., Ahmedabad, India), precision analytical balance (CX 220, citizen, USA), sonicator (D-compact, EIE Instrument Pvt. Ltd., Ahmedabad, India) and variable micropipette (Axiva Sichem Biotech, Delhi). Precision water bath equipped with MV controller (EIE 406, EIE, Instrument Pvt. Ltd, Ahmedabad, India) was used for degradation studies in the solution state. Fourier transform infrared spectrometer (FTIR) (JASCO FT/IR − 6100 series, Jasco, Japan) was used for the identification of functional groups. The membrane filters 0.22 µm (Axiva sichem biotech, Delhi), and syringe filters 0.45 µm were used for filtration.
The Agilent 1260 Infinity HPLC (Agilent Technologies, USA) equipped with an autosampler, a quaternary pump, a UV detector, and a column compartment were used during the study. Jasco HPLC (Jasco analytical instruments, USA) equipped with PDA (Photodiode array) detector was used for peak purity calculation. LC column Nucleosil C18 (250 × 4.6 mm, 5 µm) was used for better separation. LC-MS/MS studies were carried out using MS (LTQ XL™ Linear ion trap mass spectrometer), in which the LC part consisted of autosampler HPLC and MS system consisted of LCQ Fleet Ion Trap LC/MSn (Thermo Scientific, USA). The Xcalibur software used for the data processing. For MSn experiments, the LTQ-XL-MS instrument (Thermo Scientific, USA) was used. The mass spectra were acquired and processed using Xcalibur software. The mass parameters used were mass range, 50–2000 amu; ion source (IS), 4500 v; declustering potential (DP), 20 V; entrance potential (EP), 10 V; nebulizer gas as air at a pressure of 25 psi and curtain gas as nitrogen at a pressure of 35 psi.
2.3 Chromatographic conditions
The AV stability indicating method was developed based on preliminary trials and drug physicochemical properties. Initially, ACN with water in different ratios was tried. The better separation achieved by the addition of buffer and the buffer pH should be selected in the range of ±2 of pKa of the drug. AV has pKa value 5.54 hence, the buffer pH was set between ±2 of pKa; as in that range nearly 100% of the drug is ionized or unionized which is suitable for better seperation. A further change in the organic phase ratio affects degradation peaks retention time and column temperature change can affect on elution time due to change in viscosity of the mobile phase with temerature. After several trials isocratic, novel and specific method was optimized; this fulfills all criteria according to ICH guideline. The chromatographic conditions were optimized using Hypersil, C18 (250 × 4.6 mm, 5 µm) column with a mobile phase composed of 10 mM ammonium acetate buffer (A) (pH 4.5, adjusted with acetic acid): ACN (B) (A: B, 60:40, v/v) at flow rate of 0.9 mL min−1. The column temperature, injection volume, and detector wavelength were at 20 °C, 10 µL and 239 nm, respectively. The optimized and fully validated chromatographic conditions were MS compatible hence further subjected to LC-MS studies.
2.4 Mass spectrometric conditions
LC-MS: The mass spectrometer conditions were optimized by a preliminary direct infusion of standard drug solution (10 µg mL−1) into the ESI-MS system at a flow rate of 10 µL hr-1, and all ion optics were optimized. General MS adjustments were set as follows: drying gas flow, 12 L min−1; capillary voltage, 3500 V; desolvation temperature, 350 °C; nebulizer, 36 psi; ion change control (ICC) smart target, 150000; collision gas Ar at 20 Da collision energy (CE) [if requires increments of 5% until the intensity of the precursor ion is less than 5% of the intensity of the product ions] and max accumulation time, 150 ms used throughout the analysis. Initially, the precursor ion (m + 1) values were obtained using LC-MS studies with respect to the retention time of parent drug and it’s all D.P.s. Subsequently, the MS/MS study was performed for each D.P.s to determine product ion and its fragmentation pattern.
2.4.1 MS/Ms
LC-MS and MSn studies were performed in an ESI positive mode (ES+). Various MS/TOF parameters were sequentially altered to obtain the molecular ion peak of the drug and its fragment. AV was subjected to the MS system at a concentration of 10 µg mL−1 prepared in acetonitrile in positive electrospray ionization (ESI) mode in the mass range of 50–900 Da. High purity nitrogen was used as a nebulizer and auxiliary gas. The fragmentation profile of the drug was established by caring out mass spectral studies on AV, while multi-stage (MSn) mass studies were carried out up to MS5 to determine the origin of each fragment.
2.5 Stress studies for generation of degradation products
Stress degradation was carried out in different conditions like as hydrolysis (acidic, basic and neutral), oxidative, photolytic, and thermal according to the recommendations in ICH Q1A (R2). The stress studies were carried out by preparing the AV solution of 1 mg mL−1 in the respective stressor. Acetonitrile (2 mL) was added to dissolve 10 mg drug and then the volume was made up to 10 mL with respective stressors. From that, 0.1 mL of sample was withdrawn at suitable time intervals and neutralized with acid/alkali and/or diluted up to 1 mL with ACN: H2O (50:50, v/v) to get the concentration (100 µg mL−1) then injected in HPLC.
Different degradation conditions as the molar concentration of stressor, temperature, and stress duration were selected based on initial trial results, which reveals the formation of primary D.P.s. Different degradation conditions Hydrolytic (acidic and alkaline) degradation study was carried out by refluxing the drug in 1 N concentrations of HCl and NaOH at different temperatures as 60, 70, and 80 °C, while neutral hydrolysis was performed in an equal mixture of water and ACN. For oxidative degradation study, the drug was subjected to 1%, 6%, and 10% peroxide at room temperature. Thermal stress degradation was carried out by exposing the solid drug as a thin layer in the petri-dish for 7 hr and as in solution form, an equal mixture of water and ACN was used and kept for 5 hr in an oven at 60 °C. Photolytic degradation study was carried out in the solid drug for 8 hr as well as drug solutions (an equal mixture of water and ACN) for 6 hr in direct sunlight. For Photodegradation comparison, a solid sample was placed in a photostability chamber at 1.2 million Lux hr for 6 hr. All stressed samples were kept in the amber color vial at the refrigerator until analysis.
The marketed formulation was also subjected to all degradation conditions. All stressed samples were collected, neutralized, and filtered through a 0.22 µm pore size membrane syringe filter before LC and LC-MS/MS analysis.
2.6 In silico studies
In silico study was carried out for the impurities for the prediction of physicochemical parameters like cLogP, Solubility (LogS), topological polar surface area (TPSA). Prediction of toxicity risk (in silico) was also carried out for the toxicity factors like mutagenicity, tumorigenicity, irritant, and reproductive effects using OSIRIS property explorer which uses Chou and Jurs algorithm, based on computed atom contributions. This software allows to underline properties with high risks of undesired effects such as mutagenicity, poor intestinal absorption, or drug conform behavior via different customization features. The OSIRIS property explorer calculates on-the-fly various drug-relevant properties whenever a structure is valid. Prediction results are valued and color-coded. Properties with high risks of undesired effects like mutagenicity or poor intestinal absorption are shown in red. Whereas a green color indicates drug-conform behavior. A working Java Runtime Environment (JRE) must be installed on the computer.
3 Result and discussion
3.1 LC separation of the drug and degradation products
The SIAM was developed and an optimized chromatographic condition (as described in Section 2.3) was used for hydrolysis, oxidative, photolysis, and thermal degradation conditions. A total sixteen D.P.s were found during different degradation conditions as shown in overlay chromatogram Fig. 1. The degradation results reveals that % degradation of AV found 21.71–25.62% in acidic condition; 20.00–25.00% in alkaline condition; 14.00–19.21% in neutral condition; 16.25–30.52% in oxidative hydrolysis; 22.39–28.96% in photolytic and 28.00–28.50% in thermal degradation. The drug (AV) found sensitive towards thermal, photolytic, oxidative, and hydrolytic conditions according to the AV stress degradation study (Table 1). The degradation was confirmed from the additional peaks achieved in the respective chromatogram and also by the reduction in the area of AV in each condition when compared with their area at zero time. The mass balance was calculated from the AV and all the D.P.s responses obtained after stress studies. Mass balance found greater than 90 for alkaline, photolytic, and thermal degradation conditions. While for acid and oxidative degradation it was 89 and 82 respectively, due to loss of some mass during degradation as seen in Table 1.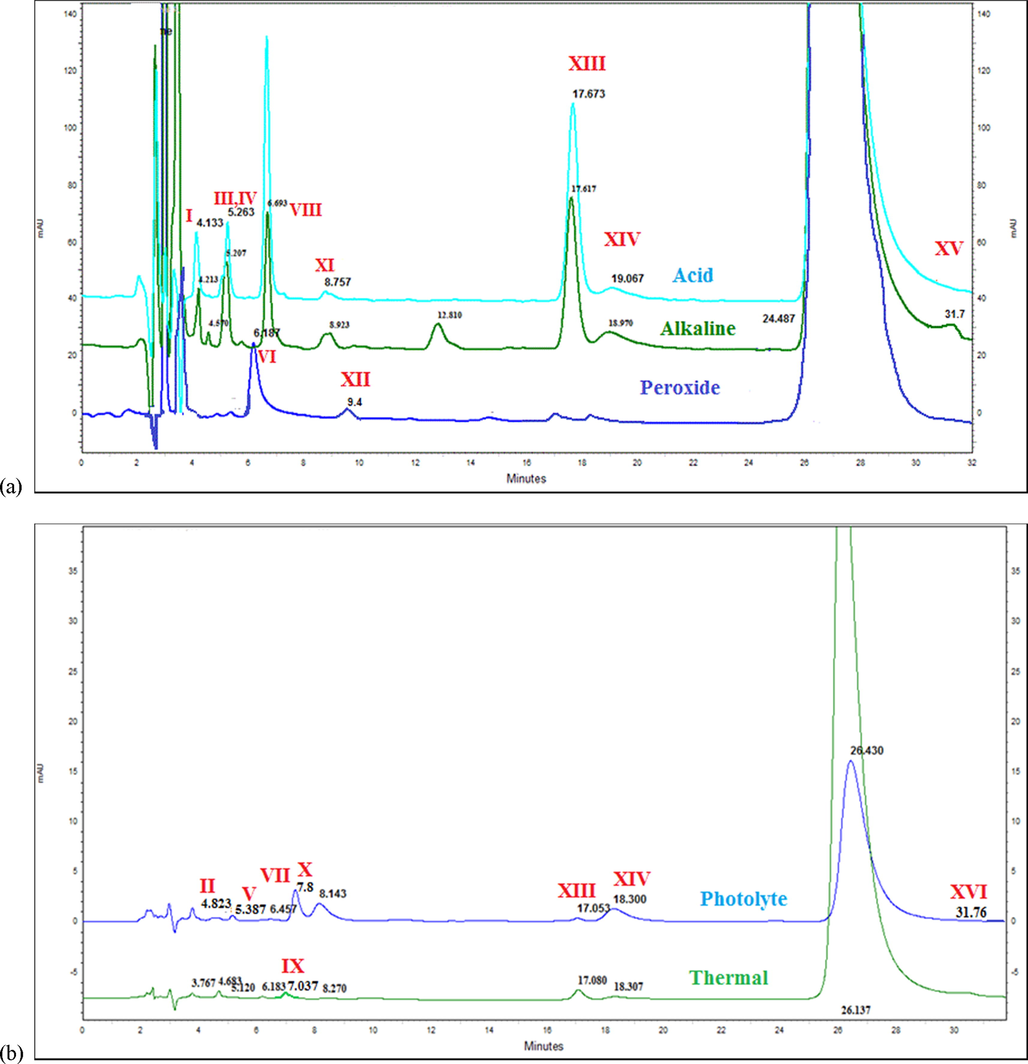
Overlay chromatogram of AV (100 µg/mL) in (a) acid hydrolysis, alkaline hydrolysis and peroxide (b) photolytic and thermal degradation in the optimized chromatographic condition.
Forced degradation condition
Stress degradation condition
% Appropriate degradation observed
% Mass balance obtained
Acid hydrolysis
1 N HCl at 60 °C for 9 hr
21.710
89
1 N HCl at 70 °C for 8 hr
25.620
88
1 N HCl at 80 °C for 6 hr
22.390
89
Alkaline hydrolysis
1 N NaOH at 60 °C for 4 hr
20.000
92
1 N NaOH at 70 °C for 4 hr
23.550
91
1 N NaOH at 80 °C for 3 hr
25.000
92
Neutral hydrolysis
60 °C for 12 hr
14.001
91
70 °C for 12 hr
16.902
92
80 °C for 12 hr
19.210
92
Oxidative hydrolysis
1% H2O2 for 4 hr
22.171
82
6% H2O2 for 2 hr
30.521
82
10% H2O2 for 30 min
16.250
83
Photolytic degradation
Solid-state 8 hr
22.391
98
Liquid state 6 hr
23.000
28.96698
Solid sample at 1.2 million Lux hr for 6 hr in Photostability chamber
99
Thermal degradation
Solid-state, 60 °C for 7 hr
28.000
95
Liquid state, 60 °C for 5 hr
28.501
96
Amongst all the degradation conditions, the order of degradation behavior (based on average % degradation in each condition) observed was
Thermal > Photolytic > Oxidative > Hydrolytic (acid, alkaline and neutral)
The optimized LC method was compatible with LC-MS, hence subjected to LC-MS/MS study for AV degradation products. In different degradation conditions (acidic, alkaline, oxidative, photolytic, and thermal), various D.P.s were found. Nomenclature of formed D.P.s in different condition were given based on their Rt (retention time). Found D.P.s in LC chromatogram for the acid condition D.P. I, III, IV, VIII, XI, XIII and XIV; in alkaline condition D.P. I, III, IV, VIII, XI, XIII, XIV and XV; in neutral degradation of the drug formation of D.P.s I, III, IV, VIII, XIII and XIV; in oxidative degradation of the drug formation of D.P.s VI, XII, XIII, and XIV; in photolytic degradation D.P. II, V, VII, X, XIII, XIV and XVI and in thermal degradation D.P. II, V, IX, XIII, and XIV as shown in Fig. 1, Table 2. For additional confirmation of LC degradation peaks by LC-MS/MS peaks, RRT (relative retention time) and PDA (Photodiode array) data were used.
No
aPeak name
bPeak code
cDegradation condition
dRt (min)
eRRT
fMW
gEmpirical formula
hMS/MS fragments
1
AV I
a
Acid, Alkaline
4.13
0.156
450
C22 H26 N8 O3
C22 H26 N8 O3 (450.00)
C18 H22 Cl N5 O2 (375.10)
C17 H19 Cl N5 O (343.15)
2
AV II
i
Photolytic, Thermal
4.82
0.160
498
C23 H26 Cl N7 O4
C23 H26 Cl N7 O4 (498.00)
C15 H19 N7 O3 (343.43)
C8 H8 Cl O (155.03)
3
AV III
b
Acid, Alkaline
5.26
0.198
401
C18 H17 Cl N6 O3
C18 H17 Cl N6 O3 (401.82)
C12 H12 Cl N3 O2 (266.10)
C6 H7 N3 O (137.14)
C8 H8 Cl O (155.04)
C4 H5 N3 O (111.10)
4
AV IV
c
Acid, Alkaline
5.26
0.198
358
C18 H22 N5 O3
C18 H22 N5 O3 (358.08)
C11 H16 N5 O2 (249.13)
C7 H7 O (108.05)
5
AV V
j
Photolytic, Thermal
5.39
0.201
500
C23 H26 Cl N7 O4
C23 H26 Cl N7 O4 (500)
C23 H25 Cl N7 O3 (482.20)
C8 H8 Cl O (155.036)
6
AV VI
o
Oxidative
6.19
0.233
518
C23 H25 Cl2 N7 O3
C23 H25 Cl2 N7 O3 (518.25)
C17 H19 Cl2 N4 O2 (381.05)
C8 H8 Cl O (155.13)
7
AV VII
k
Photolytic, Thermal
6.46
0.245
515
C23 H26 Cl N7 O5
C23 H26 Cl N7 O5 (515.92)
C23 H27 N7 O5 (482.18)
8
AV VIII
d
Acid, Alkaline
6.69
0.251
393
C18 H21 Cl N4 O4
C18 H21 Cl N4 O4 (393.17)
C18 H20 Cl N4 O3 (375.10)
C8 H8 Cl O (155.06)
9
AV IX
n
Thermal
7.04
0.282
454
C22 H24 Cl N7 O2
C22 H24 Cl N7O2 (454.17)
C17 H18 Cl N4 O2 (345.10)
C5 H7 N3 (109.13)
10
AV X
l
Photolytic
7.85
0.286
468
C22 H24 Cl N7 O3
C22 H24 Cl N7 O3 (468.98)
C15 H18 N6 O2 (312.25)
C7 H6 Cl N O (155.04)
11
AV XI
e
Acid, Alkaline
8.75
0.330
349.17
C17 H21 Cl N4 O2
C17 H21 Cl N4 O2 (349.17)
C17 H20 Cl N4 O (331.10)
C9 H13 N4 (178.24)
C8 H8 Cl O (155.04)
12
AV XII
p
Oxidative
9.40
0.355
488
C23 H30 Cl N7 O3
C23 H30 Cl N7 O3 (488.17)
C8 H8 Cl O (155.03)
C15 H23 N7 O2 (333.39)
13
AV XIII
f
(Acid, Alkaline, Thermal, Oxidative, Photolytic)
17.67
0.665
450
C22 H26 N8 O3
C22 H26 N8 O3 (450.25)
C18 H21 N4 O3 (341.13)
C17 H19 N4 O3 (328.17)
C5 H7 N3 (109.13)
14
AV XIV
g
(Acid, Alkaline, Thermal, Oxidative, Photolytic)
19.06
0.718
392
C18 H22 Cl N5 O3
C18 H22 Cl N5 O3 (392.17)
C18 H20 Cl N4 O3 (375.13)
C8 H8 Cl O (155.09)
15
AV XV
h
Alkaline
31.70
1.195
526.17
C25 H27 Cl N8 O3
C25 H27 Cl N8 O3 (526.17)
C20 H22 Cl N5 O3 (417.07)
C5 H6 N3 (109.13)
16
AV XVI
m
Photolytic
31.76
1.197
485.15
C23 H26 Cl N7 O3
C23 H26 Cl N7 O3 (485.83)
C18 H21 Cl N4O3 (376.15)
C18 H20 Cl N4O2 (359.83)
C17 H20 Cl N4O (328.36)
C8 H8 Cl O (155.08)
The degradation pattern of AV in photolytic and thermal conditions was found similar in liquid state and solid-state. Common D.P.s for acid and alkaline hydrolysis are I, III, IV, VIII, XI, XIII and XIV. Common D.P.s between acid, alkaline and neutral degradation are I, III, IV, VIII, XIII and XIV. At last for photolytic and thermal degradation found common D.P.s are II, V, XIII and XIV. Besides, AV XIII and AV XIV were common D.P.s in all conditions. The AV sixteen D.P.s were identified and characterized by LC-MS/MS and fragmentation pattern. The D.P.s structure were proposed based on MS/MS data and MSn fragmentation.
3.2 Mass fragmentation behavior of AV
AV Fragmentation by MS/MS studies showed up to MS5. AV was analyzed in positive ion mode by direct flow injection using ACN: water (1:1, v/v) mixture as the solvent through MSn spectra to determine the origin of each fragment. Line spectra of drugs, obtained in MS and MSn studies are shown in Supplementary Fig S1. The best possible molecular formula and exact masses for the fragments were calculated using an elemental composition calculator. The same are listed in Table 2.
The MS/MS spectrum of AV is as shown in Supplementary Fig S1. AV having a molecular formula of C23H26ClN7O3 (m/z 483.95). The fragment of AV (m/z 483) with m/z 484.22 was formed as an M + 1 peak, the fragment m/z 485.97 formed due to M + 2 peak and the fragment with m/z 506.14 was formed as a sodium adduct since its mass was approximately 1 Da (Da), 2 Da (Da) and 23 Da (Da) higher than the molecular ion peak. The mass peak of AV shows chloro pattern (1:3) in spectra which confirms the presence of chlorine in structure. MS/MS spectra shows that AV m/z 484.22 further fragment in to m/z 375.09, m/z 357.10, m/z 342, m/z 329.14 and m/z 155.12. From the MS/MS spectra, a postulated fragmentation pattern was derived as shown in Fig. 2. From drug AV, MS2 fragment m/z 375.09 was formed due to the loss of C5H7N3 (Diamino pyridine). Further, it fragments into MS3 m/z 357.1 due to loss of H2O (water) molecule and MS4 m/z 342.00 was formed due to removal of the methyl group. Then AV fragments into MS5 m/z 329.14 due to loss of - COH. At last due to cleavage of a single bond from m/z 329.14 structure it converted in to m/z 155.12. The MS/MS spectra reveals that m/z 155.12 is common to the last fragment of AV, having a molecular formula of C8H8ClO and chemical name of 2-chloro-1-methoxy-4-methyl-benzene. The best possible molecular formula and exact masses for the fragments were calculated as shown in Table 2.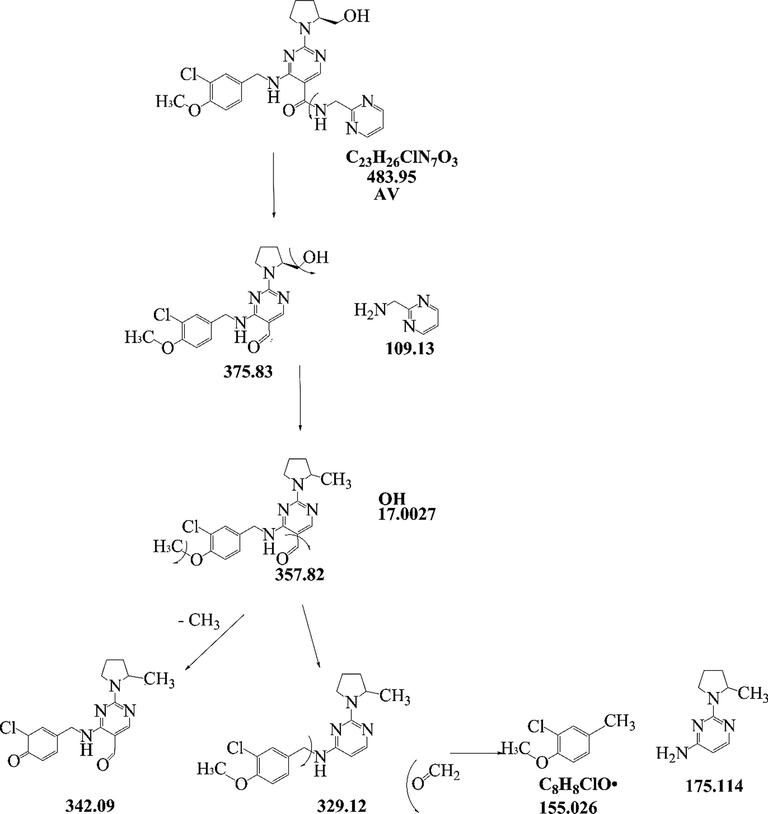
Proposed fragmentation pattern of AV.
3.3 Characterization of the impurities and degradation products using mass data
All the D.P.s were characterized based on LC-MS/MS. The line spectra of all the D.P.s were taken in ESI positive (ES+) mode. Accurate mass data of the molecular ions, their fragments, and accurate masses were listed in Table 2. Degradation peaks generated in all conditions were numbered as AV I to AV XVI and structures were predicted as shown in Fig. 3. They were characterized and identified from mass data. The data obtained in LC-MS and MS/MS studies were systematically utilized for the structure elucidation of D.P.s of AV as described below.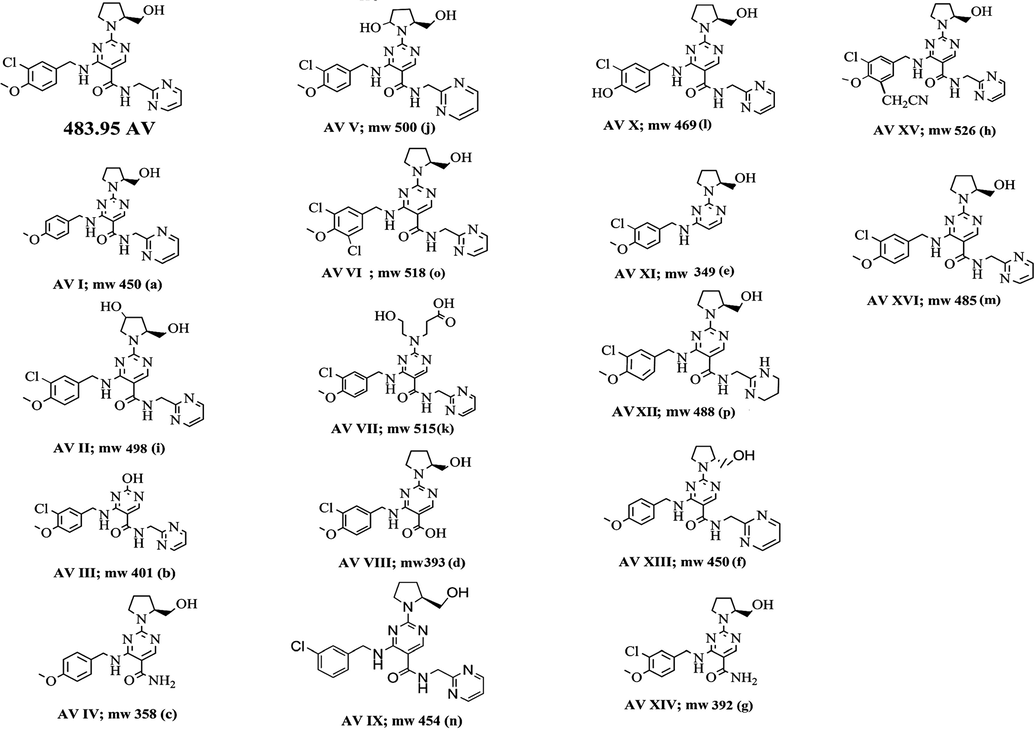
Structure of AV and proposed structures of its degradation products.
3.3.1 Acid degradation products
3.3.1.1 AV I (m/z 450.00) (a)
The degradation product AV I, m/z 450 with an elemental composition C22H26N8O3 detected at 4.13 min in acid and alkaline hydrolysis conditions. LC-MSMS/MS line spectra of AV I in Supplementary Fig S2 (i), showed the formation of fragments with m/z 450.00, m/z 375.10, and m/z 343.15. Structure of AV I having –OH functional group, in the presence of hydrochloric acid and temperature, hydroxyl (–OH) functional group replaced with chlorine group (-Cl) and further water molecule removed. AV I (m/z 450) converted into m/z 468.94 due to chlorination. Further m/z 468.94 reduced to a fragment of m/z 375.10, indicating the loss of C4H6N4. Lastly from the structure of m/z 375.10 removal of –CH3O and lead to formation of m/z 343.15. The product ion peaks at m/z 468, m/z 375, m/z 343, and m/z 155 indicates the presence of chlorine in structure. The elemental compositions of all these ions have been confirmed by mass measurements (Table 2, Supplementary Fig S2 (i)). Based on these data, AV I was identified as 4-{[(4-methoxyphenyl) methyl] amino} −2- [2-(hydroxymethyl) pyrrolidin-1-yl] - N-(pyrimidin-2-yl methyl) pyrimidine- 5- carboxamide.
AV III and IV are co-eluting peaks observed with LC and confirmed during LC-MS/MS study. They were named AV III (b) and AV IV (c) having a molecular weight of m/z 401.00 and m/z 358.08, respectively.
3.3.1.2 AV III (m/z 401.00) (b)
The degradation product AV III at m/z 401 with an elemental composition C18H17ClN6O3 detected at 5.26 min in acid and alkaline hydrolysis conditions. LC-MS/MS spectra as shown in Supplementary Fig S2 (ii,b), showed the formation of fragments of AV III (b) (m/z 401) and m/z 358.08 (c). Further AV III fragmented into m/z 266.10 and m/z 155.04. The AV III (m/z 401) structure break from –CH bond and converted into C12H12ClN3O2 (m/z 266.10) due to loss of C6H7N3O (m/z 137.14). Lastly m/z 266.10 (b1) converted into two fragments of m/z 155.04 (C8H8ClO) and C4H5N3O (m/z 111.10). The diagnostic product ions at m/z 155 was common to the last fragment in each condition, having a molecular formula of C8H8ClO and chemical name of 2-chloro-1-methoxy-4-methyl-benzene. Based on these data (Table 2, Supplementary Fig S2 (ii, b) AV III was identified as 4-((3-chloro-4-methoxybenzyl) amino)-2-hydroxy-N-(pyrimidin-2-yl methyl) pyrimidine-5-carboxamide.
3.3.1.3 AV IV (m/z 358)(c)
The degradation product AV IV at m/z 358 with an elemental composition C18H22N5O3 detected at 5.26 min in acid and alkaline hydrolysis conditions. LC-MS/MS spectra as shown in Supplementary Fig S2 (iii, c), showed that degradation product AV IV (m/z 358.08) (c) was co-eluting with AV III (m/z 401). From the AV IV (m/z 358.08 (c), C18H23N5O3) structure cleavage of –CH bond leads to formation of C7H7O (m/z 108.05) and C11H16N5O2 (m/z 249.13) (c1). Based on these data (Table 2, Supplementary Fig S2 (iii, c) AV IV was identified as 2-(2-(hydroxymethyl) pyrrolidin-1-yl)-4-((4-methoxybenzyl) amino) pyrimidine −5-carboxamide.
3.3.1.4 AV VIII (m/z 393)(d)
The degradation product AV VIII at m/z 393 with an elemental composition C18H21ClN4O4 detected at 6.69 min in acid and alkaline hydrolysis conditions. An LC-MS/MS spectrum of AV VIII (m/z 393.17) (d) shows the presence of chlorine abundance (1:3) in mass spectra which confirms the presence of chlorine in structure as shown in Supplementary Fig S2 (iv). The LC-MS/MS spectra showed the fragments of m/z 393.17, m/z 375.10 and m/z 155.06. AV VIII having a molecular formula of C18H20ClN4O3 converted into C18H20ClN4O3 (m/z 375.10) due to loss of 18 u which suggests loss of H2O from the m/z 393.17 structure. Further m/z 375.10 fragmented into m/z 155.06 due to cleavage of –CH bond. The product ions at m/z 393, m/z 375, and m/z 155 act as diagnostic ions to propose the structure of AV VIII. Based on these data (Table 2, Supplementary Fig S2 (iv) AV VIII was identified as 4-{[(3-chloro-4-methoxy phenyl) methyl] amino}-2-[2-(hydroxymethyl) pyrrolidin-1-yl] pyrimidine-5-carboxylic acid. The Can, 2018 had identified AV VIII (m/z 393) as related substance 2, which formed due to replacement of the amide group with an acidic group.
3.3.1.5 AV XI (m/z 349.17)(e)
The acid and alkaline hydrolytic degradation product AV XI at m/z 349.17 with an elemental composition C17H21ClN4O2 detected at 8.75 min. The LC-MS/MS spectra shown in Supplementary Fig S2 (v) indicate peak having a molecular mass of m/z 349.17 (e). The mass difference between the AV XI (m/z 349.17) and product ion m/z 331.10 (C17H20ClN4O) was 18 u which suggests that m/z 331 form by loss of H2O from the AV XI. Structure of m/z 331.10 further converted into C8H8ClO (m/z 155.04) and C9H13N4 (m/z 178.24) due to cleavage of –CH bond. The product ions at m/z 349, m/z 331, and m/z 155 are diagnostic ions for the proposed structure of AV XI. Based on these data (Table 2, Supplementary Fig S2 (v) AV VIII was identified as (1-(4-((3-chloro-4-methoxybenzyl) amino) pyrimidin-2-yl) pyrrolidin-2-yl) methanol.
3.3.1.6 AV XIII (m/z 450.25)(f)
The acid, alkaline hydrolysis, thermal, oxidative, and photolytic degradation product AV XIII (m/z 450.25) with an elemental composition C22H26N8O3 detected at 17.67 min. LC-MS/MS spectra of AV XIII (m/z 450.25) (f) as shown in Supplementary Fig S2 (vi). AV XIII having the same molecular mass as AV I but having different product ion due to R form enantiomer. The LC-MS/MS spectra show peaks of m/z 450.25, m/z 341.13, and m/z 328.17. AV XIII (m/z 450.25) fragmented into m/z 341.13 due to the removal of C5H7N3 (m/z 109.13). Obtained m/z 341.13 converted into C17H19N4O3 (m/z 328.17) due to the loss of the methyl (–CH3) group from the structure. The product ions at m/z 450.25, m/z 341.13, and m/z 328.17 were diagnostic ions for the proposed structure of AV XIII. Based on these data (Table 2, Supplementary Fig S2 (vi) AV XIII was identified as 2-(2-(hydroxymethyl) pyrrolidin-1-yl) – 4 - ((4-methoxybenzyl) amino)- N -(pyrimidin − 2-yl methyl) pyrimidine − 5-carboxamide.
3.3.1.7 AV XIV (m/z 392.17)(g)
The degradation product AV XIV at m/z 392 with an elemental composition C18H22ClN5O3 detected at 19.06 min in acid hydrolysis, alkaline hydrolysis, thermal, oxidative and photolytic degradation conditions. LC-MS/MS spectra of AV XIV (m/z 392.17) (g) as shown in Supplementary Fig S2 (vii). The spectra showed the product ion peak at m/z 392.17, m/z 375.13, and m/z 155.09. The LC-MS/MS spectra of AV XIV showed a high abundance product ion at m/z 392.17, which fragmented into m/z 375.13 due to the removal of ammonia (NH3) from structure. Further m/z 375.13 fragmented into m/z 155.09 and m/z 222.24 due to cleavage of –CH bond. Based on these data (Table 2, Supplementary Fig S2 (vii) AV XIV was identified as 4-((3-chloro-4-methoxybenzyl) amino)-2-(2-(hydroxymethyl) pyrrolidin-1-yl) pyrimidine −5 - carboxamide. The Can, 2018 had identified AV XIV (m/z 393) as related substance 1, which formed due to electro withdrawing properties of the amide moiety.
3.3.2 Alkaline degradation products
The degradation pattern of alkaline degradation conditions was similar to the acidic condition. In alkaline degradation, all the D.P.s of acid degradation were found. In addition to that one more D.P. was found having molecular weight as m/z 526.17.
3.3.2.1 AV XV (m/z 526.17)(h)
The base hydrolytic degradation product AV XV at m/z 526.17 with an elemental composition C25H27ClN8O3+ was detected at 31.70 min. During alkaline hydrolysis acetonitrile was used as solvent to solubilize AV in alkaline medium, hence degradation product AV XV (m/z 526.17) (h) formed due to addition of methyl cyanide (C2H3N, m/z 41.053) in AV structure. Acetonitrile adduct formation was further confirmed by using methanol as a solvent in place of acetonitrile and peak was absent. As shown in Supplementary Fig S3, m/z 526.17 further fragmented into C18H21N4O3 (m/z 417.07) due to the removal of C5H6N3 (m/z 109.136). Based on these data (Table 2, Supplementary Fig S3, AV XV was identified as acetonitrile adduct of AV.
3.3.3 Photolytic degradation products
In photolytic degradation D.P.s II, V, VII, X, XIII, XIV, and XVI were found. From that D.P.s XIII and XIV were common for all degradation. Found new degradation products for photolytic degradation were D.P.s II, V, VII, X, and XVI.
3.3.3.1 AV II (m/z 498) (i)
The photolytic and thermal degradation product AV II at m/z 498 with an elemental composition C23H26ClN7O4 detected at 4.82 min. The LC-MS/MS spectra of AV II (m/z 498.00) (i) show a higher abundance product ion peak at m/z 498.00 and further fragmented into m/z 155.07 as shown in Supplementary Fig S4 (i). AV II converted into m/z 155.038 (C8H8ClO) and m/z 345.15 (C15H19N7O3) due to the breakage of - CH bond from the amino functional group. Based on these data of product ions (Table 2, Supplementary Fig S4 (i), AV II was identified as 4-((3-chloro-4-methoxybenzyl) amino)-2-(4-hydroxy-2-(hydroxymethyl) pyrrolidin-1-yl)-N-(pyrimidin-2-yl methyl) pyrimidine − 5 - carboxamide
3.3.3.2 AV V (m/z 500.00) (j)
The photolytic and thermal degradation product AV V at m/z 500 with an elemental composition C23H26ClN7O4 detected at 5.39 min. AV V differs from AV II due to a change in the position of the hydroxyl (–OH) functional group. The LC-MS/MS spectra of AV V (m/z 500) (j) shows a high abundance product ion peak at m/z 500, m/z 482.20 and m/z 155.03 as shown in Supplementary Fig S4 (ii). From the structure of AV V (m/z 500) removal of the hydroxide group (–OH), it converted into m/z 482.20 having an elemental composition of C23H25ClN7O3. Further m/z 482.20 fragmented into m/z 155.03 and m/z 329.36 due to cleavage of –CH bond. Based on these data of product ions (Table 2, Supplementary Fig S4 (ii)) structure of AV V was proposed and identified as 4-((3-chloro-4-methoxybenzyl) amino)-2-(2-hydroxy-5-(hydroxymethyl) pyrrolidin-1-yl)- N-(pyrimidin-2-yl methyl) pyrimidine-5-carboxamide.
3.3.3.3 AV VII (m/z 515)(k)
The photolytic and thermal degradation product AV VII at m/z 515.92 with an elemental composition C23H26ClN7O5 detected at 6.46 min. The increase of 32 Da in molecular weight compared to the drug suggests that AV VII was a di-oxidative degradation product. The LC-MS/MS spectra of AV VII (m/z 515) (k) as shown in Supplementary Fig S4 (iii) indicates the presence of product ion peaks at m/z 515.92, m/z 482.18 and m/z 433. AV VII (m/z 515.92) converted into m/z 482.18 due to dechlorination (removal of -Cl group having a molecular mass of m/z 35). Further m/z 482.18 fragmented into m/z 433 (C22H24N7O3) by removal of CH2O2 (m/z 45). Based on these data of product ions (Table 2, Supplementary Fig S4 (iii)) structure of AV VII was proposed and identified as 3-((4-((3-chloro-4-methoxybenzyl) amino)-5-((pyrimidin-2-yl methyl) carbamoyl) pyrimidin-2-yl) (2-hydroxyethyl) amino) propanoic acid.
3.3.3.4 AV X (m/z 468.08) (l)
The degradation product AV X at m/z 468 with elemental composition C22H24ClN7O3 detected at 7.85 min in photolytic degradation. The LC-MS/MS spectra of AV X (m/z 468.08) (l) having high abundance product ion peaks at m/z 468.08, m/z 312.25 and m/z 155.04 as shown in Supplementary Fig S4 (iv). AV X (m/z 468.08) fragmented in to C7H6ClNO (m/z 155.04) and C15H17N6O2 (m/z 312.34) due to –CH bond cleavage. Based on product ions and fragment ions AV X structure was proposed as a demethylated analog of AV as shown in Table 2, Supplementary Fig S4 (iv). The Structure was identified as 4-((3-chloro-4-hydroxy benzyl) amino)-2-(2-(hydroxymethyl) pyrrolidin-1-yl) - N -(pyrimidin-2-yl methyl) pyrimidine-5-carboxamide.
3.3.3.5 AV XVI (m/z 485.83) (m)
The degradation product AV XVI at m/z 485.83 with elemental composition C23H26ClN7O3 detected at 31.76 min in photolytic degradation. The LC-MS/MS spectra of AV XVI (m/z 485.83 (m) showed high abundance product ions at m/z 485.83, m/z 468.08, m/z 376.15, m/z 328.36 and m/z 155.08 as shown in Supplementary Fig S4 (v). The structure of AV XVI (m/z 485.83) converted into product ion at m/z 376.15 due to the removal of C5H7N3 (aminomethyl pyrimidine). Further from the structure of m/z 376.15 loss of hydroxide group and –CH2O group, it converted into product ion at m/z 328.36. Lastly m/z 328.36 product ion peak fragmented into m/z 155.08 (C8H8ClO) and m/z 177.23. Based on data of product ion peaks and fragmentation pattern as shown in Table 2, Supplementary Fig S4 (v) structure of AV XVI was proposed and identified as a 4-((3-chloro-4-methoxybenzyl) amino) − 2- (2- (hydroxymethyl) pyrrolidin-1-yl) – N - (pyrimidine – 2- yl-methyl) pyrimidine- 5- carboxamide.
3.3.4 Thermal degradation products
During thermal degradation D.P.s II, V, IX, XIII and XIV were found. Common D.P. between photolytic and thermal degradation was D.P. II. Further D.P.s XIII and XIV were common for all degradation. For thermal degradation conditions found different D.P. was IX.
3.3.4.1 AV IX (m/z 454) (n)
The degradation product AV IX at m/z 454.17 with an elemental composition C22H24ClN7O2 was detected at 7.04 min in thermal condition. The LC-MS/MS spectra of AV IX (m/z 454) (n) showed a high abundance peak at m/z 454.17 and m/z 345.10 as shown in Supplementary Fig S5. AV IX (m/z 454) fragmented in to C17H18ClN4O2 (m/z 345.8) due to removal of C5H7N3 (m/z 109.13). Based on data of product ion peak and fragmentation pattern as shown in Table 2, Supplementary Fig S5 structure of AV XVI was proposed and identified as 4-((3-chlorobenzyl) amino) −2- (2- (hydroxymethyl) pyrrolidin − 1- yl) - N -(pyrimidin – 2 –yl methyl) pyrimidine −5- carboxamide, which is the de-methoxybenzyl analog of AV.
3.3.5 Oxidative degradation products
Found D.P.s in oxidative conditions were VI, XII, XIII and XIV. D.P.s XIII and XIV were common for acid, alkaline, oxidative, photolytic and thermal degradation. Found new D.P.s in oxidative conditions were VI and XII.
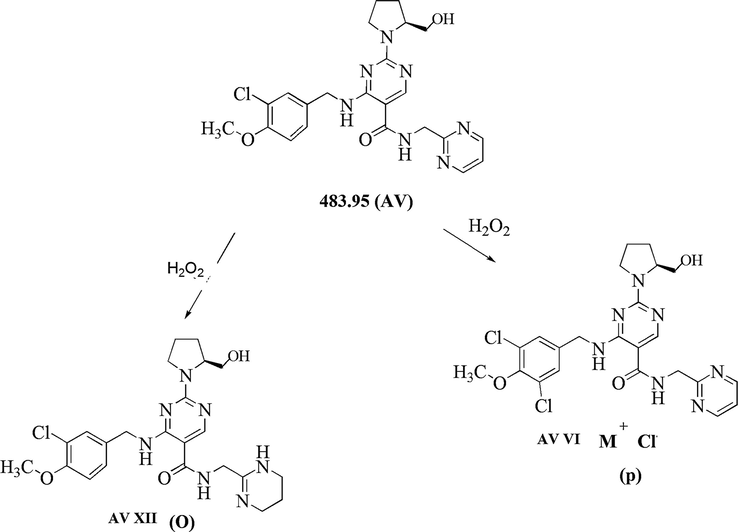
3.3.5.1 AV VI (m/z 518.25) (o)
The oxidative degradation product AV VI at m/z 518.25 with an elemental composition C23H25Cl2N7O3 was detected at 6.19 min. The LC-MS/MS spectra of AV VI (m/z 518.25) (o) was as shown in Supplementary Fig S6 (i). The spectra showed high abundance product ions at m/z 534.17 (addition of oxygen in m/z 518.25), m/z 518.25 (M + 16 peak, the addition of one chlorine functional group in the structure of AV), m/z 381.05 (removal of C6H6N3O from m/z 518.25) and m/z 155.13. The m/z 381.05 fragmented into m/z 155.03 (last most common fragment) and m/z 193.109 due to cleavage of –CH bond. Based on data of product ion peaks and fragmentation pattern as shown in Table 2, Supplementary Fig S6 (i) structure of AV VI was proposed and identified as 4-((3,5-dichloro-4-methoxybenzyl) amino) − 2- (2-(hydroxymethyl) pyrrolidin-1-yl) – N - (pyrimidin-2-yl methyl) pyrimidine −5- carboxamide.
3.3.5.2 AV XII (m/z 488.17) (p)
The oxidative degradation product AV XII at m/z 488.17 with an elemental composition C23H30ClN7O3 was detected at 9.40 min. The LC-MS/MS spectra of AV XII (m/z 488.17) (p) was as shown in Supplementary Fig S6 (ii). The spectra showed high abundance product ions at m/z 488.17 (conversion of a pyrimidine to tetrahydro pyrimidone in AV due to oxidation), m/z 333.39 (fragment due to cleavage of –CH bond from m/z 488.17) and m/z 155.03. Based on data of product ions and fragmentation pattern as shown in Table 2, Supplementary Fig S6 (ii) structure of AV XII was proposed and identified as 4-((3-chloro-4-methoxybenzyl) amino)-2-(2-(hydroxymethyl) pyrrolidin-1-yl) – N -((1,4,5,6 – tetrahydro pyrimidine – 2 -yl) methyl) pyrimidine-5-carboxamide.
3.4 Postulated mechanistic pathway for the formation of D.P.s
Based on the data obtained from the line spectra of LC-MS/MS studies of each degradation product, the proposed degradation pathway of AV in different degradation conditions were established. The degradation pathways for AV in (i) acid, (ii) alkaline, (iii) photolytic, (iv) thermal and (v) oxidative degradation conditions were shown as Fig. 4, Fig. 5, Fig. 6, Fig. 7 and Fig. 8.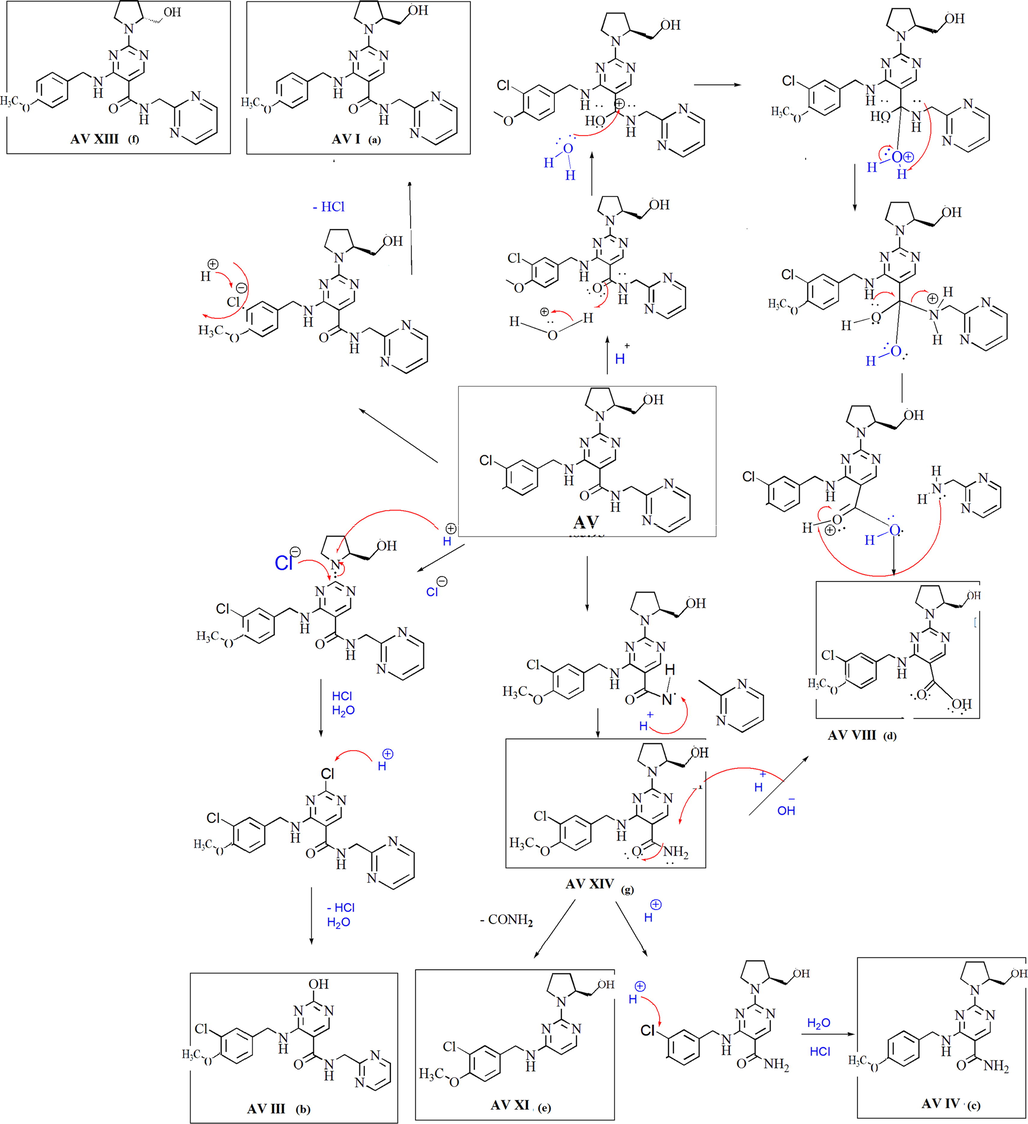
Degradation mechanism of AV in acidic condition.
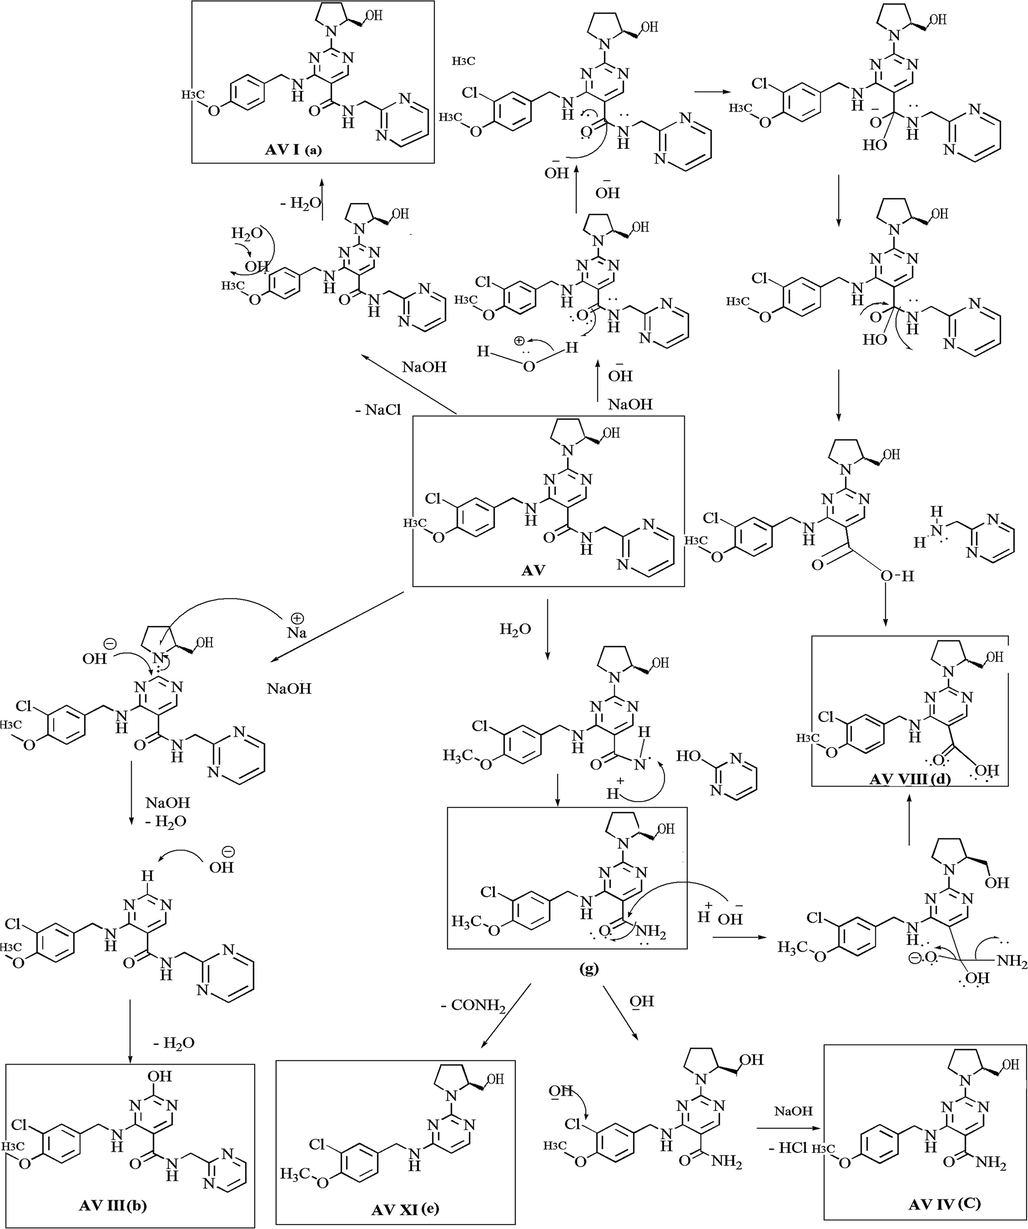
Degradation mechanism of AV in alkaline condition.
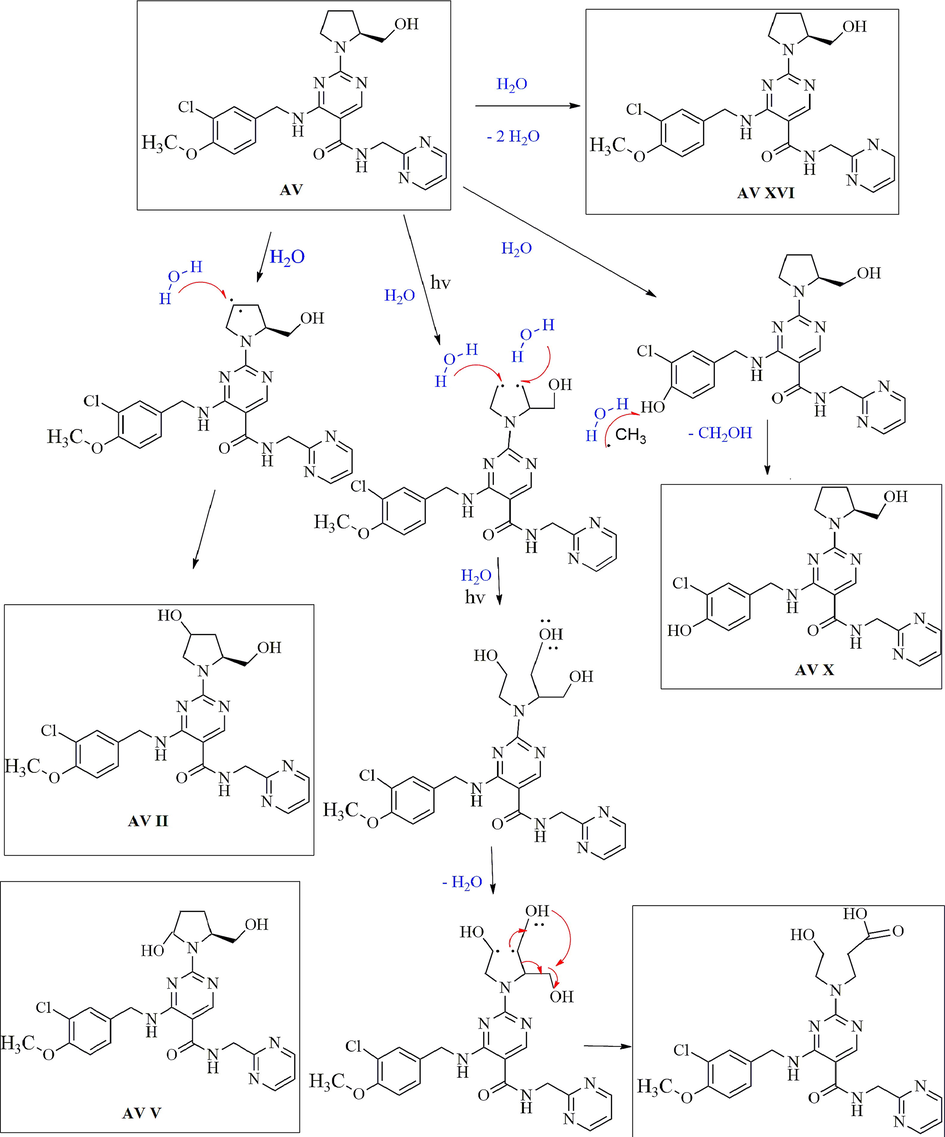
Degradation mechanism of AV in photolytic condition.
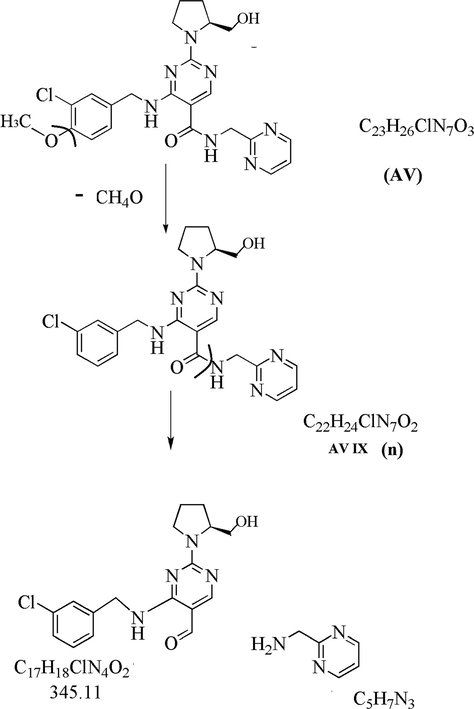
Degradation mechanism of AV in thermal condition.
Degradation mechanism of AV in oxidative condition.
In acid hydrolysis, AV XIV form due to cleavage of –CH bond between carbonyl amide and pyrimidine ring from the structure of AV. Formation of AV VIII from the structure of AV explained by nucleophilic substitution reaction and formation of aryl carboxylic acid from aryl amide with loss of amino pyrimidine. From the AV XIV structure loss of ‘CONH’ functional group leads to the formation of the AV XI degradation product. AV IV degradation product form due to dechlorination from the structure of AV XI. AV III degradation product form in the presence of acid hydrolysis by removal of pyrrolidine ring by – OH (hydroxy) functional group. Formation of AV I and AV XIII can be explained by dechlorination from the AV structure. Both degradation product having the same molecular mass but position of - OH functional group is different and further fragments are different, confirms that AV XIII is R isomeric form of AV I. (Fig. 4)
In the case of alkaline hydrolysis, the formation of AV I from AV can be explained by the removal of chlorine functional group. The formation of AV VIII is explained by nucleophilic substitution reaction due to OH– ion abstracts the proton followed by hydrolysis. AV XIV form due to hydrolysis of AV and removal of the pyrimidine ring. The formation of AV XI is explained by the removal of ‘CONH’ functional group from the structure of AV and AV IV is due to dechlorination from the structure XIV. AV XV is identified as acetonitrile adduct formation with AV (Fig. 5).
In the case of photolytic degradation condition formation of AV related substance is identified as AV XVI, due to the presence of free radical and hydrolysis. AV X formation can explained by demethylation from the AV structure. The formation of AV VII can explained by the opening of the pyrrolidine ring in the presence of free radical and further attachment of the hydroxyl functional group on it, which involved a radical cation mechanism. AV V and AV II form due to attachment of - OH functional group in the AV structure (Fig. 6).
In the case of thermal hydrolysis, AV IX formation can explained by the removal of dimethoxy benzyl from the AV structure due to energy and bond cleavage (Fig. 7).
In oxidative degradation formation of AV XII is due to oxidation by peroxide and AV VI is due to the addition of chlorine functional group in AV structure (Fig. 8).
3.5 In silico studies
In silico physicochemical parameters and toxicity risk assessment study (prediction) was carried out to get an idea about the physicochemical properties and any probable toxicity due to the impurities. Factors of toxicity risk assessment like mutagenicity, tumorigenicity, irritant and reproductive effects (Table 3) relies on a computed set of structural fragment that give rise to toxicity alerts in case they are encountered in the structure of impurity. These fragment lists were created by rigorously shredding all compounds of the RTECS database known to be active in a certain toxicity class (e.g. mutagenicity). During the shredding, any impurity was first cut at every rotatable bond leading to a set of core fragments. These in turn were used to reconstruct all possible bigger fragments being a substructure of the original impurity. Afterward, a substructure search process determined the occurrence frequency of any fragment (core and constructed fragments) within all compounds of that toxicity class. It also determined these fragment's frequencies within the structures of more than 3000 traded drugs. Toxicity risk alerts are an indication that the impurity may be harmful concerning the risk category specified (toxic, moderately toxic, and non-toxic). Results of toxicity prediction study revealed that no impurity is at any risk of toxicity. Prediction of physicochemical properties revealed that all the physicochemical parameters of impurities were within the acceptable limit.
Structures of impurity
Toxicity risk assessment study
Physicochemical parameters
aMutagenicity
bTumorigenicity
cIrritating effect
dReproductive effect
ecLogp
fSolubility (LogS)
gTPSA
Mol. wt
AV
–
–
–
–
1.49
−3.75
125.3
483.95
AV I (a)
–
–
–
–
0.88
−3.01
125.3
450
AV II (i)
–
–
–
–
0.64
−3.35
145.6
498
AV III (b)
–
–
–
–
1.26
−2.86
122.1
401
AV IV (c)
–
–
–
–
0.79
−3.49
113.6
358
AV V (j)
–
–
–
–
1.14
−3.56
145.6
500
AV VI (o)
–
–
–
–
2.1
−4.48
125.3
518
AV VII (k)
–
–
–
–
0.56
−3.03
162.6
515
AV VIII (d)
–
–
–
–
1.79
−4.15
107.8
393
AV IX (n)
–
–
–
–
1.56
−3.73
116.1
454
AV X (l)
–
–
–
–
1.21
−3.43
136.3
469
AV XI (e)
–
–
–
–
2.31
−4.41
70.51
349
AV XII (p)
–
–
–
–
1.13
−4.38
124
488
AV XIII (f)
–
–
–
–
0.88
−3.01
125.3
450
AV XIV (g)
–
–
–
–
1.39
−4.23
113.6
392
AV XV (h)
–
–
–
–
1.5
−4.4
149.1
526
AV XVI (m)
–
–
–
–
1.49
−3.75
125.3
485
3.6 Method validation (ICH, 2005b)
The developed stability-indicating method was validated as per ICH guidelines Q2 (R1) and results shown as per Table 4 (i). The system suitability of the developed method was checked for 10 µg mL−1 by evaluating % RSD values of peak area, asymmetry, theoretical plate, and retention time of five standard replicates. % RSD values were found less than 2, for all parameters as shown in Table 4 (ii). The regression coefficient was found to be 0.9970 for AV in the range of 10–70 µg mL−1 which confirms the linearity of the method. All degradation product peaks having resolution (>2) and peak purity from 0.990 − 0.999 indicating peaks were well separated. LOD and LOQ values were found to be 0.36 µg mL−1 and 1.15 µg mL−1, respectively. The interday and intraday precision was evaluated at three different concentrations, i.e. 10, 30, and 50 µg mL−1 (each in triplicate) on consecutive three days and the same day respectively. The % RSD values for interday and intraday was found to be 1.680–1.800 and 0.326–0.697, respectively. Accuracy of AV was performed by using a standard sample at three different levels 80%, 100%, and 120% (54, 60, 66 µg mL−1) respectively. % Recovery ± RSD was found to be 99.280 ± 0.239–101.420 ± 0.092. % Assay ± RSD was found to be (99.430–102.040) ± 0.997. Hence the developed method can be further used for estimation of AV in tablet formulation without the interference of excipients. The similar forced degradation conditions were applied for marketed formulations and found alike method sensitivity and specificity towards APIs, degradation products, and impurities.
Parameter
AV
Detection wavelength (nm)
239
Linearity (µg/mL)
10–70
Regression coefficient (r2)
0.997
Regression equation
y = 1E + 06x − 3E + 06
LOD (µg/mL)
0.360
LOQ (µg/mL)
1.150
Intraday precision % RSD (n = 3)
0.326 – 0.697
Interday precision % RSD (n = 3)
1.680 – 1.800
% Assay ± RSD (n = 6)
(99.430–102.040) ± 0.997
% Recovery ± RSD (n = 3)
99.280 ± 0.239–101.420 ± 0.092
(ii) System suitability parameters of stability method
Parameter
Observation
RSDa
Rt (mL/min)
27.160
0.450
Area (mAU)
13,026,886
0.680
Theoretical plate
9226
0.520
Tailing factor
1.270
0.550
3.7 Marketed formulation degradation
The developed LC-MS/MS method was applied for marketed tablet formulation (AVANA). Avana tablet was subjected to acid, alkaline, photolytic, thermal, and oxidative degradation. Overlay chromatogram of AV and its marketed formulation in different stress condition (Supplementary scheme S7) shows a similar pattern to that of API. The peaks were also confirmed through LC-MS/MS and RRT. Hence developed method is useful for the determination of drug from the formulation and can extend up to toxicity study.
4 Conclusion
The stated study was able to explore various useful information which is reported for the first time in the literature for AV as separation of sixteen new D.P.s along with AV in sole LC-MS/MS compatible method, MSn study of AV, mass fragmentation pathway of all D.P.s using LC-MS/MS and plausible degradation pathway in different conditions. Total D.P.s found in different conditions like acid, alkaline, neutral, oxidative, photolytic, and thermal were studied by LC-MS/MS. Found D.P.s were in the acid condition D.P. I, III, IV, VIII, XI, XIII and XIV; in alkaline condition D.P. I, III, IV, VIII, XI, XIII, XIV and XV; in neutral condition D.P.s I, III, IV, VIII, XIII and XIV; in oxidative degradation D.P.s VI, XII, XIII, and XIV; in photolytic degradation D.P. II, V, VII, X, XIII, XIV and XVI and in thermal degradation D.P. II, V, IX, XIII, and XIV. All sixteen degradation product structures were proposed from the data of product ion and fragment ions of LC-MS/MS. Further plausible degradation mechanism of AV in acid, alkaline, oxidative, photolytic and thermal degradation conditions were proposed which reveals that AV degradation occurs due to nucleophilic substitution reaction and amide hydrolysis. The amide group in structure can easily undergo hydrolysis, while due to aryl chloro and hydroxide group it undergoes photodecomposition. In silico toxicity prediction reveals that physicochemical properties of impurities were within the acceptable limit which specifies that no impurity is at any risk of toxicity. In detail stability study of AV revels that the drug is more prone to degrades in light, temperature, and moisture, hence it requires proper storage condition; temperature below 25 °C with protection to light and moisture.
Acknowledgement
The authors would like to thank the Institute of Pharmacy, Nirma University, India for providing necessary facilities for this work.
Funding Source
The Institute of Pharmacy, Nirma University, India provided junior research fellowship (JRF) and senior research fellowship (SRF) (NU/IP/Ph.D./FT/Stipend/14-15/003) for this work.
References
- Development of validated stability- indicating assay methods: critical review. J. Pharm. Biomed. Anal.. 2002;28:1011-1040.
- [CrossRef] [Google Scholar]
- Bandichhor, R., 2014. Identification and Characterization of Potential Impurities of Dronedarone Hydrochloride.
- Stability indicating analytical method development and validation for the estimation of Avanafil in pharmaceutical dosage form. Int. J. Pharm. Qual. Assur.. 2015;3:181-194.
- [Google Scholar]
- Development of validated and stability indicating LC-DAD and LC-MS / MS Methods for Determination of Avanafil in Pharmaceutical Preparations and Identification of novel degradation product by LCMS-IT-TOF. Molecules. 2018;23:1-14.
- [CrossRef] [Google Scholar]
- Phosphodiesterase type 5 inhibitors as a treatment for erectile dysfunction: current information and new horizons. Arab J. Urol.. 2013;11:222-229.
- [CrossRef] [Google Scholar]
- ICH, H. tripartite guideline, 2005a. Stability Testing of new drug substances and products Q1A (R2). http://www.ich.org/products/guidelines/quality/article/quality-guidelines.html (accessed December 18, 2016).
- ICH, H. tripartite guideline, 2005b. Validation of Analytical methods definations and terminology Q2A. http://www.ich.org/products/guidelines/quality/article/quality-guidelines.html (accessed December 18, 2016).
- Forced degradation and impurity profiling: recent trends in analytical perspectives. J. Pharm. Biomed. Anal.. 2013;86:11-35.
- [CrossRef] [Google Scholar]
- Tolerability and pharmacokinetics of avanafil, a phosphodiesterase type 5 inhibitor: a single- and multiple-dose, double-blind, randomized, placebo-controlled, dose-escalation study in healthy Korean male volunteers. Clin. Ther.. 2010;32:1178-1187.
- [CrossRef] [Google Scholar]
- Characterization of stress degradation products of blonanserin by UPLC-QTOF-tandem mass spectrometry. RSC Adv.. 2015;5:69273-69288.
- [CrossRef] [Google Scholar]
- Characterization of stress degradation products of mirabegron using UPLC-QTOF-MS/MS and in silico toxicity predictions of its degradation products. RSC Adv.. 2015;5:31024-31038.
- [CrossRef] [Google Scholar]
- Avanafil, a potent and highly selective phosphodiesterase-5 inhibitor for erectile dysfunction. J. Urol.. 2012;188:668-674.
- [CrossRef] [Google Scholar]
- Stability-indicating HPLC method for simultaneous determination of degradation products and process-related impurities of avanafil in avanafil tablets. Acta Chromatogr.. 2017;1–6
- [CrossRef] [Google Scholar]
- Stability behaviour of antiretroviral drugs and their combinations. 2: characterization of interaction products of lamivudine and tenofovir disoproxil fumarate by mass and NMR spectrometry. J. Pharm. Biomed. Anal.. 2016;125:245-259.
- [CrossRef] [Google Scholar]
- Characterization of impurities in cefpodoxime proxetil using LC–MSn. Acta Pharm. Sin. B. 2014;4:322-332.
- [CrossRef] [Google Scholar]
- Mangukiya, M., Rathod, B., Dhaduk, D., Maniya, J., 2014. Development and validation of a reversed phase HPLC method for simultaneous determination of Avanafil and Dapoxetine hydrochloride in combined pharmaceutical formulation. Pharma Anal. Qual. Assur.
- Stress degradation studies on lornoxicam using LC, LC-MS/TOF and LC-MSn. J. Pharm. Biomed. Anal.. 2011;56:538-545.
- [CrossRef] [Google Scholar]
- Critical practical aspects in the application of liquid chromatography-mass spectrometric studies for the characterization of impurities and degradation products. J. Pharm. Biomed. Anal.. 2013;87:191-217.
- [CrossRef] [Google Scholar]
- Characterization of stress degradation products of fosinopril by using LC-MS/TOF, MSn and on-line H/D exchange. J. Pharm. Biomed. Anal.. 2014;92:135-143.
- [CrossRef] [Google Scholar]
- Multivariate approaches for simultaneous determination of avanafil and dapoxetine by UV chemometrics and HPLC-QbD in binary mixtures and pharmaceutical product. J. AOAC Int.. 2016;99:649-663.
- [Google Scholar]
- LC-MS/MS characterization of forced degradation products of zofenopril. J. Pharm. Biomed. Anal.. 2014;88:609-616.
- [CrossRef] [Google Scholar]
- LC-MS/MS structural characterization of stress degradation products including the development of a stability indicating assay of Darunavir: An anti-HIV drug. J. Pharm. Biomed. Anal.. 2014;89:28-33.
- [CrossRef] [Google Scholar]
- Savaliya, S.D., Chaudhary, A.B., Rathod, B.G., Dobariya, T.D., Mohan, S., 2013. Development and Validation of UV Spectrophotometric method for estimation of Avanafil in tablet dosage form. Inven. Rapid Pharm Anal. Qual. Assur.
- Identification and structural characterization of the stress degradation products of omeprazole using Q-TOF-LC-ESI-MS/MS and NMR experiments: Evaluation of the toxicity of the degradation products. New J. Chem.. 2019;43:7294-7306.
- [CrossRef] [Google Scholar]
- A critical review on the use of modern sophisticated hyphenated tools in the characterization of impurities and degradation products. J. Pharm. Biomed. Anal.. 2012;69:148-173.
- [CrossRef] [Google Scholar]
- A validated stability-indicating LC method for acetazolamide in the presence of degradation products and its process-related impurities. J. Pharm. Biomed. Anal.. 2010;52:142-148.
- [CrossRef] [Google Scholar]
- Avanafil for the treatment of erectile dysfunction. Expert Rev. Clin. Pharmacol.. 2016;9:1163-1170.
- [CrossRef] [Google Scholar]
Appendix A
Supplementary material
Supplementary data to this article can be found online at https://doi.org/10.1016/j.arabjc.2020.06.007.
Appendix A
Supplementary material
The following are the Supplementary data to this article:Supplementary data 1
Supplementary data 1


