

Translate this page into:
An innovative impurity profiling of esmolol hydrochloride injection using UPLC-MS based multiple mass defect filter, chemometrics and in-silico toxicity prediction
⁎Corresponding author at: Department of Pharmacy, The Second Xiangya Hospital, Central South University, Changsha 410011, China. wangyikun@csu.edu.cn (Yi-Kun Wang)
-
Received: ,
Accepted: ,
This article was originally published by Elsevier and was migrated to Scientific Scholar after the change of Publisher.
Abstract
Esmolol hydrochloride injection is indicated for the rapid control of ventricular rate in patients with atrial fibrillation or atrial flutter in perioperative, postoperative, or other emergent circumstances where short term control of ventricular rate with a short-acting agent is desirable. The potential toxic impurities in pharmaceuticals at micro levels or trace levels are of increasing concern to both pharmaceutical industries and regulatory agencies, due to their potential risk to human health. The impurity investigation of esmolol remains incomplete. Thereby, efficient impurities monitoring and potential toxicity assessment should be emphasized to assure drug safety. Impurity profiling methods of esmolol were developed using ultraperformance liquid chromatography plus Q-Exactive Orbitrap tandem mass spectrometry (UPLC-QE-MS) based multiple mass defect filter and chemometrics. Impurities were characterized by both UPLC-QE-MS and reference substance comparison. The toxicities of esmolol impurities were predicted by employing quantitative structure–activity relationship. The results showed that a total of 20 impurities were detected and identified using the above integrated strategy, 14 impurities (EP2-3, EP5-6, EP8-9, EP12-13, EP15-20) have firstly found. EP20 was predicted as hepatotoxic and mutagenic using QSAR model, and its hepatotoxicity were verified in vivo. The EP1 contents showed maximum volatility in all batches, and varied by sample. EP1 and its accompanying product of methanol were measured. This UPLC-MS/MS based chemometrics strategy is useful for monitoring the manufacturing process and quality control of esmolol hydrochloride injection.
Keywords
Esmolol
UPLC-MS/MS based chemometrics
Multiple mass defect filter, Impurity profile
Toxicity predication

1 Introduction
Esmolol, a quick-acting antihypertensive agent by cardioselective blocking β-receptor, has been demonstrated effective in the control of elevated haemodynamic parameters in patients with supraventricular tachyarrhythmia, hypertension and tachycardia in the perioperative setting, acute ischaemic heart disease, and associated with a reduced risk of some clinical sequelae to increased haemodynamic parameters.
At present, drug impurity analysis has received wide attention, due to the increased safety problems related with impurities and degradation products distributed in several bulk drug substances and formulations (Hassan et al., 2022). Impurity profiling is now a major approach aimed to systematically analyze drug substances, detect, identify, and quantify of present impurity. Liquid chromatographic (LC) and liquid chromatography-mass spectrometry (LC-MS) has become the main popular tools for developing impurity profiling approach (Lakka et al., 2021).
The complex LC or LC-MS data generated from drug profiling can be applied to infer a common source between one or multiple seizures as well as drug trafficking pathway to offer insights into drug markets. Although well built, it is time-consuming and ineffective to compare all drug profiles manually (Popovic, Morelato, Roux, & Beavis, 2019). Multiple mass defect filter (MMDF) can target screen structurally similar analogues or derivatives of interest using multiple templates (Li et al., 2021a; Li et al., 2021b), which can be applied for fast, sensitive, and accurate identification of metabolites (Yuan, Gao, Shi, Tu, & Jiang, 2022), nevertheless, MMDF has been rarely applied for impurity screening. Moreover, chemometric technique is an efficient tool for efficient processing of LC or LC-MS data, monitoring impurity, and drug quality assessment and control (Farid, Mostafa, Fayez, Essam, & ElTanany, 2022; Saad, AlAlamein, Galal, & Zaazaa, 2018; Speranca, Nascimento, & Pereira, 2021). Especially, nontargeted chemometrics, mainly incorporates principal components analysis (PCA), and partial least squares discriminant analysis (PLS-DA), and orthogonal partial least squares discriminant analysis (OPLS-DA).
This study aims to present chemometric methods combined with multiple mass defect filter as a powerful tool for the impurity profiling of pharmaceuticals. Both UPLC-MS/MS based multiple mass defect filter and chemometric strategy were firstly adopted to monitor the esmolol impurities(EPs) and assess its quality. We investigated the impurity profile of esmolol by using UPLC-QE-MS. The established strategy exhibited excellent specificity for impurities identification by providing information of both elemental compositions and structural characteristics. Chemometrics were used for building impurity profiling of pharmaceuticals. PCA, PLS-DA and OPLS-DA were used for finding the differential markers of among impurities. The structures of impurities had been further confirmed by MS/MS and NMR.
2 Experimental
2.1 Chemicals and reagents
The reference substances of esmolol hydrochloride and esmolol impurities were purchased from China National Institutes for Food and Drug Control (Beijing, China). All the reference substances were of high purity (98 %). 82 batches of esmolol hydrochloride injection samples were collected from 4 different manufacturers. HPLC-MS-grade acetonitrile and water and HPLC-grade formate solution and formate were supplied by Merck (Darmstadt, Germany).
2.2 Sample preparation for UHPLC- QE-MS analyses
All esmolol injections were diluted with H2O to obtain a final drug concentration of 0.1 mg/mL for UHPLC- QE-MS analyses.
2.3 UHPLC- QE-MS studies on the degradation products
2.3.1 Optimized chromatographic conditions
Chromatographic analysis was operated using a Thermo Scientific UPLC system, equipped with a Thermo ScientificTM Q ExactiveTM MS system with an ESI ion source. Chromatographic separation was achieved by a Ultimate UPLC LP-C18 column (2.1 mm × 110 mm, 1.8 μm). Aqueous solution (containing 5 mmol/L ammonium formate + 0.1 % formic acid) (A), acetonitrile was applied as mobile phase A and acetonitrile as mobile phase B, using a gradient elution at 0.3 mL/min flow rate, with a run time of 35 mins. Gradient elution were set as follows: 0 ∼ 20 min, 10 % ∼ 50 % B; 20 ∼ 25 min, 50 % ∼ 80 % B; 25 ∼ 28 min, 80 % ∼ 10 % B; 28 ∼ 35 min, 10 % ∼ 10 % B; flow rate of 0.3 mL/min. The column temperature was maintained at 30 °C, with an injection volume of 2 μL.
2.3.2 Mass spectrometry conditions
High performance-electron spray ionization, positive ion mode, spray voltage 4.5 kV, capillary temperature 320 °C, atomizing chamber temperature 350 °C, sheath gas velocity 40 arb, auxiliary gas velocity 10 arb, scanning mode: full MS/dd-MS. Full MS resolution 70000, dd-MS resolution 17500, scanning range m/z 50 ∼ 750. The collision energy used in MS / MS mode was 15, 30 and 50 NCE.
2.4 Mass spectral data processing for analysis of degradation products
Parent drug of and its related impurities usually share a structural skeleton, and possess similar molecular formula and mass defects, therefore, mass defect filter can target screen related impurities using drug as template. Multiple mass defect filter was adopted to screen monomer impurity and dimer impurity, using esmolol and esmolol dimer as template. Nontargeted analysis of impurity were achieved using chemometrics, including PCA/PLS-DA/OPLA-DA, to comparing the differences of impurity distribution from different manufacturers, and discover differential markers.
2.5 Synthesis and characterization of esmolol impurity 1 and 20 (EP1 and EP20)
2.5.1 Synthesis of EP1
Esmolol hydrochloride (3.17 g, 10 mmol) was dissolved in methanol (100 mL), added 2 mol/L sodium hydroxide solution (15 mL, 30 mmol), heated to reflux, reacted completely for 3 h, and concentrated to dryness. The reaction mixture was added 100 mL methanol to sonicate, filter. filtrated by drop into 30 mL concentrated hydrochloric acid solution, stirred overnight, concentrated the next day by preparing the liquid phase to obtained EP1 - esmolol acid hydrochloride.
2.5.2 Synthesis of EP20
p-Hydroxybenzaldehyde (2.02 g) and cesium carbonate (8.50 g) with 15 mL DMF and 20 mL epichlorohydrin was added in a round bottomed flask, heated the reaction to 68 °C and stirred. Cool the reaction to ambient temperature after 3 h. Diluted with EtOAc (50 mL), washed with water (3 × 30 mL, brine (2 × 30 mL), respectively. Dried over MgSO4 and concentrated under reduced pressure (Hu et al., 2018).
Nuclear magnetic resonance spectroscopy was applied to characterize its degradation products. Nuclear magnetic resonance spectroscopy (both 1H NMR and 13C NMR) experiments were operated on Bruker 400 MHz NMR spectrometers (Bruker, Fallanden, Switzerland) using DMSO‑d6 as a solvent and tetramethylsilane as internal standard.
2.6 Forced degradation studies
The esmolol hydrochloride was subjected to hydrolytic, oxidative, photolytic and thermal stress studies.
2.6.1 Hydrolytic studies
Acidic and basic hydrolyses were carried out in 1 mol·L-1 HCl (30 min) and 0.1 mol·L-1 NaOH (5 min), respectively, then, acidic or basic stressed samples were neutralized by adding opposite solution of acid or base. Finally, the neutralized solution was diluted with H2O to obtain a final drug concentration of 0.1 mg/mL.
2.6.2 Thermal stress studies
Solid esmolol hydrochloride in sealed glass ampoules was heated in a Dri-Bath at 90 °C for 5 h. And, the reaction mixture was diluted with H2O to obtain a final drug concentration of 0.1 mg/mL.
2.6.3 Oxidative degradation studies
Solid esmolol hydrochloride was carried out in 30 % v/v H2O2 at Dri-Bath at 65 °C for 5 h. The oxidated sample was diluted with water to obtain a final drug concentration of injection of 0.1 mg/mL.
2.6.4 Photolytic degradation studies
Solid esmolol hydrochloride was exposed to 5000Lx ± 500Lx cool white and 0.8 W/m2 UV-A radiations in the photostability chamber for 5 d. The photolytic samples were diluted with water to obtain a final drug concentration of injection of 0.1 mg/mL.
2.7 In silico toxicity studies of ADMET properties of esmolol impurities
The toxicity evaluation of all the EPs carried out by ADMET Predictor® version 10.5 (Simulations Plus, Inc., Lancaster, CA, USA) in qualitative and quantitative models. ADMET Predictor using quantitative structure–toxicity relationship models for calculating the probability values for different animal models. It includes a series of QASR models based on statistical methodology. The hepatotoxicity, mutagenicity, carcinogenicity, cardiotoxicity and genotoxicity of EPs were predicted. The hepatoxic indexes were specifically studied with relevant biomarkers including alkaline phosphatase (ALP), serum glutamic oxaloacetic transaminase (AST), serum glutamic pyruvic transaminase (ALT), gamma-glutamyl transferase (GGT), and lactate dehydrogenase (LDH). Mutagenicity was predicted on the basis of five individual strains of Salmonella typhimurium model. Carcinogenicity was evaluated using chronic rat and mouse studies. Cardiotoxicity was predicted by hERG potassium channel blocking affinity. The genotoxicity of EPs was also verfied using toxree (expert rules). The structural alerts (toxicophores) were predicted by toxalerts online server (http://ochem.eu/alerts).
2.8 The content determination of EP1
2.8.1 Liquid chromatographic conditions
HPLC-UV was applied to determine of the content of EP1. Octadecylsilane bonded silica gel was used as filler (CAPCELL PAK C18 MG III column, 4.6 mm × 250 mm, 5 μm). The mobile phase A was acetonitrile-methanol-phosphate buffer (4.6 g of potassium dihydrogen phosphate, dissolved in 1000 mL of water, and the pH was adjusted to 4.0 with dilute phosphoric acid) (12:20:68), and the mobile phase B was methanol, with gradient elution: 0 ∼ 15 min, 100 % A; 15 ∼ 30 min, 100 % A → 65 % A; 30 ∼ 50 min, 65 % A; 50 ∼ 51 min, 65 %A → 100 % A;51 ∼ 60 min, 100 % A. Flow rate: 1.0 mL·min−1, column temperature: 30 °C, injection volume: 20 μL.
2.8.2 Preparation of the solution
2.8.2.1 Standard stock solution
200 μg·mL-1of esmolol hydrochloride RS was diluted in mobile phase A as esmolol hydrochloride standard stock solution.100 μg·mL-1of EP1 in mobile phase A was applied as EP1 standard stock solution.
2.8.2.2 Sample solution
1 mg·mL-1of esmolol hydrochloride was diluted in mobile phase A.
2.8.2.3 Control solution
Applied an appropriate amount of the sample solution and diluted it quantitatively with mobile phase A to 10 μg·mL-1of esmolol hydrochloride.
2.8.2.4 System suitability solution
Transfered 10 mg esmolol hydrochloride RS to a 10 mL volumetric flask, and added 1 mL hydrochloric acid (the concentration of 1 N). Allowed the contents to stand for 30 min, then added 1 mL sodium hydroxide (the concentration of 1 N) to neutralize it, and dissolved and diluted with mobile phase A to specific volume.
3 Results and discussion
Pharmaceutical drug can form impurities during synesthetic process of drug substance (raw material) or when exposed to excipients or environmental variables. Impurities and degradation products are produced during synthesis process or improper storage (Farid et al., 2022). Esmolol is susceptible to degradation and may produce multiple impurities. Only few approaches were previously reported for the determination of major esmolol impurities in pharmaceutical formulations using HPLC method (Lee et al., 1984; Xiao et al., 2011). However, prior studies have failed to systematically detect esmolol impurities. Therefore, it is essential to establish accurate methods for system screening esmolol impurities that may present in the pharmaceutical formulations.
3.1 Multiple mass defect filter screen esmolol impurities
The bottleneck in impurities analysis is to trace microlevels of target and un-target impurities, because the impurities ions of interest are usually obscured and disturbed by background noise and complex pharmaceutical excipients. Mass defect is defined as the difference between a compound's exact mass and its nominal mass. Mass defect filter (MDF) can selectively detect compounds of interest from noise, widely used for disgusting compound ions of interest from interference ions in an excipients matrix, based on selected template ions (Sleno, 2012).
Currently, multiple mass defect filter is widely used in drug metabolism, but rarely used to analyze drug impurity profiling. In the present study, multiple mass defect filter was firstly applied to screen esmolol impurities, and two MDF templates were simultaneously selected to targeted screen monomer impurity and dimer impurity, using esmolol and esmolol dimer as template. Each MDF template window was over a mass range of ± 100 mDa around the given mass defect of an applied filter template over a mass range of ± 100 Da around the mass of the filter template (Fig. 1A). The molecular weight of esmolol is 281.1626998 Da with mass defect value of 162.6998 mDa, and monomer impurities EP1-EP3 and EP14-18 can be filtered (Fig. 1B). The molecular weight of EP7 is 558.330504 Da with mass defect value of 330.504 mDa, and dimer impurities EP4-5, EP7-8, and EP11-13 can be filtered (Fig. 1C).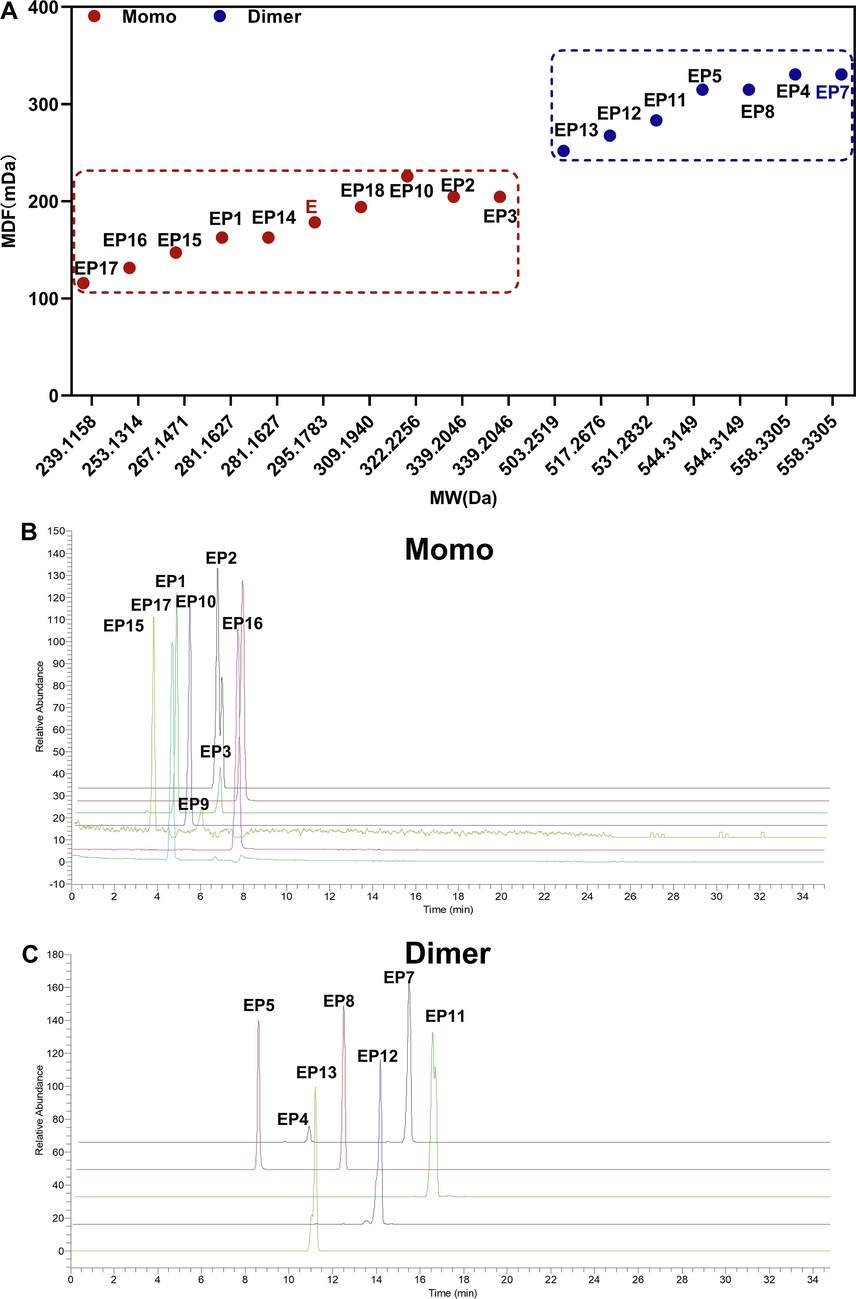
MMDF screened esmolol impurities. (A) MMDF screened monomer or dimer impurity impurities using esmolol and EP7 template. (B) Chromatogram of esmolol monomer impurities using esmolol as template. (C) Chromatogram of esmolol dimer impurities using EP7 as template. E represent esmolol, EP represent esmolol impurities.
3.2 Novel UPLC-MS chemometrics screen esmolol impurities
The quality, efficacy and safety of the pharmaceutical drugs are affected by impurities. It is necessary to clarify the formed pathway of impurities, and closely monitoring in productive process. Recently, there has been a growing trend to rapid analysis to enable more efficient monitoring or comparing drug impurities. Various chemometric methods have been employed to compare and interpret drug impurities data promptly (Popovic et al., 2019).
Both PCA and hierarchical clustering analysis (HCA) are unsupervised pattern recognition approaches in chemometrics, which are useful for objectively applying to perform phenotypic differentiation of different samples (Granato et al., 2018). As shown in Fig. 2A, PCA scatter plot was used to compare impurity profile from different manufactures, suggesting that all samples were clearly separated into three clusters, based on impurity varieties. Sample C1-C6, E1-E3 and B1-B3 were gathered into a cluster in the first quadrant of PCA scatter plot. Sample A1-A3, A33-A35 and D1-D3 were assembled into a cluster in the second quadrant of PCA scatter plot. Sample A4-A6, F1-F3 and G1-G6 were assembled into a cluster in the third quadrant of PCA scatter plot. Additionally, HCA of impurity profiling also showed that the total samples can be divided into two major branches, corresponding to related batches. Chemical similarity for clustering was assessed using Euclidean distance and complete linkage method. Sample C1-C6, E1-E3 and B1-B3 were gathered into a cluster in the left branch. Compared to the original drug (E), generic drug (B) was the most similar to original drug than other generic drugs. Other samples are assembled into the right branch. Among the right branch, samples A1-A3, A33-A35 and D1-D3 were aggregated, and samples A4-A6, F1-F3 and G1-G6 were clustered (Fig. 2B). The above results suggested that PCA and HCA methods should be able to differentiate original drugs, generic drugs and raw materials.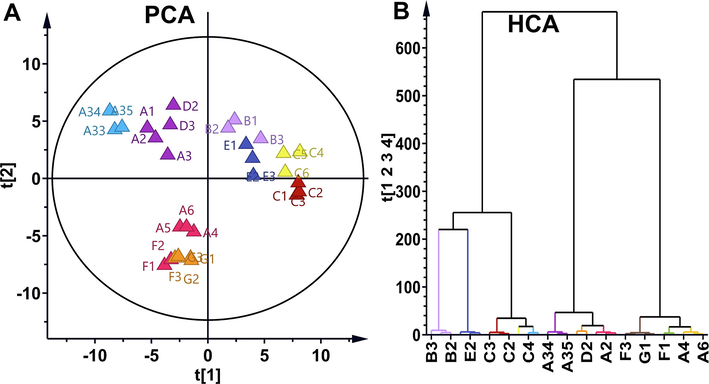
Impurity phenotypic differentiation using PCA and HCA. (A) PCA compared impurities difference in different samples. (B) HCA compared impurities difference in different samples.
Partial least squares discriminant analysis (PLS-DA) model is a supervised pattern recognition approach. PLS-DA was used to compare the impurity differences among multiple batches of samples. Displacement testing indicated the bulit PLS-DA model was a good model. According to VIP, EP1, EP6-7, EP12 and EP16 exhibited significant variability between samples, and EP1 showed the greatest variability between samples, varied from batches to batches (Fig. 3). Orthogonal partial least squares discriminant analysis (OPLS-DA) model is another supervised pattern recognition approach. Improved discrimination of original drugs, generic drugs and raw materials can be achieved by fully utilizing class information in OPLS-DA model, which maximized covariance between measured data and response variables. Impurity maximum difference presented in G group and B group. As shown by the OPLS-DA scatter plot in Fig. 4, the tested samples were clearly separated corresponding to batches, the chemical discrepancy was obvious among original drugs, generic drugs and raw material. And differential impurity majorly contributed to the group separation. The relative abundance of EP1 showed most significant differences between G group and B group (Fig. 4).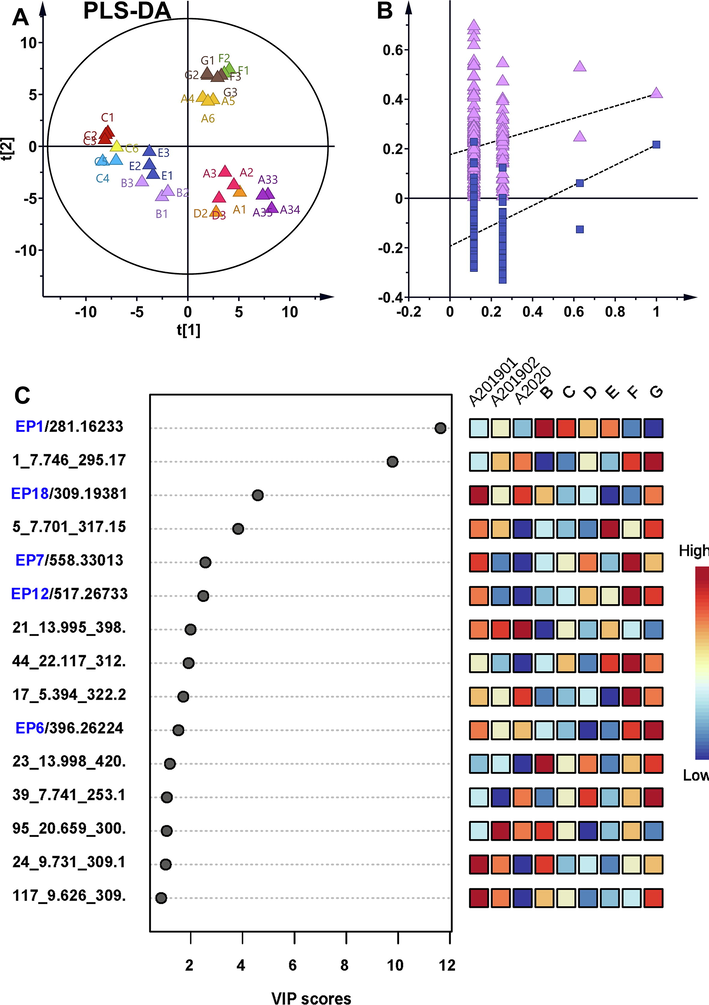
PLS-DA model screened differential impurities. (A) Scatter diagram of PLS-DA model (R2Y = 0.571 and Q2Y = 0.543 for the PLS-DA model). (B) PLS-DA model was validated by permutation test (n = 200). (C) The top 15 differential impurities were screened according to VIP.
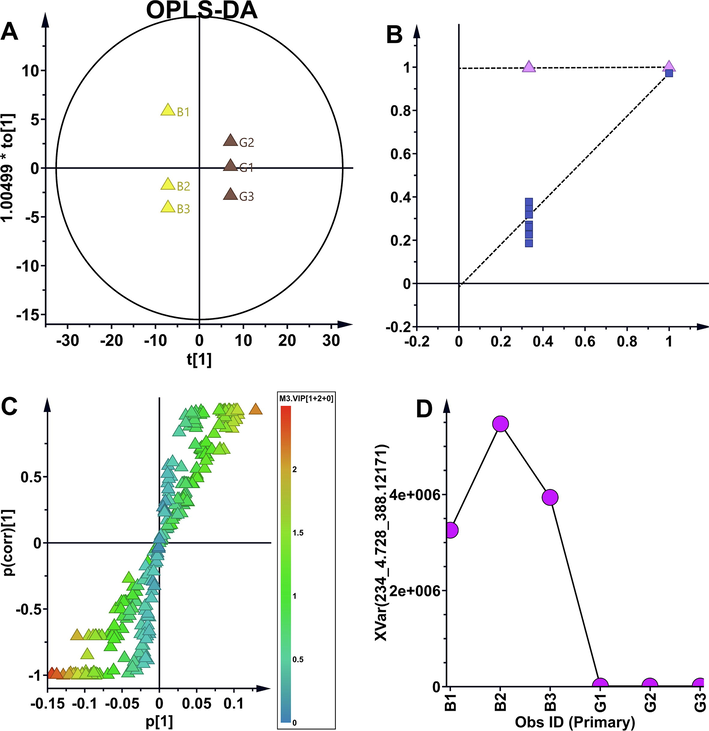
OPLS-DA model screened differential impurities. (A) Scatter diagram of OPLS-DA model (R2Y = 0.995 and Q2Y = 0.972 for the OPLS-DA model). (B) OPLS-DA model was validated by permutation test (n = 200). (C) s-plot of OPLS-DA model. (D) The distribution map of the maximum differential impurity of EP1.
Chromatographic and spectral chemometrics was adopted to study impurity profiling of drugs (Farid et al., 2022; Hassan et al., 2022; Hoggard, Wahl et al., 2010) and foods (Sperança et al., 2021), for evaluating and monitoring the quality of drugs and foods. Moreover, UPLC-MS possess the natures of high resolution and high sensitivity for sensitively detect impurities, especially trace level impurities, which enhances the separation efficiency with a shorter analysis time and an increased resolution.(Ferrazza Alves Giordani et al., 2020; Li et al., 2022; Reddy et al., 2013). Hence, UPLC-MS combined with chemometrics would assist in screening drug impurities.
3.3 Impurity profiling of esmolol hydrochloride injection
The results showed that a total of 20 impurities were detected and identified using the above integrated strategy, 14 impurities (EP2-3, EP5-6, EP8-9, EP12-13, EP15-20) have firstly found in esmolol hydrochloride injection (Table 1).
ID
Molecular formula
cal M + H
mea M + H
Error (ppm)
Rt (min)
EP1
C15H23NO4
282.16998
282.1688
−1.08
4.73
EP2
C18H29NO5
340.21185
340.21135
−1.69
6.54
EP3
C18H29NO5
340.21185
340.21121
−1.87
6.71
EP4
C31H46N2O7
559.33778
559.33698
−1.43
10.61
EP5
C30H44N2O7
545.32213
545.32117
−1.76
8.38
EP6
C21H36N2O5
397.26970
397.26929
−1.03
3.36
EP7
C31H46N2O7
559.33778
559.33698
−1.43
15.04
EP8
C30H44N2O7
545.32213
545.32172
−0.75
12.23
EP9
C21H36N2O5
397.26970
397.26901
−1.72
6.00
EP10
C18H30N2O3
323.23292
323.23260
−0.97
5.42
EP11
C29H41NO8
532.29049
532.29010
−0.73
16.40
EP12
C28H39NO8
518.27484
518.27472
−0.23
14.04
EP13
C27H37NO8
504.25919
504.25928
0.16
11.19
EP14
C15H23NO4
282.16998
282.16934
−2.27
6.64
EP15
C14H21NO4
268.15433
268.15381
−1.96
3.81
EP16
C13H19NO4
254.13868
254.13878
0.37
7.74
EP17
C12H17NO4
240.12303
240.12305
0.05
4.63
EP18
C17H27NO4
310.20128
310.20074
−1.74
9.88
EP19
C6H15NO2
134.11756
134.11761
0.44
1.12
EP20
C10H11O3
179.07027
179.07021
−0.36
9.51
EP1 showed protonated molecular ion ([M + H]+), and had an accurate mass of m/z 282.16606, corresponding to the ion formula of [C15H24NO4]+. The MS/MS spectrum of EP1 displayed the characteristic product ions at m/z 264, 240, 205, 179.06995, 145 and 98 (Fig. 5). The fragment ion at m/z 264 ([C16H18N6OCl]+) was produced owing to a neutral loss of H2O from the parent ion. The fragment ion at m/z 240 ([C12H18NO4]+) was attributed to a neutral loss of isopropyl from the parent ion, which underwent a further loss of H2O and CH3NH2 to form the ion at m/z 205 ([C12H13O3]+). The product ions at m/z 179([C6H11N2O2]+) and 145 was formed due to side chain cleavage. The product ion at m/z 116 was assigned as 2-hydroxy-3-(isopropylamino)propan-1-ylium, which underwent a further loss of H2O to form the ion at m/z 98 ([C6H12N]+) (Fig. 5).The chromatographic behavior and MS pattern is consistent with synthetic esmolol acid, therefore EP1 was characterized as esmolol acid.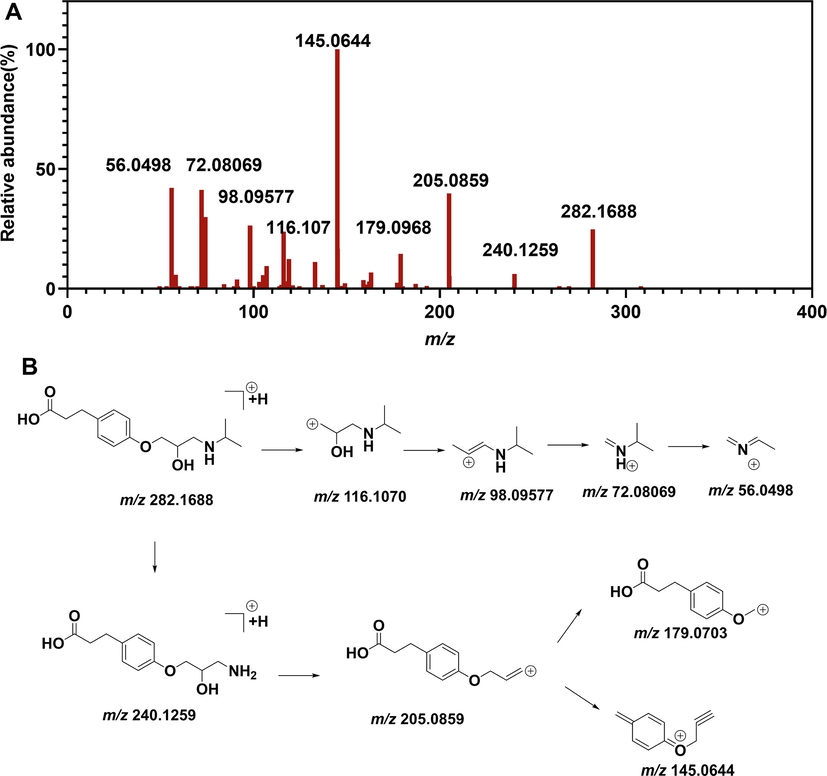
Mass spectrometry characterized EP1. (A) MS/MS spectrometry of EP1 (B) Mass fragmentation pathway of EP1.
EP2 displayed protonated molecular ion ([M + H]+), and had an accurate mass of m/z 340.21135, corresponding to the ion formula of [C18H30NO5]+. The MS/MS spectrum of EP2 exhibited the characteristic product ions at m/z 298.16434, 280.15041, 205.08540, 162.09103, 145.06434, 116.10677 and 98.0965. The fragment ion at m/z 298.16434 was produced owing to a neutral loss of propyl moiety from the parent ion, further formed ion at m/z 280.15041 due to dehydration. The ion at m/z 280.15041 further generated ion at m/z 204.1383, that formed ion at m/z 162.09103. The product ion at m/z 116.10677 was assigned as 2-hydroxy-3-(isopropylamino)propan-1-ylium, which underwent a further loss of H2O to form the ion at m/z 98.0965 ([C6H12N]+).
EP3 exhibited [M + H]+ ion at m/z 340.21121 in positive mode. Fragment ion at m/z 312.18055 was produced owing to a neutral loss of C2H4 from the parent ion, which further formed fragment ion m/z 282.16937. The product ion at m/z 240.12288 was formed due to neutral loss of isopropyl from fragment ion at m/z 282.16606, formed fragment ion m/z 205.08560, 179.07023, 145.06479. The product ions at m/z 179.07027([C6H11N2O2]+) and 145.06458 was formed due to side chain cleavage. The product ion at m/z 116.10680 was assigned as 2-hydroxy-3-(isopropylamino)propan-1-ylium, which underwent a further loss of H2O to form the ion at m/z 98 ([C6H12N]+).
EP4 displayed a quasi-molecular ion at m/z 559.33698 ([M + H]+, calcd559.33778) in its HR-ESI-MS spectrum, confirming its molecular formula to be C31H47N2O7. In MS/MS spectrum. The quasi-molecular ion at m/z 559.33698 generated fragment ion at m/z 296.18171 due to ester group cleavage. The fragment ion at m/z 296.18512 produced fragment ions at m/z 278.1752 and 282.16606, owing to neutral loss of H2O and CH2. The fragment ion at m/z 278.1752 produced fragment ions at m/z 219.10133 and m/z 145.06465. The fragment ion at m/z 282.16606 produced fragment ions at m/z 204.13829 and m/z 73.05612. The fragment ion at m/z 116.10685 was generated due to side-chain cleavage, and formed fragment ion at m/z 98.09643.
EP5 generated a protonated molecule [M + H]+ at m/z 545.32117. Under higher-energy collision conditions, the MS/MS spectrum of EP5 displayed the major product ions at m/z 379.25897, 282.16925, 240.1192, 205.08533, 179.07027, 145.06479, 116.10699, 72.08078. The quasi-molecular ion at m/z 545.32117 generated daughter ion at m/z 282.16925 due to ester group cleavage. The daughter ion at m/z 282.16606 generated daughter ions at m/z 240.119111, 205.08533, 179.07027, 145.06479. Daughter ion at 116.10699 and 72.08078 were assigned as 2-hydroxy-3-(isopropylamino)propan-1-ylium and N-methylenepropan-2-aminium.
EP6 showed protonated molecular ion with an accurate mass of m/z 397.26929, confirming its elemental composition of C21H37N2O5+. The product ion spectrum of EP6 displayed the product ions at m/z 379.25879, 248.16505, 282.16928, 134.11729,116.10675 and 98.09622. The product ions at m/z 379 ([C21H36N2O4]+) and 282 ([C15H24NO4]+) were ascribed to the neutral loss of H2O and 3-(isopropylamino)propan-1-ol chain (C6H13NO) from the parent ion, respectively. The product ion at m/z 134.11756 ([C6H16NO2]+) was inferred as protonated 3-(isopropylamino)propane-1,2-diol, neutrally lost H2O and 2H2O to form product ions of m/z 116.10699 and 98.09643, respectively.
EP7 generated a protonated molecular ion [M + H]+ at m/z 559.33698, corresponding to the ion formula of [C21H35N2O4]+.Under higher energy collision conditions, several fragment ions were observed at m/z 541.32329, m/z 379.25830, m/z 296.18515, m/z 264.15942, m/z 219.10129, m/z 145.06464, m/z 72.08078 for EP7. The fragment ion at m/z 541.32329 were ascribed to the neutral loss of H2O from the parent ion, and further formed ion at m/z 219.10129 due to acylamino cleavage. The fragment ion at m/z 379.25830 were attributed to the cleavage of the ether linkages in the parent ion, and produced ion at m/z 296.18171 due to ether cleavage. The chromatographic behavior and MS pattern of EP7 is consistent with reference esmolol acid, therefore EP7 was characterized as esmolol dimer via acylamino.
EP8 displayed a quasi-molecular ion at m/z 545.32172 ([M + H]+) in its HR-ESI-MS spectrum, confirming its molecular formula to be (C30H45N2O7). The daughter ion m/z 527.30764 and m/z 503.27126 was generated by neutral loss of H2O and isopropyl from [M + H]+. The daughter ion at m/z 527.30764 produced fragment ion at m/z 379.25821 due to ether cleavage. The daughter ion at m/z 503.27126 formed fragment ion at m/z 282.16953 and 205.08592, owing to acylamino hydrolysis. Daughter ion at m/z 116.10688 and 72.08078 were assigned as 2-hydroxy-3-(isopropylamino)propan-1-ylium and N-methylenepropan-2-aminium.
EP9 exhibited a quasi-molecular ion at m/z 397.26901 ([M + H]+) in its HR-ESI-MS spectrum, confirming its molecular formula to be (C21H37N2O5). The daughter ion m/z 379.25861 and m/z 264.15887 was generated from parents ion due to neutral loss of H2O and side-chain cleavage, respectively. The parent ion at m/z 379.26578 produced fragment ion at m/z 282.16606 due to ether cleavage. The daughter ion at m/z 134.11756 was attributed to dihydroxy side-chain. Daughter ion at m/z 116.10683 and 98.09643 were assigned as 2-hydroxy-3-(isopropylamino)propan-1-ylium and 1-(isopropylamino)prop-1-en-2-ylium.
EP10 exhibited protonated molecular ion ([M + H]+), and had an accurate mass at m/z 323.23260, corresponding to the ion formula of [C18H31N3O2]+. The MS/MS spectrum of EP10 displayed the characteristic product ions at m/z 264.15878, 222.11214, 187.07536, 145.06479, 116.10673, and 74.05988. The fragment ion at m/z 264 ([C15H22NO3]+) was produced owing to a neutral loss of isopropylamine from the parent ion. The fragment ion at m/z 222.11302 ([C12H18NO4]+) was attributed to a neutral loss of isopropyl from the product ion at m/z 264.15878, which further formed the ion at m/z 187.07536 and 145.06479. The product ion at m/z 116.10699 was assigned as ionized 2-hydroxy-3-(isopropylamino)propan-1-ylium.
EP11 displayed a protonated parent ion [M + H]+ at m/z 532.29010 corresponding to the ion formula of [C29H42N2O8]+.Under higher energy collision conditions, multiple fragment ions were observed at m/z 490. 24316, m/z 310.1649, m/z 219.1016, m/z 145.06479, m/z 86.0964 for EP11. The fragment ion at m/z 490.24316 were resulted from the neutral loss of isopropyl from the parent ion, and formed fragment ion at m/z 310.16467, which further formed the ion at m/z 145.06482 and 86.0964. The fragment ion at m/z 86.0964 were assigned as N-methyl-N-methylenepropan-2-aminium.
EP12 exhibited a quasi-molecular ion at m/z 518.27472 in its HR-ESI-MS spectrum, calculating its molecular formula to be C28H40NO8. In MS/MS spectrum, the quasi-molecular ion formed fragment ion at m/z 476.18171 due to neutral loss of isopropyl. The fragment ion at m/z 282.16606 produced fragment ions at m/z 240.11911 and 204.1383, owing to cleavage of amino and carboxyl, respectively. The fragment ion at m/z 240.11911 produced fragment ion at m/z 162.0913. The fragment ion at m/z 219 produced fragment ion at m/z 187.0754.
EP13 showed a quasi-molecular ion at m/z 504.25928 in its HR-ESI-MS spectrum, calculating its molecular formula to be C27H38NO8. In MS/MS spectrum, the parent ion formed fragment ion at m/z 462.21204 due to neutral loss of isopropyl. The fragment ion at m/z 282.16606 produced fragment ions at m/z 240.11911 and 204.1383, owing to cleavage of amino and carboxyl, respectively. The fragment ion at m/z 240.11911 produced fragment ion at m/z 162.0913. The fragment ion at m/z 462.20832 produced fragment ions at m/z 187.0755.
EP14 displayed the accurate mass of the [M + H]+ ion at m/z 282.16934, confirming its ion formula of [C15H24NO4]+. The molecular ion initially neutrally lost C2H9NO and C3H8O3 to form product ions of m/z 219.10110, respectively. The fragment ion of m/z 219.10110 further yielded species of m/z 145.06454, respectively. Also, the fragment ion of m/z 282.1694 formed ionic side chains at ion at m/z 102.09116, ion at m/z 102.09116 neutrally lost H2O to from m/z 84.0871.
The accurate mass of the [M + H]+ ion of EP15 measure by positive ESI-QTOF-MS was m/z 268.15381, confirming its molecular formula of [C14H22NO4]+. The molecular ion initially neutrally lost H2O to form product ion of m/z 250.13985. The fragment ion at m/z 250.13985 generated daughter ions at m/z 145.06464 and 102.09116. Daughter ions at m/z 102.09118 formed daughter ion at m/z 84.08067.
EP16 exhibited protonated molecular ion ([M + H]+), and had an accurate mass at m/z 254.13878, corresponding to the ion formula of [C13H20NO4]+. The MS/MS spectrum of EP16 showed the major product ions at m/z 219. 10185, 187.0754, 145.06500, and 119.04914. The fragment ion at m/z 219.10185 ([C13H15NO3]+) was formed resulted from neutral loss of NH3OH, further generated fragment ion at m/z 145.0650 and 119.04914. Parents ion formed fragment ion at m/z 187.0754. Fragment ion at m/z 74.06016 was assigned as 1-aminopropan-2-one.
EP17 displayed a protonated parent ion [M + H]+ at m/z 240.12305 corresponding to the ion formula of [C12H18NO4]+.The MS/MS spectrum of EP17 showed the major product ions at m/z 222.10855, 205.08607, 145.06491, 119.04924 and 74.05612. The fragment ion at m/z 222.10855 ([C12H16NO3]+) was formed resulted from neutral loss of H2O, further generated fragment ion at m/z 145.06491 ([C10H9O]+) and 119.04924([C8H7O]+). Parents ion formed fragment ion at m/z 187.0754. Fragment ion at m/z 74.06011was assigned as 1-aminopropan-2-one.
EP18 exhibited a protonated molecule [M + H]+ at m/z 310.20074. Under higher-energy collision conditions, the parent ion at m/z 310.20074 generated daughter ion at m/z 268.15384 due to neutral loss of isopropyl. The daughter ion at m/z 268.15384 produced daughter ion at m/z 233.11678 due to neutral loss of 2-aminoethan-1-ol. The fragment ion m/z 233.11722 produced daughter ion at m/z 145.06451.
EP19 exhibited a protonated molecule [M + H]+ at m/z 134.11363. Under higher-energy collision conditions, the parent ion at m/z 134.11363 generated daughter ion at m/z 116.10722 due to neutral loss of H2O, further formed daughter ion at m/z 74.06007. The parent ion at m/z 134.11363 generated daughter ion at m/z 92.07059 due to neutral loss of isopropyl moiety. Daughter ion at m/z at 56.04555 was assigned as prop-2-yn-1-amine, due to dehydration from fragment ion at m/z at 74.05612.
The accurate mass of the [M + H]+ ion of EP20 was m/z 179.06635, confirming its molecular formula of [C10H11NO] +. The molecular ionformed product ion of m/z 123.044, 95.0491, 73.0284, and 57.0355. (Fig. 6). The chromatographic behavior and MS pattern of EP20 is consistent with reference of 4-(2-Oxiranylmethoxy)benzaldehyde, therefore, EP20 was characterized as 4-(2-Oxiranylmethoxy)benzaldehyde (Fig. 6).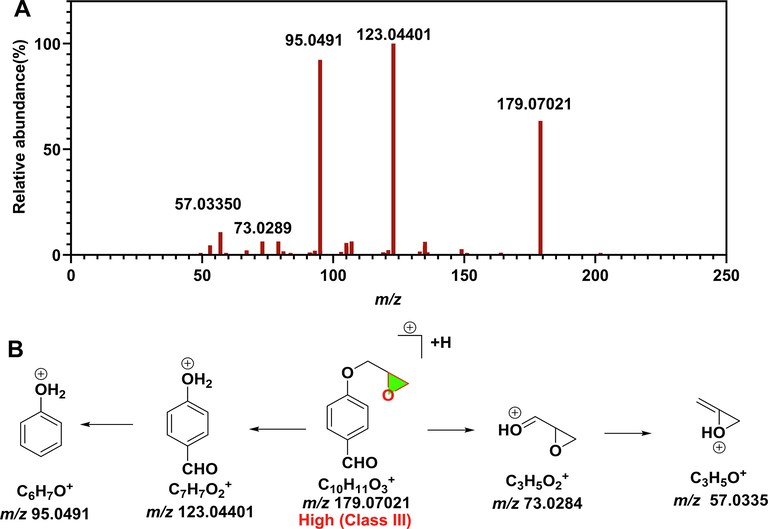
Mass spectrometry characterized EP20 and genotoxicity prediction. (A) MS/MS spectrometry of EP20. (B) Mass fragmentation pathway of EP20.
3.4 Structural characterization of EP1 and EP20 using NMR
EP1(esmolol acid) was prepared by alkali hydrolysis of esmolol, and characterized by NMR. 1H NMR (D2O,500 MHz) exhibited δ: 7.10 (2H, d, H2, H6), 6.86 (2H, d, H3, H5), 4.13–4.21(1H, m, H8), 3.90–4.00 (2H, m, H7), 3.32–3.40 (1H, m, H10), 3.05–3.21(2H, m, H9), 2.73 (2H, t, H13), 2.51(2H, m, H14), 1.23(6H, q, H11, H12). 13C NMR (D2O, 125 MHz) exhibited δ:177.90(C-15), 156.36(C-4), 133.70(C-1), 129.49(C-2, C-6), 114.77(C-3, C-5), 69.53(C-7), 65.59(C-8), 51.02(C-10), 46.67(C-9), 35.50(C-14), 29.33(C-13), 18.26(C-11), 17.83(C-12).
EP20 (4-(2-Oxiranylmethoxy)benzaldehyde) was synthesize by alkylation with alkyl halides/ Williamson Ether Synthesis, and characterized by NMR. 1H NMR (DMSO, 500 MHz) exhibited δ: 7.17 (2H, d, H1, H5), 7.88 (2H, d, H2, H4), 3.96(1H, dd, H8), 4.88(1H, dd, H8), 3.88(1H, ddt, H9), 2.74(1H, dd, H11), 2.87(1H, dd, H11), 9.88(1H, ddt, H9). 13C NMR (DMSO, 125 MHz) exhibited δ: 115.5(C1, C5), 132.2 (C2, C4), 115.5 (C5), 163.63 (C6), 69.87 (C8), 49.94 (C9), 191.84 (C12).
3.5 Analysis of degraded products of esmolol
The degraded products and impurities of esmolol to EP 1-20 is listed in Table 1. The degradation reaction of esmolol majorly included hydrolysis and dimerization, which formed hydrolysate (EP1-EP3 and EP14-18) and dimers impurityies(EP4-5, EP7-8 and EP11-13), respectively. EP2-3 was major degradative impurities in raw materials, accounting for 67 % and 21 % of total global impurities. EP1-3 was majorly degradative impurityies in injection, accounting for 38 %, 37 %, 18 % of total global impurities. Esmolol was extensively degraded in acid and base hydrolytic conditions via ester hydrolysis to produce esmolol acid (EP 1), which is also an active metabolite in humans. EP 1 formed EP3 after esterification (Fig. 7).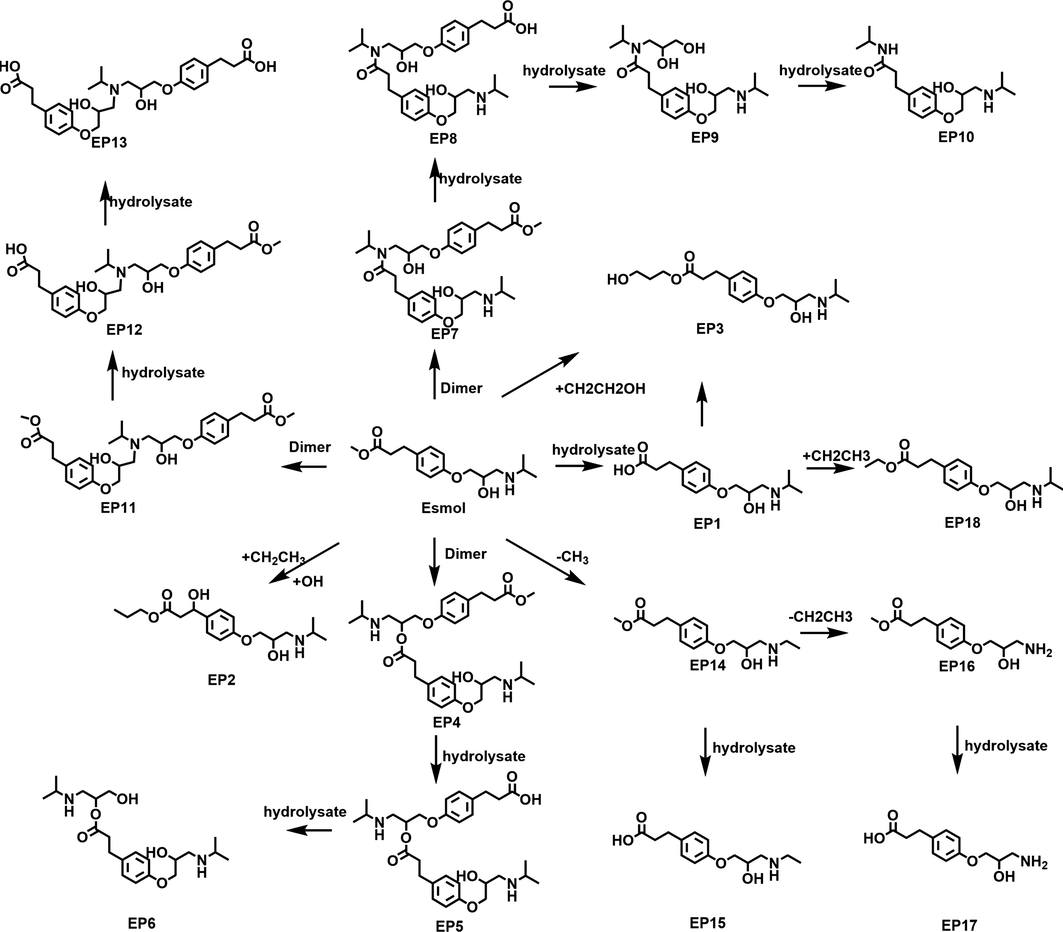
The impurity degradation pathway of esmolol.
For solid raw materials, both acidic condition and basic condition favored the formation of degradation products EP1 (esmolol acid, hydrolysate), EP8 (dimeric hydrolysate), EP9 (dimeric hydrolysate) and EP13. Light significantly enhanced the formation of EP1, EP7-10, EP12-13, EP16 and EP19. Oxidation promoted the production of EP1 and EP19. Heat contributed to the production of EP1 and EP8-9. For esmolol hydrochloride injection, both acidic condition and basic condition favored the formation of degradation products EP1, EP7-8 (dimeric hydrolysate), EP15 (dimeric hydrolysate) and EP17. Light significantly enhanced the formation of EP7, EP8 and EP19. Oxidation and heat alone promoted the production of EP19 (Fig. 8). According to our analysis of degraded products of esmolol, esmolol hydrochloride injection was susceptible to degradation in light, temperature, and moisture, hence it requires proper storage conditions. We suggested that the safe level of moisture content is 0.5 %.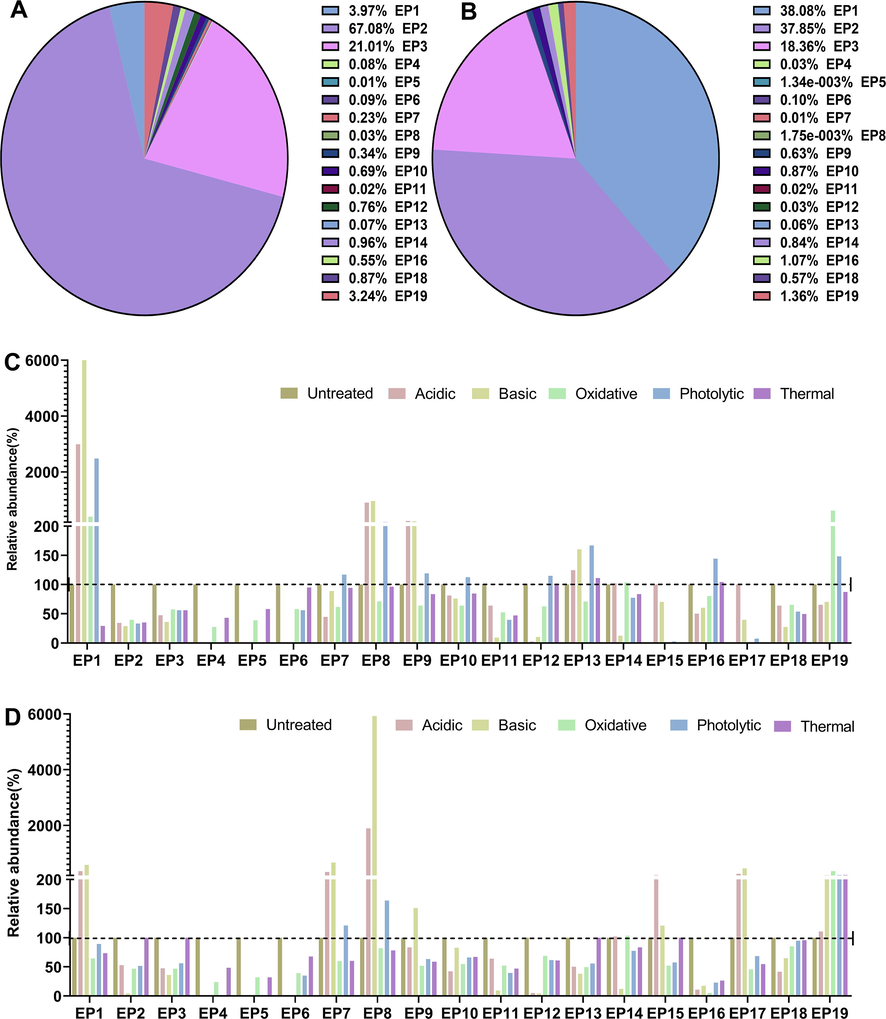
The relative abundance of esmolol impurities in the degradation experiment. (A) The relative abundance of impurities in bulk esmolol substance without forced degradation treatment (sum normalization of peak area). (B) The relative abundance of impurities in esmolol injection without forced degradation treatment (sum normalization of peak area). (C) The relative abundance of impurities in bulk esmolol substance after acidic and basic hydrolyses, thermal stress, oxidative degradation, photolytic degradation. (D) The relative abundance of impurities esmolol injection after acidic and basic hydrolyses, thermal stress, oxidative degradation, photolytic degradation.
3.6 Prediction of toxicity of esmolol and impurities
ADMET Predictor is a useful QSAR tool based on statistical rules, and has been widely used in the assessment of potential toxicity of lead compounds, drug impurities (Tiwari et al., 2018; Zhuang et al., 2021) or metabolites (Sohlenius-Sternbeck & Terelius, 2022; Tiwari et al., 2019) in drug discovery and development.
Apart from EP20, other EPs were predicted to be non-toxic. EP20 had susceptibility to cause hepatotoxicity and mutagenicity that possess the risk of positive ames test results with microsomal activation for Salmonella typhimurium strains, including TA97 and TA1537 strains. According to ICH M7, EP20 was listed as III genotoxic impurity. Moreover, EP20 was highlighted to be hepatotoxic, as indicated by its propensity to elevate serum levels of gamma-glutamyl transferase (GGT), lactate dehydrogenase (LDH), aspartic acid transaminase (AST) and alanine transaminase (ALT). Moreover, the hepatotoxicity of EP20 in mice was verified, according to our prediction. EP20 at a dosage of 50 mg/kg caused elevated alanine aminotransferase in serum, suggesting that EP20 possesses significant hepatotoxicity (Sup Fig. 2).
EP20 was distributed only in bulk drug substance, not in injection. Epoxy ring in EP20 was predicted as toxicophores by both toxalerts server and toxtree. Epoxides are usually used as very widely used starting materials in the synthesis of drug substance or drug substance, such as anti-hypertensive drug propranolol (Pathare & Akamanchi, 2013) and epichlorohydrin. Epoxide intermediates are recognized as toxicological intermediates that trigger a variety of deleterious adverse effects including mutagenicity, which are easy to react with amine groups, organometallic reagents, halogenated compounds, aromatic compounds, cyanide and other nucleophilic reagents in the process of drug synthesis and ring opening, due to the high reactivity of epoxide (Koskinen & Plná, 2000). The reaction between the two electrophilic carbon atoms of the epoxide and the nucleophilic center of the DNA structure can form alkylated products, causing DNA mutations that are harmful to human health (Table 2).
Hepatotoxicity
Cardiotoxicity
Mutagenicity
Carcinogenicity
Skin sensitization
EP1
Neg
Neg
Neg
Neg
Neg
EP2
Neg
Neg
Neg
Neg
Neg
EP3
Neg
Neg
Neg
Neg
Neg
EP4
Neg
Neg
Neg
Neg
Neg
EP5
Neg
Neg
Neg
Pos(mouse)
Neg
EP6
Neg
Neg
Neg
Neg
Neg
EP7
Neg
Neg
Neg
Pos(rat)
Neg
EP8
Neg
Neg
Neg
Neg
Neg
EP9
Neg
Neg
Neg
Neg
Neg
EP10
Neg
Neg
Neg
Neg
Neg
EP11
Neg
Neg
Neg
Neg
Neg
EP12
Neg
Neg
Neg
Neg
Neg
EP13
Neg
Neg
Neg
Neg
Neg
EP14
Neg
Neg
Neg
Neg
Neg
EP15
Neg
Neg
Neg
Neg
Neg
EP16
Neg
Neg
Neg
Neg
Neg
EP17
Neg
Neg
Neg
Neg
Neg
EP18
Neg
Neg
Neg
Neg
Neg
EP19
Neg
Neg
Neg
Neg
Neg
EP20
Pog(ALT↑, AST↑,LDH↑,GGT↑)
Neg
Pos(S100; m535; NIHS)
Neg
Neg
3.7 Content determination of EP1
The content determination results were as follows: the system suitability of the developed method was checked for 1.0 mg·mL−1 by evaluating percent RSD values of peak area, asymmetry, theoretical plate, and retention time of five standard replicates. % RSD values were found less than 5, for all parameters as shown in Table 3. The regression coefficient was found to be 0.9999 for EP1 in the range of 0.8380 ∼ 209.50 μg·mL−1, confirming the linearity of the method. LOD and LOQ values were found to be 0.04 μg·mL−1 and 0.12 μg·mL−1, respectively. The RSD of intraday precision was evaluated to be 0.30 % on consecutive 48 h. Hence, the developed method can be further used for the determination of EP1 in injection formulation without the interference of excipients (Table 3). 82 batches of esmolol hydrochloride injection samples from four manufacturing enterprises were examined by the established method of related substances. The results showed that the single largest impurity was EP1, with a content range of 0.6 ∼ 7.1 %.
Parameter
EP1
Detection wavelength (nm)
222
Linearity (μg/mL)
0.8380 ∼ 209.50 μg/mL
Regression coefficient (r)
r = 0.9999
Regression equation
Y = 503.87X + 70.241
LOD (μg/mL)
0.04 μg/mL
LOQ (μg/mL)
0.12 μg/mL
Interday precision % RSD (n = 3)
3.3 %
%Assay ± RSD (n = 6)
0.6 ∼ 7.1 %
%Recovery ± RSD (n = 3)
98.94 ± 1.7
Esmolol hydrochloride contains ester groups in its chemical structure, which are easily hydrolyzed by the form and hydrochloric acid factors, resulting in EP1 and methanol. Although EP1 was predicted to be non-toxic, the toxicity of methanol is explicit and recognized. In view of safety, the amount of methanol should also be monitored and controlled. In this study, the amount of methanol in the samples was determined by gas chromatography (He, 2015).The content of EP1 and methanol in samples from different manufacturers were measured separately, results showed that among 82 batches of samples, the methanol content of 6 batches is more than 0.3 %, and the maximum is up to 0.7 %. Chinese Pharmacopoeia requires the amount of methanol residual should not exceed 0.3 %. Therefore, EP1 can not only be controlled by the relevant substances in the check item to control the limit of the amount of methanol, but also prompted the production enterprises should be scientifically optimized production process and storage conditions, reasonable control of the species in the generation of EP1.
4 Conclusions
In this study, targeted/untargeted mass spectrometry strategy, MMDF plus multivariate spectrophotometric methods strategy, were introduced as a powerful approach for mining esmolol impurity. The stability studies and the impurity profiling of esmolol hydrochloride injections were conducted according to the ICH guidelines using UPLC-QE-MS method. Esmolol and all the impurities were well separated with good peak shapes and resolution. Based on the stability tests and the UPLC-QE-MS analysis, the origins and their formation mechanisms of these impurities were located. 14 new impurities were found. The EP1 contents showed maximum volatility, and varied by sample. EP1 and its accompanying product of methanol were measured. The established strategy, UPLC-MS based multiple mass defect filter and chemometrics with in-silico toxicity prediction, contributed to the quality assurance and process control of esmolol hydrochloride injections, as well as the establishment of shelf life and recommended storage conditions.
Acknowledgements
We are grateful for Prof Changqin Hu (National Institutes for Food and Drug Control) and Prof Yihong Lu (Jiangsu Institute for Food and Drug Control Jiangsu Institute for Food and Drug Control) for ADMET prediction. impurities
Funding
This work was supported by Hunan Natural Science Foundation Project (No.2020JJ9003) and the Scientific Research Launch Project for new employees of the Second Xiangya Hospital of Central South University (No507845, Second Xiangya Hospital).
Declaration of Competing Interest
The authors declare that they have no known competing financial interests or personal relationships that could have appeared to influence the work reported in this paper.
References
- Chemometric quality assessment of Paracetamol and Phenylephrine Hydrochloride with Paracetamol impurities; comparative UV-spectrophotometric implementation of four predictive models. Spectrochim. Acta A Mol. Biomol. Spectrosc.. 2022;265:120308
- [CrossRef] [Google Scholar]
- UPLC-ESI/Q-TOF MS/MS Method for Determination of Vildagliptin and its Organic Impurities. J. Chromatogr. Sci.. 2020;58(8):718-725.
- [CrossRef] [Google Scholar]
- Use of principal component analysis (PCA) and hierarchical cluster analysis (HCA) for multivariate association between bioactive compounds and functional properties in foods: a critical perspective. Trends Food Sci. Technol.. 2018;72:83-90.
- [CrossRef] [Google Scholar]
- Advanced chemometric methods as powerful tools for impurity profiling of drug substances and drug products: application on bisoprolol and perindopril binary mixture. Spectrochim. Acta A Mol. Biomol. Spectrosc.. 2022;267:120576
- [Google Scholar]
- Determination of methanol in esmolol hydrochloride injection by gas chromatography. Journal of North Pharmacy. 2015;12(11):2.
- [Google Scholar]
- Impurity profiling of a chemical weapon precursor for possible forensic signatures by comprehensive two-dimensional gas chromatography/mass spectrometry and chemometrics. Anal. Chem.. 2010;82(2):689-698.
- [CrossRef] [Google Scholar]
- Preparation of microkernel-based mesoporous (SiO(2)-CdTe-SiO(2))@SiO(2) fluorescent nanoparticles for imaging screening and enrichment of heat shock protein 90 inhibitors from Tripterygium Wilfordii. Anal. Chem.. 2018;90(9):5678-5686.
- [CrossRef] [Google Scholar]
- Specific DNA adducts induced by some mono-substitued epoxides in vitro and in vivo. Chem. Biol. Interact.. 2000;129(3):209-229.
- [Google Scholar]
- Impurity profiling and stability-indicating method development and validation for the estimation of assay and degradation impurities of midostaurin in softgel capsules using HPLC and LC-MS. Biomed. Chromatogr.. 2021;35(12):e5222.
- [Google Scholar]
- High-performance liquid chromatographic method for the determination of esmolol hydrochloride. J. Pharm. Sci.. 1984;73(11):1660-1661.
- [Google Scholar]
- Simultaneous and trace level quantification of two potential genotoxic impurities in valsartan drug substance using UPLC-MS/MS. J. Pharm. Biomed. Anal.. 2022;212:114630
- [CrossRef] [Google Scholar]
- An integrated two-step filtering strategy of collision cross-section interval predicting and mass defect filtering for targeted identification of analogues in herbal medicines using liquid chromatography-ion mobility-mass spectrometry. J. Chromatogr. A. 2021;1657:462572
- [CrossRef] [Google Scholar]
- A systematic strategy integrating solid-phase extraction, full scan range splitting, mass defect filter and precursor ion list for comprehensive metabolite profiling of Danqi Tongmai tablet in rats. J. Pharm. Biomed. Anal.. 2021;198:113989
- [CrossRef] [Google Scholar]
- An efficient protocol for regioselective ring opening of epoxides using sulfated tungstate: application in synthesis of active pharmaceutical ingredients atenolol, propranolol and ranolazine. Tetrahedron Lett.. 2013;54(48):6455-6459.
- [Google Scholar]
- Review of the most common chemometric techniques in illicit drug profiling. Forensic Sci. Int.. 2019;302:109911
- [CrossRef] [Google Scholar]
- A selective and sensitive UPLC–MS/MS approach for trace level quantification of four potential genotoxic impurities in zolmitriptan drug substance. J. Pharm. Biomed. Anal.. 2013;84:84-89.
- [Google Scholar]
- Traditional versus advanced chemometric models for the impurity profiling of paracetamol and chlorzoxazone: Application to pure and pharmaceutical dosage forms. Spectrochim. Acta A Mol. Biomol. Spectrosc.. 2018;205:376-380.
- [CrossRef] [Google Scholar]
- The use of mass defect in modern mass spectrometry. J. Mass Spectrom.. 2012;47(2):226-236.
- [CrossRef] [Google Scholar]
- Evaluation of ADMET predictor in early discovery drug metabolism and pharmacokinetics project work. Drug Metab. Dispos.. 2022;50(2):95-104.
- [Google Scholar]
- Impurity in sugarcane juice as mineral content: a prospect for analysis using energy-dispersive X-ray fluorescence (EDXRF) and chemometrics. Microchem. J.. 2021;164:105951
- [Google Scholar]
- Impurity in sugarcane juice as mineral content: A prospect for analysis using energy-dispersive X-ray fluorescence (EDXRF) and chemometrics. Microchem. J.. 2021;164:105951
- [CrossRef] [Google Scholar]
- In vitroand in vivo investigation of metabolic fate of riociguat by HPLC-Q-TOF/MS/MS and in silico evaluation of the metabolites by ADMET predictor™. J. Pharm. Biomed. Anal.. 2019;164:326-336.
- [Google Scholar]
- Study of degradation behaviour of montelukast sodium and its marketed formulation in oxidative and accelerated test conditions and prediction of physicochemical and ADMET properties of its degradation products using ADMET Predictor™. J. Pharm. Biomed. Anal.. 2018;158:106-118.
- [CrossRef] [Google Scholar]
- Separation, systhesis and identification of the impurity of esmolol hydrochloride injection. Chin. J. Pharm. Anal.. 2011;31(1):138-140.
- [Google Scholar]
- Rapid screening and identification of metabolites of murpanicin in rats by UHPLC/Q-TOF-MS/MS combined with diagnostic fragment ions (DFIs) and multiple mass defect filter. J. Pharm. Biomed. Anal.. 2022;213:114679
- [CrossRef] [Google Scholar]
- Isolation, structural characterization and quality control strategy of an unknown process-related impurity in sugammadex sodium. J. Pharm. Biomed. Anal.. 2021;200:114072
- [CrossRef] [Google Scholar]
Appendix A
Supplementary material
Supplementary data to this article can be found online at https://doi.org/10.1016/j.arabjc.2023.104573.
Appendix A
Supplementary material
The following are the Supplementary data to this article:Supplementary data 1
Supplementary data 1


