

Translate this page into:
An integrated strategy of secondary metabolomics and glycomics to investigate multi-component variations in wine-processing of medicinal herbs and functional foods: A case study on Fructus Corni
⁎Corresponding author. haocai@njucm.edu.cn (Hao Cai)
-
Received: ,
Accepted: ,
This article was originally published by Elsevier and was migrated to Scientific Scholar after the change of Publisher.
Abstract
Abstract
Chemical composition of crude and processed Fructus Corni (FC) were profiled. The saccharides in FC on various processing methods were conducted thoroughly. Transformation of phytochemicals to furan aldehyde derivatives was investigated. High-pressure wine steamed FC could be an alternative to wine steamed FC in clinic.
Abstract
Fructus Corni (FC), as a promising Chinese medicinal herb, has aroused considerable interest. Generally, FC needs to be processed according to the limited standard policy in China before clinical application, while the investigations on the specific processing methods (such as wine steaming or high-pressure wine steaming) are unclear. A comprehensive metabolomics strategy based on integrated non-targeted metabolomics and targeted glycomics in this paper was implemented to investigate the influences of the different processing technologies such as steaming, wine steaming, high-pressure steaming, high-pressure wine steaming, wine immersion, and wine stir-frying on FC, respectively. UHPLC-Q-TOF-MS/MS was employed for identifying and distinguishing the secondary metabolites. A total of 85 components were identified in all groups. The results of PCA score plots showed that the crude and processed samples had a complete separation, and wine steamed and high-pressure wine steamed samples could be a category, indicating that the two processed products had a similar quality. Multiple chromatography including HPLC (C18)-PDA, HPLC (NH2)-ELSD, and HPGPC-ELSD was used for determining the molecular weight distributions, the monosaccharide compositions of polysaccharides, and the contents of free monosaccharides and oligosaccharides. The results indicated that the content and composition of saccharides were different in crude and different processed FC. The polysaccharides were composed of fucose, arabinose, galactose, glucose, galacturonic acid, mannose and rhamnose, and the free monosaccharides were composed of fucose, arabinose, galactose, glucose, mannose, rhamnose and fructose in all FC samples. The PCA score plots of the glycomics indicated that the crude and high-pressure wine steamed FC could be a category, showing that the two groups had similar chemical compositions. Ultimately, the simulation processing experiments indicated that the transformation of morroniside, polysaccharides, oligosaccharides, fructose, and glucose to 5-HMF through the reactions of dehydration and deglycosylation was the potential mechanism of enhancing the effects by processing. Conclusionly, the saccharides should be investigated as thoroughly as the secondary metabolites, and the high-pressure wine steamed FC could be an alternative to wine steamed FC.
Keywords
Fructus Corni
Different processing methods
Non-targeted metabolomics
Targeted glycomics
Multiple chromatography
Simulation processing

- FC
-
Fructus Corni
- TCM
-
traditional Chinese medicine
- UHPLC-Q-TOF-MS/MS
-
ultra-high-performance liquid chromatography quadrupole time-of-flight mass spectrometry
- TFA
-
trifluoroacetic acid
- PMP
-
1-phenyl-3-methyl-5-pyrazolone
- Glu
-
glucose
- Gala
-
galacturonic acid
- Gluc
-
glucuronic acid
- Ara
-
arabinose
- Man
-
mannose
- Rha
-
rhamnose
- Gal
-
galactose
- Fuc
-
fucose
- Fru
-
fructose
- Suc
-
sucrose
- Raf
-
raffinose
- CNKI
-
China National Knowledge Infrastructure
- HPGPC
-
high-performance gel permeation chromatography
- ELSD
-
evaporative light scattering detector
- PCA
-
principal component analysis
- OPLS-DA
-
orthogonal partial least squares discriminant analysis
- QC
-
quality control
- RSD
-
relative standard deviation
- 5-HMF
-
5-hydroxymethyl-2-furfural
Abbreviations
1 Introduction
Fructus Corni (FC, known as 'shanzhuyu'), the dried ripe sarcocarp of Cornus officinalis Sieb. et Zucc. distributed over Southeast Asia and as a traditional and essential natural herbal source widely used for two thousand years in China, is frequently considered for treating some diseases relevant to liver and kidney according to the clinical evidence-backed prescriptions left by eminent Chinese physicians (Park et al., 2013). Increasing practices indicated that FC gradually emerged as a functional food such as drink and wine with in-depth development (Ye et al., 2020). A mass of important secondary metabolites including iridoids, flavones, organic acids, and terpenoids in FC with an extensive range of pharmacodynamic properties such as anti-microbial, renal protective, hypolipidemic, anti-diabetic, and anti-obesity activities in consideration of some prospective investigations are regarded as the promising functional ingredients (An et al., 2021; Dinda et al., 2016). Nevertheless, an inconspicuous metabolite named saccharides exerts non-substitutable influence on the human body no matter in pathological or physiological conditions. Accumulating evidence from interdisciplinary investigations indicated that polysaccharides extracted from natural products have been known as a promising substance for curing plenty of diseases with lower toxicity and side effects and a top-quality nutritional supplement (Yu et al., 2018; Zeng et al., 2019). It is worth noting that water as a commonly used decoction solvent for clinical medication can dissolve saccharides. Therefore, the lucubration of saccharides in medicinal herbs is possible to develop a safe and effective therapeutic agent originating from nature. Based on the specificity of saccharides and the limits of current detecting technology, a targeted glycomics method was employed for elucidating saccharides from natural materials covering medicinal herbs and functional foods (Yip et al., 2019; Zhou et al., 2018).
Processing is the premise for the use and application of medicinal herbs in the clinic. The wine as both a drink and an adjuvant can promote the diffusion and dissolution of phytoconstituents (Chen et al., 2018), and is also the main auxiliary liquor material in FC processing. The properties of medicinal herbs could be changed by processing as a research recommended that crude and processed profiles showed discriminating anti-diabetic activity (Bi et al., 2019). There could be a universal nature to traditional processing technology as Chinese medicinal herbs are deeply investigated. Currently, there is still no standard policy to clearly describe the specific operating conditions of FC processing, meanwhile, there is also no relevant literature referring to the effects of operating conditions such as high-pressure wine steaming, wine steaming, high-pressure steaming, steaming, wine stir-frying, and wine immersion on the chemical composition of FC. Therefore, it is a necessity to choose an appropriate processing condition to ensure the quality and effect of the processed medicinal herbs.
Simulation processing of Chinese medicinal herbs refers to major fractions processed in a particular condition paralleling the materials to indicate the variation of ingredients and illuminate the underlying mechanism of primary processing (Zhou et al., 2017). The mechanism is the foundation to improve the processing technology and establish the quality standards, which is the insurance for safety and effect in clinic. Furthermore, monomers and group components processed under the simulation situation could simplify the complex problems and excavate the reaction rules in the simple environment, which offered a reference to elaborate the mechanism of processed medicinal herbs.
Due to the fact of 'multi-phytochemical and multi-target', a strategy of 'interaction of system to system' was previously proposed by our research group (Duan et al., 2016). Herein, the holographic components from natural products could be regarded as a system containing a set of fractions and were in accord with the unity of traditional Chinese medicine (TCM) theory. Metabolomics was aimed to analyze the whole secondary metabolome, while glycomics was utilized to evaluate the saccharides including polysaccharides, oligosaccharides, and monosaccharides. Therefore, the integration of metabolomics and glycomics could be a promising strategy for the comprehensive characterization of chemical components in FC.
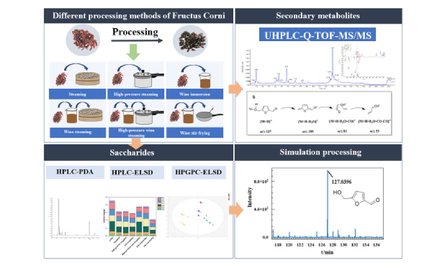
The paper will integrate non-targeted metabolomics and targeted glycomics in alliance with multiple chromatographies including HPLC (C18)-PDA, HPLC (NH2)-ELSD, and HPGPC-ELSD to reveal the holographic phytochemical profiles of FC in various processing conditions including high-pressure wine steaming, wine steaming, high-pressure steaming, steaming, wine stir-frying, and wine immersion. And then, qualitative analysis was performed by ultra-high-performance liquid chromatography quadrupole time-of-flight mass spectrometry (UHPLC-Q-TOF-MS/MS) to investigate simulation processing products for diging out the chemical markers of the processing (Fig. 1). Finally, the influence on the saccharides of FC and chemical transformation via Chinese medicine processing could be expounded by multivariate statistical methods.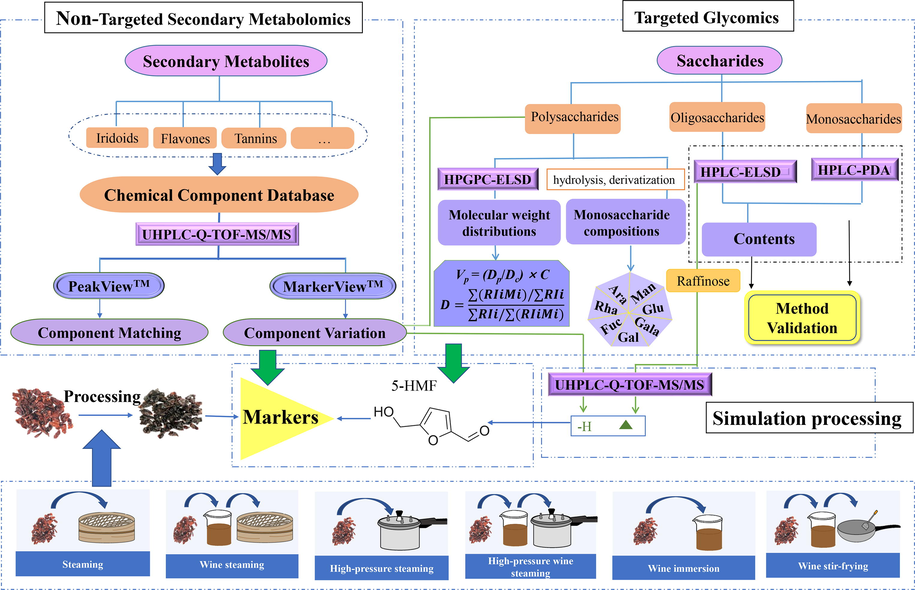
Technical flow chart for conduction of experiments.
2 Materials and methods
2.1 Reagents, chemicals, instruments, and materials
The crude FC, purchased from Panan (Zhejiang Province, P.R. China) and authenticated by Prof. Jianwei Chen, is the dried fruits of Cornus officinalis Sieb et Zucc. The steamed samples were processed at 100 ℃ for 1 h, while wine steamed FC were treated at 100 ℃ for 2 h after 30 % wine infiltration for 0.5 h. High-pressure steaming conditions were at 125 ℃ for 1 h under high pressure, while high-pressure wine steaming conditions were at 115 ℃ for 1 h under high pressure after 1 h immersion with 25 % wine. Wine immersion is to soak the medicinal materials in wine only for 1 h, and wine stir-frying is to fry the medicinal materials dried with after soaking with wine for 1 h. The details of processing methods were followed the previous investigations (Han et al., 2022). The voucher specimens were deposited in Jiangsu Key Laboratory of Chinese Medicine Processing, Nanjing University of Chinese Medicine (Nanjing, P.R. China).
UHPLC (Shimadzu 30A, Japan); AB Sciex Triple TOF 5600+ system (Canada) equipped with Analyst TF1.6, PeakViewTM 1.2.1, and MarkerViewTM 1.2.1 softwares; HPLC (Waters e2695, USA) allocated with UV detector (Waters 2489, USA) and ELSD detector (600ES-1104010, Alltech, USA); semi microbalance (0.01 mg, Quintix 35–1, Sartorius, P.R. China); ultra-pure water purification system (Millipore, Integral-3, USA); ultrasonic cleaner (KQ5300DC, Kunshan, P.R. China); SPE solid-phase extraction column (CNWBOND LC-C18 SPE Cartridge, Shanghai, P.R. China); rotary evaporator (Buchi, Switzerland); electric heating adaptor (Xiangru, Nanjing, P.R. China).
Methanol, acetonitrile (chromatographic grade, TEDIA, USA; MS grade, E. Merck, Germany); phosphoric acid, ammonium acetate, trifluoroacetic acid (TFA), ammonium hydroxide (chromatographic grade, Aladdin, P.R. China); 1-phenyl-3-methyl-5-pyrazolone (PMP), glacial acetic acid, ethanol (Macklin, P.R. China); chloroform (20190920, Sinopharm, P.R. China); formic acid (75C1812LP, ACS, USA).
The reference substances including 5-hydroxymethyl-2-furfural (5-HMF, Q-042–180112), morroniside (M−027−190304), loganin (M−010−180118), cornuside (S-125–180525), and glucose (Glu) were prepared from Chengdu Herbpurity Co., ltd (Chengdu, P.R. China). Dextrans with known molecular sizes (2.70–2000.00 kDa), galacturonic acid (Gala), glucose (Glu), arabinose (Ara), mannose (Man), rhamnose (Rha), galactose (Gal), fucose (Fuc), fructose (Fru), and swertiamarin (111742–200501) were purchased from National Institute for Control of Pharmaceutical and Biological Products (P.R. China), while raffinose (Raf) was obtained from Aladdin (Shanghai, P.R. China).
2.2 Sample preparation for secondary metabolites
The reference substances (10 mg) including 5-HMF, morroniside, loganin, cornuside, and swertiamarin were weighed accurately and dissolved ultrasonically with 10 mL methanol to prepare for the mixture reference solution. The smashed and sieved (60 mesh) herbal materials were weighed (5 mg) and extracted with 90 % (v/v) and 50 % (v/v) ethanol for 1.5 h, respectively. The combined filter liquor was concentrated by a rotary evaporator in vacuum to 20 mL. The concentrated solution (1 mL) was diluted to 4 mL with methanol and centrifuged for 5 min at the speed of 4000 rpm. The elution program of the supernatant (2 mL) through SPE column to purify and dilute was set as follows: 5 %, 25 %, 50 %, 75 %, and 100 % (v/v) methanol for 3 mL, 2 mL, 2 mL, 1 mL, and 1 mL, separately.
2.3 Sample preparation for glycomics
Saccharides were prepared with the related literature (Zhou et al., 2018). Dried sample powder (40 mg) was extracted with water (400 mL × 1.5 h × two times). Ethanol was added to the cooling combined filtrate from filtration to make a final concentration of 80 % (v/v) and left overnight (24 h) under 4 ℃. Set aside the concentrated liquor (100 mL) prepared from supernatant filtrated again, while the sediment was placed in the ventilated area after being washed with ethanol three times.
1 mg prepared sediment was firstly dissolved with 15 mL ultra-pure water, and the liquor was loaded into the 3500 Da dialysis bag overnight. During the period, the water was changed at the 4th hour and again at the 12th hour, and the last change continued for 2 h. The dialysate lyophilized was the polysaccharides that were prepared for analysis.
2.3.1 Polysaccharide
20 mg lyophilized powder of polysaccharides was mixed with 2 mL ultra-pure water. After being sufficiently dissolved ultrasonically, the solution was centrifuged with the same amount of ultra-pure water at the speed of 13,000 rpm for 5 min. A drainage membrane filter was used for filtration, through which the total polysaccharide analytical samples of crude and processed FC were produced.
2.3.2 Total monosaccharide hydrolyzed from polysaccharide
The powder of polysaccharides was weighed (15 mg) and dissolved with 3 M (2 mL) TFA ultrasonically. The mixture transferred into penicillin bottles and sealed with nitrogen gas was hydrolyzed at 110 ℃ for 6 h. The hydrolyzed product was transferred into tubes and centrifuged at 13,000 rpm for 10 min when the temperature dropped to the room temperature. The supernatant was dissolved with methanol and evaporated to dryness and performed in triplicate. The hydrolysate was obtained from the liquor which passed through the drainage membrane filter after the residue was dissolved in 1 mL ultra-pure water. 200 μL hydrolysate was loaded into the test tube with a stopper and 200 μL ammonium hydroxide was added, respectively. The miscible liquids were made up of 160 μL 0.5 M PMP methanol solution and blended adequately in closed conditions. After being heated in the water bath for 30 min at 70 ℃, the liquor was neutralized with 200 μL acetic acid at the room temperature. 2 mL water was applied for dilution. The constant volume of chloroform was added and extracted shakingly while the chloroform layer was discarded and repeated three times. The total monosaccharides from polysaccharide hydrolysate analytical samples of crude and processed FC were liquids passed through the membrane.
2.3.3 Oligosaccharide and free monosaccharide
The concentrated liquor (1 mL) listed in section 2.3 was mixed with 4 mL ultra-pure water and centrifugated at 13,000 rpm for 10 min. The supernatant was applied for the chromatographic analysis.
The concentrated liquor (1 mL) listed in section 2.3 was taken and the solvent in the liquor was recovered in a decompression state at 60 ℃. 200 μL supernatant was performed by PMP derivatization after the residue was mixed with 5 mL ultra-pure water and centrifuged.
2.4 Preparation of reference substances of saccharides
10.00 mg of dextrans with different molecular weights were weighed precisely and dissolved with 1 mL ultra-pure water, respectively.
2.00 mg of monosaccharides were weighed accurately and dissolved with 1 mL ultra-pure water, respectively. 200 μL hydrolysate was loaded into the test tube with a stopper and 200 μL ammonium hydroxide was added, respectively. The subsequent operations were identical to section 2.3.2.
5.00 mg of oligosaccharides were weighed precisely and dissolved with 1 mL ultra-pure water, respectively. Furthermore, the preparation of fructose followed the same disposed principles.
2.5 Chromatographic analysis
2.5.1 Secondary metabolites analysis
UHPLC conditions: Agilent C18 reversed phase UHPLC column was employed for analysis. The mobile phase was constituted by 0.1 % aqueous formic acid (A) - acetonitrile (B), and the temperature was optimized at 30 ℃. The flow rate was set as 0.3 mL·min−1, and the injection volume was 3 μL. The gradient elution program for secondary metabolites was optimized as follows: 0–3 min, 5 % − 20 % B; 3–10 min, 20 % B; 10–18 min, 20 % − 95 % B; 18–20 min, 95 % B; 20–22 min, 95 % − 5 % B; 22–23 min, 5 % B. While for the analysis of simulation processing products, the elution program was set as follows: 0–18 min, 5 % − 95 % B.
MS conditions: AB Sciex Triple TOF 5600+ system was employed for analysis. The MS spectra were collected in both the positive and negative ion modes. In order to separate and detect efficiently, the MS parameters were set as follows: the temperature of ion source was set at 550 ℃, and the ion spray voltage was set at the range of −4500 V/+5500 V. The pressures of spray gas, auxiliary heating gas (N2), and curtain gas were optimized at 55, 55, and 35 psi, respectively. Declustering potential was set at 60 V and the collision energy was optimized at 30 V. Data was acquired from TOF MS and TOF MS/MS at the scan range from 100−2000 Da and 50–2000 Da, respectively.
2.5.2 Molecular weight of polysaccharides analysis
The molecular weight of polysaccharides was identified with Waters e2695 LC-ELSD system coupled with TSK gel G4000PWXL column (300 mm × 7.8 mm, 10 μm) to perform high performance gel permeation chromatography (HPGPC) analysis. The mobile phase was made up of water solution and maintained the speed of 0.6 mL·min−1 for 20 min. The column temperature was set at 35 °C and the temperature of ELSD drift tube was set at 100 ℃. The flow rate of N2 was 3.0 mL·min−1 with isocratic elution for 20 min and the injection volume was 10 μL.
2.5.3 Monosaccharide analysis
Waters e2695 LC-PDA system emerged with Waters Symmetry C18 column (250 mm × 7.8 mm, 5 μm) was employed for the determination of monosaccharides. The mobile phase was composed of 100 mM aqueous ammonium acetate – acetonitrile (17: 83). The column temperature was set at 35 ℃ and the UV detection wavelength was set at 245 nm. The flow rate was at 1.0 mL·min−1 with isocratic elution for 35 min and the injection volume was 10 μL.
2.5.4 Oligosaccharide analysis
Waters e2695 LC-ELSD system in alliance with Agilent Original 70A NH2 column (250 mm × 4.6 mm, 5 μm) was employed to analyze the oligosaccharides. The mobile phase consisted of water solution – acetonitrile (30: 70). The column temperature was set at 35 ℃ and the flow rate was at 0.8 mL·min−1. The temperature of ELSD drift tube was set at 110 ℃. The flow rate of N2 was 3.0 mL·min−1 with isocratic elution for 35 min and the injection volume was 20 μL.
2.6 Method validation
The quantitative method was validated in terms of linearity, precision, accuracy and stability.
2.6.1 Linearity
Equations of the calibration curves portrayed the correlation of six various concentrations of monosaccharide derivatives and oligosaccharide solution reference substances and peak areas, from which the regression equation, linear range, and correlation coefficient of each component under test could be obtained.
2.6.2 Precision, stability, and recovery
Quality control (QC) samples were divided into three groups and processed as the same method as the total monosaccharides and oligosaccharides with continuous detection six times. The stability of the method was verified by performing seven repetitive injections of the prepared samples in the time intervals of 0, 2, 4, 6, 8, 10, and 12 h. The RSDs of the peak areas of each analyte were taken as the measures of stability. The accuracy was tested by recovery assay, and six quantities of known concentration of each component were added to a certain concentration of the reference substance, respectively. The solution was analyzed by the method mentioned above, and the recovery and RSD were calculated by the peak area integral values of the compounds.
2.7 Component identification by UHPLC-Q-TOF-MS/MS analysis
Firstly, an in-house database was built by searching literature and database covering CNKI (China National Knowledge Infrastructure), Scifinder, Pubmed, and ScienceDirect comprehensively to collect the components information containing chemical name, molecular mass, molecular formula, and molecular structure of FC, and the exact mass to charge ratios (m/z) of compounds in positive and negative ion modes were computed. Subsequently, the Analyst TF 1.6 software was employed for collecting the chemical information of FC. And then, the obtained total ion chromatographic information was imported into the PeakViewTM 1.2.1 software, and the calculation function of the XIC Manager module was employed for preliminary analysis and calculation according to the retention time (error < 0.2 min) and mass-to-charge ratio (error < ± 10 ppm). The relevant parameters were set as follows: XIC intensity > 50 counts, S:N > 10, mass error ≤ 10, and isotope ratio% difference ≤ 20. Finally, the ion peak attribution could be determined when the matching degrees of molecular structure and the secondary fragment information were>75 %.
2.8 Simulation processing assay of morroniside
The aqueous solutions of morroniside (2 mg·mL−1) were prepared, respectively, and the pH value was adjusted to 4.4 with diluted hydrochloric acid solution later. The mixture was heated at 125 °C for 1 h and centrifuged at 13,000 rpm for 5 min twice.
2.9 Data processing
MarkerViewTM 1.2.1 software from AB Sciex company was applied for screening the substances with significant differences in the crude and processed FC. The original data were imported into the software to operate the principal component analysis (PCA) and statistical analysis (t-test). The raw data collected and processed by Analyst TF 1.6 software were imported into MarkerViewTM 1.2.1 software. Subsequently, peak alignment, noise filtering and normalization were performed in the software, and the ions with significant differences were found by t-test analysis (P < 0.05 means statistical difference. t-value > 0 means the content increasing of the components). PCA of content information of saccharides from the crude and processed FC were performed by software SIMCA 14.1. Data were presented as mean ± SD of the determinations. Data sets performed using one-way analysis of variance (ANOVA) and values of P < 0.05 were considered significant. A defined variable (Vp) of polysaccharides was calculated as following equation:
(Dc: the D value of crude samples; Dp: the D value of processed samples; C: the total content of polysaccharides).
3 Results and discussions
3.1 Secondary metabolites
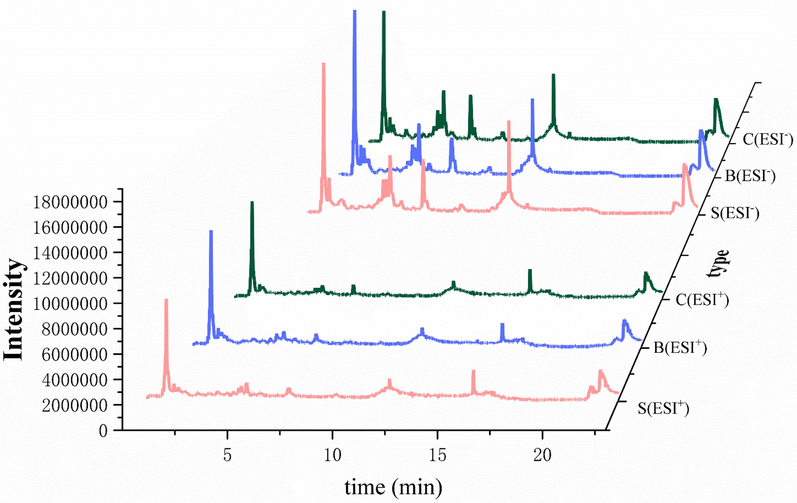
85 components including iridoids, flavones, organic acids, tannins, etc. of the crude and processed FC were recognized in the positive and negative ion modes (Table 1). Representative total ion chromatograms were shown in Fig. 2. Iridoids and their glycosides, the representative monoterpenes of cyclopentane pyranoid contained in FC, possess extensive biological activities such as anti-cancer, liver protection, anti-inflammatory effects, and so on (Wang et al., 2020). Iridoids in FC identified by liquid chromatography-mass spectrometry were loganin, loganin acid, swertiamarin, hastatoside, morroniside, cornin, geniposide, dehydrologanin, secologanin, monotropein, secologanoside, dihydrocornin, secoxyloganin, sweroside, 7β-O-methyl-morroniside, 7α-O-methyl-morroniside, and cornuside. Loganin appeared at the retention time of 6.39 min and exhibited a parent ion at m/z 435, generating a fragment ion at m/z 227 by loss of a glucose fragment (162 Da) and a carboxyl and continuously removing a C7H10O2 fragment (106 Da) as shown in Fig. 3a. Organic acids and furans are also the typical active compounds contained in FC. The fragments of 5-HMF under the experimental conditions were consistent with the report (Serra-Cayuela et al., 2013). The main ion fragments were exhibited at m/z 109, 81, and 53 (Fig. 3b). The fragmentation was elucidated by loss of a neutral fragment (H2O) and CO group. *Compared to the reference standards.
No.
Chemical Name
Fomula
Mass (Da)
Adduct
Extraction Mass (Da)
tR (min)
Error(ppm)
Mass/Charge
Ref.
1
3-O-Caffeoylquinic acid methyl ester
C17H20O9
368.1107
-H
367.1035
0.88
6.2
205.0543; 307.1134; 337.1096
(Qian et al., 2022)
2
Tartaric acid
C4H6O6
150.0164
-H
149.0092
0.91
−0.5
59.0128; 72.9926; 75.0072; 87.0077; 103.0023; 149.00916
(Qian et al., 2022)
3
Sucrose
C12H22O11
342.1162
-H
341.1089
0.92
−0.3
59.0128; 71.0137; 89.0322; 101.0232; 119.0439; 131.0332;
(Qian et al., 2022)
143.0351; 161.0477;179.0537; 341.1098
4
Malic acid
C4H6O5
134.0215
-H
133.0143
0.97
0.2
59.0135; 71.0133; 72.9927; 89.0233; 115.0028; 133.0129
(Qian et al., 2022)
5
2-Furoic acid
C5H4O3
112.0160
-H
111.0088
1.26
−1.0
67.0172; 111.0088
(Schwarz et al., 2021)
6
1-O-Galloyl-β-d-glucose
C13H16O10
332.0744
-H
331.0671
1.69
0.7
59.0146; 71.0086; 89.0235; 119.0349; 123.0279; 125.0254
(Qian et al., 2022)
151.0041; 167.0379; 169.0146; 183.0329; 211.0246; 241.0369
271.0465; 331.0686
7
3-O-Galloyl-β-d-glucose
C13H16O10
332.0744
-H
331.0671
1.69
0.7
59.0146; 71.0086; 89.0235; 119.0349; 123.0279; 125.0254
(Qian et al., 2022)
151.0041; 167.0379; 169.0146; 183.0329; 211.0246; 241.0369
271.0465; 331.0686
8
7-O-Galloyl-d-sedoheptulose
C14H18O11
362.0849
-H
361.0776
1.75
0.4
59.6135; 125.0232; 169.0139; 211.0240; 271.0450
(Qian et al., 2022)
9*
5-Hydroxymethyl-2-furfural
C6H6O3
126.0317
+H
127.0390
1.84
4.7
53.0389; 81.0342; 109.0292; 127.0390
(Qian et al., 2022)
10
Tachioside
C13H18O8
302.1002
-H
301.0929
2.4
0.6
121.0296; 139.0368; 301.0027
(Yang et al., 2019)
11
Gemin D
C27H22O18
634.0806
-H
633.0733
2.64
1.1
169.0115; 301.0195; 463.0444; 633.0732
(Díaz-de-Cerio et al., 2016)
12
Isosorbide-2-acetate
C8H12O5
188.0685
+H
189.0758
3.07
3.5
71.0129; 189.0758
13
2,5-dicarboxylate dimethylterahydrofuran
C8H12O5
188.0685
+H
189.0758
3.07
3.5
71.0129; 189.0758
14
Dimethyl malate
C6H10O5
162.0528
+H
163.0601
3.46
0.0
71.0109; 89.0206; 99.0051; 117.0483
15
Luteolin 7-methyl ether
C16H12O6
300.0634
+H
301.0707
3.56
0.9
227.0924; 237.0554; 245.0675; 255.0694; 265.0456; 283.0581
(Chen et al., 2014)
16
Chrysoeriol
C16H12O6
300.0634
+H
301.0707
3.59
9.3
227.0924; 237.0554; 245.0675; 255.0694; 265.0456; 283.0581
(Chen et al., 2014)
17
Kaempferide
C16H12O6
300.0634
+H
301.0707
3.59
9.3
227.0924; 237.0554; 245.0675; 255.0694; 265.0456; 283.0581
(Chen et al., 2014)
18
2H-Pyran-2-one, 5,6-dihydro-4-methyl-
C6H8O2
112.0524
+H
113.0597
3.76
0.9
67.0527; 113.0564
19*
Swertiamarine
C16H22O10
374.1213
-H
373.1140
4.31
−0.3
59.0142; 89.0237; 167.0722; 373.1058
(Qian et al., 2022)
20
Loganic acid
C16H24O10
376.1370
-H
375.1297
4.39
0.8
59.0133; 69.0342; 71.0125; 89.0236; 95.0497; 99.0439;
(Qian et al., 2022)
101.0230; 119.0346; 151.0760; 169.0874; 213.0769; 375.1306
21
Hastatoside
C17H24O11
404.1319
+H
405.1391
4.46
−0.2
59.0188; 85.0421; 165.0540; 223.0856; 241.0899; 405.1391
(Liu et al., 2019)
22
Oenothein C
C34H24O22
784.0759
-H
783.0687
4.58
0.6
301.0004; 481.0650
(Díaz-de-Cerio et al., 2016)
23
Tellimagrandin I
C34H26O22
786.0916
-H
785.0843
4.59
−0.6
169.0145; 249.0405; 275.0186; 300.9971; 483.0742; 633.0722;
(Qian et al., 2022)
785.0846
24*
morroniside
C17H26O11
406.1475
+COOH
451.1446
4.85
2.0
59.0134; 89.0230; 101.0234; 113.0230; 119.0346; 119.0346;
(Qian et al., 2022)
179.0331; 451.1447
25
Verbenalin
C17H24O10
388.1370
+H
389.1442
4.86
7.8
195.0654; 227.0913
(Peng et al., 2022)
26
Geniposide
C17H24O10
388.1370
+COOH
433.1341
4.86
7.8
101.0239; 123.0452; 225.0772; 387.1243; 433.1353
(Shi et al., 2018)
27
Dehydrologanin
C17H24O10
388.1370
+H
389.1442
4.86
7.8
167.0728; 195.0526; 209.0930; 227.0913
(Qian et al., 2022)
28
Secologanin
C17H24O10
390.1162
-H
389.1089
4.94
0.2
121.0748; 139.0398; 141.0657; 149.0627; 181.0889; 183.0641;
(Qian et al., 2022)
195.0655; 209.0930; 227.0906
29
Monotropein
C16H22O11
390.1162
-H
389.1089
5.07
0.3
59.0136; 69.0347; 71.0239; 85.0295; 89.0244; 101.0240;
(Qian et al., 2022)
113.0244; 119.0336; 121.0310; 139.0753; 149.0471; 165.0560
179.0563; 183.0676; 209.0479; 345.0955; 389.1097
30
Secologanoside
C16H22O11
390.1162
-H
391.1235
5.13
1.0
59.0136; 69.0347; 71.0239; 85.0295; 89.0244; 101.0240;
(Qian et al., 2022)
113.0244; 119.0336; 121.0310; 139.0753; 149.0471; 165.0560;
179.0563; 183.0676; 209.0479; 345.0955; 389.1097
31
Isorugosin B
C41H30O27
954.0975
-H
953.0902
5.33
1.0
445.0415; 765.0936; 785.0900; 909.0815; 953.0922
(Dong et al., 2018)
32
Apigenin
C15H10O5
270.0528
-H
269.0441
6.21
2.8
117.0316; 225.0562; 269.0441
(Duan et al., 2021)
33
4-Methoxy cinnamic acid
C10H10O3
178.0630
+H
179.0703
6.29
3.0
77.0309; 103.0497; 109.0639; 179.0706
(Guan et al., 2019)
34
Hydratropic acid
C9H10O2
150.0681
+H
151.0754
6.29
−0.3
77.0418; 133.0808
35
Dihydrocornin
C17H26O10
390.1526
-H
389.1453
6.33
0.0
59.0102; 101.0353; 211.0202; 227.0908; 357.1165; 389.1523
(Qian et al., 2022)
36*
Loganin
C17H26O10
390.1526
+COOH
435.1497
6.39
0.4
101.0244; 227.0935; 435.1497
(Qian et al., 2022)
37
Kingiside
C17H24O11
404.1319
-H
405.1391
7
0.8
59.0141; 71.0137; 89.0243; 101.0256; 113.0250; 119.0368;
(Qian et al., 2022)
179.0570; 403.1251
38
Caffeic acid
C9H8O4
180.0423
-H
179.03498
7
2.1
135.0453; 179.0360
(Han et al., 2022)
39
Secoxyloganin
C17H24O11
404.1319
-H
403.1246
7
0.8
161.0426; 179.0539; 371.4022; 403.1221
(Qian et al., 2022)
40*
Sweroside
C16H22O9
358.1264
+H
359.1337
7.08
9.3
59.0107; 125.0216; 151.0729; 177.0543; 195.0637; 357.1136
(Qian et al., 2022)
41
Syringic acid
C9H10O5
198.0528
-H
197.0456
7.53
0.2
121.0286; 197.0481
(Schwarz et al., 2021)
42
p-Hydroxycinnamic acid
C9H8O3
164.0473
-H
163.0401
7.98
0.4
93.0337; 117.0313; 119.0498
(Qian et al., 2022)
43
Ellagic acid
C14H6O8
302.0063
-H
303.0135
11.24
9.6
245.0080; 300.9989
(Qian et al., 2022)
44
1,2,3,6-Tetra-O-galloyl-β-d-glucose
C34H28O22
788.1072
-H
787.1000
11.38
1.9
169.0138; 447.0536; 465.0685; 617.0757; 635.0898
(Yang et al., 2019)
45
1,2,4,6-Tetra-O-galloyl-β-d-glucose
C34H28O22
788.1072
-H
787.1000
11.38
1.9
169.0138; 447.0536; 465.0685; 617.0757; 635.0898
(Yang et al., 2019)
46
Javaniside
C26H30N2O9
514.1951
+H
515.2024
11.38
0.9
353.1463; 515.1698
(Díaz-de-Cerio et al., 2016)
47
Naringenin
C15H12O5
272.0685
+H
273.0758
11.44
7.6
153.0109
(Chen et al., 2014)
48
Hyperoside
C21H20O12
464.0955
+H
465.1028
11.49
7.2
303.0541; 465.1028
(Liu et al., 2019)
49
Quercetin-3-O-β-d-glucopyranoside
C21H20O12
464.0955
-H
463.0088
11.49
7.2
178.9986; 301.0351; 463.2195
(Qian et al., 2022)
50
Isoquercitrin
C21H20O12
464.0955
-H
465.1028
11.49
7.2
178.9986; 301.0351; 463.2195
(Qian et al., 2022)
51
Kaempferol
C15H10O6
286.0477
-H
285.0433
11.7
9.1
107.0187; 159.0688; 285.0433
(Qian et al., 2022)
52
7β-O-Methyl-morroniside
C18H28O11
420.1632
-H
419.1559
11.73
−3.9
59.0160; 181.0460; 211.0994; 373.1510
(Qian et al., 2022)
53
7α-O-Methyl-morroniside
C18H28O11
420.1632
-H
419.1559
11.73
−3.9
59.0160; 181.0460; 211.0994; 373.1510
(Qian et al., 2022)
54
Isolariciresinol
C20H24O6
360.1573
+H
361.1646
11.79
8.1
305.1745; 361.1646
(Qian et al., 2022)
55*
Cornuside
C24H30O14
542.1636
-H
541.1563
11.79
0.1
125.0248; 169.0153; 347.0785; 541.1583
(Qian et al., 2022)
56
(7S,8R)-urolignoside
C26H34O11
522.2101
-H
521.2028
11.81
−1.0
341.1361; 491.1905; 503.1917; 521.2517
57
Tetrandrine
C38H42N2O6
622.3043
+H
623.3116
11.97
8.4
623.3029
(Wang et al., 2020)
58
Quercetin
C15H10O7
302.0427
-H
301.0354
12.4
0.7
83.0141; 107.0133; 121.0276; 137.0253; 149.0290; 151.0036;
(Chen et al., 2014)
163.0018; 173.0232; 178.9990.193.0099; 273.0427; 301.0020
59
Arjunglucoside Ⅱ
C36H58O10
650.4030
-H
649.3957
12.64
−4.6
487.3625; 649.1252
(Qian et al., 2022)
60
6-Tetradecanesulfonic acid, butyl ester
C18H38O3S
334.2542
+H
335.2614
15.69
−8.2
183.1447; 335.2614
61
3,5-Di-tert-butyl-4-hydroxybenzaldehyde
C15H22O2
234.1620
-H
233.1547
16.66
0.4
160.8442; 233.1541
62
Linoleic acid
C18H32O2
280.2402
+H
281.2475
16.69
7.1
73.0464; 151.0296; 248.9926; 265.0238; 281.0518
(Qian et al., 2022)
63
Maslinic acid
C30H48O4
472.3553
-H
471.3480
16.81
−0.5
471.3470
(Qian et al., 2022)
64
Corosolic acid
C30H48O4
472.3553
-H
471.3480
16.81
−0.5
471.3470
(Qian et al., 2022)
65
Aristolone
C15H22O
218.1671
+H
219.1743
16.89
2.9
219.1844
66
9,12,15-Octadecatrienoic acid
C18H30O2
278.2246
+H
279.2319
17.08
2.4
121.0303; 149.0248; 279.0946
67
Diisobutyl phthalate
C18H30O2
278.2246
+H
279.2319
17.08
2.4
121.0303; 149.0248; 279.0946
68
Anethole
C10H12O
148.0888
+H
149.0961
17.34
0.5
65.0338; 91.0669
69
2-Hydroxysuccinic Acid Methyl Ester
C5H8O5
148.0372
+H
149.0445
17.4
9.2
133.0089; 149.0445
70
Benzothiazole
C7H5NS
135.0143
+H
136.0216
17.4
0.5
77.0416; 109.0086; 136.0249
71
Ursolic acid
C30H48O3
456.3604
-H
455.3531
17.67
−0.9
455.3542
(Qian et al., 2022)
72
Oleanolic acid
C30H48O3
456.3604
-H
455.3531
17.67
−0.9
455.3542
(Qian et al., 2022)
73
Betulic acid
C30H48O3
456.3604
-H
455.3531
17.67
−0.9
455.3542
(Qian et al., 2022)
74
Cistanoside H
C16H30O2
254.2246
-H
253.2173
17.76
1.6
59.0119; 253.2222
75
Palmitoleic acid
C16H30O2
254.2246
-H
253.2173
17.76
1.6
59.0119; 253.2222
76
Myristic acid
C14H28O2
228.2089
-H
227.2017
17.69
0.2
227.1971
77
Linolenyl alcohol
C18H32O
264.2453
+H
265.2526
17.88
1.6
69.0672; 135.1191; 196.9704; 265.2517
(Qian et al., 2022)
78
Z,Z-10,12-Hexadecadien-1-ol acetate
C18H32O2
280.2402
-H
279.2330
17.88
0.7
261.2262; 279.2089
79
Linolenic acid
C18H32O2
280.2402
-H
279.2330
17.88
0.7
261.2262; 279.2089
80
Oleamide
C18H35NO
281.2719
+H
282.2791
17.89
3.4
55.0551; 67.0557; 81.0733; 93.0753; 114.0951; 139.1083;
153.1296; 165.1598; 184.1730; 265.2685; 282.2807
81
2-Palmitoylglycerol
C19H38O4
330.2770
+H
331.2843
18.04
0.0
169.0811; 331.2843
82
Octadecanamide
C18H37NO
283.2875
+H
284.2948
18.62
9.9
57.0696; 69.0705; 74.0694; 88.0742; 267.9911; 284.2783
83
Methyl palmitate
C17H34O2
270.2559
-H
269.2486
18.9
0.6
269.2466
84
Stearic acid
C18H36O2
284.2715
-H
283.2643
19.42
1.1
283.2642
85
Erucamide
C22H43NO
337.3345
+H
338.3417
19.67
9.9
55.0541; 69.0699; 128.1066; 321.3164; 338.3448
Representative total ion chromatograms in positive and negative ion modes. S: crude FC; B: wine steamed FC; C: high-pressure wine steamed FC.
Fragmentation patterns of loganin and 5-HMF. a: loganin; b: 5-HMF.
The PCA score plots of the crude and differently processed FC in the positive and negative ion modes were presented in Fig. 4, from which an interesting finding could be cleared that there were differences in the composition of FC after processing due to the separation among groups, especially in the negative ion mode. To describe the difference between the crude and processed FC deeply, SIMCA software was used for analysis. All original data was imported into software for Par standardization to perform OPLS-DA, a supervised recognition pattern to screen variable markers. In the positive ion mode, R2X (cum) = 0.759, R2Y (cum) = 0.953, Q2 (cum) = 0.680, while in the negative ion mode, R2X (cum) = 0.8639, R2Y (cum) = 0.938, Q2 (cum) = 0.724, indicating that the model had a decent representativity, stability, and predictivity. OPLS-DA score plots intuitively expressed the dispersion degrees of different samples and revealed quite a gap among the wine steamed, high-pressure wine steamed, and crude materials. That is the reason why the wine steamed and high-pressure wine steamed samples were selected to compare different components with the crude one. Interestingly, the spots of group E (wine stir-fried samples) in PCA score plots didn’t present a favorable aggregation since not only the method of stir-frying was difficult to control the temperature and time in practical operation, but also the subjective judgment contributed to the products. Different processing methods related to processing time, temperature, and procedure contributed to the composition of products (Jia et al., 2017). Additionally; in the PCA score plots, we found that the points in the high-pressure wine steaming group and the wine steaming group were close together, indicating that these two methods had similar chemical compositions on secondary metabolites. The Chinese pharmacopoeia stated that FC should be wine steamed for clinical application, while high-pressure wine steamed FC usually applied in clinic to save the costs. From the results of PCA, it was found that the types and contents of secondary metabolites of FC obtained from both methods were similar. From this perspective, it could be assumed that both methods could be applied clinically. The chemical informations of the differential ions (P < 0.05) screened by the MarkerViewTM 1.2.1 software were compared to the components identified in PeakViewTM 1.2.1 software. t > 0 was considered as the content increase of the components after processing. 32 and 31 components were selected to compare wine steamed and high-pressure wine steamed FC with crude one, respectively. From Table 2 and Table 3, we could know that the main components including iridoid glycosides decreased while triterpenoid acids and 5-HMF increased after wine steaming and high-pressure wine steaming. It was speculated that the processing methods of wine as an adjuvant could increase the solubility of acids and on the other hand, the iridoid glycosides were converted and degraded under the high temperature for a long time.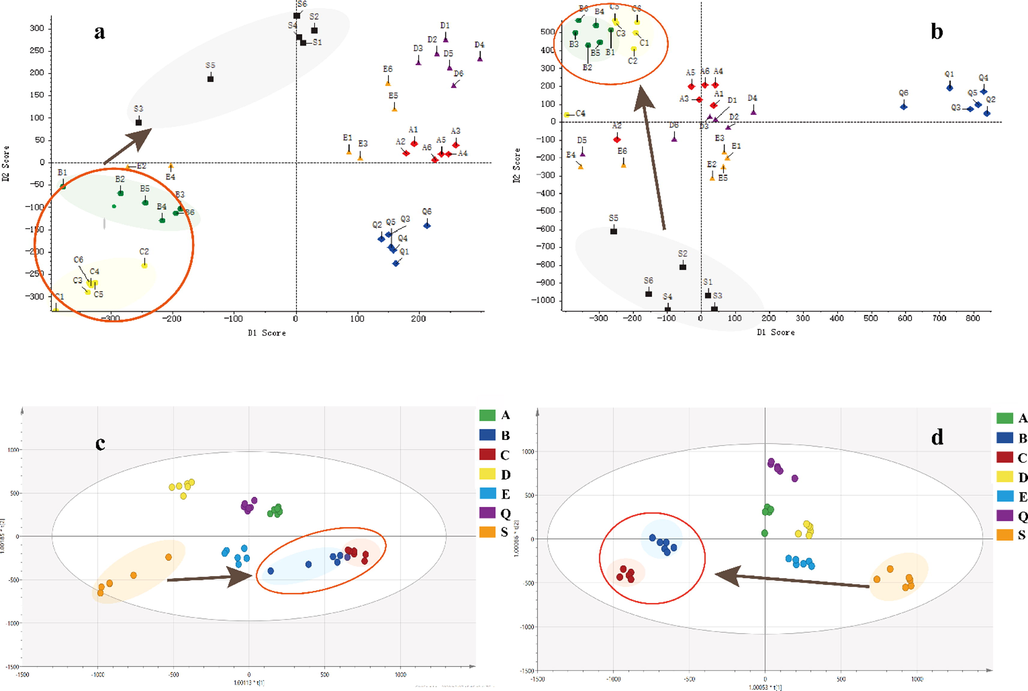
PCA and OPLS-DA score plots of crude and processed Fructus Corni (FC) in positive and negative ion modes. a: PCA (ESI+); b: PCA (ESI-); c: OPLS-DA (ESI+); d: OPLS-DA (ESI-). S: crude FC; Q: steamed FC; A: high-pressure steamed FC; B: wine steamed FC; C: high-pressure wine steamed FC; D: wine immersed FC; E: wine stir-fried FC.
No.
Components
Formula
Mass (Da)
tR/min
t-Value
P-value
Trend
1
Tartaric acid
C4H6O6
150.0164
0.91
−20.0659
0.0000
↓
2
5-Hydroxymethyl-2-furfural
C6H6O3
126.0317
1.84
3.4529
0.0260
↑
3
Gemin D
C27H22O18
634.0806
2.64
−3.1107
0.0359
↓
4
Isosorbide-2-acetate
C8H12O5
188.0685
3.07
8.2473
0.0012
↑
5
2,5-Dicarboxylate dimethylterahydrofuran
C8H12O5
188.0685
3.07
8.2473
0.0012
↑
6
2H-Pyran-2-one, 5,6-dihydro-4-methyl-
C6H8O2
112.0524
3.76
−2.8137
0.0481
↓
7
Hastatoside
C17H24O11
404.1319
4.46
15.6886
0.0001
↑
8
Oenothein C
C34H24O22
784.0759
4.58
4.2153
0.0135
↑
9
Cornin
C17H24O10
388.1370
4.86
−6.6685
0.0026
↓
10
Geniposide
C17H24O10
388.1370
4.86
−6.6685
0.0026
↓
11
Dehydrologanin
C17H24O10
388.1370
4.86
−6.6685
0.0026
↓
12
Caffeic acid
C9H8O4
180.0423
7.00
−90.8712
0.0000
↓
13
Ellagic acid
C14H6O8
302.0063
11.24
–22.5765
0.0000
↓
14
Javaniside
C26H30N2O9
514.1951
11.38
−51.7789
0.0000
↓
15
Naringenin
C15H12O5
272.0685
11.44
−6.8185
0.0024
↓
16
Hyperoside
C21H20O12
464.0955
11.49
−16.6051
0.0001
↓
17
Quercetin-3-O-β-d-glucopyranoside
C21H20O12
464.0955
11.49
−16.6051
0.0001
↓
18
Isoquercitrin
C21H20O12
464.0955
11.49
−16.6051
0.0001
↓
19
Kaempferol
C15H10O6
286.0477
11.7
−30.1153
0.0000
↓
20
Cornuside
C24H30O14
542.1636
11.79
−10.5068
0.0005
↓
21
Aristolone
C15H22O
218.1671
16.89
−3.1340
0.0351
↓
22
9,12,15-Octadecatrienoic acid
C18H30O2
278.2246
17.08
−6.1103
0.0036
↓
23
Diisobutyl phthalate
C18H30O2
278.2246
17.08
−6.1103
0.0036
↓
24
Benzothiazole
C7H5NS
135.0143
17.4
4.5923
0.0101
↑
25
Ursolic acid
C30H48O3
456.3604
17.67
88.1181
0.0000
↑
26
Oleanolic acid
C30H48O3
456.3604
17.67
88.1181
0.0000
↑
27
Betulic acid
C30H48O3
456.3604
17.67
88.1181
0.0000
↑
28
Linolenyl alcohol
C18H32O
264.2453
17.88
−9.1350
0.0008
↓
29
Oleamide
C18H35NO
281.2719
17.89
−9.8864
0.0006
↓
30
2-Palmitoylglycerol
C19H38O4
330.2770
18.04
−2.9987
0.0400
↓
31
Methyl palmitate
C17H34O2
270.2559
18.90
−5.0411
0.0073
↓
32
Erucamide
C22H43NO
337.3345
19.67
−3.5011
0.0249
↓
No.
Components
Formula
Mass (Da)
tR/min
t-value
P-value
Trend
1
5-Hydroxymethyl-2-furfural
C6H6O3
126.0317
1.84
12.1451
0.0003
↑
2
2H-Pyran-2-one, 5,6-dihydro-4-methyl-
C6H8O2
112.0524
3.76
−2.8454
0.0466
↓
3
Hastatoside
C17H24O11
404.1319
4.46
−19.8143
0.0000
↓
4
Cornin
C17H24O10
388.1370
4.86
−10.5548
0.0005
↓
5
Geniposide
C17H24O10
388.1370
4.86
−10.5548
0.0005
↓
6
Dehydrologanin
C17H24O10
388.1370
4.86
−10.5548
0.0005
↓
7
Caffeic acid
C9H8O4
180.0423
7
10.7623
0.0004
↑
8
Ellagic acid
C14H6O8
302.0063
11.24
−13.9539
0.0002
↓
9
Javaniside
C26H30N2O9
514.1951
11.38
−51.7789
0.0000
↓
10
Naringenin
C15H12O5
272.0685
11.44
−6.8185
0.0024
↓
11
Hyperoside
C21H20O12
464.0955
11.49
−19.9580
0.0000
↓
12
Quercetin-3-O-β-d-glucopyranoside
C21H20O12
464.0955
11.49
−19.9580
0.0000
↓
13
Isoquercitrin
C21H20O12
464.0955
11.49
−19.9580
0.0000
↓
14
Kaempferol
C15H10O6
286.0477
11.7
−30.1153
0.0000
↓
15
Cornuside
C24H30O14
542.1636
11.79
−11.8430
0.0003
↓
16
(7S,8R)-urolignoside
C26H34O11
522.2101
11.81
−3.9383
0.0170
↓
17
Quercetin
C15H10O7
302.0427
12.4
−3.9990
0.0161
↓
18
Aristolone
C15H22O
218.1671
16.89
−3.1340
0.0351
↓
19
9,12,15-Octadecatrienoic acid
C18H30O2
278.2246
17.08
−3.4068
0.0271
↓
20
Diisobutyl phthalate
C18H30O2
278.2246
17.08
−3.4068
0.0271
↓
21
Anethole
C10H12O
148.0888
17.34
3.2443
0.0315
↑
22
2-Hydroxysuccinic Acid Methyl Ester
C5H8O5
148.0372
17.4
3.2443
0.0315
↑
23
Ursolic acid
C30H48O3
456.3604
17.67
19.7452
0.0000
↑
24
Oleanolic acid
C30H48O3
456.3604
17.67
19.7452
0.0000
↑
25
Betulic acid
C30H48O3
456.3604
17.67
19.7452
0.0000
↑
26
Z,Z-10,12-Hexadecadien-1-ol acetate
C18H32O2
280.2402
17.88
−6.5976
0.0027
↓
27
Linoelaidic acid
C18H32O2
280.2402
17.88
−6.5976
0.0027
↓
28
2-Palmitoylglycerol
C19H38O4
330.2770
18.04
−2.9987
0.0400
↓
29
Octadecanamide
C18H37NO
283.2875
18.62
−3.9719
0.0165
↓
30
Methyl palmitate
C17H34O2
270.2559
18.9
−4.3153
0.0125
↓
31
Erucamide
C22H43NO
337.3345
19.67
−5.9477
0.0040
↓
3.2 Molecular weight distribution of polysaccharides in crude and processed FC
Broad pharmacological investigations conducted by the scientific community indicated that polysaccharides from Fructus Corni have a series of bioactivities involving immunomodulation, anticancer, antioxidation, anti-aging, etc (Dong et al., 2018). Oligosaccharides could be a neotype given immunomodulatory and anti-inflammatory function (Coleman and Ferreira, 2020), and raffinose as a natural oligosaccharide from the botany could be a promising alternative to inhibit bacterial biofilm formation (Kim et al., 2016; Kim et al., 2021). However, the significances of saccharides as mentioned above were ignored in a large number of investigations on effective components in FC.
Multiple chromatographies such as HPLC (C18)-PDA, HPLC (NH2)-ELSD, and HPGPC-ELSD were applied to depict the saccharides of FC generally. It is widely confirmed that the bioactivity of polysaccharides is relative to molecular weight distributions and monosaccharide compositions.
The method for determining the molecular weights was high-performance gel permeation chromatography (HPGPC), the typical chromatograms were shown in Fig. 5. Taking the retention time of dextran as the abscissa and the logarithm of molecular weight as the ordinate, the standard curve was in line with the equation: Y = -0.3564X + 9.957 (R2 = 0.9950). The properties were associated with molecular weights, which were the primary characterization of polysaccharides. The fluctuation of molecular weight distributions of FC polysaccharides indicated that processing had vital significance on the structure of polysaccharides. A novel parameter (D) to quantize the molecular weights of polysaccharides was introduced to evaluate the molecular weight distributions (Table 5). The equations were as follows:
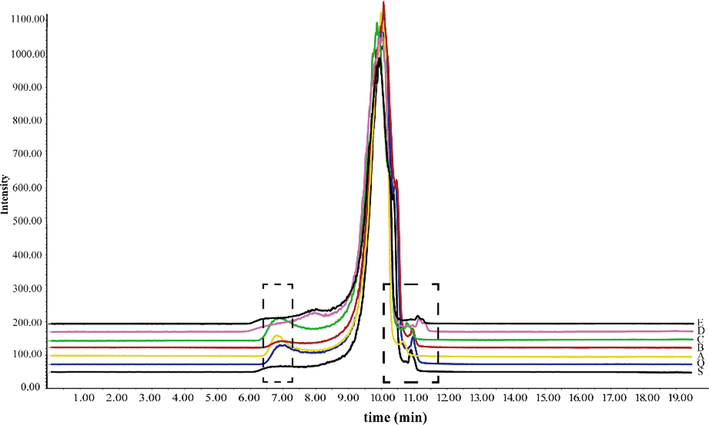
HPGPC chromatograms of polysaccharides from crude and processed FC. S: crude FC; Q: steamed FC; A: high-pressure steamed FC; B: wine steamed FC; C: high-pressure wine steamed FC; D: wine immersed FC; E: wine stir-fried FC.
in which RIi and Mi, meant the peak height and molecular weight for each polysaccharide peak in the FC samples, respectively. The parameter (D) showed that for the molecular weight compositions of polysaccharides, there were little differences among the high-pressure wine steamed, wine steamed, wine stir-fried, and crude products.
3.3 Monosaccharides and oligosaccharides in crude and processed FC
3.3.1 Method validation
The linearity, precision, stability, and recovery of the established method were systematically verified and presented in Table 4. The results of monosaccharides were acceptable for the precision between 0.52 %−2.93 %, the stability between 1.51 %−3.99 %, and the recovery between 96.49 %−103.00 %. The precision and stability of fructose and raffinose were 0.85 %, 1.48 % and 1.72 %, 1.69%, respectively. And the recovery was between 99.89 %−100.33 %. In conclusion, the established HPLC-PDA and HPLC-ELSD methods applied for analyzing monosaccharides and oligosaccharides of samples possessed satisfactory linearity, precision, stability, and accuracy.
Compound
Linearity
Precision
(RSD, n = 6)
Stability
(RSD)
Recovery
(RSD, n = 6)
Regression equation
Range /mg·mL−1
R2
HPLC-PDA
Man
Y = 3998761.7076X − 88666.8691
0.05–2.00
0.9994
1.09 %
2.63 %
96.49 % (3.41 %)
Rha
Y = 2565679.5142X − 33007.8797
0.05–2.00
0.9999
0.52 %
1.51 %
98.82 % (0.54 %)
Gala
Y = 3326823.2798X − 46453.201
0.05–2.00
0.9999
1.40 %
3.99 %
98.66 % (1.01 %)
Glc
Y = 133466.3792X − 24843.3445
0.05–2.00
0.9997
0.62 %
2.60 %
99.36 % (0.95 %)
Gal
Y = 3497773.0714X − 71917.0048
0.05–2.00
0.9997
1.21 %
2.90 %
98.27 % (1.24 %)
Ara
Y = 8442385.0144X − 163976.3055
0.05–2.00
0.9998
1.13 %
2.55 %
98.48 % (1.04 %)
Fuc
Y = 1618365.1741X − 41896.4387
0.05–2.00
0.9995
2.93 %
3.17 %
103.00 % (3.57 %)
HPLC-ELSD
Fru
Y = 10837527.0753X − 1990996.6271
0.25–2.50
0.9964
0.85 %
1.48 %
99.89 % (1.03 %)
Raf
Y = 10406720.3068X − 1769288.4135
0.25–2.50
0.9967
1.72 %
1.69 %
100.33 % (1.20 %)
Group
Crude
Steaming
High-pressure
steaming
Wine steaming
High-pressure wine steaming
Wine immersion
Wine stir-frying
Parameter (D)
1.0000
0.9876
1.0144
1.0023
1.0009
0.9856
1.0015
3.3.2 Total monosaccharides compositions of polysaccharides
The monosaccharide compositions of polysaccharides were performed by HPLC-PDA with the crude and high-pressure wine steamed samples as references (Fig. 6). What could be believed was that both crude and processed samples contain polysaccharides made up of Man, Rha, Gala, Gal, Ara, Fuc, and Glu. It was clearly showed that the total contents of monosaccharides constituting polysaccharides had significant differences (Table 7, Fig. 7a), particularly in the wine stir-fried samples. The compositions of hydrolyzed and derivatized monosaccharides from polysaccharides were identified that the content of Gala was the highest in each sample, except for the wine stir-fried product, reaching 0.620 ± 0.034 mg·g−1 and 0.643 ± 0.023 mg·g−1 in the crude and high-pressure wine steamed products. The contents of Man, Ara, Fuc, and Gal clearly decreased after processing, while the content of Rha increased to 0.212 ± 0.009 mg·g−1 after wine steaming, and the content of Glu increased to 0.460 ± 0.018 mg·g−1 under wine immersion. Overall, the results revealed that the total contents of monosaccharides constituting polysaccharides from the processed FC samples decreased compared to the crude one due to the degradation of polysaccharides into free monosaccharides and oligosaccharides or the structural transformation. An investigation on the different effects of polysaccharides between crude and processed Astragalus on colitis mice revealed that structure could be the basis of the effect (Wu et al., 2021). These results indicated comprehensively that structure might play an important role in pharmacodynamics of polysaccharides.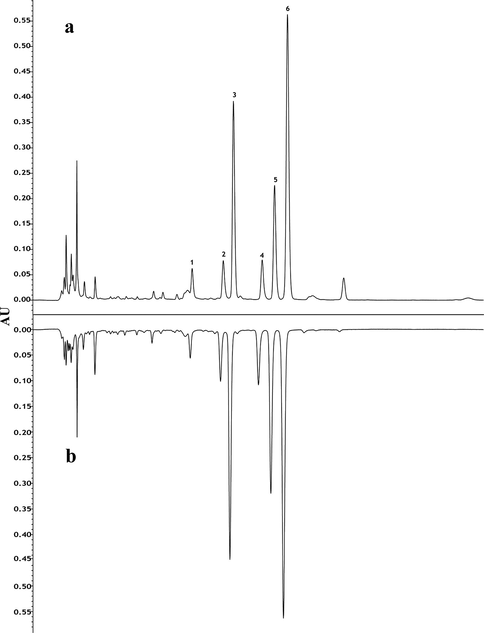
HPLC-PDA chromatograms of monosaccharide compositions of polysaccharides. a: crude FC; b: high-pressure wine steamed FC. 1: Man; 2: Rha; 3: Gala; 4: Glu; 5: Gal; 6: Ara; 7: Fuc.
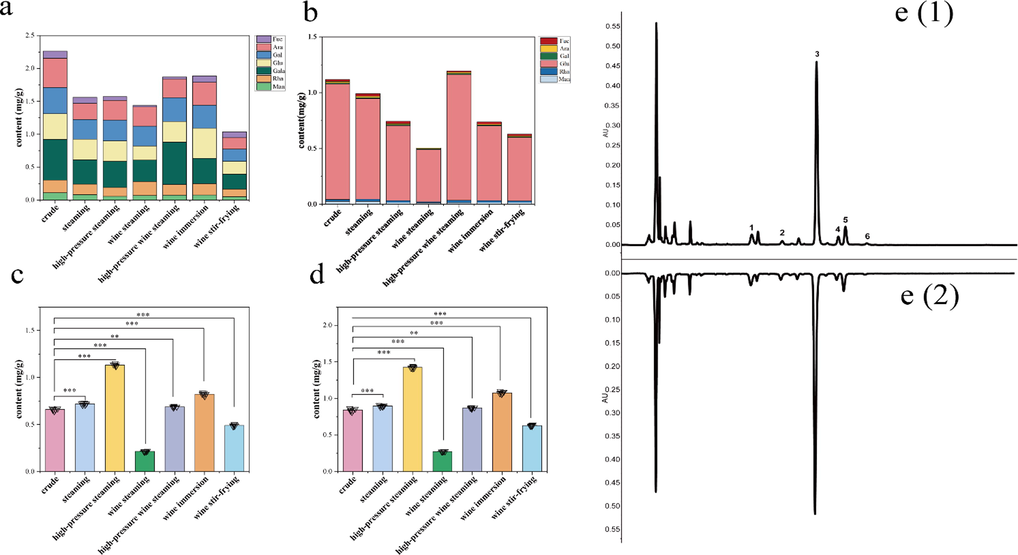
Contents of monosaccharides and oligosaccharides from crude and processed FC. a: monosaccharide compositions of polysaccharides; b: free monosaccharides; c: raffinose; d: fructose; e: chromatograms of free monosaccharides: (1) crude samples, and (2) high-pressure wine steamed samples. 1: Man; 2: Rha; 3: Glu; 4: Gal; 5: Ara; 6: Fuc. **P<0.01, ***P<0.001, compared to crude samples (n = 6).
Based on the characterization of the property and quantity of polysaccharides systematically, the total contents of monosaccharides were introduced and regarded as the contents of polysaccharides with a descriptive defined viable parameter (Vp = polysaccharides contents × D, Table 6) to evaluate the content changes of polysaccharides for carrying out the experiments of glycomics. The results showed that the high-pressure wine steamed and wine immersed samples differed less from the crude one. The small difference between the steamed and high-pressure steamed samples suggested that the treatments of both had less effects on the property of polysaccharides. For the wine stir-fried FC sample, the Vp was only 1.0372, less than half of the crude FC sample (2.2612), indicating a greater difference with the crude FC sample. The greater effect of wine stir-frying on polysaccharides might be related to the non-standard operation. *P < 0.05, **P < 0.01, compared to crude samples.
Group
Crude
Steaming
High-pressure
steaming
Wine steaming
High-pressure wine steaming
Wine immersion
Wine stir-frying
Vp
2.2612
1.5411
1.5947
1.4409
1.8727
1.8591
1.0372
Group Content / mg·g−1
Crude
Steaming
High-pressure steaming
Wine steaming
High-pressure wine steaming
Wine immersion
Wine stir-frying
Man
0.110 ± 0.002
0.080 ± 0.007**
0.056 ± 0.003**
0.068 ± 0.003**
0.074 ± 0.003**
0.078 ± 0.006**
0.052 ± 0.001**
Rha
0.193 ± 0.005
0.161 ± 0.009**
0.133 ± 0.002**
0.212 ± 0.009**
0.162 ± 0.003**
0.171 ± 0.008**
0.114 ± 0.005**
Gala
0.620 ± 0.034
0.370 ± 0.025*
0.399 ± 0.012**
0.328 ± 0.014**
0.643 ± 0.023
0.384 ± 0.019
0.229 ± 0.018**
Glu
0.388 ± 0.012
0.314 ± 0.017**
0.311 ± 0.006**
0.213 ± 0.005**
0.314 ± 0.010**
0.460 ± 0.018**
0.193 ± 0.012**
Gal
0.399 ± 0.015
0.298 ± 0.022**
0.317 ± 0.007**
0.301 ± 0.011**
0.362 ± 0.015**
0.351 ± 0.014**
0.186 ± 0.016**
Ara
0.443 ± 0.014
0.246 ± 0.013**
0.297 ± 0.006**
0.291 ± 0.009**
0.283 ± 0.010**
0.346 ± 0.013**
0.173 ± 0.012**
Fuc
0.109 ± 0.010
0.091 ± 0.011*
0.060 ± 0.010**
0.024 ± 0.002**
0.032 ± 0.002**
0.098 ± 0.011
0.089 ± 0.009**
3.3.3 Free monosaccharides
The free monosaccharide compositions of the crude and processed FC samples were performed by HPLC-PDA, and the representative chromatograms were shown in Fig. 7e. The free monosaccharides of the crude and processed samples were made up of Man, Glu, Gal, Rha, Ara, Fuc, and Fru, with a large proportion of Glu as depicted in Fig. 7b, which implied the trends of corresponding contents. In all samples, the content of Glu and Fru reached over 90 %. More interestingly, the total free monosaccharide contents of high-pressure wine steamed FC (1.19 mg·g−1) were essentially the same as those of crude one (1.12 mg·g−1), and while 0.50 mg·g−1 in wine steamed FC, a half decrease compared to those two groups. Fuc had not been detected in the wine steamed samples.
3.3.4 Oliosaccharides
HPLC (NH2)-ELSD was applied to determine the composition and content variation of oligosaccharides (identified as raffinose through reference substance) and fructose from the crude and processed FC samples. NH2 column was employed for qualitative and quantitative analysis in consideration of the retention time of fructose being close to that of glucose in the C18 column. The content variations of raffinose and fructose were shown in Fig. 7. The contents of raffinose and fructose in crude FC were 0.66 ± 0.012 mg·g-1 and 0.84 ± 0.019 mg·g-1. After wine steaming, the contents of the two saccharides (0.21 ± 0.004 mg·g-1, 0.27 ± 0.003 mg·g-1) were decreased significantly (P < 0.001), while for steaming, high-pressure steaming, and wine immersion, the content of raffinose increased markedly (P < 0.001, P < 0.001, P < 0.001). By contrast, the elements of high-pressure wine steaming were at the same level as the crude ingredients basically. The content variation of fructose was in an analogous way to raffinose.
3.4 Multivariate statistical analysis of glycomics
SIMCA 14.1 was employed to conduct principal component analysis (PCA), an unsupervised recognition pattern to analyze the contents of polysaccharides, raffinose, and free monosaccharides comprehensively (Fig. 8a-8b). The results indicated that the crude and processed products could be separated entirely, implicating deeply that processing exerted influence on the saccharides of FC. The primary components were separated from the samples and the values of R2X (cum) and Q2 (cum) were 1.000 and 0.986 respectively, implying that a decent PCA model was built. Remarkably, the crude and high-pressure wine steamed samples could be assorted as a category, while the wine steamed sample differed considerably from the crude one, which were in contrast to PCA score plots of secondary metabolites. In our preliminary stage of the experiments, it was found by orthogonal design experiments that the crude and processed products of FC had good effects on TGF-β1-induced fibrotic HK-2 and HSC-T6 cells, and high-pressure wine steamed FC were found to be the most promising agent according to the index scores (Han et al., 2022). Combining the results of the secondary metabolomics, glycomics, and preliminary experiments, high-pressure wine steaming might be an alternative to wine steaming in the clinical application. However, further animal experiments were needed for an in-depth comparative study of their efficacies.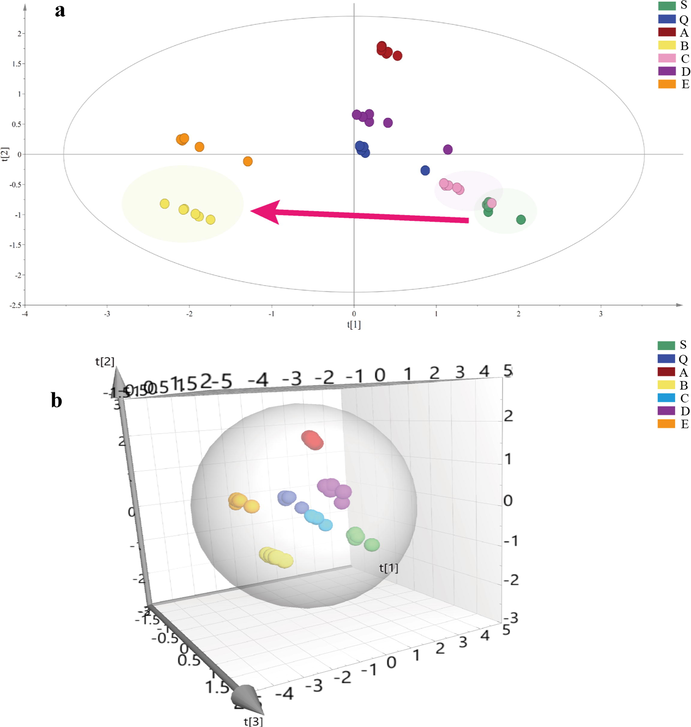
PCA score plots and transformation mechanism of saccharides. a: 2D PCA score plots of saccharides from crude and processed FC; b: 3D PCA score plots of saccharides from crude and processed FC. S: crude FC; Q: steamed FC; A: high-pressure steamed FC; B: wine steamed FC; C: high-pressure wine steamed FC; D: wine immersed FC; E: wine stir-fried FC.
3.5 Simulation processing assay
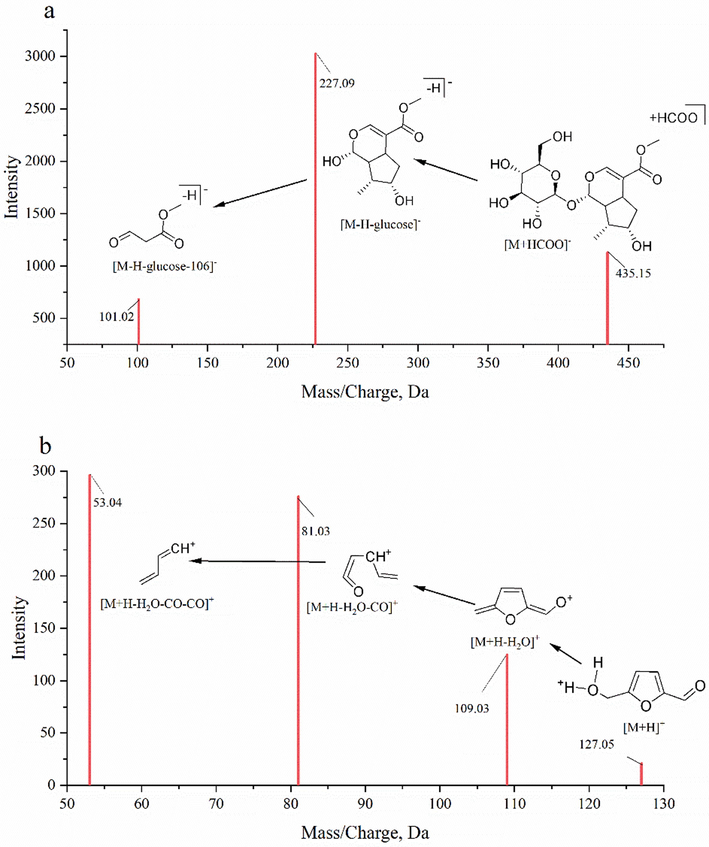
The fructofuranose group, a key part of raffinose, tends to degrade in acidic and heating situations. Nevertheless, there was no increase in the content of fructose in the free monosaccharides on account of transformation. 5-HMF, produced by dehydration of hexose under high temperature and acidic conditions, is the distinctive product of Maillard reaction (Fallico et al., 2008). FC is a medicinal herb and functional food rich in saccharides and organic acids, thus it is possible to generate 5-HMF when heating for medication use. Morroniside, the characteristic component of iridoid glycosides containing glucose, could be a simulation processing object. Given the above, a simulation processing assay was introduced to clarify the transformation mechanism of characteristic constituents of FC. 5-HMF could be detected in the processed products of polysaccharides, raffinose, glucose, morroniside, and fructose (Fig. S1). The results were consistent with the literature reported that 5-HMF is a by-products existing in saccharides (Wu et al., 2012). Polysaccharides, raffinose, and morroniside could produce 5-HMF through glycosylation of 5-HMF glycosides (5-GMF). The results of simulation processing assay indicated that the fructose from raffinose could be hydrolyzed into 5-HMF, which was the potential transformation mechanism of the decreased content of fructose in processed FC and explained by the increase in 5-HMF content after processing. In the processed products of morroniside (Fig. 9b), glucose, 5-HMF, and aglycone were detected based on the TOF MS and TOF MS/MS spectra, indicating that in the acidic and heating conditions, the loss of glucose in the morroniside was to transform into 5-HMF. That was the reason why the decrease of morroniside in the processed FC compared to crude one. Furtherly, the intensity of 5-HMF in all samples was determined to investigate the influence of processing conditons on FC (Fig. 9a). Interesting enough, the intensity of 5-HMF exhibited the different variations. The crude and wine-immersed FC had the lower level of 5-HMF in all samples, revealing that the heating was the essential condition on transformation into 5-HMF due to the fact that these two samples were not heated during the pretreatment process. As many investigations reported, 5-HMF is the cure for confronting fibrosis and oxidative injury of the liver (Han et al., 2017) as well as it is toxic to the nervous system and able to induce anaphylactoid reactions (Li et al., 2020; Wang et al., 2020). Briefly, there is no denying that 5-HMF is an underlying chemical marker of processed FC and an indicator to estimate the safety of processed herbs. Traditional Chinese medicine has its distinctive pattern of processing, and wine steaming is a commonly used method for FC under clinical regulations. Therefore, the paper further investigated the diverse processing methods with and without wine on how to affect the FC from the perspective of saccharide compositions. Finally, it is a necessity to standardize the processing methods that could influence the variation of these components.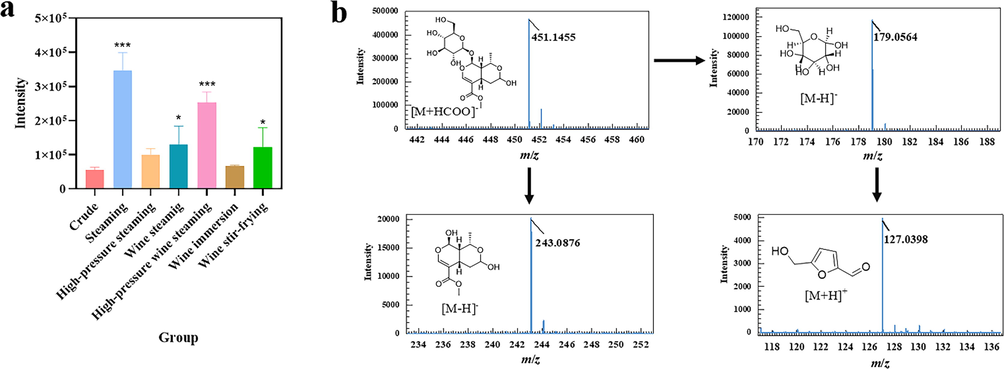
Intensity of 5-HMF in different samples and transformation mechanism in morroniside. a: intensity of 5-HMF in crude and different processed samples; b: mechanism on transformation of morroniside to 5-HMF. Compared to the crude FC, *P < 0.05,**P < 0.01, ***P < 0.001.
4 Conclusions
The paper starting from the holographic compounds of FC and applying chromatographic analyses combined with multivariate statistical methods is to drive an integral investigation of the multi-component variations from crude and processed FC. UHPLC-Q-TOF-MS/MS was performed to conduct a qualitative analysis of processed products from simulation processing for differential compounds to clarify the chemical transformation mechanism. The results demonstraed that secondary metabolites based on non-targeted metabolomics and saccharides based on targeted metabolomics had changed in properties and contents and emphasized the significance of characterizing secondary metabolites and saccharides for comprehensive chemical and biological comparison of crude and processed FC. Marker ingredients involving morroniside, polysaccharides, oligosaccharides, fructose, and glucose were selected for simulation processing, from which we could deduce that transformation of these phytochemicals to the furan aldehyde derivatives through the reactions of dehydration and deglycosylation was the potential mechanism of enhancing the effects by processing. Combining secondary metabolomics, glycomics, and previous research results, and taking into account time as well as labor costs, the high-pressure wine steamed products could replace the wine steamed ones. The investigation also suggests that saccharides should be studied as thoroughly as secondary metabolites and also supplies basic theoretical support for the further development of pharmacodynamics.
5 Funding sources
This work was supported by the National Natural Science Foundation of China (No. 82074022) and the Postgraduate Research & Practice Innovation Program of Jiangsu Province (KYCX20_1594, KYCX21_1790).
CRediT authorship contribution statement
Xin Liu: Data curation, Software, Writing – original draft, Investigation. Hao Cai: Conceptualization, Writing – review & editing, Supervision. Minjie Niu: Conceptualization, Investigation, Writing – review & editing, Visualization. Hui Yu: Visualization, Data curation, Validation. Mengqing Wang: Visualization, Data curation. Hui Zhu: Data curation, Methodology. Gang Cao: Formal analysis, Software. Ke Pei: Formal analysis, Software. Yu Duan: Formal analysis, Software. Jiantao Song: Investigation.
Declaration of Competing Interest
The authors declare that they have no known competing financial interests or personal relationships that could have appeared to influence the work reported in this paper.
References
- Total saponins isolated from corni fructus via ultrasonic microwave-assisted extraction attenuate diabetes in mice. Foods. 2021;10:670.
- [Google Scholar]
- Comparative study of crude and wine-processing corni fructus on chemical composition and antidiabetic effects. Evid. Based. Complement. Alternat. Med.. 2019;2019:3986964.
- [Google Scholar]
- Identification of known chemicals and their metabolites from Alpinia oxyphylla fruit extract in rat plasma using liquid chromatography/tandem mass spectrometry (LC-MS/MS) with selected reaction monitoring. J. Pharm. Biomed. Anal. 2014;97:166-177.
- [Google Scholar]
- Effects of processing adjuvants on traditional Chinese herbs. J. Food. Drug. Anal.. 2018;26:S96-S114.
- [Google Scholar]
- Oligosaccharides and complex carbohydrates: a new paradigm for cranberry bioactivity. Molecules. 2020;25:881.
- [Google Scholar]
- Determination of guava (Psidium guajava L.) leaf phenolic compounds using HPLC-DAD-QTOF-MS. J. Funct. Foods. 2016;22:376-388.
- [Google Scholar]
- Cornus mas L. (cornelian cherry), an important European and Asian traditional food and medicine: Ethnomedicine, phytochemistry and pharmacology for its commercial utilization in drug industry. J. Ethnopharmacol.. 2016;193:670-690.
- [Google Scholar]
- Corni Fructus: a review of chemical constituents and pharmacological activities. Chin. Med.. 2018;13:34.
- [Google Scholar]
- Corni Fructus: a review of chemical constituents and pharmacological activities. Chin. Med. 2018;13:34.
- [Google Scholar]
- Untargeted metabolite profiling of petal blight in field-grown Rhododendron agastum using GC-TOF-MS and UHPLC-QTOF-MS/MS. Phytochemistry. 2021;184:112655
- [Google Scholar]
- Strategy of integrated evaluation on treatment of traditional Chinese medicine as 'interaction of system to system' and establishment of novel fuzzy target contribution recognition with herb-pairs, a case study on Astragali Radix-Fructus Corni. Mol. Cell. Endocrinol.. 2016;434:219-237.
- [Google Scholar]
- Simultaneous determination of calycosin-7-O-β-D-glucoside, cinnamic acid, paeoniflorin and albiflorin in rat plasma by UHPLC-MS/MS and its application to a pharmacokinetic study of Huangqi Guizhi Wuwu Decoction. J. Pharm. Biomed. Anal. 2019;170:1-7.
- [Google Scholar]
- Optimizing processing technology of cornus officinalis: based on anti-fibrotic activity. Front. Nutr.. 2022;9:807071
- [Google Scholar]
- 5-HMF Attenuates Liver Fibrosis in CCl4-Plus-Alcohol-Induced Mice by Suppression of Oxidative Stress. J. Nutr. Sci. Vitaminol (Tokyo). 2017;63:35-43.
- [Google Scholar]
- Effect of processing on composition changes of selected spices. PLoS. One.. 2017;12:e0176037.
- [Google Scholar]
- Raffinose, a plant galactoside, inhibits Pseudomonas aeruginosa biofilm formation via binding to LecA and decreasing cellular cyclic diguanylate levels. Sci. Rep.. 2016;6:25318.
- [Google Scholar]
- Effect of broad-spectrum biofilm inhibitor raffinose, a plant galactoside, on the inhibition of co-culture biofilm on the microfiltration membrane. J. Hazard. Mater.. 2021;402:123501
- [Google Scholar]
- 5-HMF induces anaphylactoid reactions in vivo and in vitro. Toxicol. Rep.. 2020;7:1402-1411.
- [Google Scholar]
- Identification of absorbed components and their metabolites in rat plasma after oral administration of Shufeng Jiedu capsule using ultra-performance liquid chromatography/quadrupole time-of-flight mass spectrometry. Rapid. Commun. Mass. Spectrom. 2019;33:1494-1501.
- [Google Scholar]
- Beneficial Effect of 7-O-Galloyl-D-sedoheptulose, a Polyphenol Isolated From Corni Fructus, against Diabetes-Induced Alterations in Kidney and Adipose Tissue of Type 2 Diabetic db/db Mice. Evid. Based. Complement. Alternat. Med.. 2013;2013:736856
- [Google Scholar]
- Integrating transcriptome and chemical analyses to reveal the anti-Alzheimer's disease components in Verbena officinalis Linn. Front. Plant. Sci. 2022;13:955075
- [Google Scholar]
- Quality evaluation of raw and processed Corni Fructus by UHPLC-QTOF-MS and HPLC coupled with color determination. J. Pharm. Biomed. Anal.. 2022;218:114842
- [Google Scholar]
- HPLC-DAD-MS and antioxidant profile of fractions from amontillado sherry wine obtained using high-speed counter-current chromatography. Foods. 2021;10:131.
- [Google Scholar]
- Identification of 5-hydroxymethyl-2-furfural (5-HMF) in Cava sparkling wines by LC-DAD-MS/MS and NMR spectrometry. Food. Chem.. 2013;141:3373-3380.
- [Google Scholar]
- A sensitive LC-MS/MS method for simultaneous quantification of geniposide and its active metabolite genipin in rat plasma and its application to a pharmacokinetic study. Biomed. Chromatogr.. 2018;32:3.
- [Google Scholar]
- Iridoids: research advances in their phytochemistry, biological activities, and pharmacokinetics. Molecules. 2020;25:287.
- [Google Scholar]
- Potential neurotoxicity of 5-hydroxymethylfurfural and its oligomers: widespread substances in carbohydrate-containing foods. Food Funct.. 2020;11:4216-4223.
- [Google Scholar]
- Hydrothermal decomposition of glucose and fructose with inorganic and organic potassium salts. Bioresour. Technol.. 2012;119:48-54.
- [Google Scholar]
- Structural differences of polysaccharides from Astragalus before and after honey processing and their effects on colitis mice. Int. J. Biol. Macromol.. 2021;182:815-824.
- [Google Scholar]
- Using the UPLC-ESI-Q-TOF-MSE method and intestinal bacteria for metabolite identification in the nonpolysaccharide fraction from Bletilla striata. Biomed. Chromatogr.. 2019;33:e4637.
- [Google Scholar]
- Undescribed morroniside-like secoiridoid diglycosides with α-glucosidase inhibitory activity from Corni Fructus. Phytochemistry. 2020;171:112232
- [Google Scholar]
- Characterization of chemical component variations in different growth years and tissues of morindae officinalis radix by integrating metabolomics and glycomics. J. Agric. Food. Chem.. 2019;67:7304-7314.
- [Google Scholar]
- Biological activities and pharmaceutical applications of polysaccharide from natural resources: a review. Carbohydr. Polym.. 2018;183:91-101.
- [Google Scholar]
- The structures and biological functions of polysaccharides from traditional Chinese herbs. Prog. Mol. Biol. Transl. Sci.. 2019;163:423-444.
- [Google Scholar]
- Chemomics-based marker compounds mining and mimetic processing for exploring chemical mechanisms in traditional processing of herbal medicines, a continuous study on Rehmanniae Radix. J. Chromatogr. A.. 2017;1530:232-240.
- [Google Scholar]
- Comprehensive quality evaluation and comparison of Angelica sinensis radix and Angelica acutiloba radix by integrated metabolomics and glycomics. J. Food. Drug. Anal.. 2018;26:1122-1137.
- [Google Scholar]
Appendix A
Supplementary material
Supplementary data to this article can be found online at https://doi.org/10.1016/j.arabjc.2022.104525.
Appendix A
Supplementary material
The following are the Supplementary data to this article:Supplementary data 1
Supplementary data 1


