

Translate this page into:
An ultrasound-based technique for the analytical extraction of phenolic compounds in red algae
⁎Corresponding author. widiastuti.setyaningsih@ugm.ac.id (Widiastuti Setyaningsih)
-
Received: ,
Accepted: ,
This article was originally published by Elsevier and was migrated to Scientific Scholar after the change of Publisher.
Peer review under responsibility of King Saud University.
Abstract
Phenolic compounds are bioactive compounds that are also naturally found in red algae. To determine the level of these compounds in the red algae, spectroscopic or chromatographic determination was applied over the liquid extracts. Therefore, a prior extraction method is needed. The presented study aimed to develop the analytical ultrasound-assisted extraction (UAE) method to extract phenolic compounds from red algae. A Box–Behnken design (BBD) based on five factors included solvent composition (50–90% ethanol in water), extraction temperature (10–60 °C), ultrasonic power (20–100%), pulse duty-cycle (0.2–1.0 s−1), and solvent-to-sample ratio (10:1 to 30:1) was used to evaluate the effects of the studied factors. Subsequently, response surface methodology (RSM) was performed to define the optimum extraction condition to recover phenolic compounds from the alga matrices. The UAE condition suggested by RSM was: ultrasonic power 100%, pulse duty-cycle 1 s−1, temperature 52.5 °C, extraction solvent 50% ethanol in water, and solvent-to-sample ratio 30:1. Kinetic studies confirmed 10 min to provide comparable recovery (p > 0.05) than any longer extraction time. The acceptable values validated the developed method for repeatability (CV, 4.8%) and intermediate precision (CV, 5.7%). In addition, the accuracy of the method suggested a complete recovery for two extraction cycles. Furthermore, the method has successfully been applied for a number of samples covering three different red algae species. Fingerprints of each sample based on phenolic composition and levels characterize the type and origin of different red algae species.
Keywords
Rhodophyta
Optimization
Box-Behnken design
Response surface methodology
Method validation

1 Introduction
Indonesia has become one of the global leading macroalgae producers, with fresh macroalgae production reaching 11.6 million tons, mainly for the Kappaphycus sp. (KKP, 2019). Efforts to increase the utilization of red algae require further knowledge on some of the bioactive compounds, including phenolic compounds. The phenolic compounds contained by Kappaphycus alvarezii covers benzoic and cinnamic acid derivatives (Sumayya and Murugan, 2017). These compounds are beneficial to human health due to their vast array of functionality, viz., antioxidants and anti-inflammatory. Additionally, phenolic compounds also provide inhibitory effects on carcinogenesis and mutagenesis. Hence, to obtain the advantage of these compounds in red algae, an reliable analytical method to determine phenolic compounds is required. The fast method should also be convenient to be applied to a large number of samples per day.
Conventional extraction techniques include maceration and Soxhlet extraction, are time-consuming methods and they use large amounts of organic solvents that are not environmentally friendly. Also, this extraction involves high energy consumption, which results in additional costs (Porto et al., 2013). More advanced extraction techniques are currently available to overcome these concerns, such as microwave-assisted extraction, accelerated solvent extraction, and ultrasound-assisted extraction (UAE). Since the extraction can be performed at a moderate temperature with a lower investment of the extraction instrument, UAE is more attractive to recover phenolic compounds from red algae over the other aforementioned techniques. Additionally, UAE is reproducible because this technology allows automation settings at atmospheric pressure (Soria and Villamiel, 2010; Vieira et al., 2013). Nevertheless, some factors that are likely to influence the extraction results include extraction solvent, pulse duty-cycle, pH, temperature, liquid-to-solid ratio, and particle size of the material, these factors must be carefully fixed to reach reliable results (Tomšik et al., 2016). Hence, an assessment of the operating UAE factors is needed to optimize the extraction condition.
Before the optimization, the effect of the extraction factors can be evaluated utilizing the Box Behnken design (BBD). This experimental design is helpful to gather representative data with a fewer number of trials compared to the full factorial design. In addition, BBD is also compatible with response surface methodology (RSM) as it allows estimation of quadratic model parameters to predict the most appropriate settings for the studied factors resulting in the highest possible extraction recovery (Ferreira et al., 2007).
As previously reported, phenolic compounds have been employed to characterize olive oil from different origins (Becerra-Herrera et al., 2018) or varieties (Bajoub et al., 2017). In a similar approach, the relative values of specific phenolic compounds forming fingerprints can be proposed to characterize the studied red algae varieties (Deflaoui et al., 2021). In this paper, as part of the method validation, a real sample application was performed.
Therefore, this study aimed to optimize the UAE method utilizing BBD in conjunction with RSM to determine the phenolic compounds in red algae. Afterward, the optimized method was applied to characterize some red algae species from different cultivation sites.
2 Materials and methods
2.1 Chemical and reagents
Solvents for the chromatographic analyses, i.e., methanol, ethanol, ethyl acetate, and acetonitrile, were HPLC-grade obtained from Merck (Darmstadt, Germany). Water for the chromatographic analysis was purchased from PT Ikapharmindo Putramas (Jakarta, Indonesia). A standard compound of gallic acid monohydrate (HPLC grade, purity ≥ 99%) was purchased from Sigma-Aldrich (St. Louis, USA). Acetic acid, sodium carbonate, Folin-Ciocalteu's phenol reagent were obtained from Merck (Darmstadt, Germany).
2.2 Red algae samples
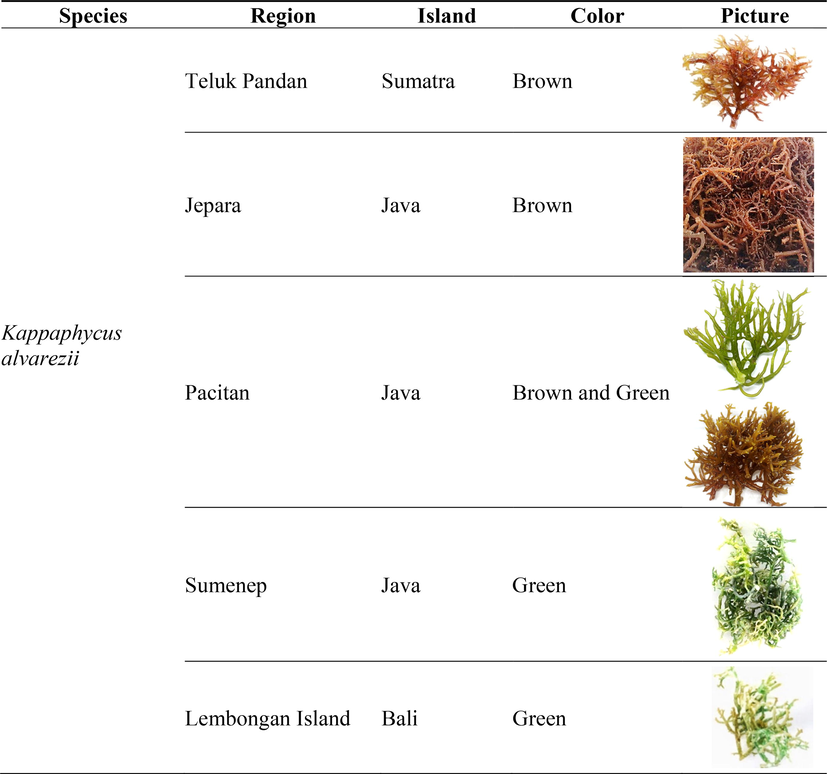
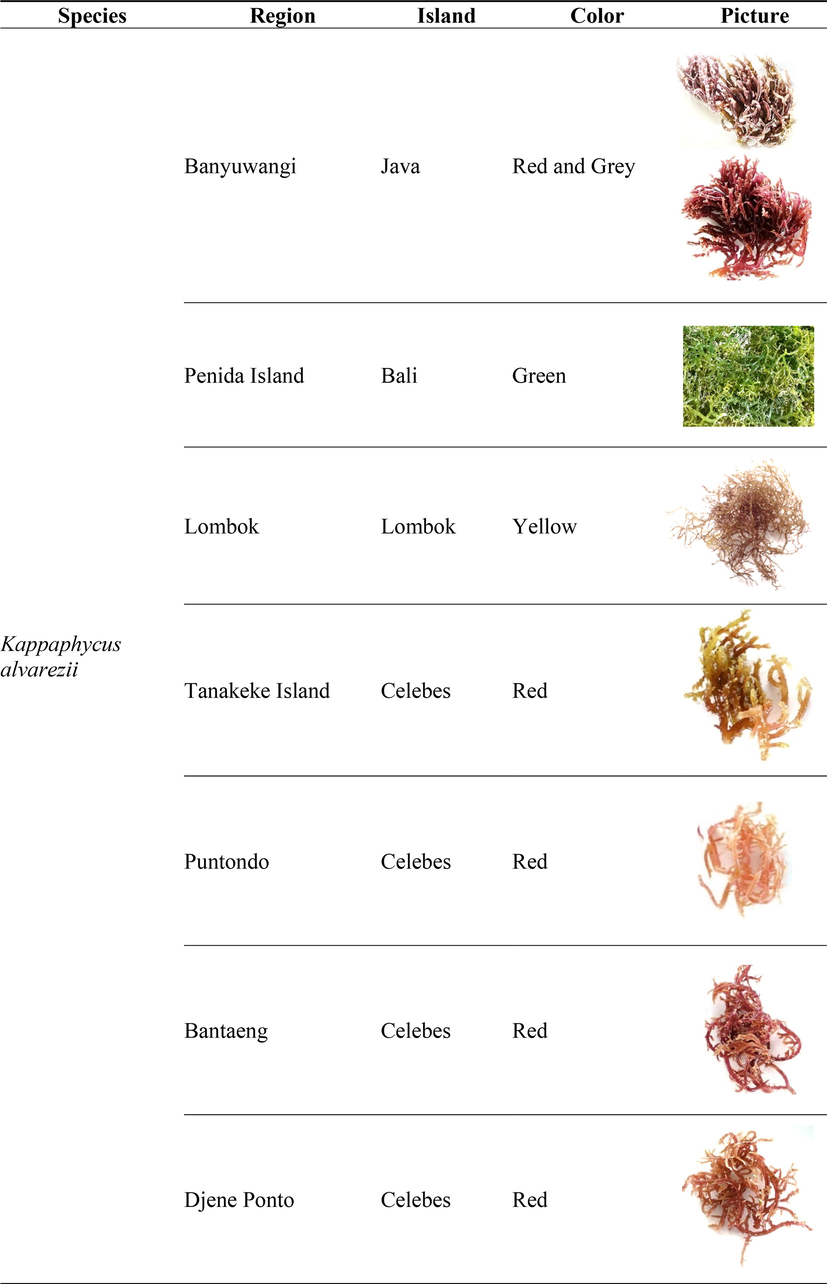
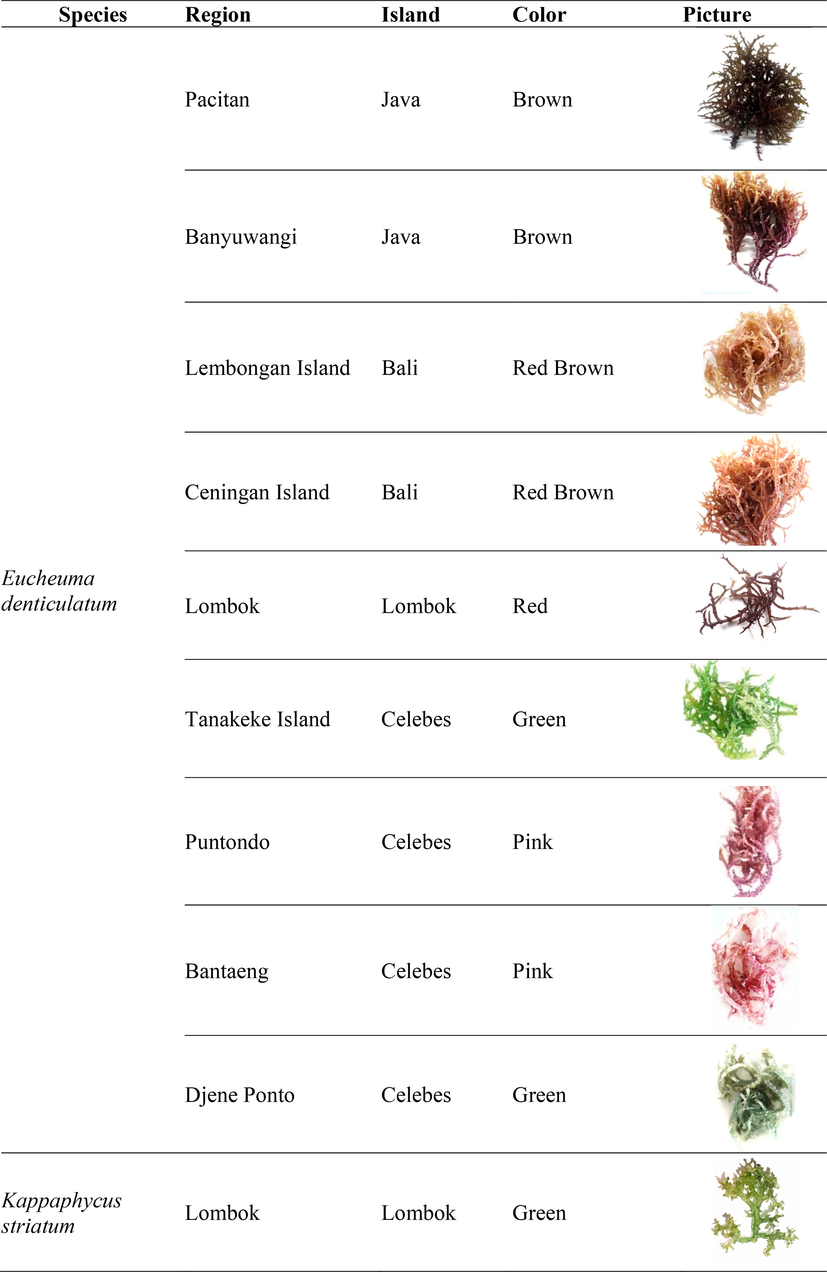
Red algae samples were obtained by direct sampling from the farmers. Kappaphycus alvarezii from Jepara (6°35′08.0″S 110°38′37.1″E), Central Java, Indonesia was used as samples for developing the extraction method. Additionally, 21 samples covering three different red alga species (Kappaphycus alvarezii, Kappaphycus denticulatum, and Kappaphycus striatum) were also collected for the method validation (Table 1). PT Jaringan Sumber Daya (JASUDA) provided samples originating from the province of South Sulawesi. At the same time, the Indonesian Institute of Science provides those from Lombok. The fresh red algae were dried using a freeze dryer and then ground to <100 mesh before the extraction process.
2.3 Ultrasound-assisted extraction (UAE)
UAE was performed using Ultrasound Probe 26 kHz and 200 W UP200St (Hielscher Ultrasonics GmbH, Teltow, Germany) with a diameter probe of 7 mm. The UAE temperature was controlled by Refrigerated Recirculation Bath Frigiterm-TFT-10 (J.P. Selecta S.A., Barcelona, Spain) to operate from 10 to 60 °C. Each extraction process was performed for a 1 g red algae sample. First, the solvent was added to the extraction vessel, and then the UAE conditions were adjusted according to the experimental design. After the extraction, the supernatant was separated from the solid material using a Sorvall ST-8R centrifuge (Thermo Fisher Scientific, Germany) at room temperature for 10 min operating at 4500 rpm. Subsequently, the extract was concentrated using a rotary evaporator (IKA-Werke GmbH & Co. Kg, Stauten, Germany). The extract volume was adjusted to 5 mL by the fresh solvent. The extract was then stored in the refrigerator at 4 °C until the analysis.
2.4 Determination of total phenolic content (TPC)
Total phenolic content (TPC) was measured with a spectrophotometer Genesys 10S UV–Vis (Thermo Fisher Scientific, Germany) using the method proposed by Damongilala et al. (2013) with some modifications. TPC was measured with a UV–Vis spectrophotometer at λ 750 nm and was interpreted as mg gallic acid equivalent kg−1 sample (mg GAE kg−1 sample). A 100 µL extract was accurately pipetted and placed in a reaction tube. Afterward, 1 mL of Folin Ciocalteau-water (1:2) was added then left for 5 min. Subsequently, 1 mL of 7% sodium carbonate was added, and the solution was homogenized then incubated at room temperature for 25 min without light. The calibration curve was prepared for gallic acid covering a concentration range of 10 to 100 mg L-1.
2.5 Identification and quantification of phenolic compounds
The ACQUITY UPLC H-Class system was used for UPLC analyses. The software used to manage the UPLC system was Empower 3 Chromatography Data (Waters Corporation, Milford, MA, U.S.A.). The detector used was an ACQUITY UPLC (PDA) photodiode array. The PDA was operated for a three-dimensional (3D) scanning mode collecting 40 points s−1 from 210 to 600 nm to identify the phenolic compounds. While for the quantification of phenolic compounds, two-dimensional (2D) PDA channels (260 and 330 nm) with a data collection rate of 80 points s−1 were utilized. The identification of phenolic compounds in red algae extracts was carried out by assessing the spectroscopic properties of the resulting peak in the chromatogram.
The column of a reversed-phase C18 (100 mm length; 2.1 mm I.D.; RP 18 CORTECS UPLC® silica-based solid-core particle; 1.6 μm particle size from Waters) at 47 °C was used for separating phenolic compounds in the 3.0 µL injected extract. The mobile phase system used was a binary solvent consisting of phase A (water with 0.01% acetic acid) and phase B (acetonitrile with 2% acetic acid). The flow rate was set at 0.6 mL min−1. The 4.0 min programmed gradient was as follows (%B): 0–3 min, 6.4–50%; 3–4 min, 50–100%. The column was washed with 100% B in 3 min and equilibrated with 6.4% B for 3 min to prepare for the next injection.
2.6 Experimental design and optimization
2.6.1 Solvent selection
A factorial completely randomized design was used to evaluate the solvent effect on the recovery of phenolic compounds. Four solvents, including ethanol, methanol, ethyl acetate, and water, were exposed under three different conditions in UAE. Each extraction condition varied the four UAE factors (Fig. 1). Extraction was carried out in triplicates for 1 g of ground sample in 20 mL of the studied solvents.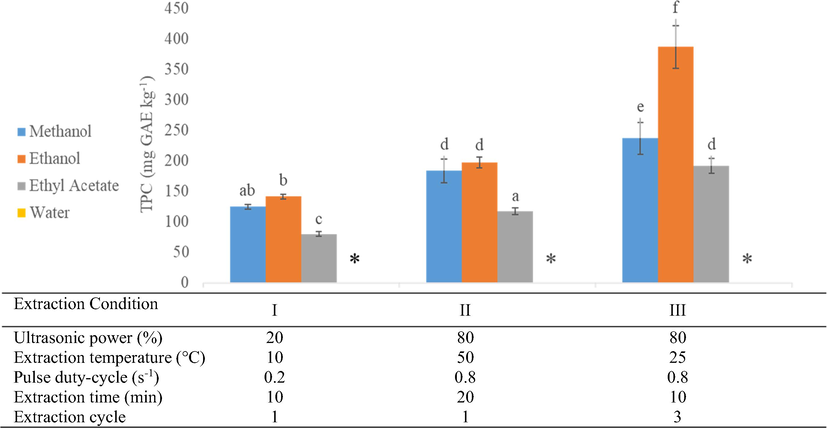
Solvent evaluation under three different extraction conditions. The bars followed by the same letters indicate the values as not significantly different (p < 0.05), while * indicates the values below the detection limit.
2.6.2 UAE optimization
A Box Behnken design (BBD) was used to evaluate the effects of the extraction variables on the recovery of phenolic compounds. Five independent factors, including temperature (x1), solvent concentration (x2), pulse duty-cycle (x3), ultrasound power (x4), and solvent-to-sample ratio (x5), each in 3 levels, were studied. The design domains of the levels of independent factors are listed in Table 2. The full BBD consisted of 46 extractions were performed in random order (Table 3). The dependent variable was the level of total phenolic content (TPC) expressed as mg gallic acid equivalents (GAE) per kg dried sample.
Factor
Coded Level
Unit
−1
0
1
Temperature (x1)
10
35
60
°C
Solvent composition (x2)
50
70
90
% ethanol in water
Pulse duty-cycle (x3)
0.2
0.6
1
s−1
Ultrasonic power (x4)
20
60
100
%
Solvent-to-sample ratio (x5)
10:1
20:1
30:1
mL of solvent/g of sample
DOE
UAE Factor
TPC (mg GAE kg−1 dried sample)
Temperature (x1)
Solvent composition (x2)
Pulse duty-cycle (x3)
Ultrasonic power (x4)
Solvent-to-sample ratio (x5)
Response (y)
Predicted (ý)
1
0
1
0
1
0
218.75
203.64
2
0
0
0
1
1
289.58
283.08
3
0
0
1
0
−1
206.04
230.56
4
0
0
0
−1
−1
152.08
176.31
5
0
−1
0
0
−1
337.50
327.15
6
0
0
−1
0
−1
164.58
150.04
7
0
−1
1
0
0
442.71
400.74
8
0
0
0
1
−1
144.58
174.26
9
0
0
0
0
0
244.79
223.63
10
0
1
−1
0
0
197.71
197.35
11
0
0
−1
0
1
230.21
216.69
12
0
−1
−1
0
0
314.17
320.21
DOE
UAE Factor
TPC (mg GAE kg−1 dried sample)
Temperature (x1)
Solvent composition (x2)
Pulse duty-cycle (x3)
Ultrasonic power (x4)
Solvent-to-sample ratio (x5)
Resoponse (y)
Predicted (y’)
13
0
0
−1
−1
0
191.25
184.43
14
0
0
−1
1
0
154.58
152.27
15
0
1
1
0
0
271.67
277.87
16
0
0
0
0
0
242.50
223.63
17
0
0
1
0
1
296.46
297.21
18
0
−1
0
1
0
375.63
404.53
19
0
1
0
0
1
255.00
270.93
20
0
0
0
0
0
232.92
223.63
21
0
0
0
0
0
240.83
223.63
22
0
−1
0
0
1
381.67
393.80
23
0
0
1
1
0
296.04
305.08
24
0
0
0
0
0
239.79
223.63
25
0
1
0
−1
0
295.00
241.54
26
0
0
1
−1
0
188.13
192.66
27
0
−1
0
−1
0
295.83
286.38
28
0
1
0
0
−1
187.92
204.29
29
0
0
0
−1
1
212.71
200.77
30
0
0
0
0
0
210.00
223.63
31
1
−1
0
0
0
384.17
391.83
32
1
0
0
0
−1
241.25
221.66
33
1
0
0
1
0
288.54
260.02
34
1
0
0
−1
0
202.08
219.89
35
1
1
0
0
0
244.58
268.96
36
1
0
1
0
0
289.79
295.24
37
1
0
−1
0
0
190.83
214.72
38
1
0
0
0
1
280.83
288.30
39
−1
0
0
0
−1
205.00
158.95
40
−1
1
0
0
0
200.21
206.26
41
−1
0
−1
0
0
118.13
152.01
42
−1
−1
0
0
0
322.08
329.12
43
−1
0
0
−1
0
122.08
157.19
44
−1
0
1
0
0
214.79
232.53
45
−1
0
0
1
0
212.50
197.32
46
−1
0
0
0
1
225.63
225.59
The resulting data from the TPC analyses of the extracts were evaluated to develop a mathematical model for the response to fit a second-order polynomial function:
x1, x2, … , xk are the UAE factors that influence the extraction efficiency; y; β0, βii (i = 1, 2,…, k), βij (i = 1, 2, …,k; j = 1, 2,…,k) are unknown parameters. The least-square method was used to estimate the β coefficients while only second-order interactions are considered.
2.6.3 Kinetics study
Kinetics were studied to evaluate the extraction rate as a basis to define the most efficient extraction time. A non-factorial randomized block design with five levels of extraction time (5, 10, 20, 30, and 40 min) was performed under the UAE condition suggested by the RSM result. The experiments were conducted in triplicates.
2.6.4 Method validation
The developed UAE method was validated as per ICH guidelines (ICH, 2005) for precision and accuracy. The precision was expressed as the coefficient of variation (%CV) in two levels, i.e., repeatability and intermediate precision. Repeatability (intra-day) was assessed by performing nine independent extractions within the same day (n = 9), while three independent extractions on three consecutive days (n = 3 × 3) determined the intermediate precision (inter-day). The accuracy of the proposed method was assessed by performing multi-cycle extraction to ensure the complete recovery of phenolic compounds from the sample. The extraction was repeated up to 7 cycles at the optimum UAE condition using fresh solvent for each extraction cycle.
2.7 Statistical analysis
To define the optimum UAE providing the highest recovery of total phenolic compounds, a maximum recovery function was estimated by response surface methodology of STATGRAPHICS Centurion XVI (Statpoint Technologies, Inc., USA). SPSS Statistic ver. 26 (IBM Corp., New York, USA) was utilized to analyze the experimental data generated from single-factor experiments. The analysis of variance (ANOVA, p = 0.05) was used to determine the effects of the studied variables. Provided that ANOVA suggests a significant difference, the Duncan test (p = 0.05) was used to check the differences among the means.
3 Results and discussion
3.1 Analysis of total phenolic compounds
Total phenolic compounds (TPC) were the responses used for the screening and optimization experiments. Therefore the spectrophotometer method for the TPC analyses was first validated based on ICH Guideline Q2 (R1) (ICH, 2005). A linear range was obtained for gallic acid concentrations of 10 to 100 mg L-1 with a coefficient of determination (R2) higher than 0.993. The limit of detection (LOD) and limit of quantification (LOQ) were estimated using the slope and standard deviation of the regression. The values of LOD and LOQ were 10.21 and 30.96 mg GAE L-1, respectively. Therefore, it demonstrates the adequate performance of the analyses for total phenolic compounds in the studied red algae.
3.2 Solvent selection
The solubility of the target analytes in the extraction solvent is crucial for accurate extraction, also the viscosity of the solvents, allowing them to penetrate into the solid sample. A vast range of polarities of phenolic compounds is a limiting factor in determining the most suitable extraction solvent for complete recovery (Do et al., 2014). Highly polar phenolic compounds such as gallic, protocatechuic, chlorogenic, and other phenolic acids derived from hydroxybenzoic and hydroxycinnamic acids have a higher solubility in polar solvents such as water and methanol (Setyaningsih et al., 2019). On the other hand, less polar phenolic compounds, including flavonoids, can be easier extracted using ethanol or ethyl acetate. Hence, different polarities solvents (water, methanol, ethanol, and ethyl acetate) were evaluated on the recovery of phenolic compounds (Fig. 1).
The results revealed that ethanol provides a better recovery than methanol and ethyl acetate. On the contrary, water was not suitable as an extraction solvent for the algae matrix with UAE system, it can be seen that a very low recovery was found (below the LOD), and it was observed that results could be related to the starch gelatinization. With the presence of water and heat, starch gelatinization occurred, thus leading to granule swelling. As a consequence, the sample commenced forming a semi-solid phase causing an inefficient extraction process. A similar phenomenon was previously reported when extracting phenolic compounds from rice matrices (Setyaningsih et al., 2016a).
Apart from the starch gelatinization, a lower recovery when performing the UAE can be also due to the degradation of the phenolic compounds (Setyaningsih et al., 2016b). A former study on the degradation of specific phenolic acid under ultrasonic treatment using various extraction solvents concluded that ethanol experienced a lower compound degradation than methanol and acetone (Zhang et al., 2015). The physicochemical properties of the extraction solvent under UAE generally affect the efficiency of the ultrasounds because they condition the intensity of the cavitation phenomenon.
Former research on another type of macroalga (Sargassum muticum) also revealed that the highest recovery of phenolic compounds was achieved employing ethanol as the extraction solvent over the other studied solvents (Sánchez-Camargo et al., 2016). Fig. 1 showed an improvement in the extraction recovery by multi-cycle extraction (condition III), which supports the evidence of ethanol as the most appropriate extraction solvent in this report. However, the effect of solvent compositions on the extraction recovery was omitted for the pure solvent evaluation. Meanwhile, a two-fold higher recovery was reported as an aqueous mixture of ethanol (50:50, ethanol in water) has been used over pure ethanol to extract the phenolic compounds from a golden alga, viz., Laminaria ochroleuca (Otero et al., 2019). Henceforth, the ethanol concentration in the aqueous extraction solvent was further optimized in this study.
3.3 Response optimization
A Box-Behnken design with 46 experimental runs covering the combination of five studied factors (temperature, x1; solvent composition, x2; pulse duty-cycle, x3; ultrasonic power, x4; and solvent-to-sample ratio, x5) was carried out. ANOVA was calculated to determine the statistical significance of the main, interaction and quadratic effects of the UAE factors. Each effect was assessed by the ratio of the mean square variation due to the regression and mean square residual error. The standardized effects (p = 0.05) in descending order of importance are plotted in a Pareto chart (Fig. 2). A bar crossing the vertical line denotes the significant effects of a single factor and a combination of the factors on the extracted total phenolic compounds.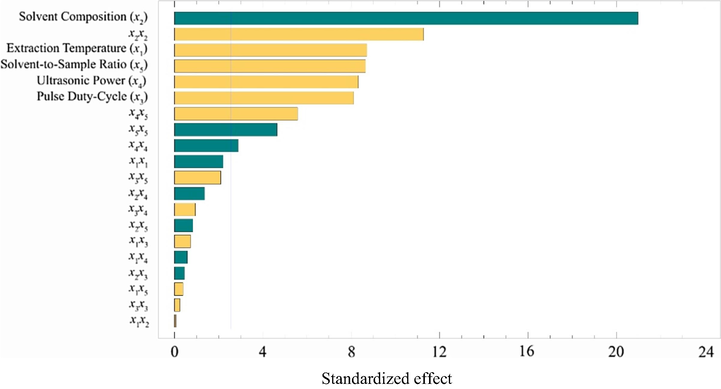
Pareto chart for the effect of UAE factors (x1, extraction temperature; x2, solvent composition; x3, pulse duty-cycle; x4, ultrasound power; x5, solvent-to-sample ratio). The vertical line crossing the bars notifies that the corresponding factor has a statistically significant 95% confidence level affecting the response.
 Indicates a positive effect and
 indicates a negative effect.
Based on the results shown in the standardized Pareto chart, significant effects and pathways for optimizing extraction were identified. In this study, the five factors used for optimization turned out to significantly affect extraction yield. The order of the extraction factors starting from the most influential was the solvent composition (x2), extraction temperature (x1), solvent-to-sample ratio (x5), ultrasonic power (x4), and pulse duty-cycle (x3). Because of the negative effect of solvent composition, a higher extraction recovery was achieved by applying a lower percentage of ethanol in water. A study on the extraction of a specific phenolic compound in brown algae of Eisenia bicyclis reported the use of 50% aqueous ethanol as the most appropriate extraction solvent (Kim et al., 2013).
In contrast, the pulse duty-cycle and ultrasonic power contributed a positive effect. Therefore, the higher the level of pulse duty-cycle and ultrasonic power, the higher the extraction recovery. It was suggested that the ultrasonic intensity as a combination of pulse duty-cycle and ultrasonic power influence the collapse pressures, then producing higher local temperatures that provide a favorable environment for the extraction (Zhang et al., 2015).
In this study, ANOVA confirmed the significant positive effect of the extraction temperature. When the high temperature was applied for an extraction system, the heat endorsed breaking the matrix bond, increasing the solvent diffusion rate and the mass transfer rate (Celli et al., 2015; Hossain et al., 2012).
As having a positive effect, increasing the solvent-to-sample ratio caused an increase in the extracted phenolic compounds. With respect to the mass transfer principle, a larger ratio between solvent and sample leads to a higher concentration gradient, then according to Fick’s first law, increasing the driving force in solvent extraction (Elboughdiri, 2018).
In addition to the main effect of individual factors, some interaction and quadratic effects were also found to be significant. An interaction between ultrasonic power and solvent-to-sample ratio (x4x5) was positively influenced the extracted total phenolic compounds. In contrast, solvent composition, ultrasonic power, and solvent-to-sample ratio provided adverse quadratic effects. These significant main, interaction and quadratic effects were subsequently retained in the model for the UAE optimization. The equation for the fitted model was:
y is the level of total phenolic content, and × is the UAE factors (x1, extraction temperature; x2, solvent composition; x3, pulse duty-cycle; x4, ultrasonic power; x5, solvent-to-sample ratio).
A lack-of-fit test was carried out to ascertain whether the selected model was satisfactory to describe the observed data or whether a more advanced model was required. The test was performed by comparing the variability of the current model residuals to the variability between observations at replicate settings for the factors. Since the p-value for the lack-of-fit (0.1551) obtained by ANOVA is >0.05, the model appears to be satisfactory for the observed data at the 95.0% confidence level. The R2 statistic confirmed that the fitted model explains 0.9219 of the variability in the extraction recovery. Furthermore, the standard error of the predicted value shows that the standard deviation of the residuals is 12.9487. Therefore, the model can be used to estimate the response for optimization.
The response surface methodology (RSM) estimated the optimum coordinates for the UAE factors (extraction temperature, x1, 0.701; solvent composition, x2, −0.935; pulse duty-cycle, x3, 1.000; ultrasonic power, x4, 1.000; solvent-to-sample ratio, x5, 0.989). Hence, the RSM suggested the setting of UAE conditions to recover phenolic compounds in K. alvarezii samples as follows: 52.5 °C extraction temperature, 1 s−1 pulse duty-cycle, 100% ultrasonic power, 50% ethanol in water, 30:1 solvent-to-sample ratio. Detailed extraction rate under the optimum condition of UAE factors was necessary to define the most efficient extraction time through a kinetic study.
3.4 Kinetics study
The extraction kinetics was studied by extracting the red algae samples under the optimum UAE condition over 40 min. As the extraction time increased, the level of total phenolic compounds also increased and reached a kinetic steady at10 min (Fig. 3). The statistical analysis confirmed that the total phenolic compound recovered for 10 min was not significantly different (p > 0.05) from the recoveries at longer extraction time. Therefore, 10 min was selected as extraction time, providing an efficient process.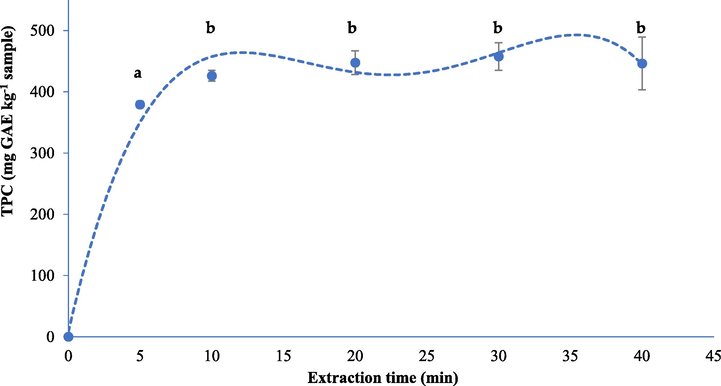
Amount of the extracted total phenolic compounds in different extraction times. The bars followed by the same letters indicate as not significantly different (p < 0.05).
3.5 Method validation
The UAE precisions were evaluated in two levels, viz., repeatability and intermediate precision. The precisions, expressed as % CV, of the developed UAE method were 4.8% for repeatability (n = 9) and 5.7% for intermediate precision (n = 3 × 3). The result evidences the high precision of the analytical extraction method.
The accuracy of the developed extraction method was measured by performing a multi-cycle extraction under the defined optimum UAE condition (Figure S1). After seven UAE cycles, the extracts were analyzed for the total phenolic compounds (TPC). The first two cycles provided reliable values for TPC, contributing to a complete recovery. Therefore, the final extraction procedure proposed by this study include the two-cycle extraction and was further validated to extract a number of real red algae sample.
3.6 Real sample application
To demonstrate the application of the validated UAE method, the level and composition of phenolic compounds in a number of red algae samples were measured. The red algae samples were collected from different growing sites of Indonesian islands, covering species of Kappaphycus alvarezii, Eucheuma denticulatum, and Kappaphycus striatum. The total phenolic compounds of the resulting extracts are shown in Table 4. N/A: The sample for the corresponding sample origin was not available.
Origin
Total Phenolic Compounds (mg GAE kg−1)
K. alvarezii
E. denticulatum
K. striatum
Teluk Pandan
845.28 ± 93.17
N/A
N/A
Jepara
555.00 ± 12.37
N/A
N/A
Pacitan
260.64 ± 8.36
720.42 ± 23.04
N/A
Sumenep
664.72 ± 51.36
N/A
N/A
Banyuwangi
309.17 ± 13.28
549.17 ± 64.47
N/A
Lembongan Island
203.06 ± 13.76
391.67 ± 9.31
N/A
Penida Island
227.78 ± 35.94
N/A
N/A
Ceningan Island
N/A
552.50 ± 19.17
N/A
Cultivation Lombok
423.06 ± 83.36
802.08 ± 21.93
940.21 ± 5.40
Wild Lombok
N/A
505.83 ± 91.61
N/A
Tanakeke Island
211.67 ± 3.50
305.83 ± 18.62
N/A
Puntondo
332.50 ± 7.73
466.25 ± 46.55
N/A
Bantaeng
273.33 ± 26.50
385. 42 ± 39.92
N/A
Djene Ponto
197.22 ± 9.81
380.00 ± 73.37
N/A
The highest concentration of total phenolic compounds among the studied red algae species was found in K. striatum (940.2 mg GAE kg−1). It must be noted that this species was only available from Cultivation Lombok and no other samples on K. striatum were analyzed in this study. The level was followed by the compounds determined in K. alvarezii from Teluk Pandan (845.3 mg GAE kg−1). K. alvarezii lowest concentration was found in the sample from Djene Ponto (197.22 mg GAE kg−1). The result was comparable with a former study which revealed the level of total phenolic compounds in K. striatum (903.8 mg GAE kg−1) that was higher than those in K. alvarezii (173.2 mg GAE kg−1). The reported values were obtained by an orbital shaker using aqueous ethanol at the ambient temperature for 72 h (Farah Diyana et al., 2015). Hence, the UAE extraction developed in this study provides significant improvement in analysis time without compromising the result accuracy.
Besides affecting the color lines and morphotypes, the differences in TPC levels within the same species were also reported due to environmental and anthropogenic factors (Tan et al., 2017). In addition to the concentration of TPC in question, the composition of phenolic compounds also resulted from physiological responses to growth factors. Some phenolic compounds belonging to the group of benzoic acid (HBA1, HBA2, and HBA3), cinnamic acid (HCA1 and HCA2), and flavonoid were identified in the studied red algae.
The level and composition of phenolic compounds in the algae samples were subsequently used as a fingerprint to distinguish the three groups of the red algae species, K. alvarezii, E. denticulatum, and K. striatum (Fig. 4). Before plotting in a disk chart, the data were normalized by relative value to the total level of phenolic compounds indicated by the corresponding peak height or area at PDA channels of 260 and 330 nm.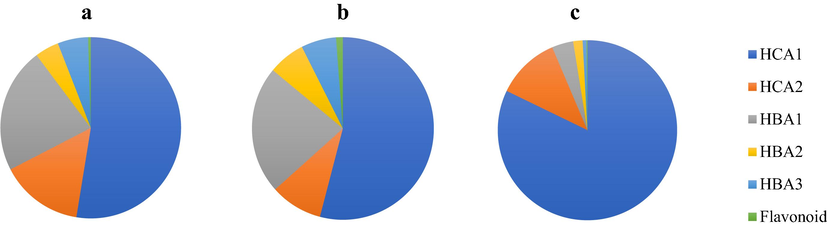
Fingerprinting based on the composition of phenolic compounds in (a) Kappaphycus alvarezii, (b) Eucheuma denticulatum, and (c) Kappaphycus striatum. Benzoic acid (HBA1, HBA2, and HBA3), cinnamic acid (HCA1 and HCA2), and flavonoid.
The fingerprint pattern of K. alvarezii samples showed HCA1, HCA2, and HBA1 as the main phenolic compounds. In contrast, HCA1 and HBA1, the main phenolic compounds in E. denticulatum samples. A sample of K. striatum was characterized by HCA1. Differences in fingerprint patterns among the red algae samples are due to the differences in the production of phenolic compounds concerning species as well as environmental conditions (Mannino and Micheli, 2020). Hence, the proposed fingerprinting was useful to classify the red algae based on the species.
4 Conclusions
In conjunction with response surface optimization, a Box-Behnken design was successfully applied to optimize the UAE conditions to extract accurately phenolic compounds from red algae. The optimum analytical UAE condition included the use of extraction solvent 50% ethanol in water, extraction time 10 min at a temperature 52.5 °C, with an ultrasonic power 100%, pulse duty-cycle 1 s - 1, a solvent-to-sample ratio 30:1, and two-cycle extraction. The method was validated by high accuracy and precisions. The validated extraction method was applied to extract phenolic compounds from red algae samples covering three different species. The highest level of total phenolic compounds was found in K. striatum, followed by E. denticulatum and K. alvarezii. The composition of the phenolic compounds included flavonoid and groups of benzoic and cinnamic acids that formed fingerprints to classify the red algae based on the species.
Author Contributions
Conceptualization, VGPP and WS; methodology, MP and WS; software, VGPP; validation, CH, MP, and WS; formal analysis, SM, VGPP, MP and WS; investigation, SM, VGPP, WC, and CC; resources, PR, DK, MP and WS; data curation, VGPP and WS; writing—original draft preparation, VGPP; writing—review and editing, WS, MP, PR, DK, and CH; visualization, PR and DK; supervision, WS and CH; project administration, WS; funding acquisition, WS. All authors have read and agreed to the published version of the manuscript.
Funding
The funds used in this research came from the Directorate General of Higher Education, Ministry of Education and Culture, Republic of Indonesia.
CRediT authorship contribution statement
Venansius G.P. Putra: Conceptualization, Software, Formal analysis, Investigation, Data curation, Writing – original draft. Selma Muthiarahma: Formal analysis, Investigation. Weni Chaniago: Investigation. Puji Rahmadi: Resources, Writing – review & editing. Dedy Kurnianto: Resources, Writing – review & editing. Chusnul Hidayat: Validation, Writing – review & editing, Supervision. Ceferino Carrera: Investigation. Miguel Palma: Methodology, Validation, Formal analysis, Resources, Writing – review & editing. Widiastuti Setyaningsih: Conceptualization, Methodology, Validation, Formal analysis, Resources, Data curation, Writing – review & editing, Supervision, Project administration, Funding acquisition.
Acknowledgments
This research forms part of the National Research Priority (PRN) project on the standardization of Indonesian algae (WBS6 WP6.1) funded by the BOPTN Research Grant 2987/E4/AK.04/2021 from the Directorate General of Higher Education, Ministry of Education and Culture, Republic of Indonesia. The APC was supported by a Productive Innovative Research (RISPRO)-Mandatory 2020 Grant No. 191/E1/PRN/2020 of the Endowment Fund For Education (LPDP), Ministry of Finance of Republic of Indonesia for a project of the database of Indonesian algae (WBS1).
References
- Assessing the varietal origin of extra-virgin olive oil using liquid chromatography fingerprints of phenolic compound, data fusion and chemometrics. Food Chem.. 2017;215:245-255.
- [CrossRef] [Google Scholar]
- Characterization and evaluation of phenolic profiles and color as potential discriminating features among Spanish extra virgin olive oils with protected designation of origin. Food Chem.. 2018;241:328-337.
- [CrossRef] [Google Scholar]
- Optimization of ultrasound-assisted extraction of anthocyanins from haskap berries (Lonicera caerulea L.) using Response Surface Methodology. Ultrason. Sonochem.. 2015;27:449-455.
- [CrossRef] [Google Scholar]
- Antioxidant Activity Against Methanol Extraction of Eucheuma cotonii and E. spinosum Collected From North Sulawesi Waters Indonesia. Food Sci. Qual. Manag.. 2013;17:7-14.
- [Google Scholar]
- Phenolic compounds in olive oil by solid phase extraction – Ultra performance liquid chromatography – Photodiode array detection for varietal characterization. Arab. J. Chem.. 2021;14:103102
- [CrossRef] [Google Scholar]
- Effect of extraction solvent on total phenol content, total flavonoid content, and antioxidant activity of Limnophila aromatica. J. Food Drug Anal.. 2014;22:296-302.
- [CrossRef] [Google Scholar]
- Effect of Time, Solvent-Solid Ratio, Ethanol Concentration and Temperature on Extraction Yield of Phenolic Compounds From Olive Leaves. Eng. Technol. Appl. Sci. Res. 2018
- [CrossRef] [Google Scholar]
- Antioxidant activity of red algae Kappaphycus alvarezii and Kappaphycus striatum. Int. Food Res. J.. 2015;22:1977-1984.
- [Google Scholar]
- Ferreira, S.L.C., Bruns, R.E., Ferreira, H.S., Matos, G.D., David, J.M., Brandão, G.C., da Silva, E.G.P., Portugal, L. a, dos Reis, P.S., Souza, a S., dos Santos, W.N.L., 2007. Box-Behnken design: an alternative for the optimization of analytical methods. Anal. Chim. Acta 597, 179–86.
- Optimization of ultrasound assisted extraction of antioxidant compounds from marjoram (Origanum majorana L.) using response surface methodology. Ultrason. Sonochem.. 2012;19:582-590.
- [CrossRef] [Google Scholar]
- ICH, 2005. ICH Topic Q2 (R1) Validation of Analytical Procedures: Text and Methodology. Geneva, Switzerland.
- Determination of major phlorotannins in Eisenia bicyclis using hydrophilic interaction chromatography: Seasonal variation and extraction characteristics. Food Chem.. 2013;138:2399-2406.
- [CrossRef] [Google Scholar]
- KKP, 2019. Rumput Laut Komoditas Penting yang Belum Dioptimalkan [WWW Document]. https://kkp.go.id/.
- Ecological function of phenolic compounds from mediterranean fucoid algae and seagrasses: An overview on the genus Cystoseira sensu lato and Posidonia oceanica (L.) Delile. J. Mar. Sci. Eng.. 2020;8:12-17.
- [CrossRef] [Google Scholar]
- Application of pressurized liquid extraction (PLE) to obtain bioactive fatty acids and phenols from Laminaria ochroleuca collected in Galicia (NW Spain) J. Pharm. Biomed. Anal.. 2019;164:86-92.
- [CrossRef] [Google Scholar]
- Ultrasonics Sonochemistry Comparison of ultrasound-assisted extraction with conventional extraction methods of oil and polyphenols from grape (Vitis vinifera L.) seeds. Ultrason. - Sonochemistry. 2013;20:1076-1080.
- [CrossRef] [Google Scholar]
- Considerations on the use of enzyme-assisted extraction in combination with pressurized liquids to recover bioactive compounds from algae. Food Chem.. 2016;192:67-74.
- [CrossRef] [Google Scholar]
- Optimisation of an ultrasound-assisted extraction method for the simultaneous determination of phenolics in rice grains. Food Chem.. 2019;288
- [CrossRef] [Google Scholar]
- Pressurized liquid extraction of phenolic compounds from rice (Oryza sativa) grains. Food Chem.. 2016;192:452-459.
- [CrossRef] [Google Scholar]
- Stability of 40 phenolic compounds during ultrasound-assisted extractions (UAE) In: in: AIP Conference Proceedings. 2016.
- [CrossRef] [Google Scholar]
- Effect of ultrasound on the technological properties and bioactivity of food: A review. Trends Food Sci. Technol.. 2010;21:323-331.
- [CrossRef] [Google Scholar]
- Phytochemical screening, RP-HPLC and FTIR analysis of Kappaphycus alvarezii (Doty) Doty EX P.C Silva: Macro red algae. J. Pharmacogn. Phytochem.. 2017;6:325-330.
- [Google Scholar]
- Tropical Seaweed Farming Trends, Problems and Opportunities. Trop. Seaweed Farming Trends, Probl.. 2017;Oppor:29-43.
- [CrossRef] [Google Scholar]
- Optimization of ultrasound-assisted extraction of bioactive compounds from wild garlic (Allium ursinum L.) Ultrason. Sonochem.. 2016;29:502-511.
- [CrossRef] [Google Scholar]
- Chemical and economic evaluation of natural antioxidant extracts obtained by ultrasound-assisted and agitated bed extraction from jussara pulp (Euterpe edulis) J. Food Eng.. 2013;119:196-204.
- [CrossRef] [Google Scholar]
- Changes of gallic acid mediated by ultrasound in a model extraction solution. Ultrason. Sonochem.. 2015;22:149-154.
- [CrossRef] [Google Scholar]
Appendix A
Supplementary material
Supplementary data to this article can be found online at https://doi.org/10.1016/j.arabjc.2021.103597.
Appendix A
Supplementary material
The following are the Supplementary data to this article:Supplementary data 1
Supplementary data 1


