

Translate this page into:
Antioxidant potential in the leaves of grape varieties (Vitis vinifera L.) grown in different soil compositions
⁎Corresponding author. smkhan@qau.edu.pk (Shujaul Mulk Khan)
-
Received: ,
Accepted: ,
This article was originally published by Elsevier and was migrated to Scientific Scholar after the change of Publisher.
Abstract
Grape plant (Vitis vinifera L.) is a species of the family Vitaceae. It is an economically important fruit plant abundantly grown all over the world. Vitaceae comprised of 900 species distributed across tropical, sub-tropical and partially temperate sorts of climatic zones. In the current study we aimed to evaluate the antioxidant activities of grape leaves extract from different Pakistani varieties.
We have analyzed the crude methanolic extract from the leaves of Pakistani grape varieties (i.e. NARC Black, Sundar Khani, Shogran-1, Shogran-2, Haita, Sheghali, Perlette, and Sultania-C) cultivated in various soil compositions. Total phenolic contents (TPC) of the extract were determind by using Folin-ciocalteu reagent method. Total flavonoid contents (TFC) were determind by the Aluminum Chloride Calorimetric method. Antioxidant activities of the extracts of different concentration were evaluated using Phosphomolybdenum method, Reducing power and DPPH (2, 2-disphenyl-1-picryl-hydrazyl) assays. Assays performed for grape varieties showed great antioxidant potential. All varieties significantly depicted with variation in polyphenolic contents and antioxidant potential with changes in the soil conditions. The highest TPC and TFC were quantified in Shogran-1 97.58 ± 0.09 (GAE, g−1) and Sultania-C 97.47 ± 0.12 (µg QE/g DE) varieties respectively which were grown in (T6) and (T5), while lower were recorded in Sundar khani 5.16 ± 0.23 in (T6). Likewise, Shogran-1 128.26 ± 0.23 (µg AAE/g extract) variety grown in (T6) depicted highest total antioxidant capacity, NARC black 182.06 ± 0.24 (µg AAE/g extract) variety grown in (T6) resulted in maximum reducing power while DPPH free radical scavenging potential were determinded in Sultania-C 80.91 ± 0.10 (T4) equivalent µg/g. In the terms of bioassays, the promising results were showed by compost + sand + clay (T4), compost + clay + dung (T5) and sand + clay + dung (T6). Therefore, we conclude that variation in soil composition has a significant contribution in the quantity of phytochemicals and antioxidants expression. Our study further suggest that use of organic fertilizer (Compost) and loamy sort of soil enhance functioning of most of the varieties in terms of important phytochemicals.
Keywords
Grape (Vitis vinifera L.) antioxidants
Phenolic contents
Flavonoid contents
Reducing power
DPPH
Grape varieties of Pakistan
Varying Soil Regimes

1 Introduction
Vitis vinifera L., (Grape) is an economically and medicinally important species of the family Vitaceae (Vivier and Pretorius, 2002). Vitaceae is comprised of 900 species distributed across tropical, sub-tropical and partially temperate sorts of climatic zones (Zafar et al., 2019). In Pakistan various grape varieties are cultivated for commercial purposes. Kishmish, Shogran-1, Shogran-2, NARC-Black, Flame Tokay, King Ruby, Perlette, Red Globe, Sultania-C, Thomson Seedless, Early White, Haita, Sundar Khani, Sheghali, Gola, Muscat and Hambourg are among the important table grape varieties grown here (Akram et al., 2020).
In Pakistan, Grapevines are grown over 15,360-hectare land with a production of 66,036 tons in 2014. Over 70% of the grapes are grown in the districts of Quetta, Kalat, Loralai, Pishin, Killa Saifullah, Chaghi, Zhob and Mastung in Balochistan province; district Bajaur, Chitral, Charsadda, Nowshera and Orakzai in the Khyber Pakhtunkhwa and the Potohar region of Punjab provience. (Akram et al., 2019). In Pakistan, it is ranked amongst the 10th top commercial fruits (Jaskani et al., 2008). In grape production, Balochistan is the leading province of Pakistan followed by Khyber Pakhtunkhwa, Punjab, and Sindh respectively. Overall grapes production, 87% of grapes are used as table grapes while the remaining 13% is used in kismish production (Aujla et al., 2011). The world's total grapes production during 2018–19 was 22.15 million metric tons (Sirohi et al., 2020). Italy, France and Spain are the top leading countries in grape production throughout the globe with 27 million tons (Scoma et al., 2016).
The climate has a significant role in in the distribution of grapevines diversity. Soil, variables (Carey et al., 2008a) also play significant role in the production as well as quality of grapes. They shaps the physical characteristics of grapes such as color, fragrance, size and maturity. These environmental factors also change the biochemical composition such as Total Soluble Solids (TSS), Sugars, acids and anthocyanins etc in various parts of grape (Carey et al., 2008b). Similarly, rainfall pattern directly influence vine growth, vigor and hence affect the accumulation components i.e. acids, sugars and phenolic in grape berries (González-Fernández et al., 2012). In short, abiotic and biotic factors have a significant effect on the nutritional composition of grapes (Ahmad et al., 2004).
Numbers of in vitro and in vivo studies proposed plant phenolic compounds as functional ingredients to reduce oxidative stress (Lin et al., 2016). Flavonoids are more powerful than ascorbic acid among the four main phenolic subgroups as free radicals with capacity to reduce oxidative stress (Nahak et al., 2014). Therefore, an exploration of phenolic compounds from low toxic natural products is required at a broad scale, that offer medicinal benefits in the form of antioxidants.
In recent decades researchers have been made an important progress in the biological activities of different grape-derived ingredients apart from the chemistry of grape compounds. Nowadays, it is a topic of extensive discussion that other parts of the grapes are major sources of many phytochemicals in addition to being consumed as a fruit alone (Tadapaneni, 2010). Grape seed oil contains large amounts of phenols, tocopherols, sterols and various other biologically active constituents (Duba and Fiori, 2015). They have an important contribution to various biological processes and used for their antioxidant properties at broad scale (Rombaut et al., 2015).
Grapevines have tremendous nutraceutical potential and hence considered an important source of phenolic compounds (Babbar et al., 2015). Phenolics have a significant role in the field of medicine, health and nutrition due to their anticarcinogenic, antimutagenic, antiatherogenic, antiallergic, antiulcer, antimicrobial, antiarthritic, anti-inflammatory and very importantly their antioxidant activities (Doshi et al., 2006). The flavonoids which naturally occur in grapevine berries and seeds belong to the group of flavanols and anthocyanins (Adams, 2006).
The antioxidant activity assessment methods focused on the inactivity process which are divided into reaction-driven methods for electron transfer (ET) and hydrogen atom transfer (HAT). The process and efficacy of antioxidants are two major factors deciding the bond dissociation energy and the ionization potential (Karadag et al., 2009). The methods based on HAT are used to calculate the ability of a non-scavenging antioxidant to form stable compounds through donation of hydrogen. SET-based methods calculate an antioxidant's ability to transmit one compound, including metals, free radicals and carbonyls to oxidize (Karadag et al., 2009). Moreover, few methods like DPPH and ABTS {2,2’–azi nobis-(3-ethyl-benzothiazoline-6-sulphonic acid)} are involved both in the HAT and SET mechanisms (Prior et al., 2005).
Literature shows that there is no comprehensive study available on the evalutation of biochemical assays on the leaves of Pakistani grape varieties (Abdullah et al., 2021). Therefore, we hypothesized that the Pakistani grape varieties may have a tremendous phytochemical and antioxidant potential and it may vary with variation in the soil composition. Keeping in mind this hypothesis we have evaluated the antioxidant activities of grape leaves extract from different Pakistani varieties grown in various soil compositions. The extracts were evaluated for total phenolic compounds, flavonoids, antioxidants capacity, total reducing power and DPPH free radical assays. The study also evaluate better performance in relation to different sorts of soil.
2 Materials and methods
2.1 Experimental layout/design
Cutting of different varieties of Vitis vinifera (Grape) i.e., NARC Black, Sundar Khani, Shogran-1, Shogran-2, Haita, Sheghali, Perlette, and Sultania-C were collected from different areas of Pakistan. A total of 240 cuttings were grown in six different types of soil compositions i.e., Compost (T1), Compost + Sand (T2) 1:1, Compost + Clay (T3) 1:1, Compost + Sand + Clay (T4) 1:1:1, Compost + Clay + Dung (T5) 1:1:1, Sand + Clay + Dung (T6) 1:1:1. The experimental work on leaves were started after 2 months of cultivation. The ratio of Compost, Sand, Clay, Dung were equaly added in respective treatment as described (Table 1).
Full name
Abrrevations
Denoted by
Ratio
Compost
C
T1
1
Compost + Sand
CS
T2
1:1
Compost + Clay
CC
T3
1:1
Compost + Sand + Clay
CSC
T4
1:1:1
Compost + Clay + Dung
CCD
T5
1:1:1
Sand + Clay + Dung
SCD
T6
1:1:1
2.2 Sample preparation
Leaves were collected in replicates before one week of the experiment. Leaves were air dried and crushed into fine powder via mortar and pestle. 20 mg of dried powder was taken in Eppendorf tube and extracted in 1ml of methanol. For extraction process, the Eppendorf were sonicated at 25 MHz for 15 min in ultrasonic sonicator. Samples centrifugations were carried out at 13000 rpm for 5 minutes. The pellets were removed while the supernatants were collected in Eppendorf for further analyses (Clarke et al., 2013).
2.2.1 Evaluation of total phenolic contents (TPC)
TPC was assessed by using folin-reagent according to the standard protocol devsied by Clarke et al., 2013. A 20µl of leaf extract was added to the microplate well and 90µl of folin–ciocalteu reagent was added to the plant sample and incubated for 5 min. After 5 minutes, 90µl Na2CO3 of 6% was added to wells. The negative control of experiment was taken 20 µl of DMSO and positive control was taken 25, 12.5, 6.25, 3.125 µg/ml final concentration of Gallic acid (GAE, g-1 DE) respectively. After the complete process samples were read out on 630 nm wavelength using Microplate Reader (Bio Tek 800 TS). Calculations were made is gallic acid equivalent per gram of dry extract.
2.2.2 Determination of total flavonoid contents (TFC)
TFC were determined via Aluminum Chloride Calorimetric techniques (Fatima et al., 2015) using 4 mg/ml quercetin in DMSO as standard. Briefly, 20µl extract was added in 96 well plates and then 10µl of 10% of Aluminium chloride and 1 M Potassium acetate (CH3CO2K) solutions were added. Solution was finally diluted with 160µl of distilled water. Samples were incubated for 30 minutes before taking absorbance at a wavelength of 405 nm over a Microplate Reader (Bio Tek 800 TS). Quercetin and DMSO were used as standards. Results in microgram equivalent per gram of extract (µg QE/ g extract).
2.2.3 Total antioxidants capacity
TAC was evaluated through the Phospho-molybdenum method as described by Banerjee and Narendhirakannan, 2011. A 100 μl plant sample was added to the eppendrof tube, followed by a 900 μl TAC reagent and incubated at 95 °C for 90 min in the water bath. Samples were cooled down at room temperature and 200μl of the reaction mixture was moved to 96 well plates and calculated at 630 nm on the microplate reader. DMSO as negative control was used. Antioxidant potential was measured in µg ascorbic acid equivalent/g extract (µg/g) positive control was 50μl of 1mg/ml of Ascorbic acid stock solution.
2.2.4 Total reducing power (TRP)
TRP for each extract was determined via a standard protocol described by Mannan et al., 2012) Plant sample of 200μl was mixed with 100μl of 0.2M phosphate buffer (pH 6.6) in the Eppendorf tube, followed by 250μl of 1% Potassium Ferricyanide and then incubated for 20 minutes at 50 °C. 10% of Trichloroacetic acid solution with an amount of 200μl was put up into the mixture and then centrifuged for 10min at 3000 rpm. In the last step 50μl, Ferric Chloride with a concentration of 0.1% was taken into 96 well plates and properly mixed with 150μl supernatants. The readings were taken at a 630 nm wavelength using a microplate reader. 100μl of 1mg/ml of Ascorbic acid stock solution was taken as a positive control.
2.2.5 DPPH free radical scavenging activity
DPPH was determined by using the protocol devised by Clarke et al., 2013. Plant sample with an amount of 10µl was taken in respective wells of 96 microplates and then followed via 190µl of DPPH reagents to the sample of plant extract to make 200µl final volume and incubated at 37 °C for 1 h. Ascorbic acid (50, 16.66, 5.55, 1.83μg /ml) was used as a positive control and 10μl of the respective solvent as a negative control. Sample absorbance was examined at 517nm wavelength using microplate reader equipment. The calculation of the scavenging activity was done via the following equation.
Note: (As is the absorbance of sample and Ac is the absorbance of control).
2.3 Statistical analysis
The data are presented as percentage mean ± SD (Standard deviation). Coefficient of correlation was calculated for intra-group variations by using R studio. The significant variation between different groups was calculated through Analysis of Variance (ANOVA) with (p<0.05) considered as a statistical significance.
3 Results and discussion
3.1 Antioxidant activities
The current study revealed that grape leaves are the best sources of phenolics and flavonoids alongside its fruits but there are also variations in their concentration among different varieties cultivated in different types of soilregime. A higher quantity of TPC was recorded in different varieties i.e. Shogran-1, NARC black and Shogran-2 respectively (97.58 ± 0.09; 97.38 ± 0.06 and 95.32 ± 0.07) respectively in T6 soil type while lower was recorded in Sundar Khani (29.28 ± 1.06) GAE, g−1 in T6. Leaves of V. amurensis having a rich amount of overall polyphenols and flavan-3-ols, as well as a significant quantity of flavanols, and flavanonols. V. amurensis leaves are also widely used in traditional Chinese medicine (TCM) and Korean herbal pharmacopeia (KHP) (Chen et al., 2018) since ancient times. Similar results to our findings documented by González-Centeno et al., 2012, that the grape stem examined as a good source of total phenolic contents. The current study elaborated that the soil which has low water holding capacity results in lower phenolic contents in the plants leaves (Table 2; Fig. 1). Król et al., 2015 reported that stress conditions (cold, water and temperature) decreases the phenolic contents in stress-sensitive grape varieties. Many studies revealed that abiotic stresses decrease the formation of phenolic contents in plant tissues, e.g. soyabean seedlings (Swigonska et al., 2014). The current results extricate that phenolic contents depend on soil conditions. A similar report has also been obtained by (Yang et al., 2009) investigating that both agronomic, genomic and climatic drivers play an important role in the concentration of phenolic contents and nutritional properties. According to Kedrina-Okutan et al., 2018, twenty phenolics compounds were described in two species of Asian origin, 27 in American and hybrids and 18 in the wild species of V. sylvestris. They have also elaborated that the identified compounds belong to the groups of phenolic acid, flavanols, flavan-3-ols, flavanonols, flavones and proanthocyanidins. In the current era, there is dual concepts about the role and uses of Vitis species polyphenolics compositions which is very important scientific interest, to describe the health benefits of grape leaves that may be useful in the pharmaceutical, nutraceutical as well as to know about their involvement in grapevines defence mechanisms (Kedrina-Okutan et al., 2019). Note: NARC Black (NB), Sundar Khani (SK), Shogran-1 (S1), Shogran-2 (S2), Haita (Ht), Sheghali (ShG), Perlette (Pt) and Sultania-C (SC).
VR
C(T1)
CS(T2)
CC(T3)
CSC(T4)
CCD(T5)
SCD(T6)
NB
SK
S1
S2
Ht
ShG
Pt
SC58.48 ± 0.09
57.11 ± 0.04
55.14 ± 0.04
55.58 ± 0.03
54.70 ± 0.02
54.23 ± 0.04
0.00
57.66 ± 0.0256.12 ± 0.03
55.71 ± 0.02
55.90 ± 0.03
54.67 ± 0.02
55.51 ± 0.04
52.74 ± 0.01
54.06 ± 0.01
56.24 ± 0.0163.90 ± 0.31
65.88 ± 0.27
63.35 ± 0.29
74.54 ± 0.37
73.26 ± 0.30
73.54 ± 0.31
72.86 ± 0.23
77.46 ± 0.3588.40 ± 0.12
93.73 ± 0.13
86.20 ± 0.09
85.30 ± 0.09
91.08 ± 0.12
90.00 ± 0.06
88.60 ± 0.07
83.52 ± 0.0179.50 ± 0.40
76.89 ± 0.40
77.90 ± 0.34
78.03 ± 0.32
83.74 ± 0.48
82.36 ± 0.46
81.01 ± 0.48
81.72 ± 0.4697.38 ± 0.06
29.28 ± 1.06
97.58 ± 0.09
95.32 ± 0.07
92.61 ± 0.07
82.11 ± 0.41
78.97 ± 0.47
78.25 ± 0.69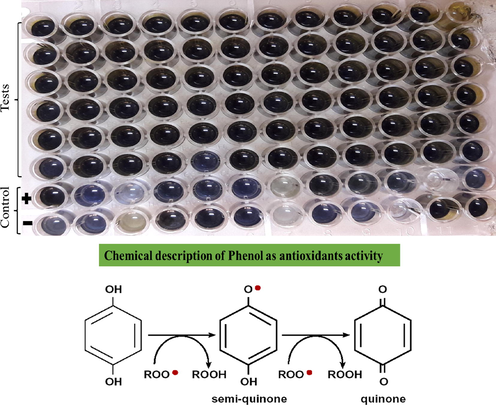
The blue colour show the presence of phenolics contents (Tadapaneni, 2010).
The metabolic compositions play crucial roles in the qualities of various grape products (Georgiev et al., 2014). Flavonoids represent a widespread and common group of natural polyphenols produced by the phenylpropanoid pathway (Ananga et al., 2013, Vogt, 2010). As many studies cover that it also protects from UV rediations, determine coloration of flowers, attract the pollinators as well as tissue protector in case of any external pathogenic attacks (Harborne and Williams, 2000). Primarily, flavonoids of grapes are available in the skin of grape berries and seeds (Waterhouse, 2002, Bogs et al., 2007, Dixon, 2005, Lepiniec et al., 2006). Flavonoids are the major contributors of biological activities and are considered as centre groups of soluble phenolics in grapes (Conde et al., 2007).
Present study revealed that grapes in terms of TFC have higher contents in the leaves of the variety Sultania-C (97.47 ± 0.12) had highest concentration of TFC in T5 while lower was reported for Sundar Khani (5.16 ± 0.23) µg QE/g DE in T1 (Table 3; Fig. 2). Our results are in coherence with the previous literature where the grape leaf sample was rich in the amount of total flavonoid. Among the flavonoid, flavanol contents were in the highest concentration and the flavan-3-ols contents were the least (Doshi et al., 2006). However, it is critically examined and well documented that the flavonoids show various antioxidants potential and well described its role in human health and nutrition (Haq et al., 2012). The bioavailability of flavonoids in plants is present along with sugar molecules (Glycosides), although they rarely occur in the form of aglycones (Ross and Kasum, 2002). Additionally, some of the flavonoids i.e., pro-anthocyanidins and Flavan-3-ols, are not absorbed completely and reach the plant circulatory system owing to their glycoside conjugates (Donovan et al., 2006). Flavonoids safeguard against the overproduction of reactive oxygen species (ROS) that accumulate as a oxidative stress to upsets the balance of oxidants and antioxidants (Ku et al., 2020). Oxidative stress lead towards the destruction of biomolecules i.e., proteins, nucleic acid and lipids in the cells, and mainly related to diabetes hepatocellular damage, atherosclerosis and cancers (Lin and Beal, 2006, Petros et al., 2005, Kattoor et al., 2017).
VR
C(T1)
CS(T2)
CC(T3)
CSC(T4)
CCD(T5)
SCD(T6)
NB
SK
S1
S2
Ht
ShG
Pt
SC81.52 ± 0.30
5.16 ± 0.23
78.14 ± 0.27
83.63 ± 0.04
17.86 ± 0.05
94.00 ± 0.21
0.000.00
95.58 ± 0.2797.14 ± 0.20
79.17 ± 0.36
87.87 ± 0.40
87.39 ± 0.34
88.18 ± 0.46
85.30 ± 0.43
80.51 ± 0.28
78.34 ± 0.3385.28 ± 0.17
84.42 ± 0.28
76.53 ± 0.15
96.09 ± 0.13
91.41 ± 0.08
96.68 ± 0.10
74.97 ± 0.26
94.19 ± 0.0692.35 ± 0.08
87.54 ± 0.13
93.76 ± 0.09
88.72 ± 0.16
90.51 ± 0.10
87.10 ± 0.06
88.55 ± 0.09
85.25 ± 0.0393.29 ± 0.05
93.91 ± 0.16
92.37 ± 0.13
85.87 ± 0.01
79.45 ± 0.33
88.66 ± 0.05
94.39 ± 0.13
97.47 ± 0.1277.50 ± 0.31
30.33 ± 0.93
94.88 ± 0.07
92.68 ± 0.19
91.23 ± 0.14
89.17 ± 0.45
72.58 ± 0.73
57.44 ± 0.80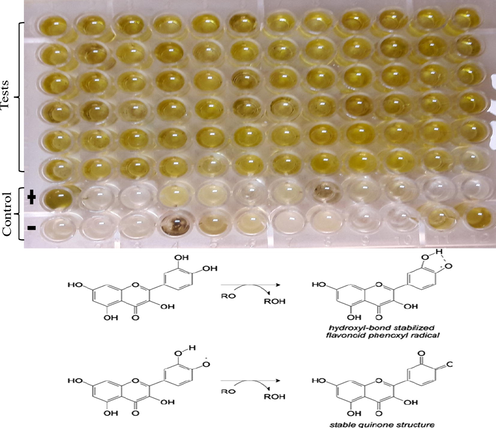
The yellow colour indicate that flavaonoids are present in the extract (Katz et al., 2011).
Antioxidants are the ingredients that have the ability, even in fewer quantities, to block or overcome the oxidative destruction (Balík et al., 2009). The inhibition of autooxidation and analyses of chemical principles of antioxidant activity assays are dependent upon the reactions involved. These essays are grouped into two types (i) based on the transfer of atomic hydrogen (HAT) reactions, and (ii) electron transfer (ET) (Huang et al., 2005). Currently, this study also shed a light on Total Antioxidants Capacity (TAC). Our results revealed that grape varieties having higher phenolic, flavonoids and antioxidants capacity. Comparatively, TAC was highest in Shogran-1 (128.26 ± 0.23) grown in T6 soil type while lower was recorded in Sundar Khani (37.23 ± 0.72) µg AAE/g extract cultiavated in T6 (Table 4; Fig. 3). Our findings are in similarity with those of who documented that leaves of grape varieties shown higher phenolic contents with higher antioxidants potential.
VR
C(T1)
CS(T2)
CC(T3)
CSC(T4)
CCD(T5)
SCD(T6)
NB
SK
S1
S2
Ht
ShG
Pt
SC88.43 ± 0.11
99.28 ± 0.21
91.24 ± 0.02
73.10 ± 0.12
68.45 ± 0.10
78.79 ± 0.09
00000
82.84 ± 0.1671.30 ± 0.39
73.27 ± 0.39
68.92 ± 0.33
64.54 ± 0.31
60.89 ± 0.28
49.51 ± 0.29
66.41 ± 0.24
65.24 ± 0.2578.56 ± 0.02
71.16 ± 0.10
61.36 ± 0.22
94.93 ± 0.17
87.76 ± 0.13
87.70 ± 0.27
73.51 ± 0.25
74.08 ± 0.49111.89 ± 0.09
114.24 ± 0.02
110.45 ± 0.02
102.25 ± 0.15
98.41 ± 0.23
106.20 ± 0.17
106.14 ± 0.14
104.10 ± 0.1399.98 ± 0.19
99.18 ± 0.28
111.59 ± 0.11
115.07 ± 0.14
116.24 ± 0.05
122.37 ± 0.07
105.84 ± 0.07
114.70 ± 0.12104.33 ± 0.07
37.23 ± 0.72
128.26 ± 0.23
121.23 ± 0.01
120.93 ± 0.14
122.35 ± 0.009
122.23 ± 0.07
108.53 ± 0.13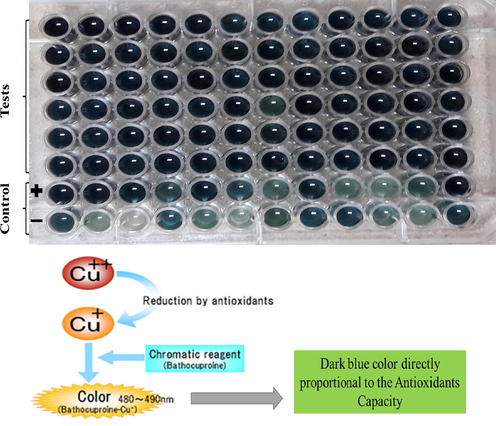
The dark blue colour show the activity of antioxidants compounds (https://www.jaica.com/e/products_antioxidant_pao_kit.html)
Reducing power depends upon the ability of electron transfer and may therefore, act as a prominent indicater for its antioxidant potential (Koruthu et al., 2011). TRP of grape leaves were also assesed in this study. Over all higher reducing power was recorded for each grape variety but still differentiation was measured with variation in soil compositions (Table 5; Fig. 4). The TRP was maximum in NARC black variety (182.06 ± 0.24) in T2 while the lowest was estimated in Sundar Khani (62.96 ± 1.00) µg AAE/g extract in T6. Similar results were obtained by (Doshi et al., 2006) that grapes leaves extract also has the ability to reduce compounds that involve in oxidation reactions. The results of (Aouey et al., 2016) reflected that the activity of reducing power also depended on the concentration of extract with a comparison of ascorbic acid standard.
VR
C(T1)
CS(T2)
CC(T3)
CSC(T4)
CCD(T5)
SCD(T6)
NB
SK
S1
S2
Ht
ShG
Pt
SC167.67 ± 0.15
167.78 ± 0.06
167.83 ± 0.07
172.78 ± 0.01
162.51 ± 0.25
159.18 ± 0.25
0.00
172.62 ± 0.02182.06 ± 0.24
170.47 ± 0.02
167.09 ± 0.11
169.52 ± 0.02
167.64 ± 0.06
163.17 ± 0.11
166.61 ± 0.16
171.74 ± 0.02168.91 ± 0.03
162.33 ± 0.18
163.86 ± 0.12
165.13 ± 0.17
163.44 ± 0.19
162.54 ± 0.18
169.60 ± 0.08
171.08 ± 0.05168.28 ± 0.12
162.64 ± 0.13
164.84 ± 0.20
160.82 ± 0.23
153.52 ± 0.20
151.96 ± 0.28
122.62 ± 0.88
145.55 ± 0.37156.58 ± 0.20
149.12 ± 0.19
149.79 ± 0.10
155.08 ± 0.15
159.04 ± 0.05
162.19 ± 0.16
152.30 ± 0.13
160.95 ± 0.20165.42 ± 0.07
62.96 ± 1.00
162.56 ± 0.14
161.06 ± 0.01
160.24 ± 0.13
171.21 ± 0.05
164.92 ± 0.21
166.08 ± 0.06
Navy blue colour is the indication of reducing power (Xiao et al., 2020).
The radical scavenging assay of DPPH has continuously been applied to assess the scavenging capacity of antioxidants molecules and is believed one of the easy and standard colorimetric techniques to investigate the antioxidants qualities of pure and natural compounds (Mishra et al., 2012). DPPH is one of the stable radicals in solution and appears purple in colour, after receiving H+ atom from a molecule with a scavenging capacity i.e., antioxidant. In this case, the purple colour changes to yellow and the reduction of DPPH* to DPPH2 occurred with deacsrese in absorbance at 515 nm (Cheng et al., 2006). and its colourbecome yellow. The current results have also shown a higher DPPH activity in different grapes varieties grown in different soil compositions. Somewhat fluctuations in DPPH quantity were found to be correlated with the soil compositions. In some fractions of grapevine shown the most effective DPPH radical scavenging activities (Table 6; Fig. 5). Higher DPPH activity was investigated in Sultania-C (80.91 ± 0.10) % Scavenging in T4 while lower was recorded in Sultania-C (52.03 ± 0.04) in T6. Similar findings to our results reported by Orhan et al., 2009, that antioxidant activity of different fractions of grapevine leaves shown the most effective DPPH radical scavenging activities. On the other hand, (Brand-Williams et al., 1995) documented that antioxidants induced the reductions of radical scavenging activities such DPPH determined by the decline value of absorbance at 520 nm. Furthermore, V. coignetiae (the Asian wild species) has been grown for the last two centuries. These species are used for wine, jam, and juice production in Japan (Kamiya et al., 2018). Leaf extraction of this species reflected a higher radical scavenging activity and potential hepato-protective effects on the non-alcoholic steatohepatitis of the liver (Takayama et al., 2009). So its proved that antioxidants compounds play a key role in the reductuion of deleterious effects of auto-oxidants to prevent or neutralizing them from the destructive actions like cancer, cardiovascular disease and diabetes etc (SEl et al., 2014).
VR
C(T1)
CS(T2)
CC(T3)
CSC(T4)
CCD(T5)
SCD(T6)
NB
SK
S1
S2
Ht
ShG
Pt
SC54.89 ± 0.11
65.70 ± 0.02
61.03 ± 0.04
63.28 ± 0.05
57.67 ± 0.10
63.67 ± 0.06
0.00
55.85 ± 0.0463.74 ± 0.04
64.17 ± 0.06
57.10 ± 0.02
68.31 ± 0.02
59.78 ± 0.05
55.10 ± 0.08
54.96 ± 0.08
55.14 ± 0.0461.99 ± 0.11
67.88 ± 0.03
57.39 ± 0.11
69.77 ± 0.18
68.59 ± 0.03
58.49 ± 0.04
57.03 ± 0.07
55.07 ± 0.0556.75 ± 0.06
56.82 ± 0.01
62.10 ± 0.12
54.60 ± 0.08
66.38 ± 0.09
66.88 ± 0.06
68.17 ± 0.04
80.91 ± 0.1061.06 ± 0.13
62.96 ± 0.03
59.71 ± 0.09
59.85 ± 0.07
65.99 ± 0.12
66.56 ± 0.06
62.13 ± 0.09
54.82 ± 0.1371.91 ± 0.18
52.68 ± 0.10
54.50 ± 0.10
55.85 ± 0.03
59.10 ± 0.02
62.74 ± 0.08
55.89 ± 0.05
52.03 ± 0.04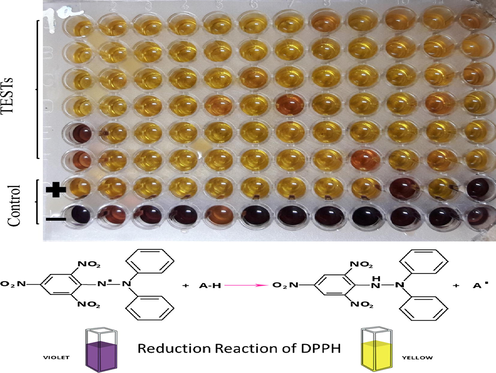
Change of colors from pink to yellow is due to reduction of DPPH radical (http://chimactiv.agroparistech.fr/en/aliments/antioxydant-dpph/principe).
3.2 Principal component analysis (PCA)
In the PCA, we have tried to show various activities of extracts taken from different grape varieties in the form of a biplot with two principal component analyses. These biplots corresponded to the cumulative variance at 94.75% (Fig. 6). The analysis showed an obvious difference in the antioxidant potential in all grape varieties. The F1, x-axis accounted for 74.45% of the activity difference. Six varieties were grouped into one cluster i.e., NARC black (NB), Shogran-2 (S2), Sheghali (ShG), Haita (Ht), Shogran-1 (S1), Sultania-C (SC) which have relatively low DPPH but high TPC, TAC, TRP and TFC. On the other hand, the negative region contains only two varieties i.e., Sundar Khani (SK) and Perlette (Pt). The second principal component (F2 y-axis) accounted for a 20.30% variation of activity. The positive region is occupied by varieties SK, Ht, ShG, S2, NB with high DPPH and TPC while the negative region contains Pt, SC, And S1 with lower TFC and TAC respectively.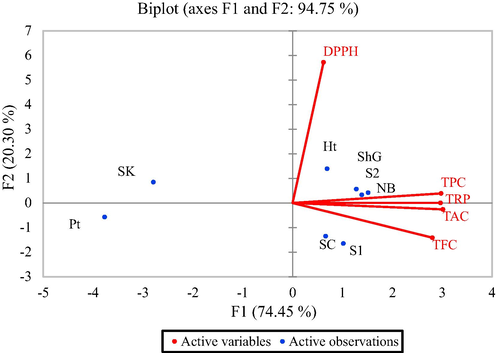
Principal component analysis of the selected grape varieties in relation to their various phytochemical activities.
3.3 Correlation analysis
As we have discussed in the above metioned data very clearly, that various cultivars have a different level of variance in antioxidant potential in various bioassays. This is because of contribution of different phenolic and flavonoid componds present in grape varieties. In correlation analysis, we have tried to disentangle the possible link and relation between flavonoids, total phenolic contents, and antioxidant potential. The coefficient of correlation was calculated for TPC and TFC values using various assays such as TAC, DPPH and TRP (Fig. 7). The antioxidant potential of the grapevine was positively interlinked with phenolic compounds and further to their composition (Landbo and Meyer, 2001). Similarliy, the results of (Balík et al., 2009) considered that the values of TRP and DPPH from leaves, stem and fruit as averagely higher with the increasing TAC, phenolic and flavoinoid contents. Currently, the results of our study proved that TRP and DPPH methods are totally depended on the concentration of Phenolic compounds (Fig. 7).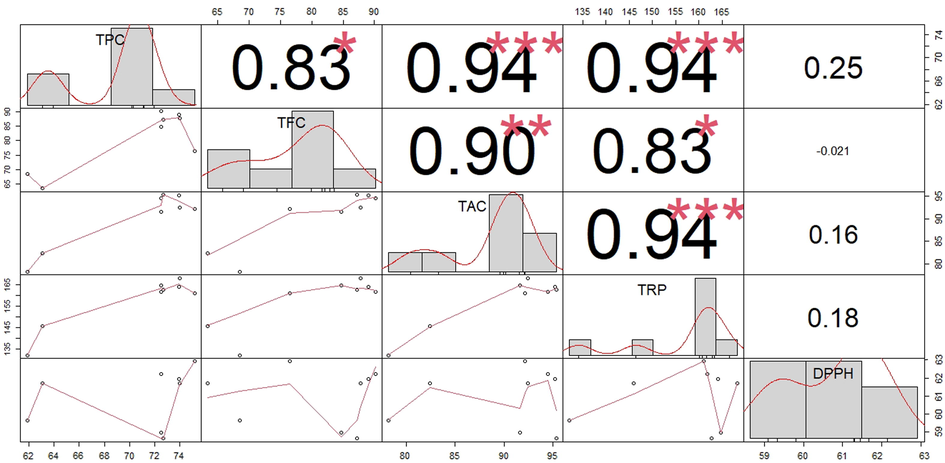
Correlation analysis of the investigated activities variables in different grape varieties.
The TPC and TFC were directly correlated with the TAC and TRP, they have many of polyphenols and flavonoids as discussed by (Kedage et al., 2007), while inversely correlated with DPPH radical scavenging assays (Fig. 7). The significant (P < 0.05) positive correlation were found between TPC and TFC with TAC and TRP while insignificant correlation was observed with DPPH radical scavenging assay. Apart from positive correlation the negative correlation was found between TFC and DPPH which revealed that grape plants have good radical scavenging activity due to high phenolic and flavonoids contents. A similar study was carried out by (Borbalan et al., 2003). They found a good correlation between the total polyphenol contents and their antioxidant potentials.
The ecological role of leaf phenolic compounds and antioxidants activities would be of extreme interest to understand the nature and production of such molecules which have a specific role to limit and curtail the different pathogens attacks and diseases cause in it. As we know that, grapes have a remarkable role in the provision of nutraceutical, pharmaceutical and food-related ingredients, leaves of grapevine are considered is key and potential source of bioactive ingredients.
4 Conclusion
In this paper we have focused on the antioxidant potential in the leaves of different grapes varieties (Vitis vinifera L.) grown in various soil types. We elucidate that grape leaves have higher antioxidant compounds determined viapresence of flavonoids, total phenolics, total antioxidant, reducing and radical scavenging capacities bearing groups in all the studied varieties (i.e. NARC black, Sundar khani, Shogran-1, Shogran-2, Haita, Sheghali, Perlette, and Sultania-C) grown in various soil regimes. These varieties shown the best response but the activity change with changing soil compositions. We conclude that leaves are an important source of antioxidants and can be used as potential source in various foods alongside grape fruits. The nutraceutical industry can focus on the leaves as a potential source of phenolics and antioxidants. We strongly recommend further studies on other parts of grapes cultivars at different maturation stages and varying environmental conditions for their biochemical and antioxidant potentials. It's also concluded that varying soil regimes and environmental conditions affect the quantity as well as quality of the phytochemicals. This study will also attract people from food industries to workout the extensive use of grape leaves in various products.
Acknowledgement
The authors extend their appreciation to the Deanship of Scientific Research, King Khalid University for partly funding this work through research groups program under grant number R.G.P. 1/25/42. We are very thankful to the Directorate of Agriculture Linkages Program, Pakistan Agricultural Research Council for supporting the current research work and experimentation via the project titled “Identification of potential ecological zone for introduction of suitable Grape (Vitis vinifera L.) Varieties; a step towards poverty alleviation and sustainable development in the FATA region of Pakistan”.
Declaration of Competing Interest
The authors declare that they have no known competing financial interests or personal relationships that could have appeared to influence the work reported in this paper.
References
- A Comprehensive Appraisal of the Wild Food Plants and Food System of Tribal Cultures in the Hindu Kush Mountain Range; a Way Forward for Balancing Human Nutrition and Food Security. Sustainability. 2021;13(9):5258.
- Effect of pruning severity on growth behavior of spur and bunch morphology of grapes (Vitis vinifera L.) Cv. Perlette. Int. J. Agric. Biol.. 2004;6:160-161.
- [Google Scholar]
- Ampelographic and genetic characterization of grapes genotypes collected from potohar region of Pakistan. Pak. J. Agric. Sci.. 2019;56
- [Google Scholar]
- Phenological and physicochemical evaluation of table grapes germplasm growing under arid subtropical climate of Pakistan. Pak. J. Bot.. 2020;52:1011-1018.
- [Google Scholar]
- Manipulation and engineering of metabolic and biosynthetic pathway of plant polyphenols. Curr. Pharm. Des.. 2013;19:6186-6206.
- [Google Scholar]
- Anti-Oxidant, Anti-Inflammatory, Analgesic and Antipyretic activities of grapevine leaf extract (Vitis vinifera) In mice and identification of its active constituents by lc–ms/ms analyses. Biomed. Pharmacother. 2016;84:1088-1098.
- [Google Scholar]
- Postharvest losses and marketing of grapes in Pakistan. Sarhad J. Agric. 2011;27:485-490.
- [Google Scholar]
- Therapeutic and nutraceutical potential of bioactive compounds extracted from fruit residues. Crit. Rev. Food Sci.. 2015;55:319-337.
- [Google Scholar]
- Relations between polyphenols content and antioxidant activity in vine grapes and leaves. Czech J. Food Sci.. 2009;26 (Special Issue):25-S32.
- [Google Scholar]
- Phytochemical Analyses, Antibacterial, In Vitro Antioxidant and Cytotoxic activities of ethanolic extract of Syzygium Cumini (L.) seed extract. Int. J. Pharm. Sci. Res.. 2011;2:1799.
- [Google Scholar]
- The grapevine transcription factor vvmybpa1 regulates proanthocyanidin synthesis during fruit development. Plant Physiol.. 2007;143:1347-1361.
- [Google Scholar]
- Study of the polyphenol content of red and white grape varieties by liquid chromatography–mass spectrometry and its relationship to antioxidant power. J. Chromatogr.. 2003;1012:31-38.
- [Google Scholar]
- Use of a free radical method to evaluate antioxidant activity. LWT-Food Sci. Technol.. 1995;28(1):25-30.
- [Google Scholar]
- Viticultural terroirs in stellenbosch, south africa. Ii. The interaction of cabernet-sauvignon and sauvignon blanc with environment. Oeno One. 2008;42:185-201.
- [Google Scholar]
- Viticultural terroirs in stellenbosch, south africa. i. the identification of natural terroir units. Oeno One. 2008;42:169-183.
- [Google Scholar]
- Vitis Amurensis Rupr: A Review Of Chemistry and Pharmacology. Phytomed. 2018;49:111-122.
- [Google Scholar]
- High-Throughput relative DPPH Radical Scavenging Capacity assay. J. Agric. Food Chem.. 2006;54:7429-7436.
- [Google Scholar]
- Clarke, G., Ting, K.N., Wiart, C., Fry, J., 2013. Radical scavenging, ferric reducing activity potential and total phenolics content indicates redundancy in use of all three assays to screen for antioxidant activity of extracts of plants from the Malaysian rainforest.
- Conde, C., Silva, P., Fontes, N., Dias, A.C.P., Tavares, R.M., Sousa, M.J., Agasse, A., Delrot, S., Gerós, H., 2007. Biochemical changes throughout grape berry development and fruit and wine quality.
- Engineering Of Plant Natural Product Pathways. Curr. Opin. Plant Biol.. 2005;8(3):329-336.
- [Google Scholar]
- Donovan, J.L., Manach, C., Faulks, R.M., Kroon, P.A., 2006. Absorption and metabolism of dietary plant secondary metabolites. Plant secondary metabolites: occurrence, structure and role in the human diet, pp.303-51.
- Phenolic composition and antioxidant activity in grapevine parts and berries (Vitis vinifera L.) cv. Kishmish Chornyi (Sharad Seedless) during maturation. Int. J. Food. Sci. Technol. 2006;41:1-9.
- [Google Scholar]
- Supercritical CO2 extraction of grape seed oil: Effect of process parameters on the extraction kinetics. J. Supercrit. Fluids.. 2015;98:33-43.
- [Google Scholar]
- Extraction optimization of medicinally important metabolites from datura innoxia mill.: an in vitro biological and phytochemical investigation. BMC Complement Altern. Med.. 2015;15:376.
- [Google Scholar]
- Recent advances and uses of grape flavonoids as nutraceuticals. Nutrients.. 2014;6(1):391-415.
- [Google Scholar]
- Proanthocyanidin composition and antioxidant potential of the stem winemaking by products from 10 different grape varieties (Vitis vinifera L.). J. Agric. Food Chem.. 2012;L.). 60:11850-11858.
- [Google Scholar]
- Relationship between physical and chemical parameters for four commercial grape varieties from the bierzo region (Spain) Sci. Hort.. 2012;147:111-117.
- [Google Scholar]
- Antioxidant and cytotoxic activities and phytochemical analysis of Euphorbia wallichii root extract and its fractions. IJPR. 2012;11(1):241.
- [Google Scholar]
- The chemistry behind antioxidant capacity assays. J. Agric. Food Chem.. 2005;53:1841-1856.
- [Google Scholar]
- Effect of growth hormones on micropropagation of Vitis vinifera L. cv. Perlette. Pak. J. Bot.. 2008;40:105.
- [Google Scholar]
- 2, 6-Dimethoxy-1, 4-benzoquinone, isolation, and identification of anti-carcinogenic, anti-mutagenic and anti-inflammatory component from the juice of Vitis coignetiae. Food Chem. Toxicol.. 2018;122:172-180.
- [Google Scholar]
- Review of methods to determine antioxidant capacities. Food Anal. Methods.. 2009;2:41-60.
- [Google Scholar]
- Cocoa and chocolate in human health and disease. Antioxid Redox Signal.. 2011;15(10):2779-2811.
- [Google Scholar]
- A study of antaoxidant properties of some varieties of grapes (Vitis vinifera L.) Crit. Rev. Food Sci. Nutr.. 2007;47:175-185.
- [Google Scholar]
- Constitutive polyphenols in blades and veins of grapevine (Vitis vinifera L.) healthy leaves. J. Agric. Food Chem.. 2018;66(42):10977-10990.
- [Google Scholar]
- Antibacterial evaluation, reducing power assay and phytochemical screening of Moringa oleifera leaf extracts: effect of solvent polarity. Int. J. Pharm. Sci. Res. 2011;2(11):2991.
- [Google Scholar]
- The effects of cold stress on the phenolic compounds and antioxidant capacity of grapevine (Vitis vinifera L.) leaves. J. Plan. Physiol.. 2015;189:97-104.
- [Google Scholar]
- Understanding the composition, biosynthesis, accumulation and transport of flavonoids in crops for the promotion of crops as healthy sources of flavonoids for human consumption. Nutrients. 2020;12(6):1717.
- [Google Scholar]
- Enzyme-Assisted extraction of antioxidative phenols from black currant juice press residues (Ribes nigrum) J. Agric. Food Chem.. 2001;49:3169-3177.
- [Google Scholar]
- Genetics and biochemistry of seed flavonoids. Annu. Rev. Plant Biol.. 2006;57:405-430.
- [Google Scholar]
- An overview of plant phenolic compounds and their importance in human nutrition and management of type 2 diabetes. Molecules. 2016;21:1374.
- [Google Scholar]
- Mitochondrial dysfunction and oxidative stress in neurodegenerative diseases. Nature.. 2006;443:787-795.
- [Google Scholar]
- Antibacterial activity and brine shrimp toxicity of artemisia dubia extract. Pak. J. Bot. 2012;44:1487-1490.
- [Google Scholar]
- Estimation of antiradical properties of antioxidants using DPPH assay: A critical review and results. Food. Chem.. 2012;130(4):1036-1043.
- [Google Scholar]
- Antioxidant potential and nutritional values of vegetables: a review. Res J Med Plant. 2014;8:50-81.
- [Google Scholar]
- Mtdna mutations increase tumorigenicity in prostate cancer. 2005;102:719-724.
- Standardized methods for the determination of antioxidant capacity and phenolics in foods and dietary supplements. J. Agric. Food. Chem.. 2005;53:4290-4302.
- [Google Scholar]
- Optimization of oil yield and oil total phenolic content during grape seed cold screw pressing. Ind. Crops. Prod.. 2015;63:26-33.
- [Google Scholar]
- Dietary flavonoids: bioavailability, metabolic effects, and safety. Annu. Rev. Nutr.22. 2002;(1),:19-34.
- [Google Scholar]
- High impact biowastes from south european agro-industries as feedstock for second-generation biorefineries. Crit. Rev. Biotechnol.. 2016;36:175-189.
- [Google Scholar]
- Green processing and biotechnological potential of grape pomace: Current trends and opportunities for sustainable biorefinery. Biores. Technol. 2020:123771.
- [Google Scholar]
- Antioxidant activity of phenolic compounds from different grape wastes. J. Food Process. Technol.. 2014;5(296):2.
- [Google Scholar]
- Influence of abiotic stress during soybean germination followed by recovery on the phenolic compounds of radicles and their antioxidant capacity. Acta Soc. Bot. Pol.. 2014;83
- [Google Scholar]
- Effect of High-Pressure Processing and Dairy on the Antioxidant Activity of Strawberry Based Beverages. Illinois.Tech. 2010
- [Google Scholar]
- Effect of rosuvastatin on coronary atheroma in stable coronary artery disease multicenter coronary atherosclerosis study measuring effects of rosuvastatin using intravascular ultrasound in Japanese subjects (COSMOS). Circul. J.. 2009;73(11):2110-2117.
- [Google Scholar]
- Genetically tailored grapevines for the wine industry. Trends. Biotechnol.. 2002;20:472-478.
- [Google Scholar]
- Guidelines for antioxidant assays for food components. Food. Frontiers. 2020;1(1):60-69.
- [Google Scholar]
- Phytochemical profiles and antioxidant activities of wine grapes. Food Chemistry. 2009;116:332-339.
- [Google Scholar]
- Micromorphological investigation of leaf epidermis and seeds of vitaceae from Pakistan using Light Microscopy and Scanning Electron Microscopy. Microsc. Res. Tech.. 2019;82:335-344.
- [Google Scholar]


