

Translate this page into:
Application of Cu-based metal-organic framework (Cu-BDC) as a sorbent for dispersive solid-phase extraction of gallic acid from orange juice samples using HPLC-UV method
⁎Corresponding author. m_ghaedi@mail.yu.ac.ir (Mehrorang Ghaedi)
-
Received: ,
Accepted: ,
This article was originally published by Elsevier and was migrated to Scientific Scholar after the change of Publisher.
Peer review under responsibility of King Saud University.
Abstract
In the current work, the Cu-based metal-organic framework (MOF) (Cu-BDC) was synthesized through a simple and one-pot solvothermal method and used as a sorbent for dispersive solid-phase extraction (DSPE) of gallic acid (GA) from orange juice samples followed by high-performance liquid chromatography-ultraviolet (HPLC-UV) determination. The prepared Cu-BDC was fully characterized using different analysis including Fourier-transform infrared spectroscopy (FT-IR), X-ray Powder Diffraction (XRD), Scanning Electron Microscopy (SEM), Energy-dispersive X-ray spectroscopy (EDS) and Brunauer-Emmett-Teller (BET). The prepared Cu-BDC had exceptional properties in terms of high specific surface area (400 m2 g−1) and high adsorption capacity (300 mg g−1) toward GA. The influence of effective factors on extraction recovery of GA such as sorbent dosage, ultrasonic time, washing solvent volume and eluent solvent volume was evaluated using a central composite design (CCD) based response surface methodology (RSM). Under the optimized conditions, the presented method showed a wide linear range of 0.5–15.0 mg L−1 with a detection limit of (0.145 mg L−1) and acceptable repeatability (RSD < 6.0%) which shows the applicability of the proposed method for accurate determination of GA from complicated orange juice samples.
Keywords
Metal-organic framework
Dispersive solid-phase extraction
Central composite design
Gallic acid
Orange juice

1 Introduction
In spite of increasing the use of hyphenated analytical instruments such as high-performance liquid chromatography-fluorescence spectrometry (HPLC-FL), gas chromatography-mass spectrometry (GC–MS) and so on, sample preparation is still a key step in analytical methods. This fact is due to the presence of complex matrixes and impurities in complicated samples that can inhibit or enhance the analyte’s ionization or pollute the separator/detector which limits the direct injection of proposed samples. The other reason for sample preparation is the low concentration of target analytes in complicated matrixes (Mitra, 2004; Ostovan et al., 2018). The main goals of sample preparation are the elimination of impurities, analyte pre-concentration and also conversion of the target compounds into a more suitable form for the detection or preliminary separation (de Faria et al.; Wen et al., 2014). In this regard, different sample preparation methods have been used for pre-concentration and determination of target analytes. Amongst, solid-phase extraction (SPE) has much interested due to its exclusive properties in terms of easy operation, short analysis time, low analysis cost and easy automation (Gholami et al., 2019; Wu et al., 2019). The classical SPE methods have main disadvantages such as trapping of sorbent particles in the cartridges frits, the formation of high pressure inside the SPE system and also channeling the SPE column which decrements the performance of the proposed analytical method (Mao et al., 2019). To address these drawbacks, there is wide attention in the development of operative, and cost-effective sample preparation methods. DSPE is based on the dispersion of SPE sorbent in the sample solution containing the target analyte. This methodology provides the complete interaction of sorbent and target analyte in a short period of time and hence can efficiently increase the sample throughput (Baile et al., 2019; Li et al., 2019). In addition, this approach eliminates different problems that may occur in classical SPE (Milheiro et al., 2019). In spite of using different kinds of sorbents in DSPE, some of them are faced with main drawbacks in terms of low physical and chemical stability, hardness to modification, low specific surface area and also low adsorption capacity. To overcome these drawbacks, MOFs are very useful. MOFs are a kind of porous crystalline materials that composed of an inorganic three-dimensional structure of metal ions and organic ligands (Chen and Zhang, 2019a, 2019c; Kaneti et al., 2017a; Sánchez et al., 2019; Shi et al., 2017; Tang et al., 2016). MOFs have a high surface area which is achieved based on the coordination interactions between metal cations (clusters or secondary building units) and organic ligands (linkers) via coordinative bonds (Azhar et al., 2019; Chen et al., 2017; Chen and Zhang, 2019b; González-Sálamo et al., 2019; Kaneti et al., 2017b; Shi et al., 2019). Between the MOFs, a copper-based MOFs particularly draws great attention because they can be synthesized with commercially available reagents and possesses the high surface area (Jabbari et al., 2016; Lin et al., 2014). Copper (Cu) was selected as a classical transition metal which is considered to be one of the most attractive elements for use in the preparation of MOFs due to its abundance of resources, low cost, non-toxic properties, and most importantly high complexation strength (Taher et al., 2017). The high and excellent stability of Cu based MOFs is related to the strong interaction between Cu (II) from metal and -O- from organic ligands which make these materials stable in aqueous solution and over a wide pH range. Terephthalic acid as a common ligand which have very low toxicity and is easily available was applied in which the COOH groups can strongly interact with Cu2+ cations via coordination interaction. Also, molecules with aromatic rings tend to interact with MOFs due to the π–π interactions (Doherty et al., 2012). One of the main parameters that can affect the extraction process is ultrasonic irradiation. Ultrasonic irradiation improves the interaction of sorbent and analytes, enhances mass transfer of analyte from sample solution to sorbent and subsequently enhances adsorption capacity. This phenomenon is related to the formation and collapse of microbubbles, which are formed during the passage of the sound waves through the solution, which namely as cavitation (Martínez-Patiño et al., 2019; Taticchi et al., 2019). Gallic acid is an organic acid and polyphenolic compound which is found in different materials such as green tea, vegetables, gallnuts, grapes, sumac, witch hazel, and fruits. It also has been used in pharmaceutical purposes due to its anti-allergic, anti-inflammatory, anti-mutagenic and anti-carcinogenic properties (Gali et al., 1992; Singleton, 1981). Therefore, the determination of gallic acid in different matrices is still a vital task. In recent years, various methods have been applied for this purpose. In this study, we prepared a Cu-based MOF (Cu-BDC) via a simple and one-pot solvothermal synthesis method and used it for the first time as a sorbent for DSPE of gallic acid from orange juice samples. The prepared MOF was fully characterized and the effect of influential factors on extraction recovery was also evaluated. In addition, under the optimized conditions, the fully validated developed method was applied for the analysis of GA in different orange juice samples.
2 Experimental section
2.1 Materials and instruments
GA, Cu (II) nitrate threehydrate (Cu(NO3)2·3H2O), terephthalic acid (H2BDC), dimethylformamide (DMF), NaOH, HCl, ethanol, methanol, hexane, acetone, acetic acid, and acetonitrile were purchased from Merck (Darmstadt, Germany). Ultrapure water was prepared from a MilliQ gradient water purification system. All instruments including FT-IR, XRD, EDS and SEM for analysis were applied according to our previous works (Arabi et al., 2017b; Bagheri and Ghaedi, 2019). Also, HPLC analysis was done according to our previous work using the mobile phase consisted of water-methanol (80/20, v/v) in which the pH was adjusted at 2.5 by phosphoric acid and the flow rate was set to be 1.0 mL min−1 (Arabi et al., 2017b).
2.2 Synthesis of Cu-BDC
For the synthesis of Cu-BDC, 1.0 g H2BDC and 4 g Cu(NO3)2·3H2O were fully dispersed in 75.0 mL (DMF: ethanol, 50:25 mL) and then the obtained solution was transferred to a 100 mL polytetrafluoroethylene lined stainless steel autoclave and placed in an oven at 120 °C for 12 h. After that, it was taken out and cooling down at room temperature. Then, the product was separated and washed several times with DMF and water. Finally, MOF was obtained by drying the product at 80 °C oven for 12 h.
2.3 Adsorption test
To investigate the adsorption capacity of Cu-BDC, 30.0 mg of Cu-BDCwas suspended into 15 mL solution of GA with varying concentrations (5.0–50.0 mg L− 1) by mechanical stirring for 30 min at ambient temperature. Then, the Cu-BDCwas separated from the sample solution by centrifuge and residual (non-adsorbed) concentrations of GA in the supernatant were analyzed by HPLC. The equilibrium adsorption capacity (Q, mg g−1) of Cu-BDCwas considered based on the following equation:
2.4 Preparation of calibration standard and Cu-BDC-DSPE procedure for the determination of GA from orange juice sample
Orange juice samples were purchased from the local supermarket in Shiraz and stored at 4 ◦C before use. All samples were centrifuged and filtered through a 0.45 µm filter before DSPE. A standard stock solution of GA (100.0 mg L−1) was prepared by dissolving 10 mg of GA in 100 mL of ultrapure water. The working standard solution of GA was prepared by diluting the stock solution with water. Cu-BDC-DSPE-HPLC/UV procedure for the extraction of GA from orange juice sample is presented in Fig. 1a. In this regard, 15 mL of orange juice solution with the GA spiked concentration of 200.0 µg L−1 was adjusted at pH 8.0 and the solution was mixed with 30.0 mg of Cu-BDC in the beaker under the ultrasound irradiation for 5.0 min. Then, the Cu-BDC was separated using centrifuge and washed by 3.0 mL of hexane as washing solvent and subsequently with 2 mL of methanol: acetic acid (90:10, v/v) as eluent. The eluent was evaporated to dryness under nitrogen stream in water bath (35 °C) and the residue was subsequently reconstituted in 100 µL mobile phase (water-methanol (80/20, v/v)) and 20 µL of it ready for HPLC-UV analysis.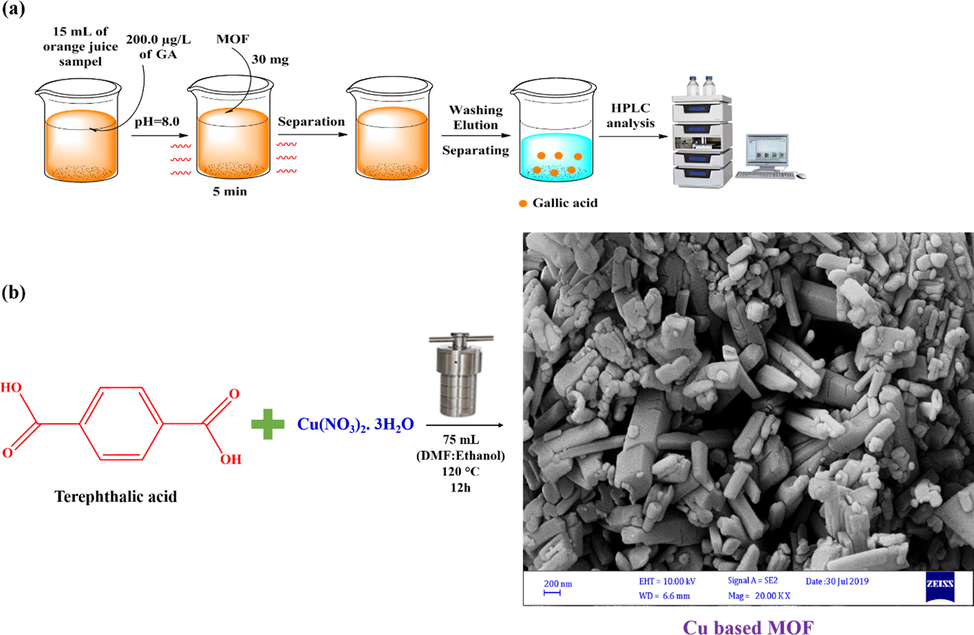
The Cu-BDC based DSPE procedure for gallic acid extraction (a) and the basic preparation procedure of Cu-BDC (b).
3 Results and discussion
3.1 Synthesis and characterization of Cu-BDC
The Cu-BDC was prepared using a simple and one-pot solvothermal method (Fig. 1b). In this regard, Cu(NO3)2·3H2O was used as a source of Cu2+ and H2BDC was used as ligand. The COO- groups of H2BDC can interact with Cu2+ ions and form a Cu-BDC material by simple solvothermal method. Happily, the presented method represents a significant advantage of eco-friendliness, cost-savings, simplicity, rapidity, and efficiency. After synthesis of Cu-BDC, it was fully characterized using FT-IR, XRD, SEM, EDS and BET analysis.
Fig. 2a, represents the FT-IR spectra of prepared Cu-BDC. The observed peaks at 488 cm−1 and 721 cm−1 could be attributed to the bending and stretching modes of Cu-O, respectively (Abbasi et al., 2017). The peaks at 663–766 cm−1 are related to the ring in H2BDC. In addition, aromatic carbon C—C vibrational mode resulted in the bands at about 1390 cm−1. Also, the peaks at 970 cm−1, 1500 cm−1, and 1640 cm−1 are related to C—O, to —C⚌C— and C⚌O groups of H2BDC, respectively that proved the successful synthesis of proposed Cu-BDC. Fig. 2b, shows the XRD pattern of Cu-BDC in which the peaks at 2θ of 7.0°, 13.8°, 15.7°, 19.6°, 30.0°, 37.0° 42.5°, 62.5°, and 74.0 ° are related to (2 2 0), (2 2 2), (3 3 3), (4 2 0), (4 2 2), (7 7 3), (8 8 2), (4 4 0) and (5 3 3) crystal planes respectively and are consistent with previous reported literature (Cambridge crystallographic information data with deposit number of 112954) (Kaur et al., 2019; Lin et al., 2014; Liu et al., 2012; Shete et al., 2018; Tari et al., 2016). Fig. 3a and b show the SEM images of prepared Cu-BDCs with different magnitude. SEM images of prepared Cu-BDCs represent the regular and ordered structure of Cu-BDCs which provides direct evidence for the successful synthesis of the Cu-BDCs. As can be seen from SEM images, the prepared Cu-BDCs have a rod and long bar-like structure. In addition, some of the prepared Cu-BDCs have an octahedral structure. Also, according to SEM images, the prepared Cu-BDCs have a 3D structure. Fig. 4a and b show the EDS and BET analysis of prepared Cu-BDC in which the presence of C, O and Cu elements confirmed the successful synthesis of Cu-BDC. Also, the prepared Cu-BDC has high specific surface area (400 m2 g−1) which make it as good sorbent for using in extraction field.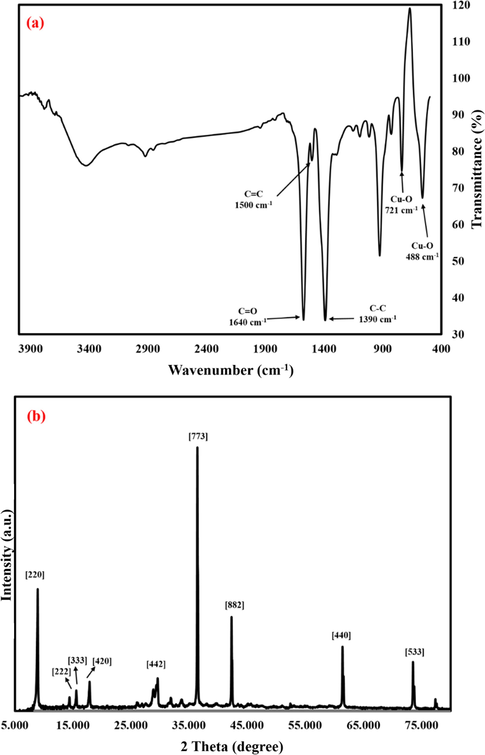
The FT-IR spectra (a) and XRD pattern (b) of prepared Cu-BDC.
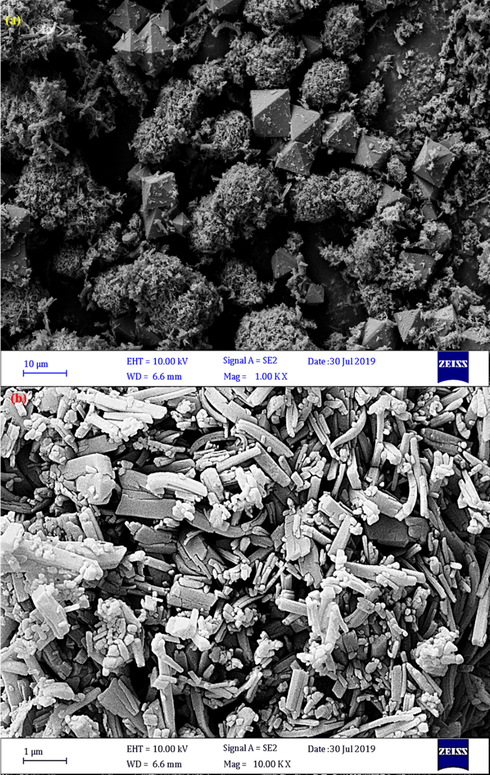
The SEM images of prepared Cu-BDC.
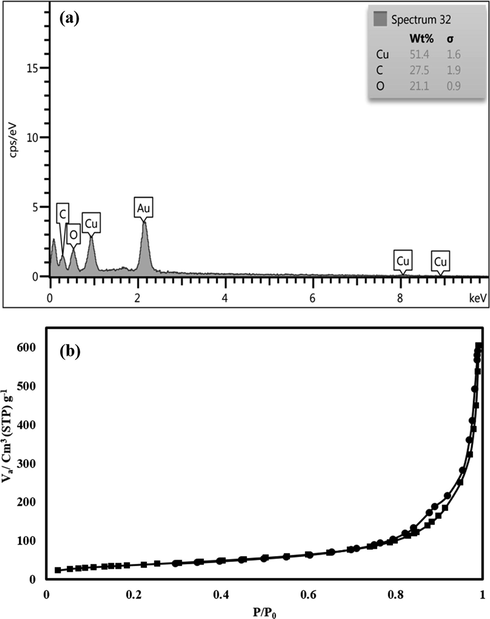
The EDS and BET analysis of prepared Cu-BDC.
3.2 Optimization of parameters for DSPE based Cu-BDC of GA from orange juice sample
To achieve maximum extraction recovery of GA in orange juice samples, the basic influences of qualitative factors such as pH and kind of washing and eluent solvents were assessed, at the spiked concentration level of 0.5 mg L−1.
One of the most important factors that can affect the structure of both analyte and sorbent is pH. To achieve the maximum extraction recovery of GA, the effect of sample pH was evaluated in the range of 3.0–10.0. The results confirmed that the maximum extraction recovery was achieved at pH 8.0. This phenomenon could be related to structure of GA and MOF. Indeed, GA acid has carboxylic acid and hydroxyl groups which have different structure in different pH. The pKa values of carboxylic acid and hydroxyl groups are 4.1 and 8.3, respectively (Arabi et al., 2017b). In pH values higher than 4.1, the carboxylic acid group of GA get negative charge and change to carboxylate group, while the hydroxyl groups of GA are neutral at pH values lower than 8.3. Based on the structures of GA and Cu-BDC, the adsorption of GA from orange juice sample by the Cu-BDC, might be attributed to the combined action of hydrogen bonding, π-π interaction, and also coordination bonds. On the other hand, we envisioned that the dominant adsorption mechanism is hydrogen bonding. In pH values higher than 4.1, the carboxylate group of GA can interact with Cu2+ ions via coordination bonds. In addition, the aromatic structure of GA allows it to interact with the aromatic ring of H2BDC via π-π interaction. Also, in the pH values between 4.1 and 8.3, the hydroxyl groups of GA can interact with COO- groups of H2BDC through hydrogen bonding. Overall, at a sample pH of 8.0, the maximum extraction recovery was achieved that is logical. Therefore, the sample pH of 8.0 was set for the next experiments.
The orange juice sample contains complicated matrices and impurities which not only can retain on the sorbent and HPLC column but also can overlap with the GA peak and subsequently decrement the performance of the proposed method. So, the washing step is required to remove these impurities. Therefore, the different washing solvent with different polarities including deionized water, methanol, ethanol, acetonitrile, acetone, and hexane were examined to attain the cleanest extracts. The results displayed that the cleanest extraction was achieved when hexane was applied as a washing solvent. This phenomenon could be related to the rinsing strength of hexane as a nonpolar solvent for washing nonpolar interferents while adsorbed GA retain on Cu-BDC. Another important factor in extraction process is choosing of appropriate eluent solvent which should be able to desorb GA from Cu-BDC. In this regard, different solvents and their mixture including methanol, ethanol, acetonitrile, methanol: ethanol (50:50, v/v), methanol: acetic acid 90:10 and ethanol: acetic acid 90:10) were assessed. The results proved that maximum extraction efficiency was achieved when methanol: acetic acid 90:10 was applied as eluent that this result might be due to the similarity between the polarity of GA and methanol and ethanol and high rinsing strength of them. The addition of acetic acid could cause hindering the formation of hydrogen bonding between GA and sorbent and thus leading to easier removal of GA.
3.3 Optimization of effective parameters via CCD based RSM
Different optimization approaches have been used in the analytical methods to investigate the effect of factors and estimate the optimum levels. One of the common optimization approaches is one-variable-at-a-time in which the effect of one factor is monitored in the fix values of other factors. In spite of simplicity, it suffers from some disadvantages including a large number of experimental runs, labor effort, high consumption of chemicals and solvents, time consuming and high cost. Most importantly, it cannot consider the effect of factors concurrently. To overcome these drawbacks, different optimization methods have been used that amongst CCD based RSM is a versatile and powerful optimization technique which not only can resolve the limitations of the traditional optimization approaches but also can consider the effect of effective factors simultaneously. Most interestingly, it can estimate the true optimum levels (Arabi et al., 2017a, 2017c; Arabi e tal., 2016; Ostovan et al., 2018). So, in this regard, in this study, CCD based RSM was applied to investigate the effect of four effective factors on extraction recovery of GA including sorbent dosage, ultrasonic time, washing solvent volume and also eluent solvent volume in five levels (−2, −1, 0, 1, 2) according to 21 experimental runs, as listed in Table S1. To appraise the consequence of parameters, their interactions, dependability, and accuracy of the model, the experimental results were fitted to the quadratic model and analysis of variance (ANOVA) parameters (Table 1) including p and F values, lack-of-fit test, coefficients of determination (R2), Adjusted R2, Adequate Precision, standard deviation and coefficient of variation at a certain confidence level (α = 0.05) were considered. Based on Table 1 and Pareto chart (Fig. S1), the factors with higher values of F, and p values < 0.05, had a significant contribution to extraction recovery. Also, the lack-of-fit value more than 0.05 (0.1105) and the correlation coefficient (R2) more than 0.98 (0.9822) verified the suitability, dependability, and qualification of the suggested model. R2 values were calculated according to (2) equation and consider as a measure of the variation around the mean calculated by the model:
GA
Source of variation
Sum of square
Degree of Freedom
Mean square
F-value
P-value
Model
2674.11
14
191.01
23.70
0.0004
A
1104.50
1
1104.50
137.06
0.0001
B
450.00
1
450.00
55.84
0.0003
C
423.85
1
423.85
52.60
0.0003
D
242.00
1
242.00
30.03
0.0015
AB
72.04
1
72.04
8.94
0.0243
AC
16.97
1
16.97
2.11
0.1970
AD
81.23
1
81.23
10.08
0.0192
BC
11.64
1
11.64
1.44
0.2747
BD
168.68
1
168.68
20.93
0.0038
CD
2.37
1
2.37
0.29
0.6075
A2
61.46
1
61.46
7.63
0.0328
B2
2.41
1
2.41
0.30
0.6039
C2
0.091
1
0.091
0.011
0.9189
D2
28.21
1
28.21
3.50
0.1105
Residual
48.35
6
8.06
Lack of Fit
33.55
2
16.78
Pure Error
14.80
4
3.70
Cor. Total
2722.46
20
R2
0.9822
Std. Dev.
2.84
R2 -Adjust
0.9408
C.V. %
3.42
Adeq Precision
19.590
The Eq. (7) shows the suitable relation between ER (%), factors, their interactions and also a quadratic model in which the coefficients show the intensity of each factor on ER (%). Also, the positive signs display the increasing of ER (%) while negative signs have the opposite effects and express declining of ER (%). In addition, to assess the concurrent influence of parameters on ER (%), RSM 3D plots were used (Fig. 5). As can be seen from Fig. 5a, the concurrent increase of sorbent dosage and ultrasonic time, enhance ER (%). Indeed, increasing of sorbent dosage, enhances active sites and specific surface area that subsequently enhances adsorption capacity and ER (%). On the other hand, ultrasonic irradiation increases the contact area between sorbent and GA and also enhances the mass transfer of analyte from sample solution to Cu-BDC which enhances ER (%). As orange juice is complicated, it is necessary to remove impurities and complicated matrices. So. The effect of washing solvent volume in the range of 2.0 to 6.0 mL was evaluated and the results showed that the cleanest reaction was achieved when 3.0 mL of hexane was applied as washing. Indeed, 3.0 mL of hexane was enough to remove impurities. On the other hand, the desorption of adsorbed GA is the key step. In this regard, the effect of methanol: acetic acid (90:10 v/v) as eluent solvent was investigated in the range of 2.0–6.0 and results confirmed that 2.0 mL of methanol: acetic acid (90:10 v/v) was enough to desorb GA molecules from sorbent. After RSM evaluation, for simultaneous optimization of the analyzed factors, desirability function (DF) was applied based on the (8) equation (Bandara et al., 2019):
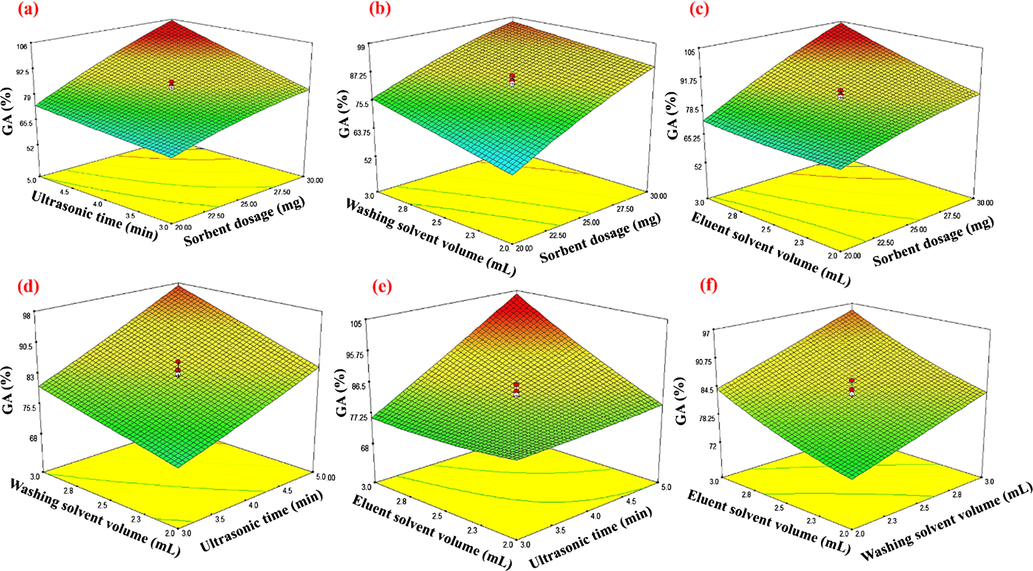
Response surface showing gallic acid recovery efficiency as a function of two independent variables: (a) Ultrasonic time (min) – Sorbent dosage (mg), (b) Washing solvent volume (mL)- Sorbent dosage (mg), (c) Eluent solvent volume (mL)- Sorbent dosage (mg), (d) Washing solvent volume (mL) - Ultrasonic time (min), (e) Eluent solvent volume (mL) -Ultrasonic time (min) and (f) Eluent solvent volume (mL) - Washing solvent volume (mL) at 25 °C.
3.4 Assessment of adsorption isotherms for determination of GA by Cu-BDC
One of the main significant features in adsorption study is adsorption isotherm that displays the dependency, propensity and also adsorption mechanism of analyte toward sorbent (Sarma et al., 2019). To evaluate the adsorption isotherms of GA onto Cu-BDC, the quantitative analysis was completed in the concentration range of 5.0–50.0 mg L−1 of GA. In the following, different isotherm models including Langmuir, Freundlich, Temkin, and Dubinin–Radushkevich were applied to investigate the adsorption properties of Cu-BDC. These models and their parameters are presented in Table S2. As can be seen from Table S2, qe illustrations the adsorbed GA at equilibrium, Qm and Qs are the maximum adsorption capacity, Ce is the GA concentration in sample solution at equilibrium and KL, RL, α, m, B, KT and β are the Langmuir, Freundlich, Temkin and Dubinin–Radushkevich constants, respectively. According to Table S2, Qm for the Langmuir model was attained to be 384.6 mg g−1 which is close to the value gained from experimental results. Based on the results, the Langmuir isotherm model was more suitable than other models due to its higher R2 (0.9965) that proved the adsorption of GA onto Cu-BDC can be well described by Langmuir isotherm. Langmuir isotherm illustrates that the adsorption of the analyte onto sorbent is monolayer and the surface of the sorbent is homogenous while the Freundlich model assumes that the adsorption of the analyte is multilayer and on the heterogeneous surface of the sorbent (Araújo et al., 2018). RL explains the separation factor which takes values between 0 and 1 that represent desire (irreversible) and undesired (reversible) adsorption, respectively. The obtained RL for GA was between 0.029 and 0.230 which are near to 0 and confirmed a desire (irreversible adsorption) process. The physical and/or chemical nature of adsorption is signified by Dubinin–Radushkevich isotherm model. β can take different values in which the β values between 8 and 16 KJ mol−1 show that the adsorption mechanism is chemical while for β values lower than 8 KJ mol−1, the adsorption process occurs through a physical mechanism (D. Liu et al., 2019; Razmi et al., 2019).
3.5 Examination of adsorption kinetic for adsorption of GA by Cu-BDC
Dynamic of the adsorption process was evaluated in terms of the order of rate constant using different adsorption kinetics models including First-order-kinetic, Pseudo-second-order-kinetic, Intraparticle diffusion, and Elovich. According to Table S3, qe and qt are the adsorbed GA at equilibrium and time t, K1, K2, Kdiff, C, β and α are the constants of models, respectively (Noormohamadi et al., 2018). According to Table S3, the Pseudo-second-order-kinetic model was more appropriate than other models due to its higher R2 (0.9921) which confirmed that adsorption kinetic followed by Pseudo-second-order. Moreover, the theoretical qe(cal) (41.15) value was close to the experimental qe(exp) (38.23) value for the Pseudo-second-order-kinetic model which implied that the second-order model is in good agreement with experimental data and can be used to favorably explain the GA adsorption on Cu-BDC.
3.6 Method validation and real sample analysis
Under the optimized conditions, the proposed method was validated. In this regard, the linear range, the limit of detection (LOD), the limit of quantification (LOQ), precision, and accuracy of the presented method was evaluated. The linear range was achieved in the range of 0.5–15.0 mg L−1 for GA. In addition, the LOD and LOQ values were attained to be 0.145 mg L−1 and 0.48 mg L−1 using 3 σ/slope and 10 σ/slope ratios, respectively; in which σ is the standard deviation in the mean value for chromatograms obtained from the blank orange juice sample according to IUPAC recommendation (Committee, 1987). The precision of the method was examined by performing replicate analyses of blank orange juice samples at five different concentration levels (0.5, 1.0, 5.0, 10.0 and 15.0 mg L−1) on the same day and in the five successive days expressed as relative standard deviation (RSD). Based on Table 2, The RSD values were lower than 6.5% for all intra and inter-day precision while highest extraction recoveries (higher than 86.0%) was achieved, confirmed qualified reproducibility and high accuracy of the proposed method. Different orange juice samples were applied to approve the analytical applicability of the proposed method using the standard addition method. In order to investigate the effect of sample preparation and enrichment of ER, the orange juice sample was injected to HPLC directly, as can be seen, the peak of GA wasn’t detected that is due to the complexity of the orange juice samples and low concentration of GA (Fig. 6a). After sample preparation using Cu-BDC, owing to the high potential of Cu-BDC-DSPE for enriching GA, trace quantities of GA has a remarkable signal (Fig. 6b). In the following, the accuracy of the model was investigated using a recovery test (Table 3). The ER% were found to be in the range of 98.0–101.2% while RSD values were lower than 6.0% for five replicate continuous injections. These results indicate that the proposed Cu-BDC-DMSPE -HPLC/UV method was mighty for the clean extraction of GA at trace level from intricate orange juice samples with supreme precision and accuracy.
Gallic acid (Intra-day)
Added (mg L−1)
Found (mg L−1) ± SD
RSD (%)
Recovery (%)
0.5
0.47 ± 0.02
5.5
94.0
1.0
0.99 ± 0.04
4.6
99.0
5.0
4.9 ± 0.15
3.2
98.0
10.0
10.14 ± 0.21
2.1
101.4
15.0
15.02 ± 0.28
1.8
100.1
Gallic acid (Inter-day)
Added (mg L−1)
Found (mg L−1) ± SD
RSD (%)
Recovery (%)
0.5
0.45 ± 0.03
6.2
90.0
1.0
0.95 ± 0.05
5.5
95.0
5.0
4.3 ± 0.2
4.0
86.0
10.0
10.08 ± 0.34
3.4
100.8
15.0
14.92 ± 0.38
2.2
99.5
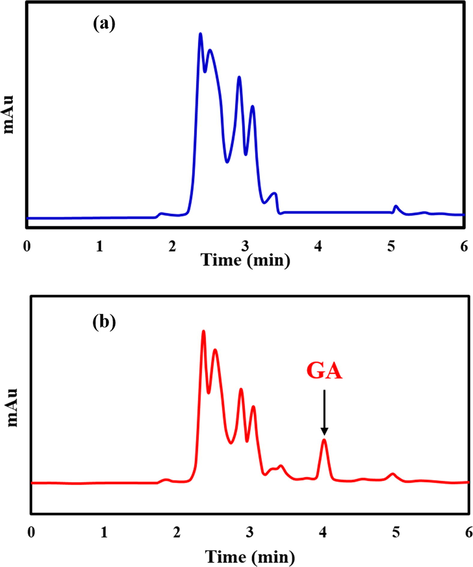
Typical chromatograms of (a) direct injection of orange juice sample and (b) spiked orange juice sample after Cu-BDC -DSPE procedure.
Gallic acid
Added (mg L−1)
Found (mg L−1) ± SD
RSD (%)
Recovery (%)
Orange juice sample 1
1.0
0.99 ± 0.06
6.0
99.0
5.0
4.9 ± 0.15
3.2
98.0
10.0
10.02 ± 0.19
1.5
100.2
Orange juice sample 2
1.0
0.989 ± 0.05
4.7
98.9
5.0
5.08 ± 0.08
1.6
101.6
10.0
10.12 ± 0.13
1.3
101.2
3.7 Reusability of the prepared Cu-BDC
The practical aspect of prepared Cu-BDCwas evaluated using a reusability test in which, several adsorption-desorption recycles of Cu-BDCwere completed and results represented that the prepared Cu-BDCis applicable for at least six times (Fig. S4.). Consequently, the proposed Cu-BDCis not only easy of synthesis, low-cost, and simple but also it is a good candidate for practical application for extraction and determination of GA from complicated orange juice samples.
3.8 Method comparison
Our presented method was compared with some other reports in terms of adsorption capacity, adsorption equilibrium time, reusability and figure of merits. The prepared Cu-BDC has high adsorption capacity (300.0 mg g−1) and the short adsorption equilibrium time (5 min) and outstanding reusability (6 times). From the view point of the analytical aspect, the linear range and LOD of the presented method are approximately the same or better than some other methods. Molecularly imprinted polymers (MIPs) have these ability to distinguish target analyte from other compounds. So, they have excellent figures of merit. In spite of their selectivity ability, MIPs don’t have high adsorption capacity and have high adsorption equilibrium time while our prepared Cu-BDC has high adsorption capacity and low adsorption equilibrium time. These facts signify the promising future of our prepared Cu-BDC for clean-up, pre-concentration, and determination of GA from complicated orange juice samples. (Arabi et al., 2017b; Denderz and Lehotay, 2014; Song et al., 2012) (Table 4).
Sample
Sample preparation method
Sorbet
Detection method
Linear range (mg L−1)
Recovery (%)
LOD (mg L−1)
LOQ (mg L−1)
RSD (%)
Ref.
Orange juice sample
PSPMEa
MIPb
HPLC-UV
0.02–5.0
92.0–100.0
0.007
–
<4.0
Arabi et al. (2017b)
Red wines
SPE
MIP
HPLC-UV
10–70
89.1–98.3
0.1
–
<9.0
Denderz and Lehotay (2014)
Rhubarb decoction
SPE
C18
HPLC-UV
4.66.0–233.0
87.9–103.0
0.466
0.621
<2.0
Song et al. (2012)
Orange juice sample
DSPE
MOF
HPLC-UV
0.50–15.0
86.0–99.7
0.145
0.48
<6.0
This work
4 Conclusion
In the current work, a simple and one-pot solvothermal method was applied to synthesis Cu-BDC material and subsequently was applied as a sorbent for pre-concentration and determination of GA from complicated orange juice samples. The prepared sorbent was fully characterized and has extensive properties in terms of regular structure and high adsorption capacity. The adsorption isotherm model followed by the Langmuir isotherm model and the kinetic model conformed to the pseudo-second-order kinetic model. The adsorption mechanism of Cu-BDC for GA in the orange juice sample could be attributed to the combined effects of the π-π conjugate, hydrogen bonding, and coordination interaction. The Cu-BDC material could be effectively regenerated by recycling it over 6 times. The equilibrium time and maximum adsorption capacity were achieved to be 5 min and 300.0 mg g−1, respectively. Under the optimized conditions, the proposed method is applicable for a linear range of 0.5 to 15.0 mg L−1 with a detection limit of 0.145 mg L−1 and satisfactory recoveries (≥98.0%) and acceptable repeatability (RSD<6.0). Due to the exclusive properties of Cu-BDCs in terms of high pore volumes, large surface areas, multiple topologies, tunable pore size, and surface chemistry, they are very useful in the field of chemistry, nanotechnology, material science, and drug delivery systems. The preparation of Cu-BDCs based on the green synthesis approaches can be the subject of future researches. In this regard, the usage of green sources as a linker precursor can be considered as a revolution in the preparation of MOFs. Ionic liquids, natural oil, and plant extracts are typical of such sources with strong acceptability in the green techniques.
Acknowledgments
This work was financially supported by Graduate School and Research Council of Yasouj University.
Declaration of Competing Interest
The authors declare that they have no known competing financial interests or personal relationships that could have appeared to influence the work reported in this paper.
References
- Efficient removal of crystal violet and methylene blue from wastewater by ultrasound nanoparticles Cu-MOF in comparison with mechanosynthesis method. Ultrason. Sonochem.. 2017;37:182-191.
- [Google Scholar]
- Development of a lower toxic approach based on green synthesis of water-compatible molecularly imprinted nanoparticles for the extraction of hydrochlorothiazide from human urine. ACS Sustain. Chem. Eng.. 2017;5(5):3775-3785.
- [Google Scholar]
- Synthesis and application of in-situ molecularly imprinted silica monolithic in pipette-tip solid-phase microextraction for the separation and determination of gallic acid in orange juice samples. J. Chromatogr. B. 2017;1048:102-110.
- [Google Scholar]
- Water compatible molecularly imprinted nanoparticles as a restricted access material for extraction of hippuric acid, a biological indicator of toluene exposure, from human urine. Microchim. Acta. 2017;184(3):879-887.
- [Google Scholar]
- Novel strategy for synthesis of magnetic dummy molecularly imprinted nanoparticles based on functionalized silica as an efficient sorbent for the determination of acrylamide in potato chips: optimization by experimental design methodology. Talanta. 2016;154:526-532.
- [Google Scholar]
- Elucidation of mechanism involved in adsorption of Pb (II) onto lobeira fruit (Solanum lycocarpum) using Langmuir, Freundlich and Temkin isotherms. Microchem. J.. 2018;137:348-354.
- [Google Scholar]
- Nanoarchitectonics: A new materials horizon for prussian blue and its analogues. Bull. Chem. Soc. Jpn.. 2019;92(4):875-904.
- [Google Scholar]
- Synthesis of chitosan based molecularly imprinted polymer for pipette-tip solid phase extraction of Rhodamine B from chili powder samples. Int. J. Biol. Macromol.. 2019;139:40-48.
- [Google Scholar]
- A modified zeolite/iron oxide composite as a sorbent for magnetic dispersive solid-phase extraction for the preconcentration of nonsteroidal anti-inflammatory drugs in water and urine samples. J. Chromatogr. A 2019
- [Google Scholar]
- Use of response surface methodology to develop and optimize the composition of a chitosan-polyethyleneimine-graphene oxide nanocomposite membrane coating to more effectively remove Cr (VI) and Cu (II) from water. ACS Appl. Mater. Interf. 2019
- [Google Scholar]
- An anionic Na (I)–organic framework platform: separation of organic dyes and post-modification for highly sensitive detection of picric acid. Chem. Commun.. 2017;53(77):10668-10671.
- [Google Scholar]
- A polyhedron-based metal-organic framework with a rare hexanuclear Co (II) cluster for selective sorption and chemical conversion for CO2. J. Solid State Chem.. 2019;278:120906.
- [Google Scholar]
- A polyoxometalate template metal-organic framework with unusual Cu8 (μ4-OH) 6 10+ secondary building unit for photocatalytic dye degradation. Inorg. Chem. Commun.. 2019;108:107523.
- [Google Scholar]
- Stepwise and hysteretic sorption of CO 2 in polycatenated metal–organic frameworks. CrystEngComm. 2019;21(32):4696-4700.
- [Google Scholar]
- Recommendations for the definition, estimation and use of the detection limit. Analyst. 1987;112(2):199-204.
- [Google Scholar]
- New advances in restricted access materials for sample preparation: a review. Anal. Chim. Acta. 2017;959:43-65.
- [Google Scholar]
- Using of molecularly imprinted polymers for determination of gallic and protocatechuic acids in red wines by high performance liquid chromatography. J. Chromatogr. A. 2014;1372:72-80.
- [Google Scholar]
- Magnetic framework composites for polycyclic aromatic hydrocarbon sequestration. J. Mater. Chem.. 2012;22(23):11470-11474.
- [Google Scholar]
- Antitumor-promoting activities of hydrolyzable tannins in mouse skin. Carcinogenesis. 1992;13(4):715-718.
- [Google Scholar]
- Preparation of hollow porous molecularly imprinted and aluminum (III) doped silica nanospheres for extraction of the drugs valsartan and losartan prior to their quantitation by HPLC. Microchim. Acta. 2019;186(11):702.
- [Google Scholar]
- Use of Basolite® F300 metal-organic framework for the dispersive solid-phase extraction of phthalic acid esters from water samples prior to LC-MS determination. Talanta. 2019;195:236-244.
- [Google Scholar]
- Green synthesis of magnetic MOF@ GO and MOF@ CNT hybrid nanocomposites with high adsorption capacity towards organic pollutants. Chem. Eng. J.. 2016;304:774-783.
- [Google Scholar]
- Strategies for improving the functionality of zeolitic imidazolate frameworks: Tailoring nanoarchitectures for functional applications. Adv. Mater.. 2017;29(38):1700213.
- [Google Scholar]
- Fabrication of an MOF-derived heteroatom-doped Co/CoO/carbon hybrid with superior sodium storage performance for sodium-ion batteries. J. Mater. Chem. A. 2017;5(29):15356-15366.
- [Google Scholar]
- Metal organic framework (MOF) porous octahedral nanocrystals of Cu-BTC: synthesis, properties and enhanced adsorption properties. Mater. Res. Bull.. 2019;109:124-133.
- [Google Scholar]
- Dispersive matrix solid-phase extraction method coupled with high performance liquid chromatography-tandem mass spectrometry for ultrasensitive quantification of endogenous brassinosteroids in minute plants and its application for geographical distribution study. J. Agric. Food. Chem.. 2019;67(10):3037-3045.
- [Google Scholar]
- Adsorption behavior of metal–organic frameworks for methylene blue from aqueous solution. Microporous Mesoporous Mater.. 2014;193:27-34.
- [Google Scholar]
- Adsorption isotherm studies on the interaction between polyphenols and apple cell walls: effects of variety, heating and drying. Food Chem.. 2019;282:58-66.
- [Google Scholar]
- A novel series of isoreticular metal organic frameworks: realizing metastable structures by liquid phase epitaxy. Sci. Rep.. 2012;2:921.
- [Google Scholar]
- Dispersive solid-phase extraction using microporous sorbent UiO-66 coupled to gas chromatography-tandem mass spectrometry: a QuEChERS-type method for the determination of organophosphorus pesticide residues in edible vegetable oils without matrix interference. J. Agric. Food. Chem.. 2019;67(6):1760-1770.
- [Google Scholar]
- Optimization of ultrasound-assisted extraction of biomass from olive trees using response surface methodology. Ultrason. Sonochem.. 2019;51:487-495.
- [Google Scholar]
- A simple dispersive solid phase extraction clean-up/concentration method for selective and sensitive quantification of biogenic amines in wines using benzoyl chloride derivatisation. Food Chem.. 2019;274:110-117.
- [Google Scholar]
- Mitra, S., 2004. Sample Preparation Techniques in Analytical Chemistry, vol. 237. John Wiley & Sons.
- Fabrication of polyethyleneimine modified cobalt ferrite as a new magnetic sorbent for the micro-solid phase extraction of tartrazine from food and water samples. J. Colloid Interface Sci.. 2018;531:343-351.
- [Google Scholar]
- Hollow porous molecularly imprinted polymer for highly selective clean-up followed by influential preconcentration of ultra-trace glibenclamide from bio-fluid. J. Chromatogr. A. 2017;1520:65-74.
- [Google Scholar]
- Hydrophilic multitemplate molecularly imprinted biopolymers based on a green synthesis strategy for determination of B-family vitamins. ACS Appl. Mater. Interfaces. 2018;10(4):4140-4150.
- [Google Scholar]
- Kinetics, thermodynamics, isotherm and regeneration analysis of chitosan modified pandan adsorbent. J. Cleaner Prod.. 2019;231:98-109.
- [Google Scholar]
- Carbon composite membrane derived from MIL-125-NH2 MOF for the enhanced extraction of emerging pollutants. Chemosphere. 2019;231:510-517.
- [Google Scholar]
- Removal of hazardous basic dyes from aqueous solution by adsorption onto kaolinite and acid-treated kaolinite: kinetics, isotherm and mechanistic study. SN Appl. Sci.. 2019;1(3):211.
- [Google Scholar]
- On the direct synthesis of Cu (BDC) MOF nanosheets and their performance in mixed matrix membranes. J. Membr. Sci.. 2018;549:312-320.
- [Google Scholar]
- Dual-functionalized mixed keggin-and lindqvist-type Cu24-based POM@ MOF for visible-light-driven H2 and O2 evolution. Inorg. Chem.. 2019;58(11):7229-7235.
- [Google Scholar]
- Semiconductive copper (I)–organic frameworks for efficient light-driven hydrogen generation without additional photosensitizers and cocatalysts. Angew. Chem. Int. Ed.. 2017;56(46):14637-14641.
- [Google Scholar]
- Singleton, V.L., 1981. Naturally occurring food toxicants: phenolic substances of plant origin common in foods. In: Advances in Food Research, vol. 27, Elsevier, pp. 149–242.
- A validated solid-phase extraction HPLC method for the simultaneous determination of gallic acid, catechin and epicatechin in rhubarb decoction. Chin. J. Natl. Med.. 2012;10(4):275-278.
- [Google Scholar]
- Highly efficient metal organic framework (MOF)-based copper catalysts for the base-free aerobic oxidation of various alcohols. RSC Adv.. 2017;7(29):17806-17812.
- [Google Scholar]
- Bimetallic metal-organic frameworks for controlled catalytic graphitization of nanoporous carbons. Sci. Rep.. 2016;6:30295.
- [Google Scholar]
- Synthesis and property modification of MCM-41 composited with Cu (BDC) MOF for improvement of CO2 adsorption Selectivity. J. CO2 Util.. 2016;14:126-134.
- [Google Scholar]
- Physicochemical characterization of virgin olive oil obtained using an ultrasound-assisted extraction at an industrial scale: Influence of olive maturity index and malaxation time. Food Chem.. 2019;289:7-15.
- [Google Scholar]
- Synthesis of Co3O4 nanoparticles and their performance towards methyl orange dye removal: characterisation, adsorption and response surface methodology. J. Cleaner Prod.. 2019;211:1141-1153.
- [Google Scholar]
- Recent advances in solid-phase sorbents for sample preparation prior to chromatographic analysis. TrAC, Trends Anal. Chem.. 2014;59:26-41.
- [Google Scholar]
- Analyzing 2-acetyl-4 (5)-(1, 2, 3, 4-tetrahydroxybutyl)-imidazole in beverages by dispersive micro-solid phase extraction using polymer cation exchange sorbent followed by ion chromatography and liquid chromatography coupled with tandem mass spectrometry. Food Chem.. 2019;292:260-266.
- [Google Scholar]
Appendix A
Supplementary material
Supplementary data to this article can be found online at https://doi.org/10.1016/j.arabjc.2020.02.020.
Appendix A
Supplementary material
The following are the Supplementary data to this article:Supplementary data 1
Supplementary data 1


