

Translate this page into:
Aqueous synthesis of tunable fluorescent, semiconductor CuInS2 quantum dots for bioimaging
⁎Corresponding author. raheel.akram19@yahoo.com (Raheel Akram)
-
Received: ,
Accepted: ,
This article was originally published by Elsevier and was migrated to Scientific Scholar after the change of Publisher.
Peer review under responsibility of King Saud University.
Abstract
A facile aqueous synthesis of CuInS2 QDs with controllable fluorescence at various reaction times was described. QDs persist low cytotoxicity. QDs are modified with RGD peptide. QDs showed good bioimaging in HeLa cells.
Abstract
Herein, we have presented a unique strategy for aqueous synthesis of semiconductor CuInS2 QDs which showed multiple fluorescence. These synthesized CuInS2 QDs were prepared in aqueous media with biocompatible glutathione (GSH), as capping ligand and stabilizer, while the fluorescence and crystallinity were controlled by varying the reaction time. The investigation of various other experimental parameters including precursor’s concentration, effect of pH, and stability of QDs has also been carried out. These QDs were characterized by XRD, TEM, and FT-IR. Meanwhile, optical properties of as synthesized QDs were also investigated by fluorescence spectroscopy. Furthermore, the synthesized QDs were also less cytotoxic and maintained remarkable cell viability up to 100 μg/mL. When bioconjugated with Arginyl-glycyl-aspartic acid (RGD) moiety, the obtained CuInS2-RGD QDs have shown higher biocompatibility and good bioimaging performance.
Keywords
Aqueous synthesis
CuInS2
Quantum dots
Fluorescence
Bioimaging

1 Introduction
In last few decades quantum dots (QDs) have attracted great attention for analytical chemists and biologists (Kim et al., 2004; Gao et al., 2005; Lewinski et al., 2008; Chen et al., 2008) due to their unique properties including high quantum yield (QY), resistance to photo bleaching, more photochemical stability, size dependent emission wavelengths narrowly (O’Connor et al., 2011; Choudhury and Song, 2010; Deng et al., 2012; Zhang et al., 2012), and symmetric emission spectra, broad absorption spectra and high photo stability (Lin et al., 2003; Majumder et al., 2009; Bagalkot et al., 2007; Yang et al., 2014) as compared to traditional fluorophores and organic dyes (Pomper and Searson, 2011; Pons et al., 2010) Quantum dots (QDs) are semiconductor nanocrystals with sizes ranging from 3 nm to 10 nm (Bagalkot et al., 2007).
In general, the emission profile of the semiconductor QDs can be tuned between 400 nm and 1700 nm by controlling the reaction time, and composition of precursors (Smith et al., 2008; Deng et al., 2012). Mostly QDs are prepared in organic solvent via an organometallic precursors. For example Chang et al. have reported the synthesis of eco-friendly CuInS2 QDs by a combined ex situ/in situ growth approach at 200 °C (Chang et al., 2013). Michalska et al. reported the organic synthesis of peptide-functionalized ZCIS QDs and then make them hydrophilic by encapsulation process (Michalska et al., 2016), and this phase transfer process increases the surface area of QDs which decreased their QY%. Similarly Qi et al. and Yong et al. introduced the organic synthesis of CuInS2 quantum dots with tunable red to near-infrared emission (Qi et al., 2016; Liu et al., 2013) but this organic medium synthesis was highly harmful to environment and health of people (Xie and Peng, 2009). So these results motivated the synthesis of ternary semiconductor CuInS2 QDs in aqueous medium (Lin et al., 2003). Therefore, the direct aqueous synthesis of high-quality QDs has attracted great significance in last few decades (Quek and Leong, 2012). To date, CuInS2 are the most popular less toxic ternary semiconductor QDs with tunable emission from visible to near infrared region (Vis-NIR).
In 2013, Zhu et al. have reported the synthesis of hydrophilic CuInS2 QDs by using GSH as capping ligand through microwave method and used them for the detection of human interleukin 6. The emission profile of these QDs was variable from 530 to 650 nm. But in microwave method high temperature and continuous heating are required which were not suitable for growth of QDs (Xiong et al., 2013). Similarly, few reports have been published regarding the aqueous synthesis of CuInS2 QDs through hydrothermal approach at longer reaction time and temperature (150 °C, 21 h, 150 °C, and 23 h) respectively and then used them for fluorescence imaging. This approach of using high reaction time and temperature was also not considered suitable for growth of small sized QDs.
Recently, CuInS2 QDs have shown specific interest and importance in photovoltaic and bioimaging applications (Jiang et al., 2015) Various efforts have been devoted to the synthesis of CuInS2 QDs for bio-labeling (Lina et al., 2014). There was another interesting example for the synthesis of CuInS2 at large scale by using electric pressure cooker and used them for fluorescence imaging of HepG2 cells (Chen et al., 2014).
Since the preparation of aqueous QDs at low reaction time and temperature was still a challenge, for this purpose Pan et al. and Chen et al. introduced a more facile method for the aqueous synthesis of Cu-In-S/ZnS core/shell quantum dots by using dual stabilizing agents with low quantum yield QYs (2–5%, 2–4%) respectively without coating of ZnS core shell which dramatically decreases the PL brightness of CuInS2 core QDs due to a large number of surface defects. The PL peak of these QDs falls from 545 to 610 nm and from 545 to 625 nm (Chen et al., 2014, 2013).
All of these studies have shown that the authors have used their own “favorable” set of synthesis parameters to make semiconductor CuInS2 QDs. However, these synthetic parameters (at high reaction time and temperature) are undesirable in green synthesis (Liu et al., 2012). In addition even core CuInS2 QDs prepared by using low reaction time and temperature have very low QY (2–4%) without ZnS core/shell which limit their interest in bioimaging (Jiang et al., 2015; Chen et al., 2014).
In order to solve aforementioned limitation, herein, we have introduced a more facile and green strategy for direct hydrophilic synthesis of CuInS2 QDs, by using low reaction time and temperature (8 h, 100 °C) with quantum yield (QY) of 14% which is higher than others. The prepared QDs were also highly stable even after 4 months of air storage. GSH was used as a stabilizer and capping ligand for CuInS2 QDs. GSH capped QDs were considered more biocompatible as compared to other thiol capping ligands (Ding et al., 2013; Zheng et al., 2007). Therefore, we have chosen GSH as ligand for the synthesis of CuInS2 QDs. The as prepared ternary semiconductor CuInS2 QDs showed tunable emission profile ranging from 550 to 725 nm which are more Near IR as compared to the previous literature with small particle size (∼3–10 nm). The optimization of all experimental parameters including reaction time, pH, stability of prepared QDs, and precursor concentration, was also carried out. The prepared QDs were highly biocompatible and showed specific green fluorescence bioimaging of HeLa cells (see Scheme 1).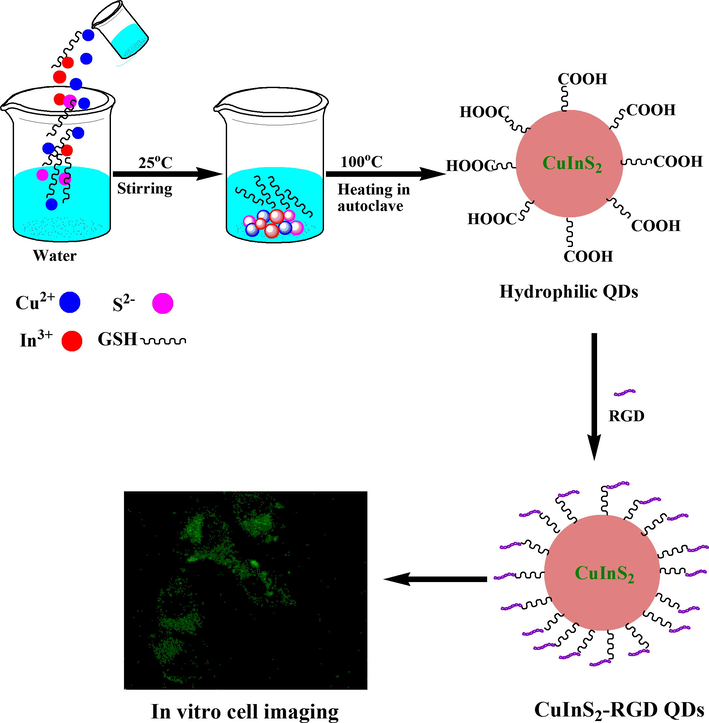
A Schematic diagram for synthetic of hydrophilic CuInS2 QDs for in vitro bioimaging.
2 Experimental
2.1 Reagents and chemicals
Following chemicals were used as supplied. Indium nitrate (In(NO3)2·5H2O), cupric nitrate (Cu(NO3)2·3H2O), sodium hydroxide, reduced l-glutathione, and sodium sulfide were purchased from Beijing Chemical Works. Polyvinylpyrrolidone (PVP) was from Sigma-Aldrich. N-hydroxysuccinimide (NHS) and N-(3-dimethylaminopropyl)-N′-ethylcarbodiimide hydrochloride (EDC) were from J & K. Distilled water (H2O) was used throughout the experiments. All the reagents were of analytical grade, used without any further purification.
2.2 Preparation of QDs
Ternary CuInS2 QDs were prepared in aqueous media via autoclave synthesis strategy. In a typical experiment, Cu(NO3)2⋅3H2O (0.02 mmol) and In(NO3)2⋅5H2O (0.08 mmol) were dissolved in distilled water. Then GSH (0.4 mmol) was injected into the solution. The pH of the solution was adjusted to 8.0 by using 1 M NaOH with stirring. After stirring for 10 minutes, 0.1 M Na2S·9H2O was added into the solution. All of the above experimental procedures were performed at room temperature and the resultant solution was transferred into a teflon-lined stainless steel autoclave. The autoclave was maintained at 100 °C for 8 h, and then cool down to the room temperature. The CuInS2 QDs were obtained through precipitation by ethanol and collected after centrifugation at 15,000 rpm for 10 min. This process was repeated for three times. The obtained solid was dispersed in distilled water. The resulting CuInS2 QDs were further characterized by XRD, FT-IR, TEM, SEM-EDX, and PL.
2.3 Bioconjugation of QDs with RGD
1 mL of PBS buffer solution containing 200 μL of RGD-peptide (1 mg/mL), and hydrophilic QDs (0.6 mg/mL) were mixed by vortex. Next, EDC (7.0 mg/mL) and NHS (1 mg/mL) were added into the mixture, followed by incubating at 25 °C for 4 h with stirring. Finally, the RGD modified QDs were collected by centrifugation (12,000 rpm, 10 min) and washed out with PBS. This purification process was repeated thrice. The obtained RGD modified nonmaterial was re-dispersed in PBS, and stored at 4 °C.
2.4 Cytotoxicity and cell imaging
Hela cancer cells were incubated in a medium containing PBS in a 5% humidified air CO2 at 37 °C. 96 cells per well at a density of 2 × 10⁵ were incubated at 37 °C. Prior to addition of many concentrations from 0 to 100 μg/mL of prepared QDs, every plate was incubated for overnight at 37 °C for 24 h. As the culture media were removed, methyl thiazolytetrazolium (MTT) of 20 μL was injected into each well at 37 °C for another 4 h under the environment of humidified air 5% CO2. Culture media were removed, in order to dissolve the formazan dimethyl sulfoxide (DMSO) was injected into every well. The plates were put onto oscillation for 10 mints to make sure that formazan has completely dissolved in DMSO. At last absorption at 490 nm it was measured by using plate reader.
For cell imaging, overnight seeding of HeLa cells takes place by using glass cover slide at a density of 2 × 10⁵ cells per well at 37 °C in 5% CO2-humidified air. CuInS2 modified RGD (100 μg/mL) collected solution was injected for another 4 h into the well. By using the similar conditions, without modification of RGD CuInS2 QDs were also incubated for comparison. After washing the cells with PBS (pH 7.3, 10 mmol/L), the cells were placed in 4% paraformaldehyde for 15–20 min. Next, the Fluorescent bioimaging was investigated out by using two photon confocal microscope (Leica).
3 Results and discussion
3.1 Structural characterization
For evaluation, the crystalline states and composition of as synthesized CuInS2 QDs, XRD, FT-IR, SEM/EDX and TEM, measurements were carried out respectively. Fig. 1(a) shows XRD pattern of CuInS2 QDs. The XRD pattern of CuInS2 QDs consisted of three major peaks with 2θ values of 27.9°, 46.4°, and 54.7°, corresponding to the (1 1 2), (2 2 0), and (1 1 6) indices the tetragonal crystal structure of CuInS2 QDs (Bruker D8-advance X-ray diffractometer) respectively.
(a) XRD patterns at different time intervals for CuInS2 QDs and (b) FT-IR spectra at different reaction time intervals: 6 h (black), 8 h (red) 10 h (blue) and pure GSH (greenish line) for GSH capped CuInS2 QDs.
Fig. 1(b) demonstrates the comparison between FTIR spectra of pure GSH and GSH-capped CuInS2 QDs at 6 h, 8 h and 10 h respectively. It has been reported that the stretching of N—H bond in GSH contributes to the IR peaks at 3121 and 3027 cm−1. On the other hand, the peak appeared at 2518 cm−1 was attributed to the stretching vibration of thiol group (SH) and the peaks at 1537 cm−1 and 1638 cm−1 belong to the distortion vibration of NH bond and stretching vibration of C⚌O bond, respectively. Comparing with the IR spectrum of GSH capped QDs, the weakening of the N—H distortion vibration band and vanishing of the SH stretching vibrational peak, the almost disappearance of N—H stretching bands clearly show the GSH has been attached onto the surface of the QDs through NHR and SH groups. Furthermore, the formation of pure CuInS2 QDs was confirmed by scanning electron microscopy- energy dispersive X-ray (SEM-EDX) in Fig. S1. It is evident from the SEM analysis that agglomeration of QDs taken place but some fine particles belonging to nano region are retained. The EDX analysis shows the elemental composition of synthesized CuInS2 QDs. It was found that the real Cu/In ratios in core sample were very close to the starting precursor ratios Cu:In (1:4).
For size investigation, TEM analysis was carried out to demonstrate the size of QDs at different time intervals. Fig. 2 shows TEM images of CuInS2 QDs prepared in distilled water at different time intervals including 6 h, 8 h and 10 h respectively. It is clear from Fig. 2(a) and (b) that CuInS2 QDs obtained at 6 h and 8 h were nearly monodisperse with approximately average diameter of 3.69 and 7.01 nm respectively. This has been confirmed by hydrodynamic size distribution analysis in Fig. S2 (a, b), whereas the nanoparticles prepared at 10 h get enlarged in size (13.59 nm) due to agglomeration.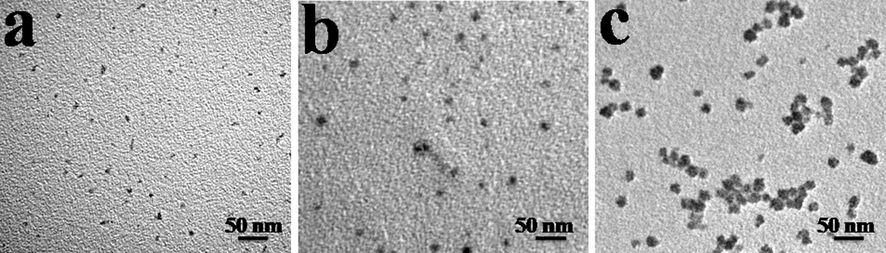
TEM images obtained at (a) 6 h, (b) 8 h and (c) 10 h for CuInS2 QDs.
Evolution of reaction temperature and time is very important for the synthesis of CuInS2 QDs, as it has been reported previously that the high reaction temperature results in large sized QDs (Liu et al., 2012). In this study the corresponding precursors were heated at 100 °C for different time intervals (4–20 h) to investigate the photoluminescence (PL) behavior (Fig. 3(a)). There were two well-defined photoluminescence peaks in a PL spectrum at 550 nm and 725 nm which were assigned to the characteristic photoluminescence peaks of water soluble CuInS2 QDs (Jiang et al., 2015). Recently Chen et al. have synthesized core CuInS2 QDs in aq. phase with low QY of (2–4%) which decrease the PL brightness of prepared QDs. The PL peaks of synthesized QDs fall between 545 and 625 nm (Chen et al., 2013). Similarly, Pan et al. also have reported the aq. synthesis of core CuInS2 QDs by using dual stabilizing agents with PL range (545–610 nm) with low QY of 2–5% (Jiang et al., 2015). On the other hand, in the case of organic synthesis of QDs, the PL intensity was shifted to higher wavelength 600–900 nm. As it has been reported previously, the organic synthesis at higher temperature red shifts the PL intensity considerably (Chang et al., 2013; Qi et al., 2016).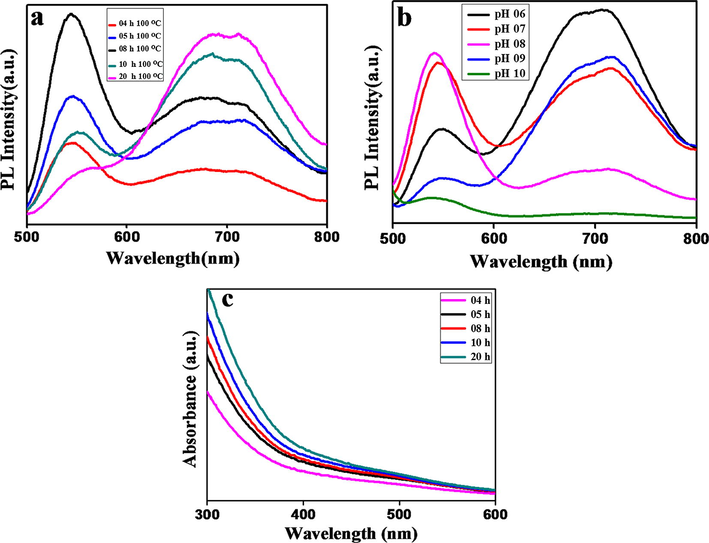
(a and c) The fluorescence emission spectra and UV-Vis absorption spectrum of CuInS2 QDs at different reaction times: 4 h, 5 h, 8 h, 10 h, and 20 h respectively. (b) Fluorescence emission spectra of CuInS2 QDs at different pH values.
As depicted in Fig. 3(a), two distinct PL peaks were observed and relative intensities of these peaks varied as the change in reaction time. When the reaction time was enhanced from 4 h to 20 h, the PL peak at 550 nm gradually red shifted to 725 nm, while the PL peak at 550 nm initially enhanced up to 8 h and then diminished substantially for 20 h. These two PL peaks were assigned to nucleation events for formation of CuInS2 QDs. In the beginning, when the reaction time was maintained at 4 h to 8 h, the formation of small group of QDs occurred with high PL intensity. On the other hand, by prolonging the reaction time up to 20 h, the diminishment of the peak at 550 nm was observed and this was attributed to dissolution of small sized QDs and the release of monomers. Meanwhile, these released monomers were absorbed to grow the large QDs and demonstrated by the red shift peak at 725 nm. The desolation of the small quantum dots and growth of the large ones indicates the growth of CuInS2 colloidal quantum dots experience typical Ostwald ripening (Zhang et al., 2014; Alikakos et al., 2004).
Although the PL peak red shifted to 725 nm still a considerable amount of shoulder peak was left behind at 550 nm. The presence of left over shoulder peak was contributed by the surface defect sites given by the small size of the core CuInS2 QDs (De Trizio et al., 2012; Macdonald et al., 2014).
For aqueous synthesis the pH of the medium is very important parameter. Fig. 3(b) clearly represents the effect of different pH values. It’s clear from Fig. 3(b), pH of the reaction system was changed from 6 to 10. The fluorescence intensity appeared maximum at 550 nm when the pH value of the reaction medium was 8. The pH effect is highly correlated with GSH (capping agent) intrinsic nature. However, the pKa value to form thiolate in GSH is about 8.7, while the inflection point to display this property is about 8.0–8.5. It is explained by the poor coordination ability of existing COOH and NH3+ in acidic media and hence, they are considered as poor capping ligand. Alternatively, it can be attributed to the oxidization of GSH, so it does not remain favorable to combine metals. On the other hand, increase in the pH value up to 11, would have precipitated the cations and formed the hydroxides of Copper and Indium. So pH 8.0 was selected for further experiments.
UV Visible absorption spectra in Fig. 3(c) of QDs prepared at various time intervals showed the specific absorption trend of QDs, and therein no clear absorption peaks were found.
In this study, we have successfully tuned the important photoluminescence properties of CuInS2 QDs, through varying the molar ratios of Cu/In by keeping the other parameters constant. As it is known precursor concentration plays a vital role in the synthesis of QDs. During the synthesis procedure the amount of indium precursor was varied, in order to achieve different Cu/In molar ratios and the nominal ratios were 1:1–1:5. Fig. 4(a) represents the effect of different Cu:In molar ratios from 1:1 to 1:5 on PL intensity. By varying the molar ratio, 1:4 molar ratios were observed to give maximum fluorescence intensity at 550 nm. Further increase in molar ratio i.e. 1:5, resulted in decrease in PL intensity when compared to molar ratio 1:4. Concluding from the observed PL intensities, 1:4 molar ratios were fixed and selected to obtain QDs with strong emission spectra.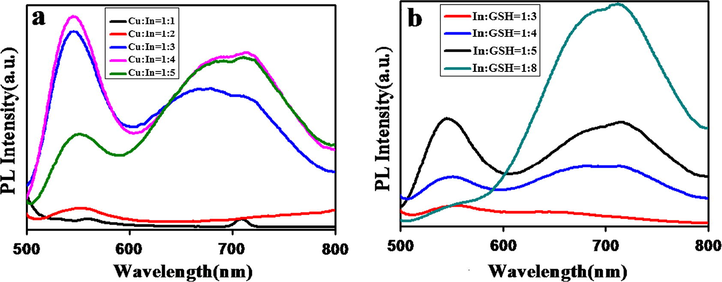
Representing the fluorescence emission spectra of CuInS2 QDs at different (a) Cu/In molar ratios and (b) In/GSH molar ratios.
The GSH as stabilizer plays a very important role in the synthesis of CuInS2 QDs. It stabilized the as synthesized CuInS2 QDs. In this study molar ratio of GSH was varied from 1:3 to 1:8. From Fig. 4(b) it is clear when the GSH molar ratio was (1:4) the fluorescence intensity appeared with high stability at 550 nm and 725 nm. But, further increase in GSH concentration decreased the fluorescence intensity in visible region (550 nm). This phenomenon was consistent with previous studies that complex formation has taken place at high ligand to metal concentration. But excessive ligand to metal concentration can distort the surfaces, due to which fluorescence intensity decreased because it causes some nonradiative defects. The QDs were obtained with quantum yield 14 %.
Fig. 5(a) shows the temporal evolution of stability of as prepared CuInS2 QDs under day light and UV-light respectively. Prepared QDs are highly stable. Even after 4 months no agglomeration was found.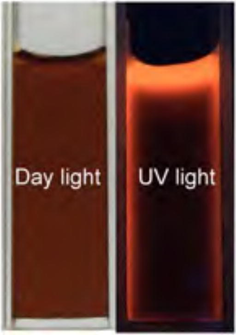
The stability shown by CuInS2 QDs after 4 months of air storage under day light and under UV light (365 nm).
The prepared QDs also maintained high stability in different media. Following photographs were taken after 2 days by dispersing the QDs in different solutions and no agglomeration was observed. The results revealed that QDs are highly stable in water, PBS, Dulbecco’s modified eagle medium (DMEM), and fetal bovine serum (FBS) which were mostly used for cell culture, which is especially favorable for cell imaging. Fig. 6 represents the stability of CuInS2 QDs in differen solutions such as Water, PBS, FBS, and DMEM respectively.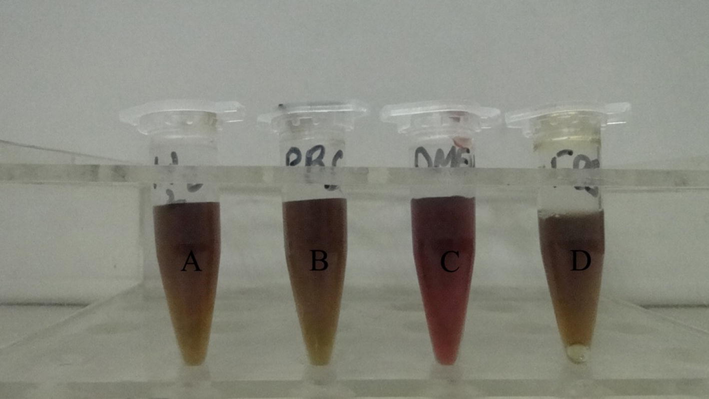
Stability spectra of QDs in water, PBS, DMEM, and FBS.
To investigate in vitro cytotoxicity of CuInS2 QDs, the Hela cells were incubated with CuInS2 nanoprobes at 37 °C for 24 h. The results showed low cytotoxicity of Hela cell lines at different concentrations. Fig. 7 reveals CuInS2 QDs show no severe cytotoxicity effect, and persist high cell viability even concentration up to 100 μg/mL, which indicate low cytotoxicity and favorable biocompatibility of CuInS2 QDs. So, these QDs can be used for in vitro cell imaging of HeLa cells.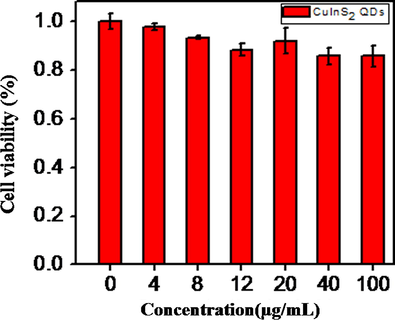
Showing the cell viability of HeLa cells incubated with various concentrations of CuInS2 QDs. The MTT assay for each concentration of QDs has been carried out in sextuple.
Furthermore, selective cell-targeting ability was achieved by bioconjugating CuInS2 QDs functionalized by RGD-peptide, a peptide that shows particular interaction to protein αvβ3 integrin present on cell surface, commonly which is mostly demonstrated on the surface of cancer cells. Besides, control experiments were also performed by using bare CuInS2 without control. The HeLa cells showed green fluorescence after incubation with RGD peptide modified CuInS2 QDs; meanwhile, the CuInS2 QDs used without RGD peptide modification (control) did not show any fluorescence (Fig. 8).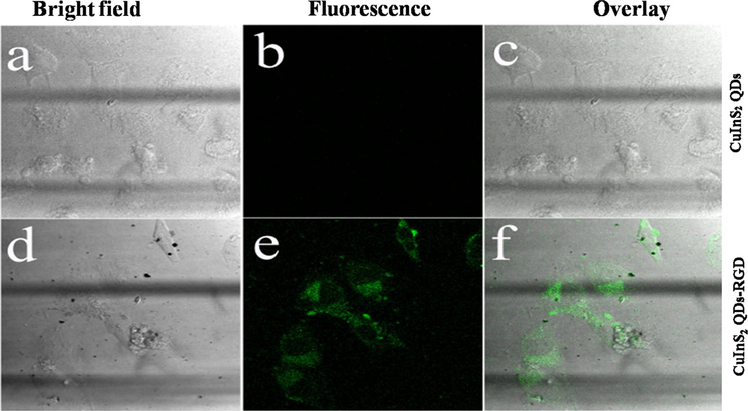
Confocal fluorescence images of HeLa cells incubated with (a–c) CuInS2 QDs and (d–f) CuInS2 QDs functionalized with RGD. Particle concentration: 100 μg/mL; Irradiation: 488 nm. The scale is 0–100 μm.
The results show that RGD-modified CuInS2 QDs are able to perform as biomarkers for cancer cell fluorescence imaging. The toxicity from CuInS2 QDs is very low and has more potential for future clinical cancer diagnoses applications as compared to toxic metals (Cd, Pb, As, Te) QDs.
4 Conclusion
In summary we have developed a more facile, green autoclave method for the synthesis of CuInS2 QDs by using GSH as capping ligand and stabilizer. As compared to other conventional organic methods, this synthetic route is more cost effective and eco-friendly. The as synthesized CuInS2 QDs are chalcopyrite and hydrophilic .Tunable emission profile of prepared CuInS2 QDs can be obtained by optimizing the experimental parameters including reaction time, pH, and molar ratios of precursors. In addition the as prepared CuInS2 QDs do not show any obvious effect on cell viability which suggests that they are user friendly and environmentally benign. The results demonstrate that CuInS2 QDs are able to perform as biomarkers for cancer cell fluorescence imaging.
References
- Ostwald ripening in two dimensions the rigorous derivation of the equations from the Mullins-Sekerka dynamics. J. Differ. Equat.. 2004;205:1-49.
- [Google Scholar]
- Quantum dot-aptamer conjugates for synchronous cancer imaging, therapy, and sensing of drug delivery based on bi-fluorescence resonance energy transfer. Nano Lett.. 2007;7:3065-3070.
- [Google Scholar]
- Synthesis of eco friendly CuInS2 quantum dot-sensitized solar cells by a combined ex situ/in situ growth approach. ACS Appl. Mater. Interfaces. 2013;5:11296-11306.
- [Google Scholar]
- The biocompatibility of quantum dot probes used for the targeted imaging of hepatocellular carcinoma metastasis. Biomaterials. 2008;29:4170-4176.
- [Google Scholar]
- Green and facile synthesis of water soluble Cu–In–S/ZnS core/shell quantum dots. Inorg. Chem.. 2013;52:7819-7821.
- [Google Scholar]
- Low-cost and gram-scale synthesis of water soluble Cu–In–S/ZnS core/shell quantum dots in an electric pressure cooker. Nanoscale. 2014;6:1295.
- [Google Scholar]
- All solid state multiply layered PbS colloidal quantum-dot-sensitized photovoltaic cells. Org. Electron.. 2010;11:21-23.
- [Google Scholar]
- Strongly fluorescent quaternary Cu–In–Zn–S nanocrystals prepared from Cu1-xInS2 nanocrystals by partial cation exchange. Chem. Mater.. 2012;24:2400-2406.
- [Google Scholar]
- Forming highly fluorescent near-infrared emitting PbS quantum dots in water using glutathione as surface-modifying molecule. J. Colloid Interface Sci.. 2012;367:234.
- [Google Scholar]
- Surface functionalization of hydrophobic nanocrystals with one particle per micelle for bio applications. Chem. Mater.. 2012;24:2592-2597.
- [Google Scholar]
- Microwave-assisted synthesis of L-glutathione capped ZnSe QDs and its interaction with BSA by spectroscopy. J. Lumin.. 2013;142:167-172.
- [Google Scholar]
- In vivo cancer targeting and imaging with semiconductor quantum dots. Biotechnology. 2005;16:63-67.
- [Google Scholar]
- Aqueous synthesis of color tunable Cu doped Zn–In–S/ZnS nanoparticles in the whole visible region for cellular imaging. J. Mater. Chem. B. 2015;3:2402-2410.
- [Google Scholar]
- Near infrared fluorescent type II quantum dots for sentinel lymph node mapping. Nat. Biotechnol.. 2004;22:93.
- [Google Scholar]
- A fluorescence resonance energy transfer-derived structure of a quantum dot-protein bioconjugate nanoassembly. Anal. Biochem.. 2003;319:239.
- [Google Scholar]
- Studies on quantum dots synthesized in aqueous solution for biological labeling via electrostatic interaction. Anal. Biochem.. 2003;319:239.
- [Google Scholar]
- A novel aptamer functionalized CuInS2 quantum dots probe for daunorubicin sensing and near infrared imaging of prostate cancer cells. Anal. Chim. Acta. 2014;818:54-60.
- [Google Scholar]
- One-pot synthesis of ternary CuInS2 quantum dots with near-infrared fluorescence in aqueous solution. RSC Adv.. 2012;2:819-825.
- [Google Scholar]
- Optimizing the synthesis of red- and near-infrared CuInS2 and AgInS2 semiconducto rnanocrystals for bioimaging. Analyst. 2013;138:6144.
- [Google Scholar]
- Cation exchange of aqueous CuInS2 quantum dots. Cryst. Eng. Commun.. 2014;16:9455-9460.
- [Google Scholar]
- Fabrication, photoemission studies and sensor of Hg nanoparticles templated on plasmid DNA. Appl. Phys. Lett.. 2009;94:073110.
- [Google Scholar]
- Peptide-functionalized ZCIS QDs as fluorescent nanoprobe for targeted HER2-positive breast cancer cells imaging. Acta Biomater.. 2016;35:293-304.
- [Google Scholar]
- Nonlinear all-optical GaN/AlGaN multi-quantum well devices for 100 Gb/s applications at λ = 1.55 μm. Appl. Phys. Lett.. 2011;86:201108-201114.
- [Google Scholar]
- Cadmium-free CuInS2/ZnS quantum dots for sentinel lymph node imaging with reduced toxicity. ACS Nano. 2010;4:2531.
- [Google Scholar]
- Facile synthesis of homogeneous CuInS2 quantum dots with tunable near-infrared emission. J. Mater. Chem. C. 2016;4:1895-1899.
- [Google Scholar]
- Near-infrared fluorescent nanoprobes for in vivo optical imaging. Nanomaterials. 2012;2:92.
- [Google Scholar]
- Bioconjugated quantum dots for in vivo molecular and cellular imaging. Adv. Drug Deliv. Rev.. 2008;60:1226.
- [Google Scholar]
- Synthesis of Cu-doped InP nanocrystals (d-dots) with ZnSe diffusion barrier as efficient and color-tunable NIR emitters. J. Am. Chem. Soc.. 2009;131:10645.
- [Google Scholar]
- Aqueous synthesis of color-tunable CuInS/ZnS nanocrystals for the detection of human interleukin 6. ACS Appl. Mater. Interfaces. 2013;5:8210-8821.
- [Google Scholar]
- Microwave-assisted synthesis and antitumor activity of salicyl acyloxy phosphonate derivatives. Chin. J. Org. Chem.. 2014;34:2566.
- [Google Scholar]
- Stable water-dispersed CdTe nanocrystals dependent on stoichiometric ratio of Cd to Te precursor. Chin. J. Chem.. 2012;30:1031-1039.
- [Google Scholar]
- One-pot synthesis of hydrophilic CuInS2 and CuInS2–ZnS colloidal quantum dots. J. Mater. Chem. C. 2014;2:4812-4817.
- [Google Scholar]
- Synthesis and cell-imaging applications of glutathione-capped CdTe quantum dots. Adv. Mater.. 2007;19(19):376-380.
- [Google Scholar]
Appendix A
Supplementary material
Supplementary data associated with this article can be found, in the online version, at http://dx.doi.org/10.1016/j.arabjc.2016.10.002.
Appendix A
Supplementary material
Supplementary data 1
Supplementary data 1


