

Translate this page into:
Ascorbic acid supported Carboxymethyl cellulose stabilized silver nanoparticles as optical nanoprobe for Au3+ detection in environmental sample
⁎Corresponding authors at: Department of Chemistry, Faculty of Science, Chulalongkorn University, Bangkok 10330, Thailand. titilope12@gmail.com (Titilope John Jayeoye), jayeoye.t@chula.ac.th (Titilope John Jayeoye), nongnuj.ms@gmail.com (Nongnuj Muangsin) nongnuj.j@chula.ac.th (Nongnuj Muangsin)
-
Received: ,
Accepted: ,
This article was originally published by Elsevier and was migrated to Scientific Scholar after the change of Publisher.
Peer review under responsibility of King Saud University.
Abstract
Heavy metals (HMs), pollution of major environmental matrices and its attendant effects on human health and the environment, continue to generate huge scientific interest, particularly in monitoring and detection. Herein, the optical property of carboxymethyl cellulose stabilized silver nanoparticles (CMC-AgNPs), supported with ascorbic acid, is exploited as a colorimetric probe for the detection of toxic Au3+ ion in solution. The as-synthesized CMC-AgNPs showed sharp absorption maximum at 403 nm, with sparkling yellow color and average particles size distribution less than 10 nm. It was further characterized using ATR-FTIR, TEM, FESEM/EDS, XRD and DLS/zeta potential analyzer. Au3+ ion detection strategy involves the addition of ascorbic acid (AA) to a pH adjusted CMC-AgNPs, followed by the analyte addition. AA would facilitate the reduction of Au3+ on CMC-AgNPs (seed), with resultant color perturbations from light yellow to yellow, orange, ruby red and purple red, under 8 min incubation, at room temperature (RT). The CMC-AgNPs could also serve as a catalyst, by promoting AA mediated reduction of Au3+, in-situ. Moreover, we propose, that the color and the absorption spectra change is attributed to the deposition of gold nanoparticles (AuNPs), on the CMC-AgNPs/AA probe, to form (CMC-Ag@Au) nanostructures, depending on the analyte concentration. Absorbance ratio (A540/A403) showed good linearity with Au3+ concentration from 0.25 to 100.0 µM, and an estimated LOD of 0.061 µM. The assay was applied to Au3+ detection in environmental wastewater sample, showing satisfactory real sample detection potentiality.
Keywords
Carboxymethyl cellulose
Silver nanoparticles
Gold (III) ion
Ascorbic acid
Colorimetry
Catalyst

- CMC
-
Carboxymethyl cellulose
- AgNPs
-
Silver nanoparticles
- CMC-AgNPs
-
Carboxymethyl cellulose stabilized silver nanoparticles
- AuNPs
-
Gold nanoparticles
- AA
-
Ascorbic acid
- RT
-
Room temperature
- NaBH4
-
Sodium borohydride
- NaOH
-
Sodium hydroxide
Abbreviations
1 Introduction
Among the various heavy metals (gold, mercury, lead, cobalt, silver, cadmium, chromium, magnesium, iron etc), considerable attentions are devoted to gold owing to huge applications of gold in jewelry manufacture, as components of electronics and electrical appliances, and in numerous industrial applications such as, medical, automotive, defense and aerospace fields (Corti et al., 2002). From the perspective of toxicity, gold metal is not very toxic. However, gold in ionic forms (Au3+), is very toxic. For example, Au3+ owing to its high thiophilicity, can bind very strongly to DNA, proteins, amino-acids and enzymes forming complexes/cleaving, and thus impart negatively on the optimal biological performance of such biomolecules (Kambam et al., 2015). Moreover, soluble gold salts, such as gold chloride have been investigated to cause severe damages on organs (spleen, liver, lungs, kidney) (Block and Knapp, 1945). It is also important to state that with the popular applications of gold nanoparticles-fabricated from (Au3+) salts, in diverse research areas, the possibility of (Au3+) leaching and consequent pollution of various environmental matrices have risen in the past few decades. Consequently, the need for consistent monitoring of (Au3+) pollution has attracted increased interest from scientists. Reported detection strategy for (Au3+) include; inductively coupled plasma-mass spectrometry ICP-MS (Losev et al., 2020), atomic absorption spectroscopy AAS (Afzali et al., 2014), methods based on electrochemistry (anodic stripping voltammetry) (Hall and Vaive, 1992; Wu and Lai, 2016), fluorescence-based methods (Hazarika et al., 2020; Qin et al., 2021) and methods based on exploiting the optical properties of metal nanoparticles (Megarajan et al., 2019; Tantubay et al., 2021; Yang et al., 2018). These methods can effectively detect (Au3+), however, the assays design in terms complex sample preparation steps for AAS and ICP-MS, and the use of some toxic reagents for fluorescence assays, calls for a more robust, sensitive, selective, timely and facile approach for (Au3+) detection.
The roles of nanomaterials in plenitude of human scientific engagements have continued to gain wide acceptability owing to their unique physico-chemical properties. In fact, their high surface area to volume ratio, provide a versatile, reliable, and efficacious platform for the incorporation of diverse materials for onward delivery to specific sites. Silver nanoparticles (AgNPs) are notable nanomaterial with huge biomedical interest in view of their high antimicrobial potentiality (Eze et al., 2022; Jayeoye et al., 2021; Jayeoye et al., 2020). Further, AgNPs surface plasmon resonance (SPR) property, which arises from the activation of surface electrons on metals resulting from electromagnetic interaction(Zeng et al., 2017), have been well exploited for the detection of wide-ranging toxic metal ions in solution (Huang et al., 2016; Ismail et al., 2018; Prema et al., 2022; Rajar et al., 2021). In the detection strategies mentioned above, the perturbations in the absorption maximum of AgNPs and its optical properties are well correlated with the concentrations of the various analytes of interest. For example, Duan et al. proposed a colorimetric probe for toxic Hg2+ detection, based on the anti-aggregation of citrate stabilized AgNPs (Duan et al., 2014). 6-thioguanine was used to induce the aggregation of AgNPs, in the absence of Hg2+. However, with prior mixing of Hg2+ and 6-thioguanine, the aggregation effect of 6-thioguanine is prevented, owing to the high binding interaction between them. Consequently, reverse color perturbations was realized, with impressive sensitivity. Moreover, the detection of highly hazardous glyphosate herbicide using AgNPs, supported with laser ablation device was reported (De Góes et al., 2017). The stability of AgNPs is an important property of interest to serve as optical probe. Thus, the changes in the nanoparticles color and absorption spectra can be appropriately related to the concentration of analytes.
Another important feature of metal nanoparticles is their catalytic properties. This property is significant in facilitating the occurrence of some naturally non-feasible reactions. Thus, AgNPs have been employed towards the degradation of numerous contaminants and recalcitrant pharmaceuticals in water (Baghbani-Arani et al., 2017; Mosaviniya et al., 2019; Xu et al., 2020). AgNPs are used to reduce the inherent energy barriers and thus provide a more suitable route towards the successful actualization of the reaction path.
Biopolymers mediated synthesis of metal nanoparticles (MNPs) have opened an exciting vista, especially in tuning the surface corona of nanoparticles. They have been found to modulate the properties of the fabricated MNPs, while also conferring better stability on the material. Their perfect aqueous dispersity, good water solubility, huge availability, affordability, biocompatibility, non-toxicity etc. made biopolymers an important bio-resource with far-reaching applications in the food industry, bio-medical field and pharmacy (Chen et al., 2020). Among the available biopolymers, carboxymethyl cellulose (CMC), is one of the most applied, owing to its good solution forming property in water, biodegradability, non-toxic and edible nature. It is a derivative of cellulose and thus one of the most readily available biopolymers around. It is used in film forming for food packaging and as a perfect reductant of metal salts or as a stabilizing agent in colloidal nanofabrication, arising from its numerous hydroxyl groups (Lin et al., 2022; Madla-Cruz et al., 2020). CMC matrix also provides an environment for the immobilization of metal ions and thus prevents easy leaching of toxic metal ions in solution, which consequently improves the biological properties of MNPs with CMC based synthesis. The stability property of nanomaterials mediated by CMC biopolymer is of huge interest in nanoparticles detection of wide-ranging analytes. The adsorption property of polyvinyl alcohol (PVA)/CMC hydrogel towards metal ions (Ni2+, Zn2+, Cu2+ and Ag+) was investigated by (Wang and Wang, 2016). It was revealed that the addition of CMC to PVA to form polymer blend (PVA-CMC) hydrogel, improved the metal ion adsorption property of the hydrogel, especially towards Ag+. Encouraged by this, in this work, we used CMC for AgNPs synthesis, owing to its good aqueous dispersity, stability, availability, cost effectiveness and metal ions sensitivities. In fact, it is one of the cheapest biopolymers around, and thus would reduce overall cost of the fabricated CMC-AgNPs.
In this contribution, we exploited the good stabilizing property of CMC to fabricate CMC-AgNPs using highly reductive NaBH4 at room temperature. We used NaBH4 to achieve nanoparticles with low particles sizes inside CMC-matrix, which can improve its catalytic property while serving as seed for the growth of gold nanoparticles, formed via ascorbic reduction of Au3+. With the addition of Au3+ (analyte), to the CMC-AgNPs, coupled with an external reductant (Ascorbic acid AA), Au3+ would be reduced on the CMC-AgNPs seed to form CMC-Ag@Au nanostructure, depending on the concentration of the analyte. With this approach, a fast, sensitive, and selective colorimetric detection strategy was built for Au3+ detection in aqueous environment. The detection strategy proposed relied on the use of CMC-AgNPs as a seed/catalyst, under AA support, as detection strategy for Au3+. With analyte addition, CMC-Ag@Au nanostructure is formed with distinct optical and absorption spectra property. This assay is different from other reported works where AgNPs is used as detection probe for Au3+ through basic redox reaction. To the best of our search, this is the first report of Au3+ detection based on this method.
2 Experimental section
2.1 Reagents
Carboxymethyl cellulose (CMC), degree of substitution 1.2 and molecular weight of 120 kDa, Ascorbic acid (AA) and gold (III) chloride trihydrate (HAuCl4·3H2O) were purchased from Sigma Aldrich. AgNO3 was from RCI Labscan, Thailand. NaBH4 was from LOBA CHEMIE India. Different metal salts used in the selectivity studies include: Ca(NO3)2·4H2O, FeCl3, Cr(NO3)3, HgCl2 from LOBA CHEMIE, MgCl2·6H2O and MnCl2·4H2O from QReC, KNO3 and NaNO3 from Spectrum Chem Corp USA, BaCl2, NiCl2·8H2O, CuSO4·5H2O, Al(NO3)2·9H2O and ZnSO4·7H2O are all from APS Ajax Finechem ltd., Pb(NO3)2 and CdCl2·2·.5H2O from Sigma Aldrich, CoCl2·6H2O, Fe2SO4·7H2O from Merck. The salts were used without any further purification by dissolving appropriate mass in ultra-pure water, obtained from a Millipore water purification set up.
2.2 Instruments
All absorption spectra were acquired on an Agilent 8453 UV–vis spectrophotometer. The images of the CMC-AgNPs and those after Au3+ injection, were observed using a transmission electron microscope (TEM) JOEL, JEM 2010 machine while the Field emission scanning electron microscope (FESEM) images (Apreo, FEI) was used to observe the morphology of CMC and CMC-AgNPs film. The FESEM equipment was connected to an energy dispersive X-ray spectroscopy (EDX) set-up (X Max 80, Oxford Instrument, UK). X-ray diffractogram (XRD), was profiled using a XRD diffractometer form Empyrean, with the following features: operating degree (5 to 80°) on a Cu Kα incident beam, having a wavelength of 0.154 nm and a scan speed of 70.2 s. Zeta potential and the hydrodynamic diameter (Dh) were collected on Dynamic Light Scattering (DLS) machine, Malvern ZETASIZER NANO. Appropriately diluted sample was measured into a 1 mL sized capillary cell and then inserted into the sample holder of the equipment. Each sample was run in triplicate and the equipment set for (n = 100) for each run. Nicolet FTIR/ATR iS50 from Thermo-Fisher was used for functional group elucidation, by taking wavelength between 4000 and 500 cm−1. Raman spectra were obtained using Raman microscope spectrometer, RAMANforce from Nanophoton. All photo images were acquired on a Samsung A50 Android phone.
2.3 Preparation of CMC-AgNPs
0.3 % (w/v) of CMC was prepared by dissolving appropriate weight in a beaker containing distilled water, under stirring. The mixture was further raised to 60 °C for 2 hrs to form a colorless viscous solution. The CMC solution was stored at RT overnight before use. CMC-AgNPs was synthesized based on reported work (de Lima et al., 2014), with modification. Into an aluminum foil wrapped beaker, 60 mL of 0.15 % CMC solution was measured, then 3 mL of 10 mM of AgNO3 was injected under stirring at RT, 3 mL of chilled, freshly prepared 20 mM NaBH4 was added under vigorous stirring. The solution was further stirred for I hr and then transferred into an amber bottle and stored at 4 °C before use.
2.4 Colorimetric detection of Au3+
Colorimetric detection of Au3+ using CMC-AgNPs was conducted as follows. Into a 5 mL tube, 300 µL of CMC-AgNPs was added, 1300 µL of ultra-pure water was added for dilution, followed by 150 µL of 50 mM NaOH, then 200 µL of 50 mM AA (optimal concentration) and finally, 50 µL of fresh Au3+ (with different concentrations) was injected, so that the final concentrations of Au3+ ranged from 0.00 to 150.0 µM, in 2 mL reaction volume. The mixture was vortex mixed, incubated at RT for 8 min, after which the photo images and the UV–vis absorption spectra were collected on an Agilent 8450 UV–vis spectrophotometer and Samsung A50 phone respectively.
2.5 Real sample preparation
The practical application of CMC-AgNPs/AA sensor for Au3+ detection in real sample, was demonstrated, using environmental water sample from the Chulalongkorn University. The water sample was collected in a polypropylene bottle and then refrigerated at 4 °C before use. The refrigerated water sample was removed and allowed to cool to RT. It was filtered using a 0.22-µm syringe filter, to trap out all dissolved solids. Some part of the processed water sample was submitted for ICP-MS to check if there is gold contamination. Then the other part was assessed using our CMC-AgNPs/AA colorimetric probe, by spiking appropriate concentrations of Au3+. The accuracy of the probe was expressed as percent recovery, using the equation,
Recovery = (C1 – C0)/Cstd × 100 % where, C1 = concentration of spiked, C0 = concentration of unspiked sample and Cstd is the concentration of added standard.
3 Results and discussion
3.1 Synthesis of CMC-AgNPs
In this work, we selected CMC as a stabilizer and NaBH4 as the reductant to obtain a very stable CMC-AgNPs with very small particle sizes, since NaBH4 is a very strong chemical reductant of metal salts. The choice of AgNPs with very small sizes, realized through NaBH4 adoption for synthesis is based on the direct correlation between catalytic proficiency of nanoparticles and their sizes, as reported (Zhou et al., 2010). The addition of aqueous NaBH4 to a mixture of CMC and AgNO3 at RT under stirring, generated a sparkling yellowish CMC-AgNPs. The concentrations of Ag+ in the synthesis pot may have a strong effect on the resulting colloidal nanoparticles and was thus optimized. Adding 3 mL of 1.0, 5.0,10.0, 15.0 and 20.0 mM of AgNO3 solution to fixed 60 mL, 0.15 % CMC and 3 mL 20 mM NaBH4, the final concentrations of Ag+ in the synthesis pot are 0.045, 0.227, 0.455, 0.982 and 0.910 mM respectively. As shown in Fig. 1, the absorption intensity increases as the concentrations of AgNO3, with sparkling yellowish color, except for the first pot (Fig. 1(a) inset). There existed a sharp absorption maximum at 403 nm, which is attributed to the surface plasmon resonance band of AgNPs with small particle sizes. Further information on the stability of the colloidal solutions (containing different AgNO3 concentrations), could be obtained by plotting the absorbance at 403 and 550 nm. As depicted in Fig. 1(B), the ratio A403/A550 increases as AgNO3 concentration and then diminishes after 0.455 mM. This shows synthesis with 0.455 mM AgNO3 furnished CMC-AgNPs with the best colloidal stability, optical property and was thus selected.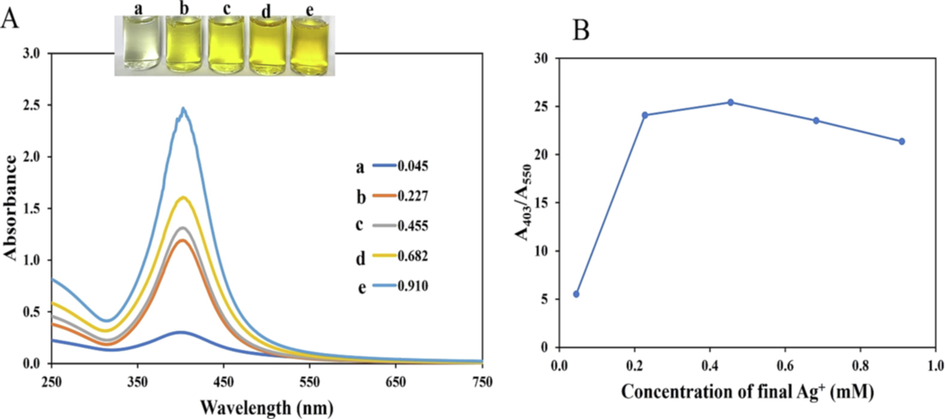
(A) UV–vis absorption spectra of CMC-AgNPs, synthesized by varying AgNO3 final concentrations at a. 0.045b. 0.227c. 0.455 d. 0.682 e. 0.910 mM, inset shows the photo images (B) Plot of A403/A550 versus the final concentrations of AgNO3.
3.2 Characterization of CMC-AgNPs
CMC and CMC-AgNPs were subjected to different instrumental characterizations to obtain information on the microstructural property of the synthesized materials. The TEM images of CMC-AgNPs, as revealed in Fig. S1, shows spherical and well dispersed images (Fig. S1(A)), while the hydrodynamic diameter from the dynamic light scattering machine (DLS), (Fig. S1(B)), showed particle sizes of 69.8 ± 2.4 nm, with zeta potential value of −17.5 ± 0.5 mV (Fig. S1(C)), attesting to the high stability of the synthesized CMC-AgNPs.
Furthermore, the interaction between biopolymer and nanoparticles was further elucidated using ATR-FTIR. Fig. 2A shows the identified peaks in CMC as: 3300, 2882, 1582, 1410, 1320 and 1010 cm−1. These peaks are assigned to the O—H stretching, C—H stretching, C⚌O asymmetric stretching vibration, CH2 scissoring, C—O bending vibrational peak and the C—H in-plane bending vibrational peak (Asnag et al., 2019). These peaks are all present in the CMC-AgNPs, but are further shifted, which is attributed to the interaction between CMC and the nanoparticles. Fig. 2B, shows the diffraction peaks of CMC and CMC-AgNPs. As contained, sharp peak at 21.3° is conspicuously displayed in CMC, confirming the amorphous nature of CMC biopolymer (Asnag et al., 2019). In the CMC-AgNPs (Fig. 2B), sharp peaks at 20.0, 38.6, 46.3, 64.8, 77.8° are all present. These peaks are assigned to amorphous CMC and (1 1 1), (2 0 0), (2 2 0) and (3 1 1) face-centred cubic (fcc) crystalline plane of AgNPs. This shows the CMC-AgNPs is reflective of the constituting materials-CMC and the in-situ generated AgNPs. To show, the impact of AgNPs impregnation in CMC matrix, FESEM images of CMC film before and after nanoparticles synthesis were acquired. Fig. 2(C), shows the polymer morphology were smooth without no observable patches, while after AgNPs deposition in the CMC-matrix using NaBH4 based chemical synthesis, white patches of AgNPs could be clearly observed immobilized in CMC polymer matrix (Fig. 2(D)). Moreover, the particles are spherical and dispersed, in consonance with the TEM images above.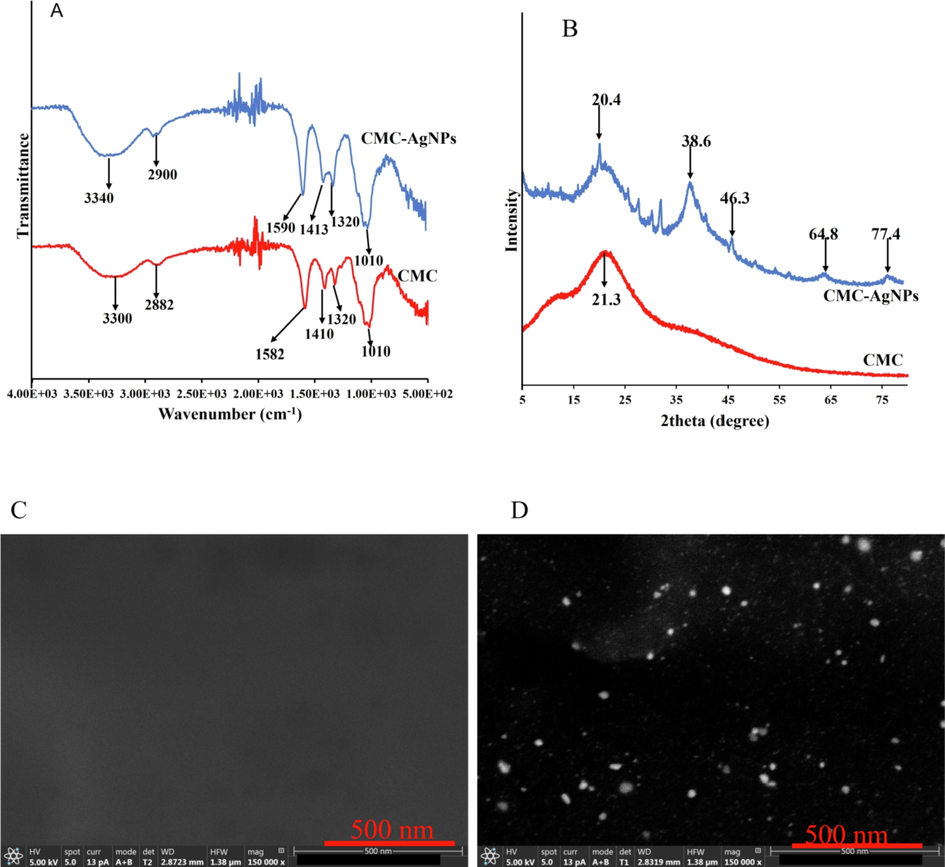
(A) ATR-FTIR spectra (B) X-ray diffractogram (XRD) of CMC and CMC-AgNPs. FESEM images of (C) CMC film (D) CMC-AgNPs.
The EDS spectra of CMC-AgNPs is displayed in Fig.S2. The identified elemental composition includes C, O, Na, and Ag, which validated the attachment of AgNPs in CMC matrix.
Raman analysis is another reliable analytical tool for probing biopolymers’ interaction. As shown in Fig. S3, sharp peak at 1106.4 cm−1 is observed in CMC, which is attributed to the C⚌O stretching vibration (Devi et al., 2020). This peak increased to 1181.4 cm−1, in CMC-AgNPs, with the introduction of other notable peaks, arising from the interaction of CMC with AgNPs, in support of the result from ATR-FTIR.
3.3 Colorimetric detection of Au3+ using CMC-AgNPs
Metal nanoparticles (MNPs) attraction by scientists in analytical detection continue to gain tremendous acceptability due to their high extinction coefficients, far exceeding those of commonly available fluorophores. Consequently, they have higher absorbing properties (Paramelle et al., 2014). The detection of Au3+, proposed in this work was conceptualized by linking the formation of red/purple of AuNPs, in the presence of reducing agent, with Au3+ detection. Since the highlighted color above is characteristic of AuNPs only, thus the proposed method is expected to benefit from high selectivity, since only gold nanoparticles is known to shows purple/red color with absorption spectra around 520–550 nm (Krajczewski et al., 2017). Thus, in this assay we adopted AA-an efficient biological reducing agent as the complementary external reducing agent, with CMC-AgNPs as the seed. As metal nanoparticles generally exhibit good catalytic properties (Santos et al., 2012), we believe the CMC-AgNPs will serve as catalyst to promote the reduction of AA in the reaction pot after the analyte (Au3+) addition. Fig. 3 shows the interaction between CMC-AgNPs, NaOH, AA on the analyte detection. The absorption spectra of CMC-AgNPs with sharp peak at 403 nm is displayed (Fig. 3(a)), with light yellowish color (Fig. 3(a) inset. The addition of NaOH to CMC-AgNPs for pH adjustment did not induce any significant change in the absorption spectrum (Fig. 3(b)), but a slight color change (Fig. 3(b) inset). The addition of Au3+ to CMC-AgNPs and NaOH led to an immediate color fading to colorless. This is due to the redox reaction between Au3+ and Ag0. The standard reduction potential of Au3+/Au0 is 0.99 V, while that of Ag+/Ag0 is 0.80 V. Accordingly, Au3+ can induce the oxidation of AgNPs with the generation of Au0. Since the Hg2+/Hg0 standard reduction potential is 0.85 V, also higher than that of Ag, Hg2+ can also induce oxidation of CMC-AgNPs, while also forming Hg0 (Sakly et al., 2017). As a result, designing a colorimetric detection of Au3+ using only CMC-AgNPS would be difficult to accomplish, owing to the high possibility of Hg2+ interference effect. This reality encouraged us to tune CMC-AgNPs based assay, with the use of AA as an external reducing agent. As can be seen, the addition of AA to CMC-AgNPs and NaOH solution imparted absorption spectra increment (Fig. 3(d)), with a slightly more yellowish color, compared to CMC-AgNPs (Fig. 3(d) inset). However, the addition of Au3+ to CMC-AgNPs, NaOH, AA aqueous mixture, resulted in the formation of another peak at 540 nm, which is characteristics of localized surface plasmon resonance peak of small sized AuNPs (Fig. 3(e)), with ruby red color (Fig. 3(e) inset). From the foregoing, it can be emphasized that CMC-AgNPs/AA shows fast response to Au3+, while forming naked eyes recognizable colors, that can be used to distinguish the analyte detection from other multifarious metal ions.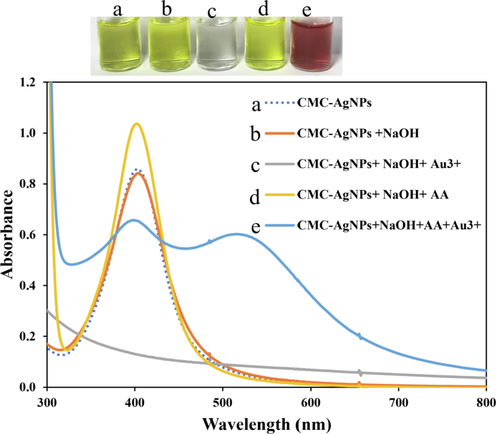
Investigation of CMC-AgNPs and AA effects, on colorimetric detection of Au3+ (80.0 µM final concentration) in solution.
Since the concentration of AA in the final reaction pot, and the incubation time, will play significant factors in determining the overall sensing response, these parameters were thus optimized.
3.3.1 Optimization of detection parameters
The effect of AA concentrations, in the detection system was optimized, by varying from 0.25 to 10.0 mM, keeping Au3+ concentration at 80.0 µM. Fig. 4(A), shows the absorption spectra, where a progressive decrease in the absorption intensity at 403 nm diminishes with an emergence of another peak at 540 nm. The photo images equally showed color changes from yellow to ruby red at 5.0 mM and beyond (Fig. 4(A)inset). The plot of A540/A403 against AA concentration is displayed in Fig. 4(B). Accordingly, the ratio increased sharply as AA concentration and peaked at 5.0 mM. This shows there is an AA concentration saturation at 5.0 mM, and thus was selected for subsequent study.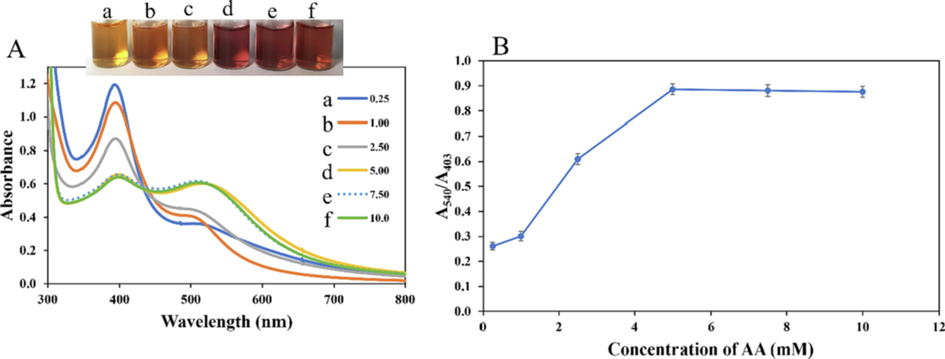
(A) UV–vis absorption spectra of CMC-AgNPs probe, under different concentrations of AA, while keeping Au3+ concentration at 80.0 µM, inset shows the photo images of a. 0.25b. 1.00c. 2.50 d. 5.00 e. 7.50f. 10.0 mM AA (B) Plot of A540/A403 vs AA concentrations.
Appropriate incubation time is important in nanomaterials-based detection to allow for adequate reaction between the analyte and other reacting species. As shown in Fig. S4, the reaction mixture was monitored under three different concentrations of Au3+ at 5.0, 40.0 and 100.0 µM, at 2 min interval. As can be seen, the plot of A540/A403 against Time, revealed a fast reaction time with saturation at about 8 min, which was thus selected for all studies.
3.4 Analytical performance of CMC-AgNPs/AA probe
3.4.1 Sensitivity
The sensitivity of CMC-AgNPs/AA nano sensor for Au3+ detection was investigated under the optimal detection conditions. In a 2 mL reaction solution, the addition of pH adjusted CMC-AgNPs, AA and Au3+, with subsequent vortex mixing and RT incubation for 8 min, a concentration dependent response (naked eye observation) and UV–vis absorption changes were realized. Fig. 4 shows the effect of consistent increment in Au3+ concentration from 0.00 to 150.0 µM, on CMC-AgNPs/AA probe. As can be observed, the light-yellow color of CMC-AgNPs/AA, gradually changed to dark yellow, orange, ruby red and purple red color as the concentrations of Au3+ increases in the reaction pot (Fig. 5(A)). Fig. 5(B) shows the absorption spectra of CMC-AgNPs/AA under different concentrations of Au3+ ranging from 0.00 to 150.0 µM. As depicted, the absorbance at 403 nm diminished progressively, with the emergence of another at longer wavelength (540 nm), which is attributed to the formation of small sized AuNPs in the reaction pot, deposited on the CMC-AgNPs seed colloidal solution. The plot of A540/A403 against Au3+ concentrations from 0.00 to 150.0 µM, is revealed in Fig. 5(C), with linear range from 0.25 to 100.0 µM. The absorbance ratios (A540/A403) perfectly summed up the analytical response of this assay. The higher the A540/A403 ratio, the higher the AuNPs formation in solution and the more deviation from light yellow color. The calibration plot can be fitted into the equation Y = 0.0108X – 0.006 or A540/A403 = 0.0108[Au3+] – 0.006, with R square value of 0.9937. The limit of detection (LOD) and limit of quantification (LOQ) were calculated using the equations, 3.3xSy/x /slope and 10x Sy/x /slope. Sy/x represent the standard deviation of the regression, and the slope is obtained from the calibration plot (ICH,1996). The LOD and LOQ, was thus estimated as 0.061 and 0.185 µM, respectively.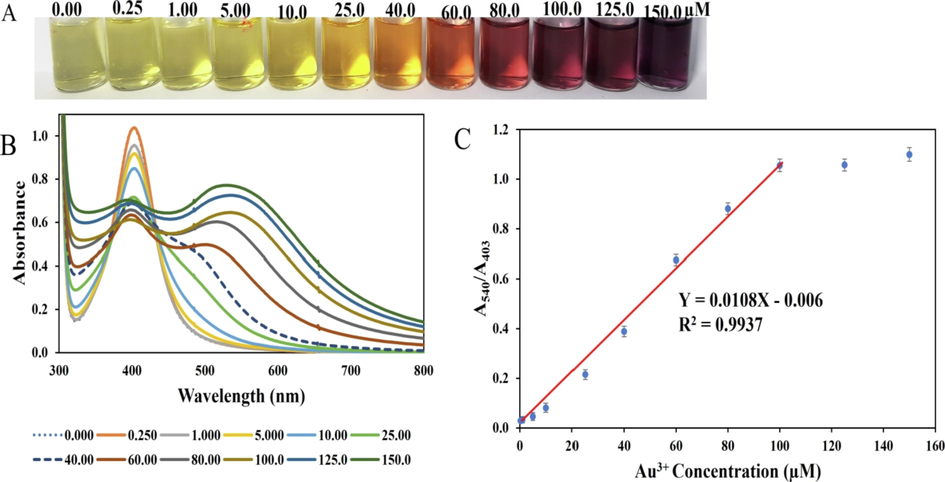
(A) Photo images of CMC-AgNPs/AA optical probe, in response to Au3+ concentrations from 0.00 to 150.0 µM (B) UV–vis absorption spectra of CMC-AgNPs/AA when charged against Au3+ concentration from 0.00 to 150.0 µM (C) Plot of A540/A403 against Au3+ concentration from 0.00 to 150.0 µM, showing linearity between 0.25 and 100.0 µM.
The analytical features of the CMC-AgNPs/AA probe towards Au3+ detection was compared with reported methods and presented in Table 1. As observed, the LOD and linear range of the present detection strategy is comparable or better than previous works (Chen et al., 2018; Gao et al., 2019; Megarajan et al., 2019; Tantubay et al., 2021). While it may be quite challenging applying some of the fluorescence-based assays in water, the present assay is fully operational in an aqueous environment. It is also germane to argue from the perspective of availability and affordability between a visible spectrophotometer and a fluorimeter. Our method, which is based on UV–visible machine, as read out device, is well more affordable and cost effective than a fluorimeter that is several times more expensive. As a result, this assay can be easily replicated and applied for Au3+ monitoring in the environment, especially for economically challenged countries. The naked eye detection capacity of the present assay is far superior to other reported assays. As can be visualized, Au3+ concentration as low as 0.25 µM can be obviously distinguished from the blank sample, which further lay credence to the assaýs high sensitivity. FSN-AuNPs = Fluorosurfactant-capped gold nanoparticles; Ag/NCNPs = Silver/Nitrogen-doped Carbon nanoparticles; N10TM-AgNPs = N-deconyltromethamine functionalized silver nanoparticles; HCD & OCD carbon dots = Hydrophilic and organophilic carbon dots; NeCDs = Neem seed derived carbon dots; N—S Cdots = Nitrogen-sulfur co doped carbon dots; GO-PVA = Graphene Oxide-Poly(vinyl alcohol) Hybrid; NA = Not available.
Detection methods/ probe
Limit of detection LOD (µM)
Linear range (µM)
Reference
Electrochemistry [Oligo-adenin nucleotide]
0.050
0.00 – 0.600
(Wu and Lai, 2016)
Fluorimetry [phosphorus-Cdots]
5.86
6.00 – 1000.0
(Chen et al., 2018)
Fluorimetry [GO-PVA]
NA
0.00 – 300.0
(Kundu et al., 2012)
Fluorimetry
0.070
0.00 – 60.0
(Kambam et al., 2015)
Fluorimetry [N—S Cdots]
0.063
50.0 – 750.0
(Sharma et al., 2018)
Fluorimetry [NeCDs]
0.016
0.00–25
(Raji et al., 2022)
Fluorimetry [HCD & OCD carbon dots]
3.35
0.00 – 80.0
(Gao et al., 2019)
Colorimetry [N10TM-AgNPs]
3.53
3.33–50
(Megarajan et al., 2019)
Colorimetry [Ag/NCNPs]
0.160
0.10 – 2.20
(Tantubay et al., 2021)
Colorimetry [FSN-AuNPs]
0.050
0.10 – 2.50
(Yang et al., 2013)
Colorimetry [CMC-AgNPs/AA]
0.061
0.25–100.0
This work
We further investigated the possible mechanistic basis of CMC-AgNPs/AA probe for Au3+ detection, as follows.
With the use of NaBH4 (a strong chemical reductant), for the synthesis of CMC-AgNPs, rapid reduction of AgNO3 was realized and further validated with the absorption maximum at 403 nm. Thus, the nanoparticles are impregnated in the biopolymer matrix, as shown in Scheme 1. The addition of NaOH solution for pH adjustment, AA-as external reductant, followed by the analyte (Au3+), then vortex mixing and allowing RT incubation. A progressive color perturbation was observed, that is dependent on the concentration of Au3+ ion added. We propose that the CMC-AgNPs could act as seed material, upon which AA can reduce the added Au3+, to form Ag@Au nanostructure, inside CMC matrix i.e. (CMC-Ag@Au nanostructure). The formation of CMC-Ag@Au nanostructure is marked with naked eye observable color changes, that is proportional to the Au3+ concentrations. At the low concentration of Au3+, small Au shell is formed, consequently, the optical property of the nanomaterial is reflective of AgNPs core (yellowish color), Scheme 1, image A. However, at high concentration of the Au3+, an immediate yellow color fading of CMC-AgNPs to colorless was observed, then to ruby red or purple red within 8 min. This observation can be explained, based on the formation of high Au shell on CMC-AgNPs core, consequently, Au shell dominate the characteristic color of the formed nanomaterial, hence the strong purple color of AuNPs is observed, Scheme 1, image B.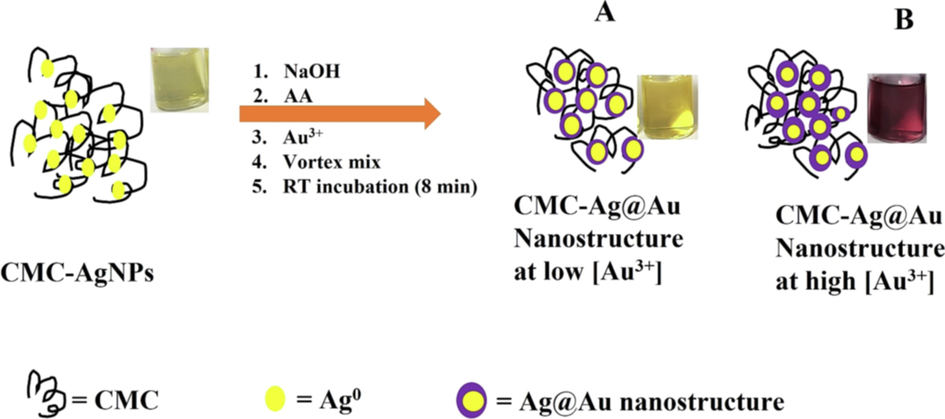
Mechanism of CMC-AgNPs/AA based optical nanoprobe for Au3+ detection in solution.
To buttress the proposed mechanism, we acquired the TEM images, DLS and zeta potential, of CMC-AgNPs under different Au3+ treatment, as presented in Fig. 6. The TEM images (Fig. 6(A)) and DLS (Fig. 6(D)) of CMC-AgNPs/AA when treated with no Au3+, i.e., blank sample, showed monodispersed morphology, with particle diameter of 80.6 ± 2.5 nm. However, with Au3+ injection at 40.0 µM, the TEM image showed spherical particles with decreased morphology (Fig. 6(B)) and an average particle size of 55.5 ± 4.3 nm (Fig. 6(E)). The same trend was observed when Au3+ concentration was maintained at 100.0 µM (Fig. 6(C)), while the hydrodynamic size was 45.2 ± 3.5 nm (Fig. 6(F)). The above validated the proposition that at high concentration of Au3+, Au shell dominates the optical property of the generated CMC-Ag@Au nanostructure.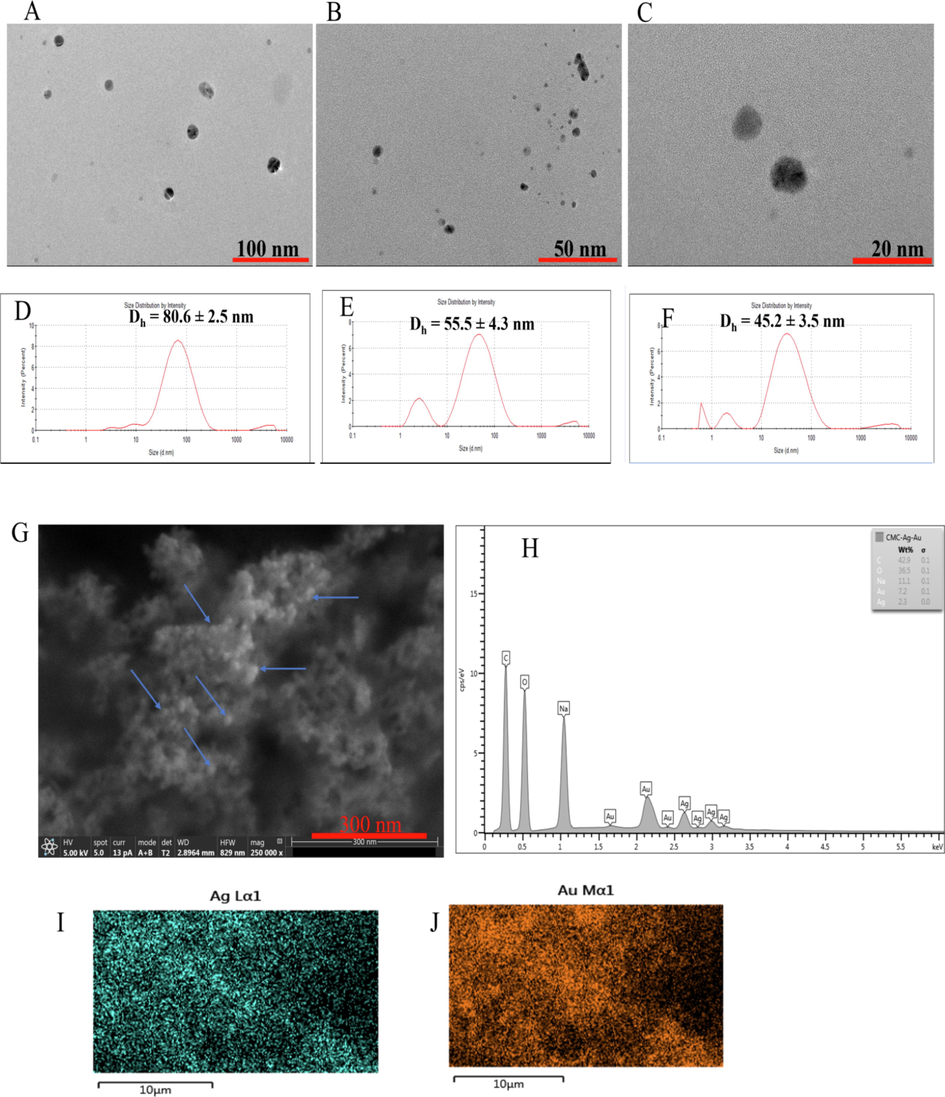
TEM images of (A) CMC-AgNPs/AA probe; CMC-AgNPs/AA probe on addition of (B) 40.0 µM (C) 100.0 µM Au3+. (D), (E) and (F) are the hydrodynamic diameters from DLS corresponding to the samples (A) (B) and (C) from TEM (G) FESEM image of CMC-AgNPs/AA after Au3+ injection at (60.0 µM) (H) EDS Spectrum of CMC-AgNPs/AA after Au3+ injection at (60.0 µM), Elemental mapping showing Ag (I) and Au (J).
The zeta potential of Au3+ addition to CMC-AgNPs/AA at 0.00, 40.0 and 100.0 µM is depicted in Fig.S5. Accordingly, the zeta values are quoted at −26.0 ± 2.4, −24.2 ± 1.0 and –23.6 ± 1.1 mV, respectively. This shows the particles are all very stable, though with a decreasing stability from CMC-AgNPs/AA to the Au3+ treatment at 100.0 µM.
We further investigated the microstructural property of CMC-AgNPs/AA after Au3+ addition at 60.0 µM, by centrifuging the solution and thereafter freeze drying afterwards. The FESEM image as shown in Fig. 6(G) at very high magnification confirmed the formation of spherical nanomaterials, marked with blue arrows, inside the CMC polymer matrix. The EDS spectrum confirmed the presence of elements, such as C, O, Ag and Au (Fig. 6(H)), with higher percentage of Au than Ag (Fig. 6(H)inset). The elemental mapping revealing Ag and Au elements are shown in Fig. 6(I) and (J)), respectively. These observations finally maintained that AA reduced Au3+ to AuNPs inside CMC polymer matrix, with concomitant formation of CMC-Ag@Au nanostructure proportionate to Au3+ concentration injected in the reaction solution.
3.4.2 Precision
Precision is another important analytical parameter of interest in method development. It is a measure of repeatability and reproducibility of measurements, expressed in relative standard deviation (RSD%). We acquired the UV–vis spectra of Au3+ injection at 5.0 and 80.0 µM (high and low concentrations), on CMC-AgNPs/AA for (n = 10) to represent intra-day precision and at three consecutive days as inter-day precision. RSD of 1.3 and 3.6 % were obtained which shows the detection strategy can be easily replicated, at the optimal conditions, without significant variability.
3.4.3 Selectivity
Selectivity of the CMC-AgNPs/AA probe towards Au3+ was demonstrated by charging different common metal ions (Ca2+, Mg2+, Mn2+, Zn2+, K+, Na+, Ba2+, Ni2+, Ca2+, Al3+, Cr3+, Pb2+, Co2+, Cd2+, Fe2+, Fe3+, Hg2+, Ag+ and Au3+), all at 60.0 µM, similar to previous reports (Bhamore et al., 2021; Shellaiah et al., 2016), then acquiring the photo images and the UV–vis absorption spectra. It is apposite to state here that a 1:1 ratio between the analyte and interfering metal ions, maintained in this work, may be unrealistic in real sample situation, as the interfering may occur at much higher concentrations. As shown in Fig. 7(A), only the presence of Au3+ could furnish a ruby red color, in comparison with other metal ions. However, Ag+ generated deep yellowish color, while Hg2+ induced color change to colorless. This is further revealed in Fig. 7(B), where the UV–vis spectra clearly underscored that only Au3+ induced red shift in CMC-AgNPs/AA spectra with a sharp peak at 540 nm. Ag+ (Fig. 7(B)blue line), showed peak increment at 403 nm, which may be due to the reduction of Ag+ to more AgNPs, that is further deposited on the CMC-AgNPs seed. Hg2+ showed a blue shift, thus, the present method is capable of distinguishing between very similar metals (Au3+, Ag+ and Hg2+). The plot of A540/A403 against all metal ions tested is shown in Fig. 7(C). Only the addition of Au3+ could generate a ratio that is significantly different from the blank sample (p ≥ 0.05). Thus, tuning the CMC-AgNPs/AA probe for Au3+ detection by correlating response with AuNPs property is the major strength of this assay. Since AuNPs optical properties is specifically generated from its parent salt (Au3+). As a result, this assay showed significant selectivity when compared with other reported detection probes.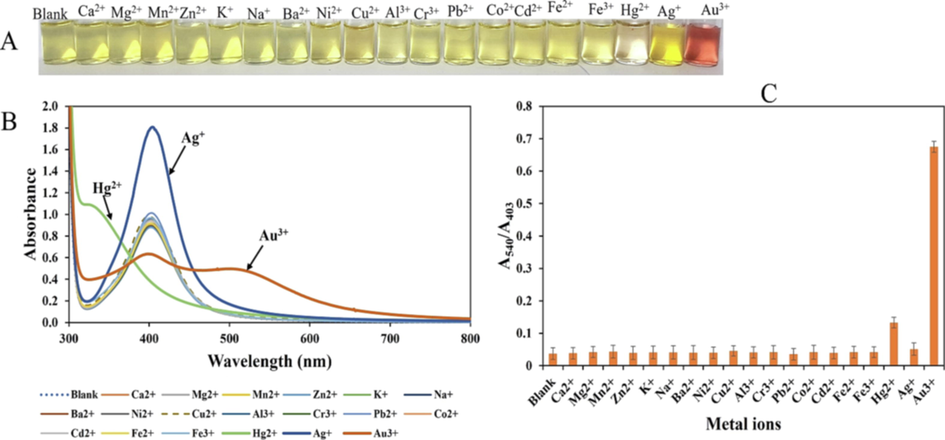
(A) Photo images of CMC-AgNPs/AA tested against possible interfering metal ions (Blank, Ca2+, Mg2+, Mn2+, Zn2+, K+, Na+, Ba2+, Ni2+, Ca2+, Al3+, Cr3+, Pb2+, Co2+, Cd2+, Fe2+, Fe3+, Hg2+, Ag+) and Au3+ all at 60.0 µM (B) UV–vis absorption spectra of CMC-AgNPs/AA charged against metal ions (C) Plot of A540/A403 against tested metal ions at 60.0 µM.
3.4.4 Real sample application
To demonstrate the practical application of the probe for Au3+ detection, wastewater sample was collected from the Chulalongkorn University campus, Thailand. Demonstration of metal ions in real water samples including, (lake water, drinking water, tap water, river water) is a common approach to investigate detection probe practicality (Li et al., 2022). The water sample was collected in a polypropylene bottle and then refrigerated in the laboratory at 4 °C. Before analysis, the sample was removed from the refrigerator and allowed to maintain RT. It was then centrifuged at 6000 rpm for 20 min to remove all particles, and further passed through a 0.22-µm syringe filter. The processed water was submitted for Au detection using ICP-OES (no Au concentration was detected), while the other part was subjected to Au3+ detection using the CMC-AgNPs/AA probe, by adopting the popular standard addition method. Here, different concentrations of Au3+ were spiked into the water sample, after which, 50 µL of the prepared samples were charged on the CMC-AgNPs/AA following the steps in section 2.4. The final concentrations of Au3+ were maintained within the linear range obtained during the calibration plot (0.25 – 100.0 µM). Fig. 8(A) shows the photo images of Au3+ spiked in wastewater sample and the unspiked sample. Accordingly, obvious color changes similar to the progression observed for the calibration plot was realized. This shows the CMC-AgNPs/AA probe can respond to Au3+ concentrations ion in complex real sample. The UV–vis absorption spectra were plotted and displayed in Fig. 8(B). The absorbance at 403 nm decreased consistently with an emergence of another peak at 540 nm, while the plot of absorbance ratios A540/A403 versus Au3+ concentration is shown in Fig. 8(C). The real sample plot furnished an equation, A540/A403 = 0.0111[Au3+] – 0.002, with R2 value of 0.9906, for Au3+ concentrations within 0.25 to 100.0 µM. We further compared the A540/A403 for the calibration plot (Std Cal) and the plot in wastewater sample (Real Samp), within the concentration range 0.25 to 100.0 µM, as shown in Fig.S6. Comparison of the responses in the two media using a two-way ANOVA, shows there existed no significant differences (P ≥ 0.05). Consequently, we estimated the accuracy of the CMC-AgNPs/AA probe towards Au3+ detection in wastewater sample using the plot from the real sample plot, by estimating the recovery at Au3+ concentrations (0.00, 5.0, 40.0 and 100.0 µM). The percent recovery, calculated using the equation stated in section 2.5, is shown in Table 2, with values ranging between 91.8 and 103.4 %, with RSD less than 4 %, validating the practical effectivity of the probe. This shows the optical probe can effectively respond to Au3+ in complex real samples.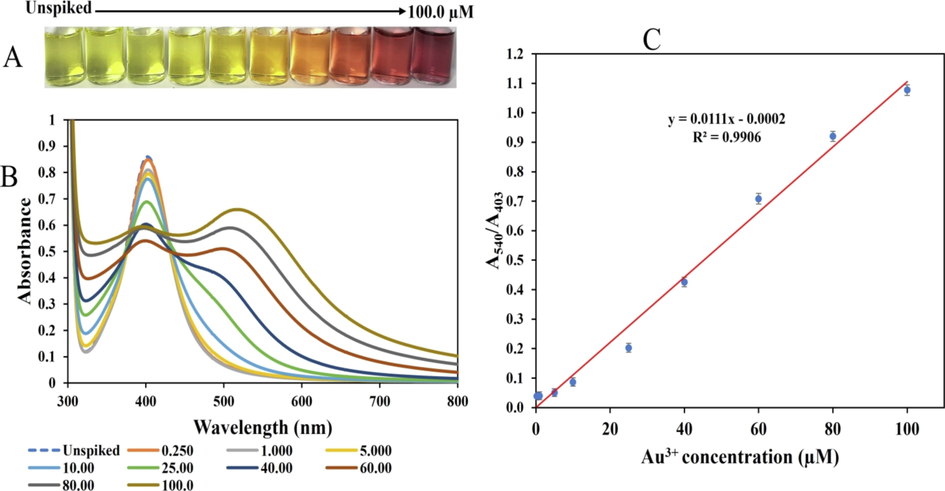
(A) photo images (B) UV–vis absorption spectra of CMC-AgNPs/AA probe applied to Au3+ detection in wastewater sample, from the unspiked sample to Au3+ concentration at 100.0 µM (C) Plot of A540/A403 vs Au3+ concentrations from 0.25 to 100.0 µM, spiked in wastewater sample.
Concentration added (µM)
Concentration estimated (µM)
Recovery (%)
RSD (%) n = 3
0.00
0.00
–
–
5.00
4.59 ± 0.12
91.8
1.8
40.0
38.28 ± 0.09
95.7
2.7
100.0
103.4 ± 0.14
103.4
3.6
4 Conclusion
In this work, a sensitive and selective colorimetric strategy was proposed for facile detection of toxic Au3+ ion in aqueous environment using CMC-AgNPs. For the realization of CMC-AgNPs with small particles size (less than10 nm), NaBH4 was used for AgNO3 reduction at RT. The synthesized CMC-AgNPs, shows sparkling light-yellow color, with absorption maximum at 403 nm. CMC-AgNPs was further supplemented or supported with AA, an effective biological reducing agent, for the in-situ reduction of Au3+ (analyte), on the preformed CMC-AgNPs seed. Thus, the addition of Au3+ to pH adjusted CMC-AgNPs, with AA addition support in the detection mixture, an efficient colorimetric probe (CMC-AgNPs/AA), was realized. The addition of different concentrations of Au3+ to the probe, resulted in RT color perturbation from light yellow, to yellow, orange, red and purple red within 8 min incubation at RT. The absorption spectra red shifted with a new peak development at 540 nm which is characteristic of small sized AuNPs, formed on the CMC-AgNPs. Consequently, CMC-Ag@Au nanostructure was proved to be formed in the detection solution. The detection approach demonstrated high selectivity in comparison with possible interfering metal ions. Linearity between 0.25 and 100.0 µM, and an estimated LOD of 0.061 µM, was realized. The practical usage of the assay was investigated using wastewater sample, through the spiked recovery method, with percent recovery between 91.8 and 103.4 % and RSD less than 4 %. Thus, without complex detection strategy, a sensitive optical probe was proposed for Au3+ monitoring in environmental samples with reliable analytical performances.
CRediT authorship contribution statement
Titilope John Jayeoye: Conceptualization, Methodology, Validation, Investigation, Formal analysis, Writing – original draft. Chamaiporn Supachettapun: Methodology, Investigation, Writing – review & editing. Nongnuj Muangsin: Resources, Writing – review & editing, Supervision.
Acknowledgement
Dr. Titilope John Jayeoye, would like to appreciate the C2F (The second century fund) Fellowship, Chulalongkorn University, Thailand, for the award of postdoctoral Fellowship and Dr. Fredrick N. Eze of the Drug delivery System Excellence Center, Faculty of Pharmaceutical Sciences, Prince of Songkla University, Hatyai, Thailand, for assistance with samples instrumental characterization.
Declaration of Competing Interest
The authors declare that they have no known competing financial interests or personal relationships that could have appeared to influence the work reported in this paper.
References
- Flame atomic absorption spectrometry determination of trace amount of gold after separation and preconcentration onto ion-exchange polyethylenimine coated on Al2O3. Arab. J. Chem.. 2014;7:770-774.
- [CrossRef] [Google Scholar]
- Green synthesis of gold nanoparticles and its effect on the optical, thermal and electrical properties of carboxymethyl cellulose. Compos. B: Eng.. 2019;172:436-446.
- [CrossRef] [Google Scholar]
- Photo-catalytic, anti-bacterial, and anti-cancer properties of phyto-mediated synthesis of silver nanoparticles from Artemisia tournefortiana Rchb extract. J. Photochem. Photobiol. B: Biol.. 2017;173:640-649.
- [CrossRef] [Google Scholar]
- Functionalization of gold nanoparticles using guanidine thiocyanate for sensitive and selective visual detection of Cd2+. Sens. Actuators B: Chem.. 2021;334:129685
- [CrossRef] [Google Scholar]
- Metabolism, toxicity, and manner of action of gold compounds in the treatment of arthritis: vii. the effect of various gold compounds on the oxygen consumption of rat tissues. J. Pharmacol. Exp. Ther.. 1945;83:275-278.
- [Google Scholar]
- Phosphorus-doped carbon dots for sensing both Au (III) and L-methionine. J. Photochem. Photobiol. A: Chem.. 2018;365:178-184.
- [CrossRef] [Google Scholar]
- Review on marine carbohydrate-based gold nanoparticles represented by alginate and chitosan for biomedical application. Carbohydr. Polym.. 2020;244:116311
- [CrossRef] [Google Scholar]
- Developing new industrial applications for gold: gold nanotechnology. Gold Bull.. 2002;35:111-117.
- [Google Scholar]
- Spectroscopic detection of glyphosate in water assisted by laser-ablated silver nanoparticles. Sensors. 2017;17(5):954.
- [CrossRef] [Google Scholar]
- Chitosan-stabilized silver nanoparticles for voltammetric detection of nitrocompounds. Sens. Actuators B: Chem.. 2014;196:39-45.
- [CrossRef] [Google Scholar]
- Spectroscopic investigation of green synthesized ZnS nanoparticles encapsulated by sodium carboxy methyl cellulose. Appl. Phys. A. 2020;126:1-11.
- [CrossRef] [Google Scholar]
- Facile colorimetric detection of Hg2+ based on anti-aggregation of silver nanoparticles. Biosens. Bioelectron.. 2014;57:139-142.
- [CrossRef] [Google Scholar]
- One-pot biofabrication and characterization of Tara gum/Riceberry phenolics–silver nanogel: a cytocompatible and green nanoplatform with multifaceted biological applications. Int. J. Biol. Macromol.. 2022;206:521-533.
- [CrossRef] [Google Scholar]
- Bright hydrophilic and organophilic fluorescence carbon dots: One-pot fabrication and multi-functional applications at visualized Au3+ detection in cell and white light-emitting devices. Sens. Actuators B: Chem.. 2019;281:905-911.
- [CrossRef] [Google Scholar]
- Determination of gold in geological samples by anodic stripping voltammetry at field locations. Chem. Geol.. 1992;102:41-52.
- [CrossRef] [Google Scholar]
- Water compatible triazole linked pyrene-C1-glucosyl fluorescent sensor for Au3+ and living cell imaging studies. J. Mol. Struct.. 2020;1202:127272
- [CrossRef] [Google Scholar]
- Colorimetric detection of Cd2+ using 1-amino-2-naphthol-4-sulfonic acid functionalized silver nanoparticles. J. Nanopart. Res.. 2016;18:1-9.
- [CrossRef] [Google Scholar]
- ICH (1996), International Conference on Harmonisation of Technical Requirements for Registration of Pharmaceuticals for Human Use, Q2B Validation of Analytical Procedures: Methodology. ICH-Q2B, 1–10.
- Biosynthesis of silver nanoparticles: a colorimetric optical sensor for detection of hexavalent chromium and ammonia in aqueous solution. Phys. E: Low-Dimens. Syst. Nanostruct.. 2018;103:367-376.
- [CrossRef] [Google Scholar]
- Synthesis and characterization of novel poly (3-aminophenyl boronic acid-co-vinyl alcohol) nanocomposite polymer stabilized silver nanoparticles with antibacterial and antioxidant applications. Colloids Surf. B: Biointerfaces. 2020. 2020.;193:111112
- [CrossRef] [Google Scholar]
- Synthesis of silver and silver@ zero valent iron nanoparticles using Chromolaena odorata phenolic extract for antibacterial activity and hydrogen peroxide detection. J. Environ. Chem. Eng.. 2021;9:105224
- [CrossRef] [Google Scholar]
- A highly sensitive and selective fluorescein-based fluorescence probe for Au3+ and its application in living cell imaging. Sens. Actuators B: Chem.. 2015;209:1005-1010.
- [CrossRef] [Google Scholar]
- Plasmonic nanoparticles in chemical analysis. RSC Adv.. 2017;7(28):17559-17576.
- [CrossRef] [Google Scholar]
- Highly fluorescent graphene oxide-poly (vinyl alcohol) hybrid: an effective material for specific Au3+ ion sensors. ACS Appl. Mater. Interfaces. 2012;4:5576-5582.
- [CrossRef] [Google Scholar]
- Red fluorescent carbon dots for sensitive and selective detection and reduction of Au3+. Sens. Actuators B: Chem.. 2022;371:132534
- [CrossRef] [Google Scholar]
- Lin, L., Peng, S., Shi, C., Li, C., Hua, Z., Cui, H., 2022. Preparation and characterization of cassava starch/sodium carboxymethyl cellulose edible film incorporating apple polyphenols. Int J. Biol Macromol. https://doi.org/10.1016/j.ijbiomac.2022.05.121.
- Losev, V. N., Parfenova, V.V., Elsuf’ev, E.V., Borodina, E.V., Metelitsa, S.I., Trofimchuk, A.K., 2020. Separation and preconcentration followed by ICP-OES and ICP-MS determination of precious metals using silica gel chemically modified with dithiocarbamate groups. Sep. Sci Technol. 55, 2659-2669. https://doi.org/10.1080/01496395.2019.1655454.
- Antimicrobial activity and inhibition of biofilm formation in vitro and on human dentine by silver nanoparticles/carboxymethyl-cellulose composites. Arch. Oral Biol.. 2020;120:104943
- [CrossRef] [Google Scholar]
- Rapid and selective colorimetric sensing of Au 3+ ions based on galvanic displacement of silver nanoparticles. New J. Chem.. 2019;43:18741-18746.
- [CrossRef] [Google Scholar]
- Mosaviniya, Kikhavani, T., Tanzifi, M., Yaraki, M.T., Tajbakhsh, P., Lajevardi, A., 2019. Facile green synthesis of silver nanoparticles using Crocus Haussknechtii Bois bulb extract: Catalytic activity and antibacterial properties. Colloid Interface Sci Commun. 33, 100211. https://doi.org/10.1016/j.colcom.2019.100211.
- A rapid method to estimate the concentration of citrate capped silver nanoparticles from UV-visible light spectra. Analyst. 2014;139:4855-4861.
- [CrossRef] [Google Scholar]
- Statistical optimization of silver nanoparticle synthesis by green tea extract and its efficacy on colorimetric detection of mercury from industrial waste water. Environ. Res.. 2022;204:111915
- [CrossRef] [Google Scholar]
- Amplified fluorescence detection and adsorption of Au3+ by the fluorescent melamine formaldehyde microspheres incorporated with N and S co-doped carbon dots. J. Hazard. Mater.. 2021;405:123978
- [CrossRef] [Google Scholar]
- Highly selective colorimetric onsite sensor for Co2+ ion detection by povidone capped silver nanoparticles. Mater. Chem. Phys.. 2021;273:125082
- [CrossRef] [Google Scholar]
- Neem seed derived green C-dots: a highly sensitive luminescent probe for aqueous Au3+ ions and nurtures green gold recovery. Colloids Surf. A: Physicochem. Eng. Asp.. 2022;641:128523
- [CrossRef] [Google Scholar]
- Enhancing performances of colorimetric response of carboxymethylcellulose-stabilized silver nanoparticles: a fully eco-friendly assay for Hg2+ detection. Sens. Actuators B: Chem.. 2017;253:918-927.
- [CrossRef] [Google Scholar]
- Santos, K. d. O., Elias, W.C., Signori, A.M., Giacomelli, F.C., Yang, H., Domingos, J.B., 2012. Synthesis and catalytic properties of silver nanoparticle–linear polyethylene imine colloidal systems. J. Phys Chem C 116, 4594-4604. https://doi.org/10.1021/jp2087169.
- Multifunctional fluorescent “Off-On-Off” nanosensor for Au3+ and S2− employing NS co-doped carbon–dots. Carbon. 2018;139:393-403.
- [CrossRef] [Google Scholar]
- Simple bare gold nanoparticles for rapid colorimetric detection of Cr3+ ions in aqueous medium with real sample applications. Sens. Actuators B: Chem.. 2016;226:44-51.
- [CrossRef] [Google Scholar]
- Sensitive detection of auric and sulphide ions using hybrid silver/nitrogen-doped carbon nanoparticles. Sens. Actuators B: Chem.. 2021;330:129276
- [CrossRef] [Google Scholar]
- Removal of heavy metal ions by poly (vinyl alcohol) and carboxymethyl cellulose composite hydrogels prepared by a freeze–thaw method. ACS Sustain. Chem. Eng.. 2016;4(5):2830-2837.
- [CrossRef] [Google Scholar]
- Electrochemical gold (III) sensor with high sensitivity and tunable dynamic range. Anal. Chem.. 2016;88:2227-2233.
- [CrossRef] [Google Scholar]
- Metal-enhanced fluorescence detection and degradation of tetracycline by silver nanoparticle-encapsulated halloysite nano-lumen. J. Hazard. Mater.. 2020;386:121630
- [Google Scholar]
- Colorimetric and visual determination of Au (III) ions using PEGylated gold nanoparticles. Microchim. Acta. 2018;185:1-8.
- [CrossRef] [Google Scholar]
- Fluorosurfactant-capped gold nanoparticles-based label-free colorimetric assay for Au3+ with tunable dynamic range via a redox strategy. Biosens. Bioelectron.. 2013;48:1-5.
- [CrossRef] [Google Scholar]
- Recent advances in surface plasmon resonance imaging: detection speed, sensitivity, and portability. Nanophotonics. 2017;6:1017-1030.
- [CrossRef] [Google Scholar]
- Size-dependent catalytic activity and dynamics of gold nanoparticles at the single-molecule level. J. Am. Chem. Soc.. 2010;132(1):138-146.
- [CrossRef] [Google Scholar]
Appendix A
Supplementary material
Supplementary data to this article can be found online at https://doi.org/10.1016/j.arabjc.2023.104552.
Appendix A
Supplementary material
The following are the Supplementary data to this article:Supplementary data 1
Supplementary data 1


