Translate this page into:
Authentication of herbal medicines from multiple botanical origins with cross-validation mebabolomics, absolute quantification and support vector machine model, a case study of Rhizoma Alismatis
⁎Corresponding authors. wanyingwu@simm.ac.cn (Wanying Wu), daguo@simm.ac.cn (De-an Guo)
-
Received: ,
Accepted: ,
This article was originally published by Elsevier and was migrated to Scientific Scholar after the change of Publisher.
Abstract
Accurate identification of the botanical origins of Rhizoma Alismatis (RA) is pivotal to its precise clinical usage. We herein present a strategy, by integrating untargeted metabolomics, data cross validation, absolute quantification, and vector machine model, for species discrimination and source recognition of Rhizoma Alismatis for the first time. An ultra-high-performance liquid chromatography/LTQ-Orbitrap mass spectrometry with precursor ions list-including data-dependent acquisition approach was developed for metabolite profiling. Holistic, continuous, and pattern recognition chemometrics could make it feasible to unveil forty-one markers, with “multi-duplicated and traceability samples comparison” cross validation to narrow down to twelve robust markers, some of which were further validated by absolute quantification. A support vector machine model was eventually developed to distinguish these two species and predict origins of commercially available varieties. This was the first report on systematic comparison and discrimination of two original species of RA. This integral strategy, in contrast to conventional approaches, renders more convincing data supporting for the discovery of multi-source chemical makers of traditional Chinese medicines (TCM).
Keywords
Rhizoma Alismatis
Alisma plantago-aquatica
Alisma orientale
Botanical origins
UHPLC/Orbitrap-MS
1 Introduction
Alisma plantago-aquatica (AP) or Alisma orientale (AO) is a perennial herb and widely distributed in marsh regions of southern China. Their dried rhizomes are important sources of Rhizoma Alismatis (RA, Chinese name Zexie), a well-known diuretic herbal medicine, and hailed as “the first choice of diuresis” attributing to the therapeutic benefits for excreting dampness, eliminating edema and for the therapy of diarrhea. A. orientale is officially adopted by Chinese Pharmacopoeia (2015 edition) as the official species of RA (Feng et al., 2021). However, A. plantago-aquatica, surprisingly occupies fairly big share of sales, reaching to 70 % in China, owning to wider cultivating areas, lower sale price (54 vs 64 yuan) and similarities of names and morphologies to A. orientale (Liu et al., 2020a). This confusion phenomenon will lead to an inconvenience in clinical practice or manufacturing of traditional Chinese medicines (TCM) products, which puts Alisma species accurate identification to be of great importance. Botanical origins of RA have always been ambiguous, owing to the analogous characteristics both in macroscopic and microscopic aspects, as well as their chemical composition. However, there was few reports to rapidly differentiate these two species and discern the origins of commercial RA samples.
Currently, metabolomics serves as a potent vehicle in the authentication of herbal medicines derived from different congeneric species, collection regions, processing technologies, even from different ages and different grades, and has harvested remarkable progress due to the ongoing development of chromatography, spectroscopy and mass spectrometry, etc. (Hu et al., 2019; Zhao et al., 2020; Meenu and Xu, 2019; Fang et al., 2020). Chromatographic fingerprint is usually used for the authentication that is acquired by thin-layer chromatography (TLC) (Tian et al., 2009; Xu et al., 2021), gas chromatography (GC) (Duan et al., 2016), especially by liquid chromatography (LC) (Liu et al., 2020b; Zhang et al., 2021b). With the popularization of sub-2 μm particles packed columns, more chromatographic methods sprung up, such as ultra-performance liquid chromatography (reversed-phase chromatography) (Tang et al., 2016; Tam Pham et al., 2021), hydrophilic interaction chromatography (HILIC) (Zhang et al., 2021c), supercritical fluid chromatography (SFC) (Tang et al., 2021), and ion exchange chromatography (IEC) (Guyon et al., 2013), and so on. On the other hand, spectroscopic technology (e.g. near infrared spectroscopy, NIR; nuclear magnetic resonance; Raman spectroscopy), by means of direct profiling, makes rapid identification possible (Huck, 2014). However, these approaches face such critical obstacles as ambiguous results and unclear of the so-called diagnostic components, even worse, it is almost impossible to draw a conclusion on various operational instruments and conditions (Wolfender et al., 2015). High resolution MS (e.g. quadrupole/time-of-flight mass spectrometry (QTOF-MS), coupled to the online chromatographic separation, have been a workhorse in source identification, comprehensive profiling and characterization of the multi-components from diverse natural products (Gao et al., 2012; Li et al., 2017; Theodoridis et al., 2012). Studies on the RA’s metabolome, geographical origins (Wu et al., 2017), chemical variations (Zhang et al., 2021a) and in vivo-metabolites by UPLC-MS (Yan et al., 2021) have been widely reported, however, no satisfactory results have been acquired in geographical origins traceability due to the unambiguity of botanical origin. One deficiency of the UPLC-MS technology is that expensive instrumentation is required, which could be, fortunately, compensated by transferring onto easily accessible instruments, for instance, HPLC, TLC or coupling with low-resolution MS (e.g. QDa) with the aid of diagnostic markers.
The purpose of our research is to develop a methodology to authenticate the botanical origin of A. plantago-aquatica and A. orientale as well as to discover the “Identification Markers” for precise identification by integrating cross-validation metabolomics, absolute quantification and support vector machine (SVM). Firstly, an optimized UHPLC/Orbitrap-MS approach was established for global metabolites profiling of ninety-nine RA samples. Then multivariate statistical analysis was performed using pattern recognition approach to probe the triterpenoid markers diagnostic for differentiating two origins of RA, which was auto-characterized by searching an in-house library by QI software. Secondly, “multi-duplicated samples” and “traceability samples” verification methods were proposed for the first time for cross-validation to obtain the robust biomarkers, as a result, twelve biomarkers for differentiating A. plantago-aquatica and A. orientale were obtained after removing unstable markers during storage or sample handing, some of which were further validated by absolute quantification. Finally, twelve most important markers were used to establish a SVM model for identifying the remaining 21 commercial samples. The workflow was shown in Fig. 1. This integration strategy, in contrast to traditional approaches, provides more convincing data supporting for the discovery of multi-source chemical makers of TCM.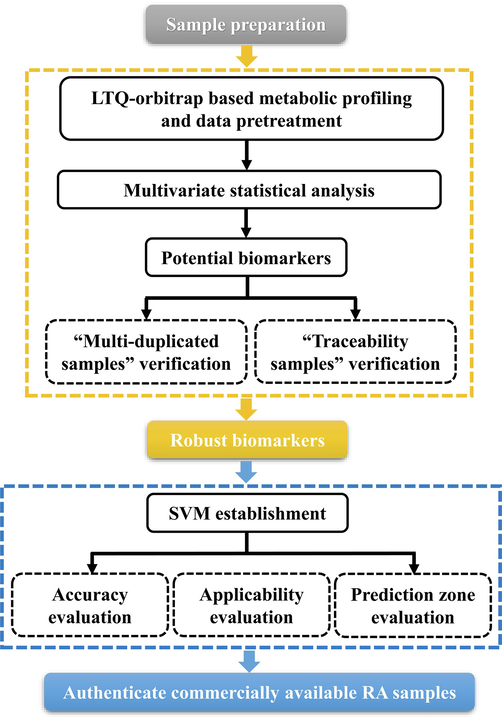
A general workflow of the strategy for differentiation and recognition of two botanical origins of Rhizoma Alismatis.
2 Materials and methods
2.1 2.1Chemical and reagents
Thirty-five authentic compounds isolated from both A. plantago-aquatica and A. orientale in our laboratory were implemented here for signal identity confirmation. The chemical structures and detailed information have been offered in Fig. S1. Formic acid and acetonitrile were provided by Merck (Darmstadt, Germany). Other chemicals used in sample pretreatment were analytical grade. Water was produced by Milli-Q water purification system (Millipore, Bedford, MA, USA). Information for the drug materials of two botanical origins of Rhizoma Alismatis has been provided in Table S1-S3, in which 31 batches of A. orientale and A. plantago-aquatica were identified by morphological identification, TLC and HPLC, and confirmed by DNA barcoding analysis; 47 batches were supplied from local Good Agricultural Practices (GAP) bases, and 21 batches were purchased from the market.
2.2 Sample preparation
The dried RA powers (80 mesh, 300 mg) were extracted with 3 mL methanol and sonicated for 30 min, and centrifuged at 14000 rpm for 10 min. The supernatant was subjected to LC-MS for analysis. QC sample was obtained by pooling equal volume of all solutions. For quantitative assay, the 0.2 g samples of RA were weighed and extracted with 10 mL of solvent, and the test solution was prepared following the same procedure.
2.3 UHPLC-Orbitrap conditions for metabolic analysis
Ultimate 3000 UHPLC system coupled with LTQ-Orbitrap Velos Pro hybrid mass spectrometer (Thermo Fisher Scientific, San Jose, CA, USA) was used for sample separation and data collection. Kinetex XB C18 column (Phenomenex, 100 × 2.1 mm, 1.7 μm) was used in this study. The gradient program of mobile phase A (0.1 % formic acid in water) and B (acetonitrile) was as follow: 0–5 min: 35 %B; 5–30 min: 35–78 %B; 30–35 min: 78–95 % B; 35–39 min: 95 %(B). Other conditions: flow rate, 0.3 mL/min; injection volume, 2 μL; column temperature, 30℃; autosampler temperature, 10 °C. MS was carried out in the positive-ion ESI-MS mode with the mass range m/z 50–1200. The other operating parameters were optimized as follows: spray voltage, 3.8 kV; capillary temperature, 350℃; source heater temperature, 300℃; sheath gas (N2), 40 arbitrary units; auxiliary gas (N2), 10 arbitrary units; and sweep gas (N2), 2 arbitrary units. As for the targeted MS/MS spectra of possible metabolites, a combined scan method, namely CID/MS2 (35 %) and HCD/MS2 (45 %) with dynamic exclusion enabled was used. Dynamic exclusion parameters were set as follow: repeat count, 2; repeat duration, 10 s; exclusion list size, 50; and exclusion duration, 10 s; exclusion mass width low and high, 1.5 Da.
2.4 Multivariate statistical analysis and discriminant analysis
Raw data filtering, peak detection, peak alignment were conducted by using Progenesis QI 2.1 software (Waters, Milford, USA). Next, the processed data that consists of tR, m/z value, and the normalized intensity was subjected to SIMCAP software (version 14.0, Umetrics, Umea, Sweden) for principal components analysis (PCA) and orthogonal partial least squares discriminant analysis (OPLS-DA). Pareto scaling (Par) was performed. The potential makers for the discrimination between AP and AO were filtered out when VIP > 4.0. An intelligent discriminant model, SVM, was established based on twelve most important chemical markers (including alisol B 23 acetate, alisol C 23 acetate, 16-oxoalisol A, alisol A, alisol B, alisol A 24 acetate isomer, alisol C, alisol P isomer, 11-deoxyalisol C 23 acetate, C34H43O8(579.2938), C25H33O7N2 (579.2938), C30H48O8(535.3279) by using Chempattern Ultimate 1.0 software (Chemmind Technologies, Beijing), to authenticate the remaining unknown RA samples.
2.5 UHPLC-Q-trap MS based quantitative assay of eight abundant compounds
Agilent 1290 Infinity UHPLC system was connected to the 4000QTrap mass spectrometer via an ESI interface. Mobile phase A (waters containing 0.1 % formic acid) and B (acetonitrile) were used as elution solvent at a flow rate of 0.4 mL/min, with the program of 0–5 min:35 %B; 5–10 min: 35–45 %B; 10–25 min: 45 %B; 25–30 min: 45 %-78 % B; 30–34 min: 78 %-95 %B; 34–39 min: 95 %B. Other chromatographic conditions were the same as those used in 2.3. The quantitative method was validated in our previous report (Wu et al., 2017), and quantitative product ion and collision energy of each analyte were provided in Table S4.
3 Results and discussion
3.1 Metabolic analysis and data pretreatment
A total of ninety-nine batches of samples were analyzed in the analytical sequence. Stability was evaluated by analyzing QC samples in every-six injections to diminish the analytical variation resulting from system instability. Before the established untargeted method was used to carry out a metabolomics study, the intraday and interday repeatability were evaluated by testing QC samples in the same day for six times and three consecutive days. The results showed that, in the intra/inter-day precision validation, the RSD values of eight representative compounds varied from 0.01 % to 0.02 % and 1.90 % to 6.42 %, suggesting a good precision of this method (See Table S5-S6). Initial pre-processing of raw full MS data was carried out utilizing Progenesis QI 2.1 software. Multiple adducts ions, including [M + H]+, [M + Na]+, [M + CH3CN]+, [M + H-H2O]+, [2 M + Na]+, [2 M + H]+, [M + K]+, [M + NH4]+ were selected or self-edited to achieve the fusion of precursor ions. [M + H-2H2O]+, [M + H-3H2O]+, [M + H-HAC]+, [M + H-HAC-H2O]+, [M + H-HAC-2H2O]+, [M + H-C4H10O2]+, [M + H-C4H10O2-H2O]+, [M + H-C6H10O2]+, [M + H-C6H10O2-H2O]+ ions were also added considering the severe in-source decay. Finally, a matrix involving tR, m/z, and normalized peak area were obtained after centroid peak detection, peak alignment and normalization.
The generated data matrix containing 20,194 metabolite features was further processed by following steps:1) Features with odd nominal mass of m/z were initially ruled out, by the reason that no nitrogen atom has been reported in common chemical components of RA. 2) Filter the ions without neutral loss due to the high frequency of in-source decay in triterpenoids. 3) “80 % rules”, by removing features that not existed in 80 % samples, and “30 % rules”, detecting unstable ions with RSDs>30 % in all QC samples, were utilized to filter the variables appeared by accident or unstable response. The finally obtained 7602 variables were imported into the SIMCA-P 14.1 software for pattern recognition chemometrics.
3.2 Chemical marker discovery for differentiating two botanical origins
The MSE data of samples confirmed by DNA barcoding analysis (involving 24 batches of AP and 7 batches of AO) were statistically analyzed by PCA and OPLS-DA. For PCA, QC samples were gathered in one area which indicated the instrument to be in a good condition (Fig. 2A). To explore potential markers that were largely devoted to the difference in the authentication of AO and AP, OPLS-DA and VIP plots were used. As seen in Fig. 3A, the samples of RA identified by DNA barcode were well gathered and segregated into two different groups scattering in different quadrants. The values of R2 (0.951) and Q2 (0.821) demonstrated acceptable fitness and predictability. A chance permutation test suggested the model was not over-fitting (Fig.S2). The variables showing VIP > 4 were considered as potential biomarkers, and resultantly, 41 potential biomarkers were discovered and identified (Table S7). The main metabolites confirmed by reference compounds (NMR) or LC-MS in two botanical origins were traced back to the fingerprint spectra (Fig. 2C), and significant difference was observed at 3–10 min, 16–18 min and 23–25 min (Fig. 2B).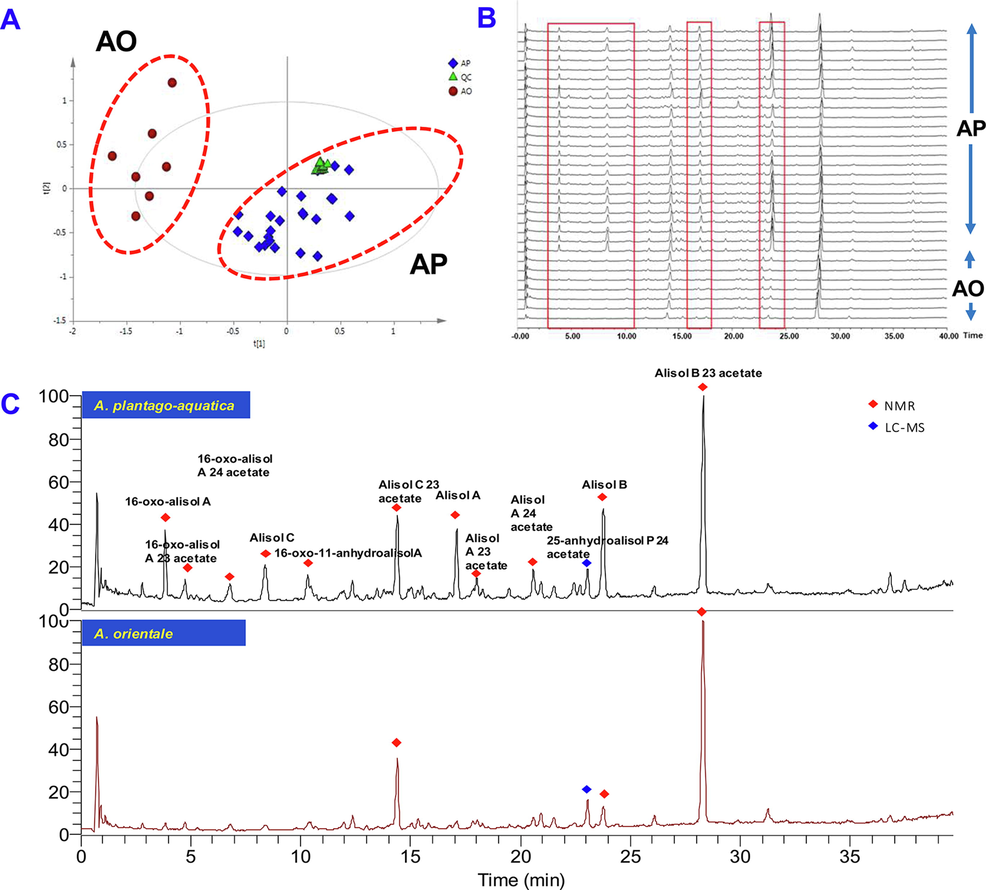
PCA score plot (A), base peak ion chromatograms (B) and main chemical components (C) of A.plantago-aquatica and A.orientale identified by DNA barcoding analysis.
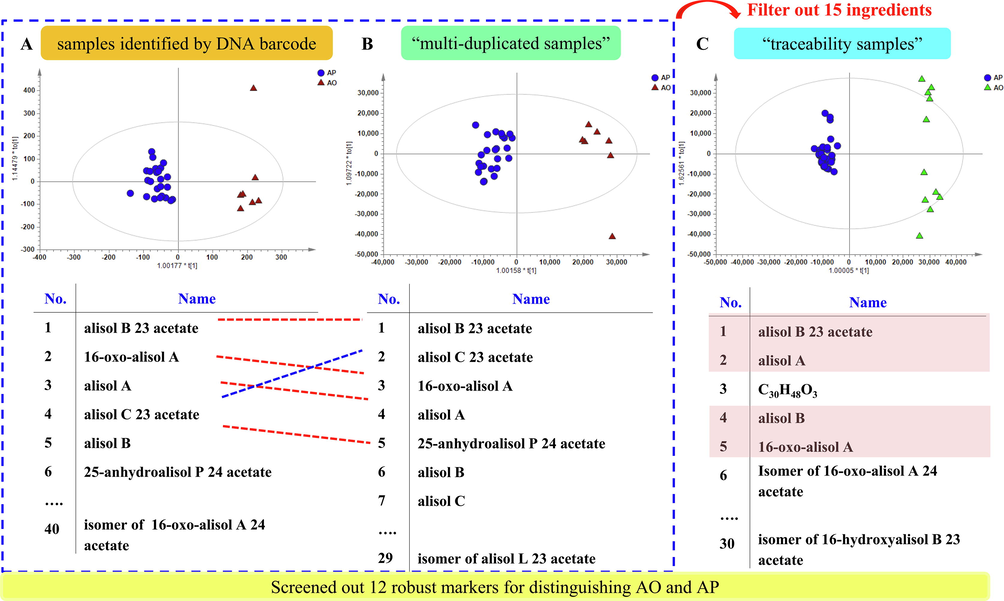
OPLS-DA score plot and screened markers of A. plantago-aquatica and A. orientale in samples identified by DNA barcode (A), “multi-duplicated samples” (B) and “traceability samples” (C).
3.3 “Multi-duplicated and traceability samples comparison” cross validation
Robust markers are needed, especially for those samples that are detected in different instrument conditions or larger sample application, to distinguish different species in production and sales and to differentiate the authentic samples from the adulterant ones. Due to the instable signals of chemical constituents in different runs, it was virtually impossible to acquire the data again to MS spectrum signal of the crude extract. “Multi-duplicated samples”, by repeatedly acquiring MS data in a long interval of time (4 months), can screen out the difference biomarkers with better durability and avoid interference caused by the instrument. On the other hand, “traceability samples” directly collected from the origin base, some of which were not verified by DNA barcode due to the impossibility to extract desired DNA fragments from those RA products, were used for further verification. In total, three groups of samples, “DNA barcode samples” (31batches), “multi-duplicated samples” (31batches) and “traceability samples” (46 batches) were utilized to unravel the robust chemical markers to distinguish A. plantago-aquatica and A. orientale, and the results were shown in Fig. 3.
Despite the similar PCA and OPLS-DA results obtained from “multi-duplicated samples”, chemical markers were different. Five differential ions were screened when the VIP cutoff was set at 10.0 (Table S8), which was consistent with section 3.2 except alisol B and 15,16-dihydroalisol B 23 acetate with VIP > 8 (Fig. 3B). This, along with the situations previously discussed, led to a conclusion that alisol B 23 acetate, alisol C 23 acetate, 16-oxoalisol A, alisol A, 25-anhydroalisol P 24 acetate, alisol B and 15,16-dihydroalisol B 23 acetate were the seven most important chemical markers. Twenty-four additional ions were screened when the VIP cutoff was set at 4 to 10, less than the those from “DNA barcode samples”, removing 15 compounds with poor durability ultimately.
For “traceability samples” evaluation, although A. plantago-aquatica and A. orientale were clearly clustered, the PCA and OPLS-DA showed differences owning to the large distinction of samples (Fig. 3C). Based on VIP plot, we were able to identify five potential markers by setting VIP cutoff at 10.0 (Table S9), amongst these differential ions, only four ions (alisol B 23 acetate, alisol A, alisol B, 16-oxoalisol A) were observed in “multi-duplicated samples” evaluation. Thus five markers were confirmed to be the most important ions by cross validation, taking alisol C 23 acetate (VIP > 8) into account. Yet it was worth noting that the markers with 10 > VIP > 4 were extremely different from those obtained from “multi-duplicated samples”, with 7 out of 27 were the same (Table S8), indicating that the sample has a greater impact on marker screening than the instrument status.
While considering “DNA barcode samples” (31batches), “multi-duplicated samples” (31batches) and “traceability samples” (46 batches), we finally concluded that, twelve major markers (including alisol B 23 acetate, alisol C 23 acetate, alisol B, 16-oxoalisol A, alisol A, alisol A 24 acetate isomer, alisol C, alisol P isomer, 11-deoxyalisol C 23 acetate, C34H43O8(579.2938), C25H33O7N2(579.2938), C30H48O8 (535.3279), could be selected as the associated markers applicable to differentiate between A. plantago-aquatica and A. orientale (Fig. 3).
3.4 Verification of chemical markers by targeted LC-MS/MS analysis
Among the twelve robust markers screened above, six markers were identified with the reference substances. The reliability of the twelve markers were further verified by two-way hierarchical clustering analysis (HCA). As shown in Fig. 4A, the samples were directly segregated in two clusters based on remarkable differences of twelve markers. To further verify the credibility of the markers, absolute quantification by LC-MS/MS was adopted. MRM experiments of eight compounds were performed by Q-trap mass spectrometry under the described condition in our previous investigation (Wu et al., 2017). MRM precursor and product ions, and EP, DP, CE, CXP mass spectrometry parameters of eight reference compounds were shown in Table S4. MRM chromatograms were displayed in Fig. 4B, and assay results were in Fig. 4C. The results showed that alisol B 23 acetate was the most abundant compound, followed by alisol B, alisol C 23 acetate, alisol A, alisol A 23 acetate, alisol G and 16-oxo-11-anhydroalisol A and alisol F 24 acetate. The two chemical components with the highest content in AO and AP were alisol B 23 acetate and alisol C 23 acetate, however, no significant difference was observed, speculating that the content of alisol B 23 acetate and alisol C 23 acetate themselves could not be directly used as distinguishing markers. Alisol A 24 acetate and alisol F 23 acetate also showed no difference between A. plantago-aquatica and A. orientale, which was constant with screening results. In addition, it was found that alisol A and alisol B, alisol G and 16-oxo-11-anhydroalisol A were significantly different among different botanical origins, and the latter two were not screened out in above metabonomics mainly because of their lower contents. The sum of eight compounds in AP was significantly higher than that in AO.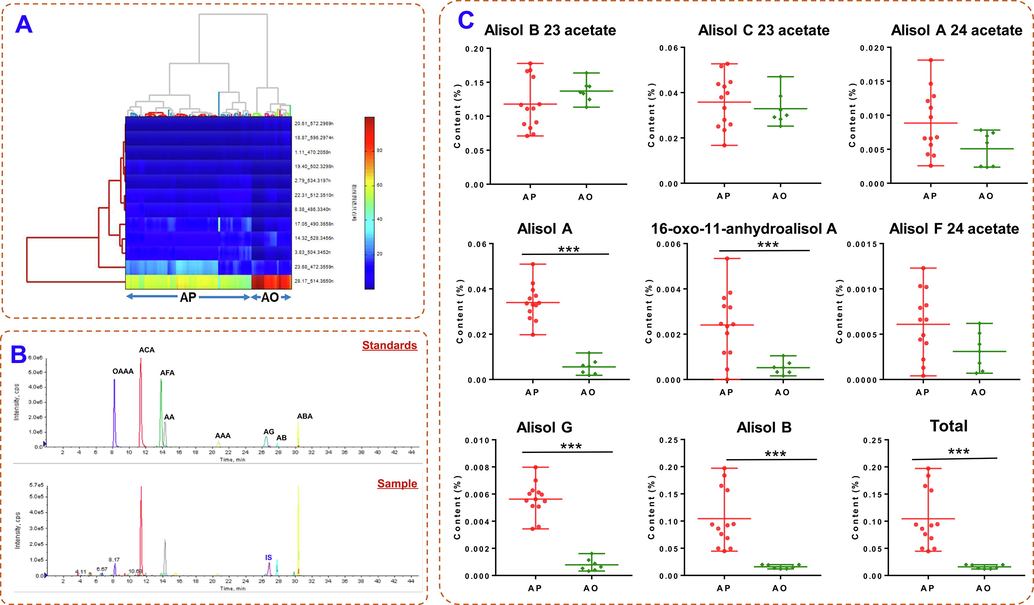
The heatmap of two-way hierarchical clustering analysis based on the abundances of twelve potential discriminating markers in AP and AO samples (A), MRM chromatograms (B), and assay results (C) of eight main compounds by UHPLC-QTrap-MS in AP and AO.
3.5 Authentication of different species of RA by SVM
To accomplish a convenient and reliable identification of two different parts of RA, SVM was used to build discriminant model using twelve robust biomarkers as selected above (Fig. 5A). Normalized ion intensity of robust biomarkers was used as the variables for data modeling as it could improve the prediction confidence. All the ninety-nine samples were split at random into two groups: two-thirds of the samples (36 AP and 11AO) were selected as training set, whereas the remaining 1/3 as the test. 7-fold cross-validation was used in model. The pattern recognition results were shown in Fig. 5B and Table S10. In the classification results of test set, all selected samples (31 batches) representing the corresponding species were successfully divided into their own groups which was consistent with the real situation. To validate the suitability of SVM model, 50 %, 100 %, and 150 % concentration of samples (three batches of AP and AO identified by DNA barcoding) were tested, and the results showed that the model have an excellent predication accuracy with prediction value 0.75–0.09 for AP and 0.49–0.78 for AO, respectively (Fig. S3 and Table S11). Moreover, the lower limit of prediction value was defined by seven inferior products in the model, and ultimately these products were all judged as AP with prediction values of 0.14–0.34, suggesting that the model results will not be reliable when the prediction value was below 0.34 (Fig. S4 and Table S12). Finally, we utilized this SVM model to predict 21 batches of commercial unknown samples, as a result, only one were predicted as AO, and the others as AP with the prediction values of 0.47 and 0.92–1.14, respectively (Fig. 5C and Table S13). From the results of 99 batches of RA, it can be concluded that botanical origins of RA cultured in Fujian, called Jian-Zexie, was A. orientale which was also formally recognized by Chinese Pharmacopoeia (2015 edition). While the RA samples from Sichuan and Jiangxi Provinces of China, called Chuan-zexie, were A. plantago-aquatica, which occupied fairly big share of sales.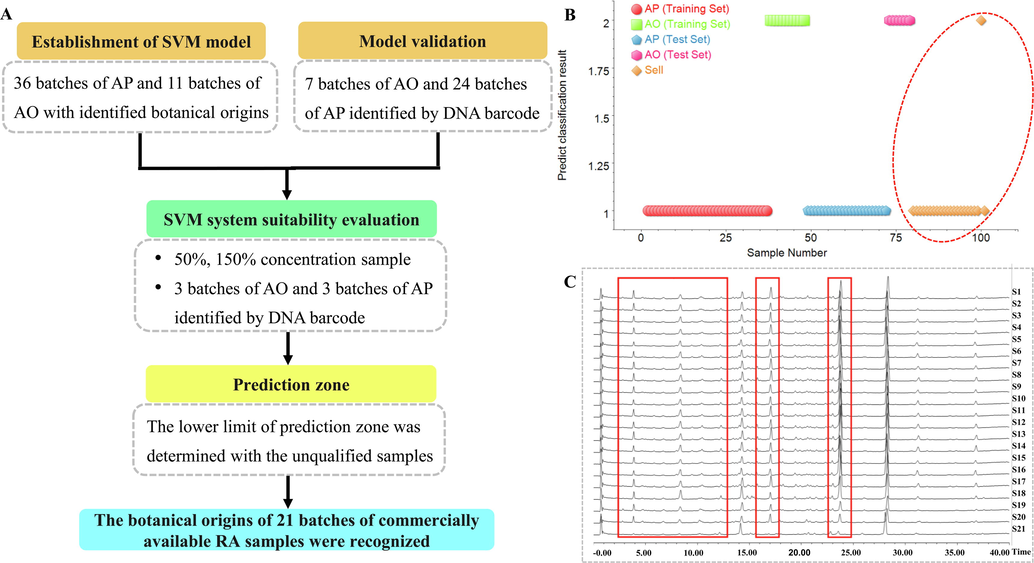
A workflow of SVM model establishment and verification (A), SVM evaluation results (B) and the base peak ion chromatograms of twenty-one batches commercial samples (C).
4 Conclusion
We integrated untargeted metabolite profiling based on UHPLC-Orbitrap, data cross validation, absolute quantification, and vector machine model, as a strategy for the classification and prediction of “one-to-multiple” herbal medicine, exemplified by RA in the current work. The untargeted metabolite profiling showed remarkable differences of chemical constituents visualized by base peak ion chromatograph and PCA model, and 41 potential markers were identified by pattern recognition OPLS-DA. Particularly, twelve compounds could render robust information used to differentiate A. orientale from A. plantago-aquatica after “multi-duplicated and traceability samples comparison” cross validation. By using these twelve markers, SVM model could give direct discrimination in the accurate authentication of RA from the market. This was the first report on systematic comparison and discrimination of two original species of RA. It is concluded that the combination of multiple analytical methods offers a practical and potent vehicle favoring the authentication of herbal medicines with multiple botanical origins.
Acknowledgment
This research was supported by National Natural Science Foundation of China (Grant No. 82003940), and Chief scientist of Qi-Huang Project of National Traditional Chinese Medicine Inheritance and Innovation “One Hundred Million” Talent Project (2020).
Declaration of Competing Interest
The authors declare that they have no known competing financial interests or personal relationships that could have appeared to influence the work reported in this paper.
References
- Discrimination of Citrus reticulata Blanco and Citrus reticulata 'Chachi' by gas chromatograph-mass spectrometry based metabolomics approach. Food Chem.. 2016;212:123-127.
- [Google Scholar]
- Discovery and validation of peptide biomarkers for discrimination of Dendrobium species by label-free proteomics and chemometrics. J. Pharm. Biomed. Anal.. 2020;182:113118
- [Google Scholar]
- Alisma genus: phytochemical constituents, biosynthesis, and biological activities. Phytother. Res.. 2021;35:1872-1886.
- [Google Scholar]
- Unbiased metabolite profiling by liquid chromatography-quadrupole time-of-flight mass spectrometry and multivariate data analysis for herbal authentication: classification of seven Lonicera species flower buds. J. Chromatogr. A. 2012;1245:109-116.
- [Google Scholar]
- Potential of ion chromatography coupled to isotope ratio mass spectrometry via a liquid interface for beverages authentication. J. Chromatogr. A. 2013;1322:62-68.
- [Google Scholar]
- Geographic authentication of the traditional Chinese medicine Atractylodes macrocephala Koidz. (Baizhu) using stable isotope and multielement analyses. Rapid Commun. Mass SP.. 2019;33:1703-1710.
- [Google Scholar]
- Advances of vibrational spectroscopic methods in phytomics and bioanalysis. J. Pharm. Biomed. Anal.. 2014;87:26-35.
- [Google Scholar]
- Strategy for comparative untargeted metabolomics reveals honey markers of different floral and geographic origins using ultrahigh-performance liquid chromatography-hybrid quadrupole-orbitrap mass spectrometry. J. Chromatogr. A. 2017;1499:78-89.
- [Google Scholar]
- Quality evaluation of traditional Chinese medicines based on fingerprinting. J. Sep. Sci.. 2020;43:6-17.
- [Google Scholar]
- Herbal textural research, morphologic characteristics and DNA barcoding of botanical origins of Alismatis Rhizoma. China J. Chin. Mater. Med.. 2020;45:1536-1544.
- [Google Scholar]
- Application of vibrational spectroscopy for classification, authentication and quality analysis of mushroom: a concise review. Food Chem.. 2019;289:545-557.
- [Google Scholar]
- Simultaneous quantitative analysis of five components in Angelica sinensis and Angelica acutiloba acclimatized growing in Vietnam by high-performance liquid chromatography with photodiode array detector. World J. Tradit. Chin. Med.. 2021;7:6-10.
- [Google Scholar]
- Development of a high-throughput method for the comprehensive lipid analysis in milk using ultra-high performance supercritical fluid chromatography combined with quadrupole time-of-flight mass spectrometry. J. Chromatogr. A. 2021;1658:462606
- [Google Scholar]
- Chemical fingerprint and metabolic profile analysis of ethyl acetate fraction of Gastrodia elata by ultra performance liquid chromatography/quadrupole-time of flight mass spectrometry. J. Chromatogr. B. 2016;1011:233-239.
- [Google Scholar]
- Liquid chromatography–mass spectrometry based global metabolite profiling: a review. Anal. Chim. Acta. 2012;711:7-16.
- [Google Scholar]
- Evaluation of traditional Chinese herbal medicine: Chaihu (Bupleuri Radix) by both high-performance liquid chromatographic and high-performance thin-layer chromatographic fingerprint and chemometric analysis. J. Chromatogr. A. 2009;1216:2150-2155.
- [Google Scholar]
- Current approaches and challenges for the metabolite profiling of complex natural extracts. J. Chromatogr. A. 2015;1382:134-164.
- [Google Scholar]
- Geographic impact evaluation of the quality of Alismatis Rhizoma by untargeted metabolomics and quantitative assay. J. Sep. Sci.. 2017;41:839-846.
- [Google Scholar]
- Differentiation of Belamcandae Rhizoma and Iridis Tectori Rhizoma by thin-layer chromatography and high-performance liquid chromatography. World J. Tradit. Chin. Med.. 2021;7:63-70.
- [Google Scholar]
- Improved structural annotation of triterpene metabolites of traditional Chinese medicine in vivo based on quantitative structure-retention relationships combined with characteristic ions: Alismatis Rhizoma as an example. J. Chromatogr. B. 2021;1187:123012
- [Google Scholar]
- “Force iteration molecular designing” strategy for the systematic characterization and discovery of new protostane triterpenoids from Alisma Rhizoma by UHPLC/LTQ-Orbitrap-MS. Anal. Bioanal. Chem.. 2021;413:1749-1764.
- [Google Scholar]
- Comprehensive quality evaluation of ShuXueNing injection employing quantitative high performance liquid chromatography fingerprint and chemometrics. World J. Tradit. Chin. Med.. 2021;7:54-62.
- [Google Scholar]
- Preparation, characterization, and bioactivity evaluation of oligosaccharides from Atractylodes lancea (Thunb.) DC. Carbohyd. Polym.. 2021;277:118854
- [Google Scholar]
- Peptides as potential biomarkers for authentication of mountain-cultivated Ginseng and cultivated Ginseng of different ages using UPLC-HRMS. J. Agr. Food Chem.. 2020;68:2263-2275.
- [Google Scholar]
Appendix A
Supplementary data
Supplementary data to this article can be found online at https://doi.org/10.1016/j.arabjc.2022.104118.
Appendix A
Supplementary data
The following are the Supplementary data to this article:Supplementary data 1
Supplementary data 1


