

Translate this page into:
Biochemical evaluation of novel seabass (Lates calcarifer) fish essence soup prepared by prolonged boiling process
⁎Corresponding author. karthikeyan.v@psu.ac.th (Karthikeyan Venkatachalam)
-
Received: ,
Accepted: ,
This article was originally published by Elsevier and was migrated to Scientific Scholar after the change of Publisher.
Abstract
Seabass fish (Lates Calcarifer) is an excellent source for nutrients and health beneficial properties. However, it is susceptible to spoil easily and developing a processed product using seabass fish could retain the nutrients and as well as extend the shelf life. The present study aimed to develop a novel fish essence soup combined with selected fruits and vegetables, processed by prolonged boiling (5, 7, or 9 h) and studied various biochemical qualities. Lightness, redness, and yellowness of soup samples gradually increased with the duration of boiling. The pH and water activity in the samples did not significantly affected by the duration of boiling and alternatively, the density and viscosity of the soup was significantly influenced by the duration of boiling. The boiling process was significantly affected the protein, lipid, fiber, carbohydrate, and total mineral contents in the fish soup. Total phenolic content increased, and total flavonoid content decreased with boiling duration. Antioxidant potentials, such as 2,2-dipheny-l-picrylhydrazyl radical scavenging activity, hydroxyl radical scavenging activities, Fe2+ chelating activity, and reducing power of the soup samples were the highest when stewed for 9 h. 83 different volatile compounds (VOCs) were identified in the soup, and the boiling significantly affected the VOC levels in soups. Seabass fish soup that processed at different boiling duration had 9 essential amino acids and 8 non-essential amino acids. This study also checked for the fatty acid compositions in the soups, and it was found that the fish soup contains a total of 25 fatty acids (12 saturated fatty acids, and 13 unsaturated fatty acids). Overall, the consumer acceptance scores were high for the fish soup boiled for 9 h. This study found that prolonged boiling significantly affected the fish soup quality, and overall boiling for 7 h or 9 h increased the health-beneficial biochemicals including polyphenolics, amino acids, fatty acids, and improved consumer acceptability.
Keywords
Seabass fish
Thermal treatment
Essence soup
Biochemical qualities
Consumer preference

1 Introduction
Processed food products exhibit numerous potential health benefits and as well as play a major role in contributing to the economy of the nations. Processed foods are more stable compared with conventional foods, and it is mainly due to their effectiveness on controlling deteriorative reactions during storages. Processed foods fulfill the food desires of the consumers (Weaver et al., 2014). Food choice is influenced by various factors, including biological processes, psychological condition, socio-cultural relations, economic values, and environmental factors. Good nutritional values are the key facet for sustaining the consumer's physical and mental health, particularly for the elderly who are vulnerable to various acute and chronic diseases upon aging (Shlisky et al., 2017). Thailand has a rapidly growing fraction of elderly people, and a recent report estimated that the elderly population (60 or older) would reach 13.8 million by 2030 (Chalermsri et al., 2020). Malnutrition, undernutrition, and overnutrition are major health concerns in Thailand, particularly among the elderly population. Kim et al. (2014) reported that common causes of problems that elderly people face when consuming food are dysphagia due to the loss of teeth, neuromuscular disorders, and cerebrovascular diseases. A nutrient-rich diet that is not chewable and swallowable, but drinkable could be an excellent food alternative to address these problems and provide a healthy diet to elderly people. Among such products, soup is one of the popular processed foods, can be rapidly heated, has various nutritional contents, and is suitable for all age groups worldwide (Mohamed et al., 2020). Soup is a heterogeneous liquid, containing a variety of ingredients, potentially including fruits, vegetables, meats, spices, and thickening agents. Instant soup mixes and ready-to-drink soups are the two major categories offered to consumers (Öztürk et al., 2019). However, the ready to drink soups are more popular, not requiring further cooking, and easy to consume at any time.
Seafood is of great importance to human nutrition. Among the various seafoods, fish are the major type with abundant levels of macro and micronutrients. Fish muscles have high nutritional values with a high protein level, and also contributing phospholipids, polyunsaturated fatty acids, and several essential minerals (Aakre et al., 2020; Weichselbaum et al., 2013). Asian seabass (Lates calcarifer), also known as giant sea perch or Plakapong in Thailand, is one of the economically important fish species in Southeast Asia, particularly in Thailand, Malaysia, Indonesia, Philippines, Vietnam, and Singapore (Boonyaratpalin, 1997). Seabass is a rapidly growing fish, at a rate of 1 kg per year, and it can attain marketable maturity within one year. Seabass is widely available in Thailand and has the characteristics of bright white meat with pleasing texture. It contains high levels of proteins and essential amino acids (Rengpipat et al., 2008). Furthermore, it also contains many polyunsaturated fatty acids, including omega-3 and omega-6, which can have beneficial health effects. Although seabass contains numerous nutrients and has a high economic value, but it has a short shelf life. Seabass is very perishable after the catch, even under chilled conditions, and quick consumption is necessary to avoid any biochemical changes and microbiological spoilage (Arfat et al., 2015; Erkan and Özden, 2006). Primarily, seabass is sold as whole fish, but also fillet and steak cut forms in Thailand. Due to improper handling, the shelf life of seabass fish is restricted to 16 days in ice, 4 days in a chilled box without ice, and 8 days at a refrigerated temperature when in cling wrap or an aluminum foil (Özogul et al., 2005). Because seabass already has a high market value in its whole form, no value-added nutritional products have been developed from it.
Thermally processed ready-to-drink meat extract soup or essence soup is currently very popular worldwide, especially in Southeast Asia. It is a concentrated drink produced from meat by processing under high temperature and pressure for an extended time (≥5 hrs.). Thermal processing helps break down the macromolecules in the meat into micro or nano sized particles, which are effective in retarding free radicals and related diseases in the body (Lin et al., 2020). Essence soup is considered a nutraceutical supplement that controls various cognitive problems and physical illnesses (Suttiwan et al., 2018). At present, ready-to-drink commercial essence soups in the market are mostly made of either chicken or vegetables. Fish soups are often produced in the form of an instant soup powder because of the unpleasant fishy odor, and also often ginger or ginseng extract powders are infused with the soup to extend storage life and control the off-odors. Furthermore, the inclusion of various fruits and vegetables in the soup could provide micronutrients as well as improve the organoleptic characteristics taste and flavor (Amit et al., 2017). The present study attempted to utilize the seabass fish and selected fruits and vegetables to develop an essence soup, processed by prolonged heat treatment, and characterized for its physiochemical, flavor, and organoleptic qualities.
2 Materials and methods
2.1 Materials and reagents
Fresh and fully matured seabass fish (Lates calcarifer sp., 60 to 70 cm, 2.5 to 4.0 kg per fish) were obtained from the local wet market. Fruits, namely apples and Chinese dried dates; and the vegetables, namely onion, potato, carrot, and radishes were purchased at a fresh market. Trichloroacetic acid, folin–ciocalteu reagent, gallic acid, quercetin, 2,2-diphenyl 1 picrylhydrazyl (DPPH), 1,10-phenanthroline, ferrozine, norleucine, 6-aminoquinolyl-N-hydroxy succinimidyl carbamate, and methyl nona decanoate were purchased from Sigma Aldrich, USA. Sodium carbonate, aluminum chloride, ferrous sulfate, hydrogen peroxide, sodium phosphate, ferrous chloride, ferric chloride, potassium ferricyanide, and potassium hydroxide were purchased from Ajax Finechem, Australia. Ethanol, methanol, chloroform, and hexane were purchased in analytical grade from J. T. Baker (Phillipsburg, NJ, USA).
2.2 Seabass fish essence soup preparation
The collected seabass fish were transported to the laboratory in an icebox within 2 hrs. After receiving, they were thoroughly washed with clean tap water and then gills, fins (dorsal, caudal, pelvic, pectoral, and anal fins), and the intestines were removed. After cleaning, they were thoroughly washed in ice-cold clean brine (2% NaCl) solution, and after that, cut into small rough slices along with the bones, and minced using an industrial electronic meat mincer equipped with a crossing knife and 10 mm hole plate. Similarly, the fruits (apples and Chinese dates) and vegetables (onion, potato, carrot, and radish) were peeled and thoroughly washed in clean water, cut roughly to small chunks, and minced individually similarly as above. After preparation of the raw materials, by fresh weight 70% of minced fish and followed by 30% fruits and vegetables (5% each) were mixed, and after that clean drinking water in 1:3 (fish/veg mixture and water) proportion was added into the electronic industrial pressure cooker (ZZG-D050, Zhejiang L&B Machinery Co., Ltd., China, 12 KW). The blend was boiled at a high temperature (∼100–110 °C) and elevated pressure (0.2 MPa) for various periods (5, 7 or 9 h). After each cooking, the extracted soup from the fish and fruit/vegetable mixture was carefully collected in a sterile container and its final salt concentration was adjusted to 2%, and it was cooled down to 40 °C in a sterile environment and then centrifuged at 2,000 × g for 30 min to remove any extracted fat as well as to eliminate any visible solid particles and make the soup extract clear. Then, the soup extract was stored in sterile packages and kept at −20 °C. Each time when the soup was thawed to room temperature, the following quality tests were done to the samples within a week after the soup was made.
2.3 Quality analysis
2.3.1 Physiochemical qualities
2.3.1.1 Color characteristics and appearance
The fish soup samples were poured onto 10 cm wide Petri dishes, and measured at ten different locations on the dish for the color coordinates lightness, redness, and yellowness by using a handheld HunterLab colorimeter (Hunter Associates, Inc., Reston, VA, USA). Fish soup samples were placed in beakers separately photographed for their appearances, to record subjective differences between their appearances caused by the alternative thermal treatments.
2.3.1.2 Maillard reaction products (MRP)
The fish soups were lyophilized and then ground into powder following the method of Jakubczyk and Jaskulska (2021). Then, 50 mg of a sample was mixed with 3 mL of 50% ethanol in a test tube, followed by vortexing and incubation in a water bath at 50 °C for 30 min (Shen et al., 2018). After that, the incubated samples were vortexed for 1 min and centrifuged at 10,000g for 10 min, and then the supernatant was collected and measured of relative MRP at 420 nm by using a UV/Vis spectrophotometer.
2.3.1.3 Degree of hydrolysis (DH)
The DH of the samples was measured using the trichloroacetic acid (TCA) method described by Amiza et al. (2019). A 0.5 g sample of lyophilized soup was measured for total nitrogen (N) content using the Kjeldahl method (AOAC, 2005). After that, 0.5 g of lyophilized soup was mixed with 10 mL of 20% TCA, mixed thoroughly, and incubated at room temperature for 30 min to allow precipitation. After that, the sample was centrifuged at 4000g for 15 min. Then, the supernatant was collected and measured for total nitrogen content using the same method mentioned earlier. The DH of the samples was measured using the following formula:
2.3.1.4 pH
A 40 mL sample of soup was placed in a sterile beaker and measured for pH at room temperature (about 30 Centigrade). The pH was measured using a tabletop digital pH meter (PB-11, Sartorius, Germany).
2.3.1.5 Water activity and moisture content
The water activities of fish soup samples were measured at ambient temperature using an electronic hygrometer (CX-2T, Aqualab). Moisture content in the fish soup was measured using an electronic infrared moisture analyzer (MA 160, Sartorius, Germany). The results are expressed as percentages.
2.3.1.6 Density and viscosity
The density of the soup samples was measured using a handheld digital densitometer (DMA 35, Anton Paar, Denmark) at 30 °C. The result is expressed as g/cm3.
The viscosities of the soup samples were measured using a digital tabletop Brookfield viscometer (Brookfield DVE viscometer, USA). The soup samples were maintained at 30 °C before analysis. A 150 mL sample was placed in a beaker (70 mm diameter and 125 mm height) and measured for viscosity using spindle no 2 at 12 rpm speed. The results are expressed in mPaS−1.
2.3.2 Proximate composition
Fish soup proximate compositions, in terms of protein (2001.11), lipid (954.02), and crude fiber (978.10), were measured using the official methods described in (AOAC, 2005). Carbohydrate content in the soup was calculated as a difference. The results are expressed in g/100 mL. Gross energy in the fish samples was measured using a bomb calorimeter (C2000, I.K.A., Germany). The results are expressed in Kcal. For ash content (Lin et al., 2020), 10 mL of soup was dried in a water bath at 100 °C and then charred to smokeless state on a hot plate, and after that placed in a muffle furnace and exposed to a high temperature (550 ± 20 °C) for 4 hrs. Then it was brought to room temperature, held for 30 min, and weighed. The same process was repeated until the weight was constant. After processing, the remaining materials were referred to as ash content, and the results are expressed in g/100 mL.
2.3.3 Phytochemical contents and antioxidant activities
A 30 mL sample of fish soup was mixed with 20 mL of 100% methanol and vortexed at a high speed for 1 min, and then it was incubated at 60 °C for 15 min. After incubation, the sample was centrifuged at 8160g for 20 min at ambient temperature, and then the supernatant was collected and filtered through a 0.22 µm nylon syringe filter (Waters, Milford, MA, USA). The collected filtrate was used for measuring phytochemical contents and antioxidant activities.
Total phenolic content (TPC) in the fish soup was measured using the method of Lim et al. (2007). A 0.3 mL soup extract sample was added into the test tube and mixed with 1.5 mL of Folin-Ciocalteu's reagent (diluted with water in a ratio of 1:10) and 1.5 mL of 7.5% sodium carbonate was added. Then, the reaction mixture was vortexed thoroughly and incubated at room temperature for 30 min. After incubation, the reaction mixture was measured at 765 nm using a UV/Vis spectrophotometer. TPC in the soup was quantified using the calibration curve made for gallic acid. The results are expressed as mg of gallic acid equivalent (GAE) per 100 mL.
Total flavonoid content (TFC) in the fish soup was measured using the method of Chandra et al. (2014). A 0.6 mL sample of soup extract was mixed with 0.6 mL of 2% aluminum chloride and incubated at room temperature for 60 min. After incubation, the reaction mixture was measured at 420 nm using a UV/Vis spectrophotometer. TFC in the soup was quantified using the calibration curve made for Quercetin. The results are expressed in mg of quercetin equivalent (QE) per 100 mL.
The DPPH radical scavenging activity in the soup was measured using the method of Zhang et al. (2011). A 4 mL sample of soup extract was mixed well with 1 mL of 0.1 mM DPPH in 95% methanol and incubated in the dark at room temperature for 30 min. Then, the reaction mixture was measured at 570 nm using a UV/Vis spectrophotometer. The soup sample was replaced with deionized water in the control. The results were calculated using the following formula: where A represents the absorbance value.
The hydroxyl radical scavenging activity in the soup was measured using the method of Li et al. (2008). A 2 mL sample of soup extract was added to the test tube, followed by 1 mL of 0.75 mM 1,10-phenanthroline, 1 mL of 0.75 mM FeSO4, and 2 mL of phosphate buffer (pH 7.4). The reaction mixture was thoroughly mixed, and then, 1 mL of 0.12% H2O2 was added to the mixture, mixed well, and incubated for 60 min at 37 °C. After incubation, the reaction mixture was measured at 536 nm using a UV/Vis spectrophotometer. The results were calculated using the following equation: where AS represents absorbance value of the sample mixture; A1 represents absorbance value of the control (distilled water instead of the sample); and A0 represents absorbance value of a blank that contains 1,10-phenanthroline and FeSO4.
The Fe2+ chelating activity of the soup samples was analyzed using the method of Zhang et al. (2018). A 1 mL sample of soup extract was mixed with 0.1 mL of 2 mM FeCl2, 0.2 mL of 5 mM ferrozine, and 3.7 mL of distilled water. The reaction mixture was thoroughly mixed and incubated at room temperature for 20 min. After incubation, the reaction mixture was measured at 562 nm. Distilled water instead of sample in the mixture was considered as the control, whereas FeCl2 and ferrozine without the sample were used as the blank. The results were calculated using the following equation: where A represents the absorbance value.
The reducing sugar in the soup samples was measured using the method of Oyaizu (1986). A 2 mL sample of soup extract was mixed with 2 mL of 0.2 M phosphate buffer (pH 6.6) and 2 mL of 1% K3Fe (CN)6. The reaction mixture was then mixed with 2 mL of 10% trichloroacetic acid (TCA) and incubated for 20 min at 50 °C. After incubation, the reaction mixture was centrifuged at 3000g for 10 min. The supernatant was collected and mixed with 0.4 mL of 1% FeCl3 and incubated for 10 min at room temperature. Then, the reaction mixture was measured at 700 nm using a UV/Vis spectrophotometer. The results are named A700.
2.3.4 Volatile compounds
The volatile compounds in the fish soups were extracted and analyzed by GC–MS (Agilent GC 6890, with a 7683B autosampler, CA, USA) using the static headspace method proposed by de Arruda Moura Pietrowski et al. (2012) with some modifications. The capillary column (Phenomenex column with 30 m length, 0.25 mm internal diameter and 0.25 µm thick ZBWAX film) was used in the Agilent GC. The analysis conditions were programmed for an initial temperature of 40 °C for 5 min with an increase of 10 °C/min to 300 °C, and this temperature was held for 10 min. The sample injector port temperature was set to 250 °C; the transfer line was set to 290 °C, splitless. A 1.5 mL of sample was injected into the GC by an automatic injector, and the column flow rate was set to 1 mL/min. LECO Pegasus 4D mass spectrophotometer was used, the electronic ionization source was set at −70 eV; the solvent delay was set to 9 min, the scan time was 1.5 s, the acquisition rate was set to 10 spectra/second, the mass range was 50–1000 amu, detector voltage 1800 V and the ion source temperature was set to 250 °C. The data were recorded in total ion chromatogram mode, and the Agilent ChemStation software was adopted to handle the data from the mass spectra and chromatograms. Volatile compound name, chemical formula, and % peak area of unknown compounds were identified by the software and by comparing to known data in the GC–MS library (NIST mass spectral library). The results are expressed in relative percentages.
2.3.5 Free amino acid composition
A 3 mL sample of soup was mixed well with 2 mL of 0.25 mmol/L norleucine and then centrifuged at 13,000g for 20 min at 4 °C. The supernatant was collected and filtered through a nylon syringe (0.2 µm, Waters, USA). Then the filtrate was used to identify the amino acids by the chromatographic method proposed by Alberti et al. (2016). The amino acids were derivatized using a Waters AccQ Tag™ reagent kit (flask 1: 200 mmol/L borate buffer, pH 8.8; flask 2A: 6-aminoquinolyl-N-hydroxysuccinimidyl carbamate, AQC; flask 2B: acetonitrile). Then, the identification and quantification were accomplished by HPLC using the AccQ Tag reagent kit methodology with a Pico-Tag column (4 mm, 3.9 × 150 mm). The identified amino acids in fish soups were quantified and are reported in relative percentages.
2.3.6 Fatty acid composition
Fatty acid contents from the fish soup samples were extracted and identified using the method of Xun et al. (2020). A 2 mL soup sample was added into 10 mL centrifuge tube followed by 2 mL methanol, 4 mL chloroform, and 2 mL DI water. The mixture was thoroughly mixed and centrifuged at 1000g for 10 min. The supernatant was collected and placed into a new centrifuge tube followed by 1 mL n-hexane and 25 mL methyl nona decanoate, the mixture was vortexed (2 min), and then 1 mL of 0.4 mol/L potassium hydroxide methanol was added and vortexed (1 min). The mixture was incubated at 37 °C for 30 min and centrifuged for 5 min at 2000g. Then, the supernatant was collected and fatty acid composition was determined by using a GC–MS (Agilent GC 6890, CA, USA) equipped with a capillary column (DB-225, Agilent). 1 µL sample of extracted soup was injected in the GC in 20:1 split mode at 270 °C. Helium (carrier gas) was set to flowrate of 1 mL/min. The oven temperature was set to 70 °C for 1 min, increased to 240 °C at 2 °C per min, and held for 10 min. The mass spectrometer was controlled in electron-impact mode at 70 eV, and the mass spectra were collected using full scan mode from 33 to 500 m/z. Fatty acid identification was based on the relative retention times of fatty acid methyl ester peaks from the sample and from standards. The results are expressed in relative percentages.
2.3.7 Sensory characteristics
Fish soups were tested for sensory characteristics by using 100 untrained panelists, who were lecturers, supporting staff, students and visitors, aged between 21 and 55 years. The test was conducted in the individual private cabins in the sensory laboratory at the university. Soup samples were randomly named and served to the panelists at an average temperature of between 65 °C and 70 °C in a plastic dish. The panelists were asked to rate the sample characteristics appearance, color, odor, taste, body, and overall, on a nine-point Hedonic scale ranging from 1 (extremely dislike) to 9 (extremely like) (Carvalho et al., 2013).
2.3.8 Data analysis
The experiments were carried out in triplicates. Data are presented as mean ± standard deviation (SD). The statistical analysis was carried out using SPSS (v6) software from the USA for Windows. All the results were analyzed for variance and differences between means using one-way ANOVA followed by Duncan's multiple range test. The differences in the mean were regarded as significant when P < 0.05.
3 Results and discussion
3.1 Color characteristics
The appearance of seabass fish essence soup after prolonged boiling is shown in Fig. 1A. The extended boiling slightly darkened the soup samples and as well as thickened them. A substantial change was noted in the appearance of soup that was processed for 9 h, compared to the 5 h and 7 h treatments. Color is an important quality criterion for food products. Color coordinates such as lightness, redness, and yellowness of the fish essence soups are shown in Fig. 1B. The results indicate that prolonged boiling significantly influenced the color characteristics of the sample. Soup lightness gradually decreased with boiling time, and similar pattern was observed for yellowness. On the other hand, redness tended to decrease with boiling time. Soup processed for 9 h boiling time had significantly decreased in redness as compared with other boiling times especially 5H. The added ingredients in the soup might also contribute to its color characteristics. The prolonged boiling could hydrolyze protein and available carbohydrates in the soup, resulting in Maillard reactions. Li et al. (2020) observed that continuous boiling could release the sugar from meat and contribute to the formation of Maillard reaction products (MRP). Min (2018) reported that codfish mixed with ribose, xylose, glucose, and fructose exhibited more Maillard reactions upon prolonged heating than with other types of sugars. Furthermore, their study found that the redness of the samples was significantly affected by glucose and fructose. The present study is in accordance with those results where various fruits and vegetables were used as ingredients in the soup. In another study, Fu et al. (2020) reported that flatfish byproducts rapidly produced Maillard reaction in the presence of ribose sugar. Jin et al. (2018) reported that the fish protein hydrolysate produced more MRP in the presence of galactooligosaccharides. Zhang et al. (2013) found that prolonged cooking under higher temperatures had significantly affected the crucian carp soup's color characteristics. Melanoidins are browning indicators in foods. The present study found that the melanoidin content gradually increased in fish essence soup with boiling time (Fig. 1C). Nevertheless, the differences in melanoidin were not large among the samples. The fish essence soup processed for 9 h had the highest melanoidin content followed by 7H and 5H in this order. Shen et al. (2018) found that amino acids play a crucial role in the production of MRP in food products; their study found that glycine, alanine, and lysine were dominant in producing melanoidin, compared to other amino acids. The degree of hydrolysis (DH) could serve as an indicator for amino acid production. The DH of the seabass fish essence soup is shown in Fig. 1C. The results indicate that prolonged boiling significantly increased the DH of soup up to 25.69% (9 h), and the least DH observed was 9.31% (5 h). Thermal processing played a critical role in the hydrolyzation of soup. Generally, hydrolyzation uses protease enzymes. However, the fish proteins are lean proteins and are more susceptible to hydrolysis under thermal processing as compared complex proteins. DH is the main indicator for identifying the functional properties of a food product. This study found that DH results are in accordance with the results of protein and amino acids in the soup samples during prolonged boiling period.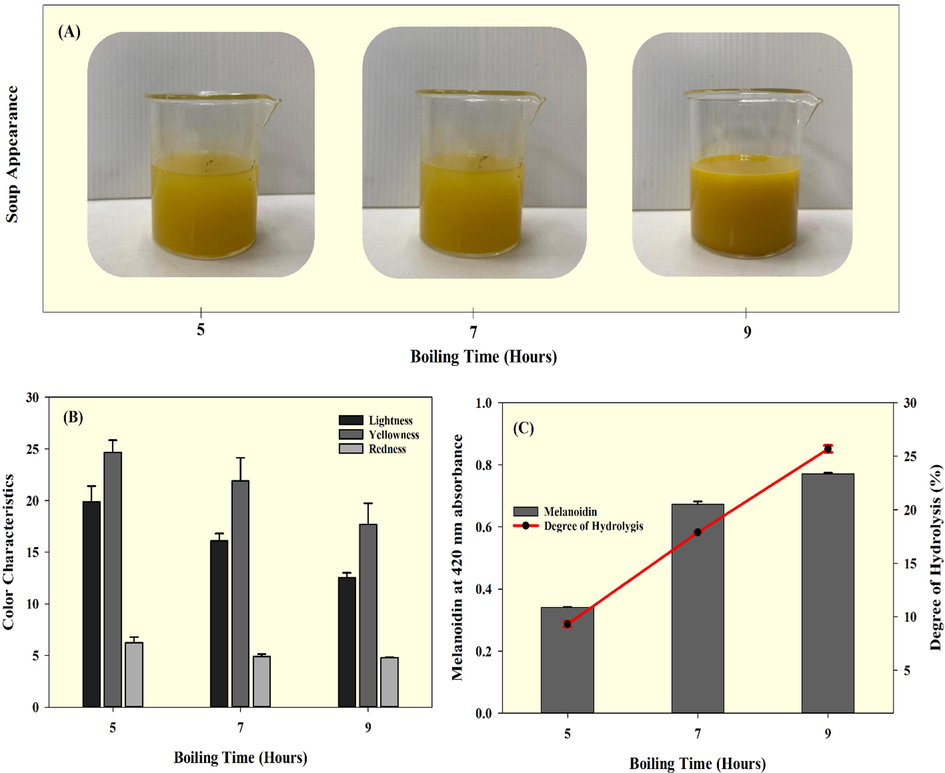
Changes in Seabass fish essence soup appearance (A), color characteristics (lightness, yellowness, and redness) (B), melanoidin level, and degree of hydrolysis (C) for the prolonged boiling times tested.
3.2 pH, water activity, density, and viscosity
The pH of the fish essence soup was not influenced much by the boiling time (Fig. 2A). A gradual increase in pH was observed in soup samples with boiling time (P > 0.05). Mol (2005) has observed similar pH trend in fish soup. Overall, the pH of fish essence soup ranged between 4.89 and 5.01. At an earlier stage during boiling the soup pH was slightly acidic, and prolonged boiling increased the pH. This initial pH of the soup is influenced by the added ingredients, mainly fruits and vegetables, which had organic acids, while prolonged boiling could weaken those acids and slightly increase the pH. Furthermore, the protein hydrolysis in the soup during extended boiling might release amino acids and contribute to the soup's pH. Among the different amino acids, aspartic acid, glutamic acid, lysine, arginine, and histidine contribute to fish soup pH via their side chains. This also could contribute to the suppression of pH increment in the soup. Similarly, the fish essence soup's water activity was also not much affected by the boiling treatment (Fig. 2A). A decreasing trend in water activity was observed for the fish soup, in the range from 0.9700 to 0.9560. The results indicate that boiling slightly decreased the water content and increased solids content by evaporating water, as expected. The water activity results indicate that the fish soup could be prone to spoilage by chemical reaction specifically non enzymatic browning, lipid oxidation and enzymatic activities and/or by microbiological invasion. Proper aseptic packaging is a must for the prolonged storage of this type of soup. Similarly, the density of the sample decreased with boiling time (P < 0.05). The density of fish essence soup ranged from 0.9800 to 0.9700 (Fig. 2B). Prolonged boiling for 7 h or 9 h significantly changed the soup density from that for 5 h. Furthermore, the viscosity of fish essence soup also increased with the boiling time (Fig. 2B). Soups that were boiled for 9 h had the highest viscosity, followed by 7 h and 5 h treatments. The viscosity of soup samples ranged from 9.72 to 10.14 mPaS−1. The soup's ingredients might influence the soup's viscosity, especially the various starchy ingredients like radish, apple, carrot, potato, and Chinese dates. Continued boiling could thermally alter a starch’s crystallinity while causing swelling of the starch granules. This could increase viscosity of the soup during prolonged boiling. This is in accordance with Senanayake et al. (2014) and Ahmad et al. (2019). Furthermore, the viscosity might also be affected by the fish protein content in the soup. Extended boiling could hydrolyze the soup's proteins and produce low molecular weight protein fragments, contributing to viscosity. This is in agreement with Gaber et al. (2015).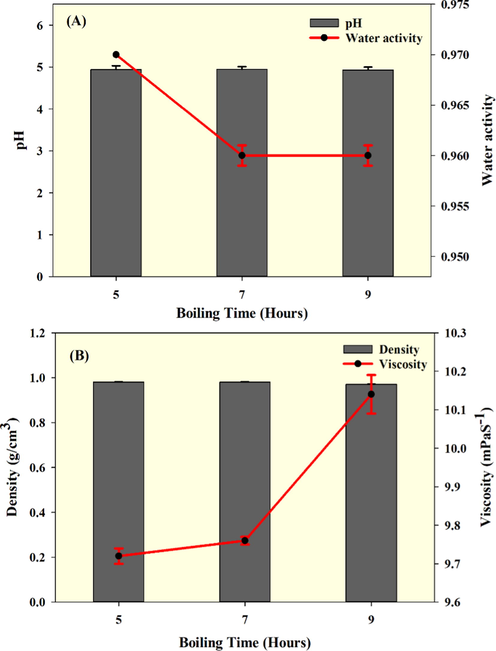
pH, water activity, density, and viscosity of seabass fish essence soup when prepared with various boiling times.
3.3 Proximate composition
Thermal processing is one of the key approaches to preserve food and its nutritional value. The proximate compositions of the seabass essence soup that was processed for various boiling times are shown in Fig. 3. Moisture content of the soup did not differ much among the samples (Fig. 3A). A slight decrease in moisture level took place with increasing boiling time; however, it did not affect much. The fewer moisture loss in the soup could be induced by the processing operations. Protein in the soup samples was significantly affected by the boiling (Fig. 3A). Prolonged boiling of fish soups significantly decreased the protein content, and the soup that underwent 9 h of boiling lost the most protein, followed by 7 h and 5 h treatments. A decrease in protein content could be due to degradation or hydrolysis caused by prolonged heating and also caused by the post-processing conditions such as centrifugations to clarify the soup. On the other hand, the lipid content in the fish essence soup gradually increased with boiling time (Fig. 3B). The fish soup boiled for 9 h had a significantly increased level of fat, followed by 7 h and 5 h cases. Similarly, the ash content in the fish essence soup was found to slightly increase, although the differences between 5 h and 7 h boiling period were not much and however, the ash content was significantly high when compared with 9 h (Fig. 3B). Ash represents the total mineral content of the foods. The plant-based ingredients could be the major contributor for the minerals content to the soup. A significant difference in the mineral content was noticed when the soup samples were processed 9 h or 7 h, compared to 5 h. Karimian-Khosroshahi et al. (2016) found that boiling of fish significantly increased the fish mineral content compared to other cooking methods. On the other hand, the essence soup's fiber content was adversely affected by boiling (Fig. 3C). The prolonged boiling times greatly decreased the fiber content compared to the shorter boiling times. Carbohydrates in the fish soup were mainly contributed by the added fruits and vegetables (Fig. 3D). The results show that the boiling treatment did not adversely influence the level of carbohydrates. Soups boiled for 9 h had retained the carbohydrates in the clear essence, followed by 7 h and 5 h. Similarly, the fish essence soup's total mineral content gradually increased with boiling time (Fig. 3G). The energy level of fish essence soup was found to increase with prolonged boiling time (Fig. 3H). Though the energy levels did not much differ between 5 h and 7 h, the differences to samples boiled for 9 h were significant.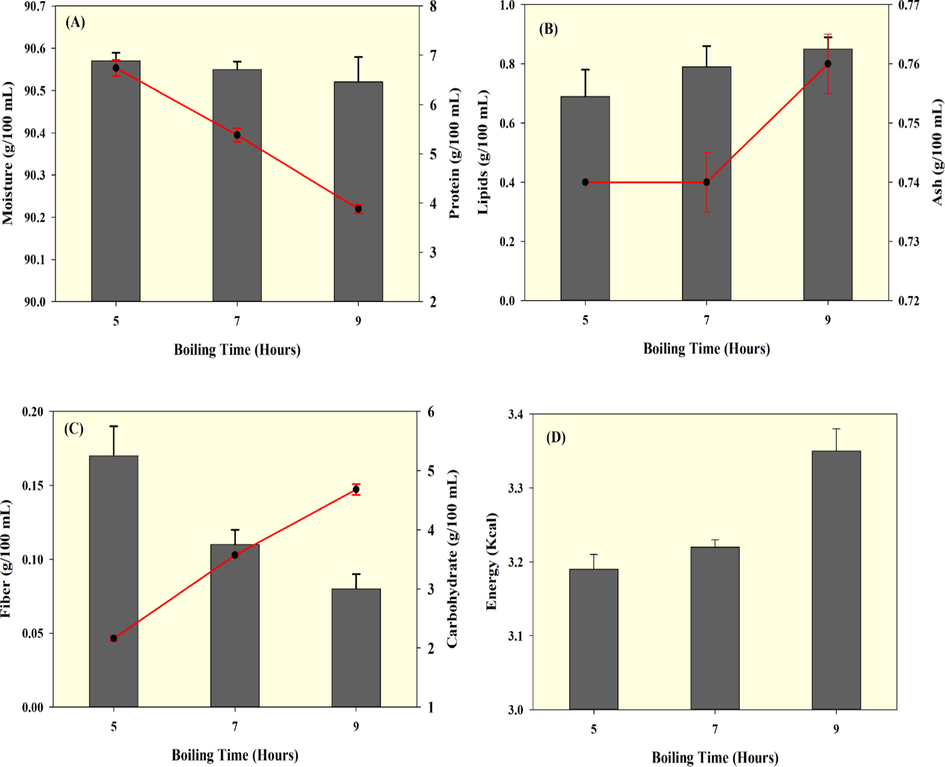
Proximate compositions of seabass fish essence soup prepared with three boiling times.
3.4 Phytochemical content and antioxidant activities
The phytochemical contents and antioxidant activities of the seabass fish essence soup that was processed for various boiling times are shown in Fig. 4. Prolonged boiling significantly influenced the phytochemical levels. The phenolics were gradually increased and flavonoids were gradually decreased in soups as the boiling was prolonged (Fig. 4A). Soups boiled for 9 h had a high level of total phenolics, and whereas the flavonoid content was adversely affected. The added plant-based ingredients might have contributed to the phytochemicals in the fish soup. Several studies have reported that prolonged heating of plant-based ingredients could cause dramatic loss of polyphenolics (Chipurura et al., 2010; Lima et al., 2009). The boiling was done in a closed vessel to limit evaporation loss of soup and retain the water-soluble phenolics. Similarly, the antioxidant activities of the seabass fish essence soup increased with boiling time. Generally, phytochemicals are the predominant contributors of primary and/or secondary antioxidants in food products that contain plant-based ingredients. Furthermore, the seafood might also contribute to antioxidant activities by released peptides and amino acids that generated during the processing. Amiza et al. (2019) reported that heat induced denaturation and protein hydrolysis. Among the antioxidant activities, the DPPH radical scavenging ability of the fish essence soup was the highest (84.43–86.88%) followed by hydroxyl radical scavenging activity (67.83–75.00%) and Fe2+ chelating activity (57.90–63.00%) (Fig. 4B-C). Fish essence soups from 9 h boiling had significant radical scavenging activities. Wang et al. (2017) found that when fish protein was hydrolyzed at a high temperature, with high water content, and for a prolonged time, this significantly increased the DPPH and Hydroxyl radical scavenging activities. Similarly, the reducing power of the fish essence soup also increased with boiling time (Fig. 4C). Compared to 5 h of boiling, the reducing power of the soup was significantly higher with 7 h or 9 h, while there was not much difference between these two. Normally, peptides produced from protein hydrolysis have strong antioxidant activity particularly reducing power and this study found that when soup processed for prolonged boiling had increased the reducing power as compared with shorter boiling time and it could be due to incomplete hydrolyzation of protein and thus produced insufficient level of peptides. Kaur et al. (2014) reported that prolonged thermal processing gave a very incomplete digestion of peptides.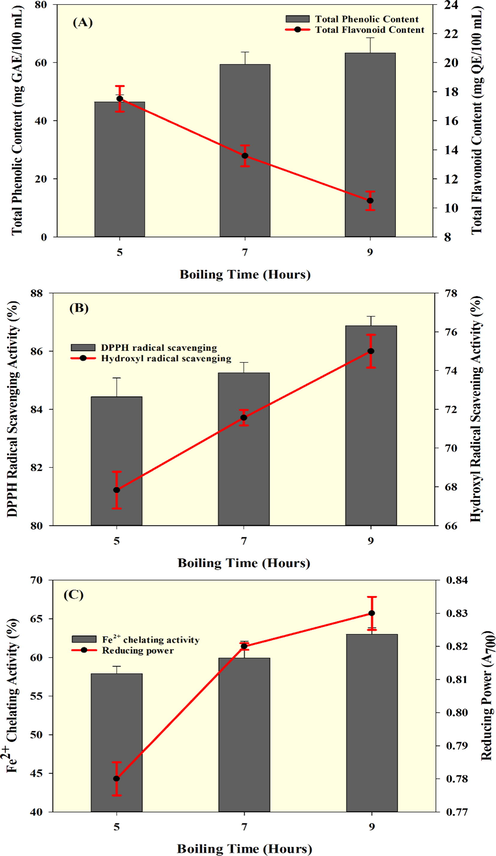
Phytochemicals and various antioxidant activities of seabass fish essence soup prepared with three boiling times.
3.5 Volatile compounds
Volatile compounds in the seabass fish essence soups from extended boiling are given in Table 1. Flavors of the fish soup are mainly contributed by the peptides and free amino acids, which are produced during thermal processing (Zhang et al., 2013). The present study identified a total of 83 different flavor compounds in the seabass fish soup. Terpenes (9.6%), sulfur-containing compounds (10.8%), alcohols (20.48%), furanic acid (7.2%), esters (4.8%), acids (14.4%), aldehydes (4.8%), ketones (3.6%), aromatic compounds (7.2%), amines (1.2%), alkanes (9.6%), ethers (1.2%) and others (4.8%) were the identified volatile compound types in the soup. Among them, alcohols, sulfur-containing compounds, acids, terpenes, and alkanes were the major volatile compounds. The extended boiling significantly affected the volatile compound concentrations. Normally, the aroma of food is one of the key factors for consumer satisfaction, and it is generated by volatile and semi-volatile compounds. One of the major drawbacks of fresh fish is its unfavorable odor, and the fish processed into a food product, particularly a soup, retains more of the preferable flavor compounds than of the unfavorable ones (Mansur et al., 2002). This could partly be due to added spices and/or ingredients that improve the appearance and mask the unpleasant odor (Xue et al., 2018). Prolonged boiling might especially concentrate some of the volatile compounds and promote chemical conversion of the flavor compounds. Octane and benzene are the important unfavorable aroma compounds found in thermally processed fish-related food products. Zhang et al. (2013) reported that peptides from hydrolyzed proteins act as a buffer and support flavor interactions and as well as the conversion of one flavor to another form. Li et al. (2016) found that alcohols, aldehydes, and ketones were the main contributors of flavor in codfish soup. Aldehydes contribute to the fish odor in various fish soups. Flavors in the processed food, particularly a soup, are contributed by thermal process induced hydrolyzation of macromolecules including proteins, lipid and carbohydrates. Roasted flavor in fish soup is contributed by the sulfur-containing compounds, which are mainly produced by Maillard reactions. The present study identified around 8 different alkanes, and among them, 4,8,8-Trimethyl-2-methylene-4-vinylbicyclo [5.2.0] nonane and pentadecane were predominant. Alkanes are normally produced in food by oxidation; however, these compounds did not adversely affect the fish essence soup. Similarly, terpenes were also found at high levels in the seabass fish essence soup. However, several reports have found that terpenes are not produced from the fish, and the added plant-based ingredients in the fish soup could be contributing terpenes as secondary metabolites (Caputi and Aprea, 2011). Among the terpenes, β-bisabolene and α-farnesene are predominant in the seabass fish essence soup. On the other hand, limonene in the soup was lost with extended boiling. This could be due to the conversion of terpene into terpenoids such as carvone. Several reports mention heat-induced fat oxidation in food that could stimulate the formation of off-flavor compounds, such as caryophyllene and methyl butanol (Xue et al., 2018). This study found that methyl butanol continuously decreased with boiling, with no off-flavor formation. Qi et al. (2018) reported that extended thermal processing of fish weakens sarcoplasmic proteins, which play a key role in binding the flavor compounds through hydrophobic interactions of amino acid side chains and terminal ends. Alcohol is the major flavor compound bound with sarcoplasmic proteins, and the extended heating disturbs the conformation of proteins and causes them to unfold and/or aggregate, consequently releasing bound flavor compounds. Note: Data are presented as mean ± standard deviation. Different superscripts show in each row above results indicate significant differences.
Volatile Compound (%, Relative concentration)
RT
Boiling Time (H)
5
7
9
Terpenes
3-Carene
6.47
0.02 ± 0.00a
0.04 ± 0.01a
0.04 ± 0.00a
α-Farnesene
23.95
0.56 ± 0.00a
0.60 ± 0.02ab
0.71 ± 0.01b
Limonene
12.63
0.11 ± 0.01a
–
–
α-Terpinene
14.66
0.03 ± 0.00a
0.10 ± 0.01b
0.13 ± 0.04b
β-Bisabolene
23.73
0.24 ± 0.06a
0.32 ± 0.01b
–
Bisabolene
24.07
1.28 ± 0.08c
1.17 ± 0.07b
0.99 ± 0.03a
2-Buten-1-one, 1-(2,6,6-trimethyl-1,3- cyclohexadien-1-yl)-, (E)-
24.79
0.56 ± 0.06c
0.47 ± 0.04b
0.24 ± 0.01a
Azulene, 1,4-dimethyl-7-(1-methylethyl)-
28.72
0.03 ± 0.00a
0.03 ± 0.00a
0.04 ± 0.00a
Sulfur-containing compounds
Methanethiol
2.29
0.04 ± 0.00a
0.01 ± 0.00a
0.01 ± 0.00a
Borane-methyl sulfide complex
2.55
0.24 ± 0.04b
0.07 ± 0.00a
0.07 ± 0.01a
Disulfide, methyl propyl
14.06
0.58 ± 0.08a
0.79 ± 0.01ab
1.27 ± 0.05b
Dimethyl trisulfide
18.38
0.78 ± 0.01a
1.10 ± 0.08b
2.59 ± 0.10c
Disulfide, bis(1-methylethyl)
18.43
1.65 ± 0.05b
1.51 ± 0.01a
–
(E)-1-Methyl-2-(prop-1-en-1-yl) disulfane
16.16
0.07 ± 0.00a
0.66 ± 0.04c
0.47 ± 0.02b
3,4-Dimethylthiophene
14.97
1.28 ± 0.08b
1.44 ± 0.10c
0.70 ± 0.05a
Methyl 1-propenyl sulfide
15.32
0.06 ± 0.00a
0.23 ± 0.01b
0.30 ± 0.02b
(E)-1-(Prop-1-en-1-yl)-3-propyltrisulfane
24.51
0.25 ± 0.01a
0.22 ± 0.00a
0.20 ± 0.02a
Alcohol
5-Amino-2-methylhexan-2-ol
2.36
0.17 ± 0.01b
0.11 ± 0.01a
0.10 ± 0.00a
2-Pentenol, 2-methyl-
11.29
1.75 ± 0.05c
1.40 ± 0.01b
1.03 ± 0.03a
Heptanol
12.38
0.80 ± 0.08b
0.03 ± 0.01a
–
1-Phenylethyl-Alcohol
13.78
0.05 ± 0.00a
0.04 ± 0.01a
0.01 ± 0.00a
Octanol
16.36
0.09 ± 0.00a
0.21 ± 0.02b
0.46 ± 0.03c
1-Hexanol
18.06
0.12 ± 0.02a
0.17 ± 0.01ab
0.21 ± 0.02b
Nonanol
18.90
2.10 ± 0.01b
0.95 ± 0.05a
0.94 ± 0.03a
(S)-(±)-6-Methyl-1-octanol
22.49
0.17 ± 0.01b
0.12 ± 0.00a
0.08 ± 0.01a
2-Furanmethanol
22.83
0.31 ± 0.01a
0.43 ± 0.04ab
1.43 ± 0.02b
Benzyl alcohol
25.32
0.17 ± 0.01b
0.11 ± 0.00a
0.10 ± 0.02a
Hexadecanol
27.95
1.67 ± 0.01b
1.83 ± 0.01c
0.76 ± 0.06a
Octadecanol
29.66
0.26 ± 0.02c
0.19 ± 0.01b
0.13 ± 0.01a
5-Thiazoleethanol, 4-methyl-
29.31
0.03 ± 0.00a
0.02 ± 0.00a
0.01 ± 0.00a
Z-9-Pentadecenol
32.14
0.54 ± 0.01b
0.53 ± 0.03b
0.12 ± 0.01a
Butanol, 2-methyl-
4.15
0.73 ± 0.02c
0.66 ± 0.04b
0.32 ± 0.02a
Butanol, 3-methyl-
4.23
1.26 ± 0.01c
1.18 ± 0.03b
0.62 ± 0.01a
Hexanol
8.49
0.31 ± 0.01a
0.71 ± 0.00b
1.01 ± 0.01c
Furanic compounds
Furan, 2-methyl-
3.54
0.12 ± 0.01b
0.03 ± 0.01a
–
Furan, 2-ethyl-
4.92
0.82 ± 0.06c
0.69 ± 0.04b
0.18 ± 0.01a
Furan, 2-pentyl-
14.25
2.27 ± 0.02b
1.63 ± 0.03a
–
3(2H)-Furanone, dihydro-2-methyl-
15.50
0.08 ± 0.01a
0.15 ± 0.02b
0.25 ± 0.03c
2-furan-carboxaldehyde
20.10
2.73 ± 0.01a
4.38 ± 0.03b
5.81 ± 0.02c
Dihydro-5-(1-hydroxyethyl)-2(3H)-furanone
29.48
0.14 ± 0.01a
0.17 ± 0.01ab
0.25 ± 0.03b
Esters
Decanoic acid, ethyl ester
22.64
0.15 ± 0.01a
–
–
Dodecanoic acid, ethyl ester
25.02
0.30 ± 0.03b
0.25 ± 0.01b
0.07 ± 0.01a
Folione
6.91
0.04 ± 0.00a
0.03 ± 0.00a
–
1-Ethyl-2-pyrazoline
19.54
0.08 ± 0.01a
0.26 ± 0.01b
0.44 ± 0.01c
Acids
Acetic acid
19.89
2.43 ± 0.01b
3.33 ± 0.01c
2.09 ± 0.02a
Pentanoic acid
22.44
0.21 ± 0.01a
0.35 ± 0.03b
0.64 ± 0.04c
Hexanoic acid
24.94
1.20 ± 0.01c
0.84 ± 0.01b
0.77 ± 0.05a
Octanoic acid
27.10
0.60 ± 0.02a
0.65 ± 0.03b
0.74 ± 0.01c
Nonanoic acid
28.09
0.10 ± 0.01a
0.22 ± 0.02b
0.48 ± 0.04c
n-Decanoic acid
28.96
4.13 ± 0.01b
3.73 ± 0.03a
4.93 ± 0.01c
Benzoic acid
30.15
0.20 ± 0.01a
0.28 ± 0.02b
0.31 ± 0.01c
Dodecanoic acid
30.45
1.87 ± 0.01a
2.15 ± 0.02b
2.43 ± 0.00a
Hydrocinnamic acid
31.34
–
0.03 ± 0.00a
0.07 ± 0.02a
Tetradecanoic acid
31.80
0.18 ± 0.01b
0.15 ± 0.02a
0.14 ± 0.01a
n-Hexadecanoic acid
33.51
0.12 ± 0.03a
0.16 ± 0.01a
0.29 ± 0.04b
(S)-2-Amino-4-methylpentanoic acid
2.99
0.16 ± 0.01a
0.21 ± 0.01b
0.25 ± 0.02c
Aldehydes
Benzaldehyde
21.04
2.58 ± 0.02a
3.93 ± 0.06b
3.02 ± 0.02ab
5-methyl-2-Furancarboxaldehyde
21.78
0.58 ± 0.05c
0.77 ± 0.01a
3.63 ± 0.05b
(E-E)-2,4-Decadienal
24.72
0.31 ± 0.01c
0.19 ± 0.00b
0.06 ± 0.00a
5-Hydroxymethyl-2-furaldehyde
30.61
0.06 ± 0.00a
0.08 ± 0.00a
0.14 ± 0.01b
Ketones
5-pentyl-2(5H)-furanone
27.42
0.01 ± 0.00a
0.13 ± 0.01b
0.49 ± 0.08c
Ethanone, 1-(2-hydroxy-5-methylphenyl)-
28.41
0.15 ± 0.01a
0.15 ± 0.00a
0.31 ± 0.04b
2,3-Pentanedione
7.90
0.19 ± 0.02c
0.13 ± 0.01b
0.04 ± 0.00a
Aromatic compounds
Benzene, ethyl-
9.81
0.03 ± 0.00a
–
–
Benzene, (2-methyl-1-propenyl)-
19.66
0.19 ± 0.03b
0.04 ± 0.01a
–
Benzene, 1-(1,5-dimethyl-4-hexenyl)-4-methyl-
24.25
0.73 ± 0.01b
0.64 ± 0.02ab
0.59 ± 0.05a
“2,6-bis (1,1-dimethylethyl)-4-methyl-phenol
25.70
5.06 ± 0.01b
2.58 ± 0.02ab
2.14 ± 0.04a
Phenol, 4-methyl-
27.35
0.04 ± 0.00a
0.05 ± 0.01a
3.07 ± 0.07b
Phenol, 2,4-bis(1,1-dimethylethyl)-
29.24
0.13 ± 0.01a
0.18 ± 0.00ab
0.22 ± 0.02b
Amines
2-Pyridinamine
15.63
0.26 ± 0.04a
0.42 ± 0.02b
0.53 ± 0.05c
Alkanes and Alkynes
4,8,8-Trimethyl-2-methylene-4-vinylbicyclo[5.2.0]nonane
22.11
3.69 ± 0.06a
3.64 ± 0.03a
3.88 ± 0.04ab
4-Nonyne
7.65
0.21 ± 0.01c
0.17 ± 0.01b
0.14 ± 0.02a
Heptadecane
23.45
0.15 ± 0.00b
0.06 ± 0.01a
0.03 ± 0.00a
Octane
2.84
0.77 ± 0.01c
0.33 ± 0.03b
0.23 ± 0.01a
Undecane
8.85
0.01 ± 0.00a
0.04 ± 0.01a
0.14 ± 0.00b
1-Decyne
15.98
0.06 ± 0.00a
0.08 ± 0.01a
0.08 ± 0.01a
Pentadecane
20.78
2.55 ± 0.05a
3.06 ± 0.08b
3.55 ± 0.02c
Heptadecane
23.45
0.15 ± 0.01b
0.06 ± 0.01a
0.03 ± 0.00a
Ethers
Dimethyl ether
4.61
0.12 ± 0.00a
0.29 ± 0.02b
0.25 ± 0.06b
Other
1H-indole
30.27
0.06 ± 0.01a
0.09 ± 0.01a
0.36 ± 0.04b
2-Thiopheneacetonitrile, tetrahydro-
26.88
0.76 ± 0.02a
1.86 ± 0.08b
1.86 ± 0.00b
5-Acetyl-2,3-dihydro-1H-pyrrolizine
27.67
0.23 ± 0.06a
0.25 ± 0.01a
0.27 ± 0.01a
8-hydroxy-6-methoxy-3-methyl-3,4-dihydroisochromen-1-one
34.73
0.44 ± 0.01a
0.51 ± 0.01b
0.70 ± 0.00c
Ʃ Total amino acids
55.76 ± 1.52a
56.87 ± 1.55ab
60.99 ± 1.63b
3.6 Free amino acid composition
The free amino acid composition of seabass fish essence soup from extended boiling is given in Table 2. Free amino acids are very important to the flavor of fish soup (Zhang et al., 2013). The amino acids found in fish essence soups are primarily from the fish proteins. The amino acid content in the soup was significantly affected by the boiling duration. Overall, there were 17 different amino acids identified in the fish soup samples. Among them, 9 (Thr, Val, Met, Ile, Phe, Lys, His, and Arg) were essential ones, and 8 amino acids (Asp, Ser, Glu, Pro, Gly, Ala, Cys, and Tyr) were non-essential. Gaber et al. (2015) has also observed a similar pattern of amino acids in seabass fish. This study found that the soup had Gly as the major amino acid and Tyr as a minor amino acid after prolonged boiling. Asp, Glu, Pro, and Ala were also found at high levels in the soup. Two kinds of trends were observed for the amino acids in fish soup, increasing or decreasing with extended boiling. The amino acids Thr, Ser, Pro, Gly, Val, Leu, Ile, Tyr, Phe, Lys, and His significantly increased, while Asp, Glu, Ala, Cyst, Met, and Arg decreased in the soup with extended boiling time. The amino acids found in this soup contribute to four major tastes: umami, sour, sweet, and bitter. The results indicate that prolonged boiling significantly affected the taste; particularly umami and a sour taste of the soup decreased, while sweet and bitter tastes increased. However, the improved taste scores in sensory analysis (See Fig. 5D) of the fish soup indicate that the consumers liked the soup, which might be influenced by Thr, Pro, Ala, and Gly contributing to sweet taste. The amino acids in the soup could be transformed into racemic mixtures by splitting off the hydrogen atom from the α-position of the carbon atom followed by planar carbanion, thus reducing the availability of free amino acids. Csapo et al. (2009) reported that racemization depends mainly on the three important factors pH, temperature, and R group of the amino acids. Bellagamba et al. (2015) observed that animal proteins that were processed under a higher temperature (>115 °C) had significantly increased racemization level of amino acids. In addition, Kaur et al. (2014) reported that prolonged cooking might modify the amino acids and lead to formation of “limit peptides,” which could not be broken further and adversely affect their level and bioavailability. Note: Data are presented as mean ± standard deviation. Different superscripts show in each row above results indicate significant differences.
Amino acid (%, Relative concentration)
Boiling time (H)
5
7
9
Aspartic acid (Asp)
87.04 ± 0.56c
85.02 ± 2.1b
80.41 ± 0.78a
Threonine (Thr)
12.58 ± 0.75a
23.97 ± 0.71b
56.55 ± 0.14c
Serine (Ser)
11.41 ± 0.56a
17.39 ± 0.26b
20.20 ± 0.89c
Glutamic acid (Glu)
85.86 ± 1.03b
85.49 ± 1.12b
56.83 ± 1.01a
Proline (Pro)
73.28 ± 0.78a
81.58 ± 0.45b
109.51 ± 2.56c
Glycine (Gly)
179.45 ± 2.1a
194.46 ± 1.78b
201.04 ± 0.78c
Alanine (Ala)
82.56 ± 0.91c
71.18 ± 0.89b
57.04 ± 0.88a
Cysteine (Cys)
5.12 ± 1.05b
0.94 ± 0.1a
0.54 ± 0.01a
Valine (Val)
15.51 ± 0.89a
24.26 ± 1.22b
26.58 ± 1.24c
Methionine (Met)
6.51 ± 0.05b
6.25 ± 0.12b
3.44 ± 0.1a
Isoleucine (Ile)
7.37 ± 0.56a
10.36 ± 0.07b
12.08 ± 0.05c
Leucine (Leu)
19.09 ± 0.81a
28.45 ± 1.45b
33.47 ± 0.14c
Tyrosine (Tyr)
1.51 ± 0.03a
2.14 ± 0.74b
2.72 ± 0.12b
Phenylalanine (Phe)
2.06 ± 0.01a
3.61 ± 0.02b
4.71 ± 0.44c
Lysine (Lys)
16.12 ± 0.41a
24.61 ± 0.45b
27.57 ± 1.41c
Histidine (His)
3.88 ± 0.10a
5.77 ± 0.11b
6.83 ± 0.17c
Arginine (Arg)
25.02 ± 0.16c
23.46 ± 0.41b
16.51 ± 0.48a
Ʃ Total amino acids
634.37 ± 10.76
688.94 ± 12.00
716.03 ± 11.20
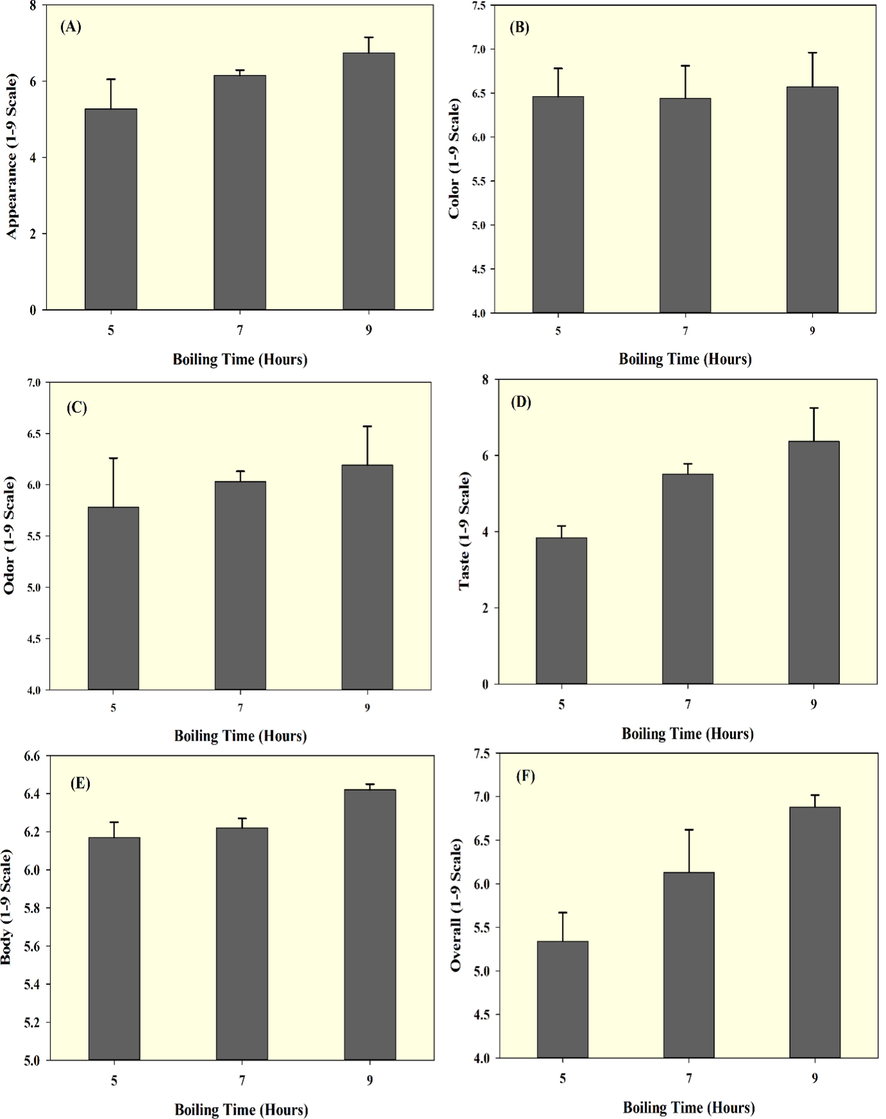
Sensory characteristics of seabass fish essence soup prepared with various boiling times.
3.7 Fatty acid compositions
The fatty acid profiles of seabass fish essence soups from extended boiling are given in Table 3. This study found a total of twenty-five fatty acids, which includes 12 saturated fatty acids (SFA), and 13 unsaturated fatty acids. Prolonged boiling significantly affected the fatty acid composition of the fish essence soup, though there was no lack of fatty acids observed in the fish soups after boiling. Neff et al. (2014) observed fatty acid contents in fish cooked by various methods, and their study did not find considerable differences in the fatty acid level compared with uncooked fish. The results showed that, except for lignoceric acid, the other fatty acids in the soup were not adversely affected. Stearic acid, cis-eicosenoic acid, eicosapentaenoic acid, and nervonic acids were slightly increased in the fish essence soup, and the differences were not large between the 7 h and the 9 h cases but compared with 5 h they were significant ( P > 0.05). Among the different fatty acids, palmitoleic acid (POA) (13.67%), oleic acid (OA) (18.78%), linoleic acid (LA) (17.65%), eicosapentaenoic acid (EPA) (8.02%) and docosahexaenoic acid (DHA) (26.66%) were the predominant ones. POA exhibits various health-enhancing properties, including anti-inflammatory and lipid lowering effects, and control of cardiovascular disease onset (Morse, 2015). OA exhibits a wide range of modulatory physiological functions and various health benefit effects on humans, including anti-cancer, autoimmune, and anti-inflammatory effects (Sales-Campos et al., 2013). Similarly, the LA also exhibits anti-cancer, anti-atherosclerosis, and anti-inflammatory effects, and WHO recommends that LA should be consumed for up to 10% as an energy source in the human diet (Jandacek, 2017). EPA and DHA have been widely reported in marine sources, especially in seabass fish (C huang et al., 2012). The EPA is recognized as an essential fatty acid, improving cell viability and protecting the neurons (Dyall, 2015). DHA is consumed mainly in the diet for improving brain function and as well as for the improvement of nervous and visual systems (Bradbury, 2011). In combination with DHA, the EPA serves as a precursor of eicosanoids, which are widely known to lower the incidence of cardiovascular disease, rheumatoid diseases, and various inflammatory malfunctions. Domiszewski et al. (2011) observed that fish cooked by boiling had improved omega 3 and omega 6 fatty acid levels. The prolonged boiling could have thermally extracted fatty acids to the soup liquid from the muscles and other parts of minced fish, and the extraction might continue with extended boiling time giving improved fatty acids content, as observed in the seabass fish essence soup. Note: Data are presented as mean ± standard deviation. Different superscripts show in each row above results indicate significant differences.
Fatty acid (%, Relative concentration)
Boiling time (H)
5
7
9
C12:0 Lauric acid
0.05 ± 0.00a
0.08 ± 0.02a
0.12 ± 0.01b
C13:0 Tridecanoic acid
0.01 ± 0.00a
0.04 ± 0.01b
0.08 ± 0.01c
C14:0 Myristic acid
0.94 ± 0.06a
1.04 ± 0.03b
1.15 ± 0.03c
C14:1 Myristoleic acid
0.01 ± 0.00a
0.11 ± 0.00b
0.25 ± 0.08c
C15:0 Pentadecanoic acid
0.19 ± 0.00a
0.22 ± 0.00b
0.24 ± 0.02b
C16:0 Palmitic Acid
1.17 ± 0.12a
1.60 ± 0.26b
1.89 ± 0.09c
C16:1 Palmitoleic acid
8.17 ± 0.02a
9.32 ± 0.53b
9.80 ± 0.33c
C17:0 Heptadecanoic acid
0.71 ± 0.00a
0.90 ± 0.10b
1.00 ± 0.02c
C17:1 cis-10 Heptadecanoic acid
0.55 ± 0.00a
0.60 ± 0.03a
0.85 ± 0.00b
C18:0 Stearic acid
1.40 ± 0.01a
1.34 ± 0.00a
1.80 ± 0.08b
C18:1n9c Oleic acid
10.90 ± 0.53a
12.70 ± 0.6b
14.05 ± 0.68c
C18:2n6c Linoleic acid
10.71 ± 0.52a
11.83 ± 0.2b
12.82 ± 0.54c
C18:3n6 γ -Linolenic acid
0.08 ± 0.010a
0.10 ± 0.01b
0.15 ± 0.01c
C20:0 Arachidic acid
0.57 ± 0.04c
0.39 ± 0.04b
0.28 ± 0.010a
C20:1n9 Eicosenoic acid
1.09 ± 0.034a
1.24 ± 0.08b
1.49 ± 0.02c
C20:2 cis- Eicosadienoic acid
0.26 ± 0.009a
0.30 ± 0.01b
0.35 ± 0.02b
C20:4n6 Arachidonic acid
0.02 ± 0.001ab
0.03 ± 0.00b
0.07 ± 0.00a
C20:5n3 Eicosapentaenoic acid
4.79 ± 0.093a
5.45 ± 0.22ab
5.82 ± 0.27b
C21:0 Henicosanoic acid
0.05 ± 0.006a
0.12 ± 0.03b
0.19 ± 0.02c
C22:0 6n3 Docosahexaenoic acid
14.70 ± 1.04a
18.01 ± 1.82b
20.70 ± 0.19c
C22:1n9 Erucic acid
0.19 ± 0.008a
0.24 ± 0.01b
0.32 ± 0.02c
C22:2 Docosadienoic acid
0.84 ± 0.050a
1.03 ± 0.05b
1.18 ± 0.09c
C23:0 Tricosanoic acid
0.04 ± 0.003a
0.07 ± 0.00b
0.14 ± 0.02c
C24:0 Lignoceric acid
0.14 ± 0.195b
0.05 ± 0.16a
0.08 ± 0.01ab
C24:1n9 Nervonic acid
0.22 ± 0.003a
0.33 ± 0.05b
0.40 ± 0.02c
Ʃ Total fatty acids
57.48 ± 3.12a
67.15 ± 3.79b
75.63 ± 3.81c
3.8 Sensory characteristics
The sensory characteristics of fish essence soup prepared with various boiling times are shown in Fig. 5A-F. Overall, the results show that the seabass fish essence soup is acceptable to the consumers. However, the scores for sensory characteristics were not very high, and it could be because the consumers are not used to this novel type of product since no similar products are commercially available. The appearance scores of fish essence soup are shown in Fig. 5A. Increasing the boiling time significantly improved the appearance scores of fish soup. Color is the key indicator that can help consumers quickly decide on a food product (Karimah et al., 2019). The color score did not significantly differ for 5 h and 7 h boiled fish essence soups, whereas the 9 h boiling gave higher color scores. The results showed that consumers had preferred the soup with yellowish beige color, especially from the 9 h treatment as compared to other treatments (Fig. 5B). The odor score of the fish essence soup gradually increased with boiling time. 9 h of boiling gave the highest odor scores, followed by 7 h and 5 h (Fig. 5C). The prolonged boiling could minimize the fishy smell of the soup, and it could induce protein hydrolysis and release amino acids, which might be improved the soup odor scores. Similarly, the taste scores of fish essence soup also tended to improve with boiling time (Fig. 5D). Probably this was due to the added plant-based ingredients in the soup, which naturally promoting good flavors and taste, and furthermore, the amino acids that released from prolonged boiling process might also contribute to the taste profile of the food. Furthermore, the added fruits and vegetables could also contribute to the soup’s taste. The formation of MRP during boiling could also impact the flavor. Overall, the consumers preferred the 9 h treatment for the taste of the fish soup. Similarly, the body score for the fish essence soup increased with extended boiling (Fig. 5E). The differences between 5 h and 7 h in scores were minimal; however, a larger change was observed when the soup was boiled for 9 h. Extending the thermal treatment could release fats and low molecular weight protein peptides, which could be the major reasons increasing the soup's body. Kumpulainen et al. (2018) reported that extended cooking of soup could mask some of its sensory properties and diminish the differences identified by the panelists. This might be the reason that extended boiling process had significantly increased the soup’s sensory scores. Finally, the overall scores of fish essence soup (Fig. 5F) also clearly indicated that the consumers highly prefer the fish soup with the longest extended boiling time. Keswet and Abia (2020) reported that fresh fish soup with additional ingredients received higher panelist scores with extended processing.
4 Conclusion
This study explored extended boiling that significantly improved the seabass fish essence soup quality. The prolonged thermal processing of soups increased hydrolysis of macromolecules such as protein, starch and lipids and thus generated various monomolecular and non-monomolecular compounds. Furthermore, the soup also included several fruits and vegetables besides the fish, and those materials released various phytochemicals into the fish soup upon extended thermal processing. The prolonged boiling somewhat affected the physical characteristics (color, density, and viscosity) of fish essence soup. Overall, the proximate composition was not much affected, aside from the fish soup's protein and lipid contents. Antioxidant activities of fish essence soup were high, especially in the 9 h boiled samples, and the increases in phenolics, MRPs, and amino acids could contribute to the antioxidant activities. Terpenes, sulfur-containing compounds, alcohols, acids, aldehydes, and alkanes were the dominant flavor compounds in the fish soup, and during extended boiling the level of pleasant flavors in the fish essence soup improved. Most of the essential amino acids in the soups were not affected by extending boiling. A similar trend was also observed in the soup's fatty acids contents. Consumer preference of the newly formulated seabass fish soup was improved with extended boiling time. This study recommends that the seabass essence soup extract is an excellent source of the rich of metabolically active and healthy ingredient food which is perfectly suitable for all ages particularly the elderly people, and furthermore, adopting extended boiling time could greatly improve the functional properties and palatability of the soup.
Acknowledgments
The authors are very grateful to Thailand Science Research and Innovation (TSRI) and the National Innovation Agency (NIA) (Grant no. RDG62I0012) for the financial support of this research. The authors would also like to thank Hat Yai University and Prince of Songkla University (Surat Thani Campus), and the Food Innovation and Product Development Laboratory for completing this study. Furthermore, the authors would like to express their gratitude to Mr. Thanapong Wunsaeng, Mr. Thanakorn Pruekrattanapa, and Assistant Professor Pirat Watcharapun for helping to finish this research. Authors also express sincere gratitude to Associate Professor Dr. Seppo Karrila for proofreading this manuscript before submission.
Declaration of Competing Interest
The authors declare that they have no known competing financial interests or personal relationships that could have appeared to influence the work reported in this paper.
References
- Variation in Nutrient Composition of Seafood from North West Africa: Implications for Food and Nutrition Security. Foods. 2020;9(10):1516.
- [Google Scholar]
- Impact of fish protein concentrate on apparent viscosity and physical properties of soy protein concentrate subjected to thermomechanical treatment. J. Food Eng.. 2019;259:34-43.
- [CrossRef] [Google Scholar]
- Impact on chemical profile in apple juice and cider made from unripe, ripe and senescent dessert varieties. LWT - Food Sci. Technol.. 2016;65:436-443.
- [CrossRef] [Google Scholar]
- A review on mechanisms and commercial aspects of food preservation and processing. Agric. Food Secur. 2017;6(1):51.
- [CrossRef] [Google Scholar]
- Effect of heat treatment and enzymatic protein hydrolysis on the degree of hydrolysis and physicochemical properties of edible bird's nest. Food Res.. 2019;3(6):664-677.
- [CrossRef] [Google Scholar]
- AOAC, 2005. Association of Official Analytical Chemist, eighteenth ed. AOAC International, Gaithersburg, Maryland, USA.
- Shelf-life extension of refrigerated sea bass slices wrapped with fish protein isolate/fish skin gelatin-ZnO nanocomposite film incorporated with basil leaf essential oil. J. Food Sci. Technol.. 2015;52(10):6182-6193.
- [CrossRef] [Google Scholar]
- The impact of processing on amino acid racemization and protein quality in processed animal proteins of poultry origin. Ital. J. Anim. Sci.. 2015;14(2):3770.
- [CrossRef] [Google Scholar]
- Nutrient requirements of marine food fish cultured in Southeast Asia. Aquaculture. 1997;151(1):283-313.
- [CrossRef] [Google Scholar]
- Docosahexaenoic acid (DHA): an ancient nutrient for the modern human brain. Nutrients. 2011;3(5):529-554.
- [CrossRef] [Google Scholar]
- Fatty acid composition of 12 fish species from the Black sea. J. Food Sci.. 2012;77(5):C512-C518.
- [CrossRef] [Google Scholar]
- Use of terpenoids as natural flavouring compounds in food industry. Recent Pat. Food Nutr. Agric.. 2011;3(1):9-16.
- [CrossRef] [Google Scholar]
- Physicochemical, technological and sensory characteristics of a rice (Oryza sativa L.) and bean (Phaseolus vulgaris L.) soup prepared by extrusion. Int. J. Food Sci. Technol. 2013:n/a.
- [CrossRef] [Google Scholar]
- Exploring the experience and determinants of the food choices and eating practices of elderly Thai people: A qualitative study. Nutrients. 2020;12(11):3497.
- [Google Scholar]
- Assessment of total phenolic and flavonoid content, antioxidant properties, and yield of aeroponically and conventionally grown leafy vegetables and fruit crops: a comparative study. Evid. Based Complement. Alternat. Med.. 2014;2014:1-9.
- [CrossRef] [Google Scholar]
- Effects of thermal treatment on the phenolic content and antioxidant activity of some vegetables. Asia Pac. J. Clin. Nutr.. 2010;2(3):93-100.
- [CrossRef] [Google Scholar]
- The D-amino acid content of foodstuffs (A Review) Acta Univ. Sapientiae, Aliment.. 2009;2(1):5-30.
- [Google Scholar]
- Influence of fermentation with Hanseniaspora sp. yeast on the volatile profile of fermented apple. J. Agric. Food Chem.. 2012;60(39):9815-9821.
- [CrossRef] [Google Scholar]
- Effect of different heat treatments on lipid quality of striped catfish (Pangasius hypophthalamus) Acta Sci. Pol. Technol. Aliment.. 2011;10(3):359-373.
- [Google Scholar]
- Long-chain omega-3 fatty acids and the brain: a review of the independent and shared effects of EPA, DPA and DHA. Front. Aging Neurosci.. 2015;7:52.
- [CrossRef] [Google Scholar]
- Gutted and un-gutted Sea Bass (Dicentrarchus Labrax) stored in ice: Influence on fish quality and shelf-life. Int. J. Food Prop.. 2006;9(2):331-345.
- [CrossRef] [Google Scholar]
- Maillard reaction products derived from food protein-derived peptides: insights into flavor and bioactivity. Crit. Rev. Food Sci. Nutr.. 2020;60(20):3429-3442.
- [CrossRef] [Google Scholar]
- Amino acid requirments of Sea bass (Dicentrarchus Iabrax) Int. J. Agric. Sci. Nat. Resour.. 2015;3(2):1-6.
- [Google Scholar]
- The effect of freeze-drying on the properties of polish vegetable soups. Appl. Sci.. 2021;11(2):654.
- [Google Scholar]
- Linoleic acid: A nutritional quandary. Healthcare (Basel, Switzerland). 2017;5(2):25.
- [CrossRef] [Google Scholar]
- Modifications in gut microbiota and fermentation metabolites in the hindgut of rats after the consumption of galactooligosaccharide glycated with a fish peptide. Food Funct.. 2018;9(5):2853-2864.
- [CrossRef] [Google Scholar]
- Sensory evaluation of Bonylip Barb fish meat cream soup. World News Nat. Sci.. 2019;26:146-156.
- [Google Scholar]
- Effect of different cooking methods on minerals, vitamins, and nutritional quality indices of Rainbow Trout (Oncorhynchus mykiss) Int. J. Food Prop.. 2016;19(11):2471-2480.
- [CrossRef] [Google Scholar]
- Microstructure and protein digestibility of beef: The effect of cooking conditions as used in stews and curries. LWT - Food Sci. Technol.. 2014;55(2):612-620.
- [CrossRef] [Google Scholar]
- Sensory evaluation of four pepper soup dishes prepared with four varieties of protein sources using itsekiri peper soup spices. Afr. J. Food Sci.. 2020;14(4):98-101.
- [CrossRef] [Google Scholar]
- Effect of thickener type on the rheological properties of hot thickened soups suitable for elderly people with swallowing difficulty. Prev. Nutr. Food Sci.. 2014;19(4):358-362.
- [CrossRef] [Google Scholar]
- Effect of component quality on sensory characteristics of a fish soup. Food Sci. Nutr.. 2018;6(5):1220-1228.
- [CrossRef] [Google Scholar]
- The effect of ginger and garlic addition during cooking on the volatile profile of grass carp (Ctenopharyngodon idella) soup. J. Food Sci. Technol.. 2016;53(8):3253-3270.
- [CrossRef] [Google Scholar]
- Effects of Quercetin and cinnamaldehyde on the nutrient release from beef into soup during stewing process. LWT-Food Sci. Technol.. 2020;131:109712
- [CrossRef] [Google Scholar]
- Antioxidant and free radical-scavenging activities of chickpea protein hydrolysate (CPH) Food Chem.. 2008;106(2):444-450.
- [CrossRef] [Google Scholar]
- Antioxidant properties of several tropical fruits: A comparative study. Food Chem.. 2007;103(3):1003-1008.
- [CrossRef] [Google Scholar]
- Nutritional composition, phenolic compounds, nitrate content in eatable vegetables obtained by conventional and certified organic grown culture subject to thermal treatment. Int. J. Food Sci. Technol.. 2009;44(6):1118-1124.
- [CrossRef] [Google Scholar]
- Migration of nutrients and formation of micro/nano-sized particles in Atlantic salmon (Salmo salar) and bighead carp (Aristichthys nobilis) head soups. Food Biosci.. 2020;36:100646.
- [CrossRef] [Google Scholar]
- Flavor components of some processed fish and fishery products of Japan. Bangladesh J. Fish. Res.. 2002;6(1):89-97.
- [Google Scholar]
- Min, Q., 2018. Savory flavor formulations from Maillard reaction of hydrolysated COD by-products and sugars. United Nations University Fisheries Training Programme, Iceland (final project). http://www.unuftp.is/static/fellows/document/min15prf.pdf/ (accessed 15 May 2020).
- Efficiency of newly formulated functional instant soup mixtures as dietary supplements for elderly. Heliyon. 2020;6(1):e03197.
- [CrossRef] [Google Scholar]
- Preparation and the shelf-life assessment of ready-to-eat fish soup. Eur. Food Res. Technol.. 2005;220(3):305-308.
- [CrossRef] [Google Scholar]
- Are some health benefits of palmitoleic acid supplementation due to its effects on 5′ adenosine monophosphate-activated protein kinase (AMPK)? Lipid Technol.. 2015;27(12):278-281.
- [CrossRef] [Google Scholar]
- Effects of different cooking methods on fatty acid profiles in four freshwater fishes from the Laurentian Great Lakes region. Food Chem.. 2014;164:544-550.
- [CrossRef] [Google Scholar]
- Studies on products of browning reactions: Antioxidative activities of product of browning reaction pepared from glucosamine. Japan J. Nutr.. 1986;44:307-315.
- [CrossRef] [Google Scholar]
- Quality assessment of gutted wild sea bass (Dicentrarchus Labrax) stored in ice, cling film and aluminium foil. Eur. Food Res. Technol.. 2005;220(3–4):292-298.
- [CrossRef] [Google Scholar]
- Some quality parameters of powdered soups prepared from different fish species. Braz. Arch. Biol. Technol.. 2019;62
- [CrossRef] [Google Scholar]
- Influence of stewing time on the texture, ultrastructure and in vitro digestibility of meat from the yellow-feathered chicken breed. Anim. Sci. J.. 2018;89(2):474-482.
- [CrossRef] [Google Scholar]
- Evaluations of lactic acid bacteria as probiotics for juvenile seabass Lates calcarifer. Aquac Res.. 2008;39(2):134-143.
- [CrossRef] [Google Scholar]
- An overview of the modulatory effects of oleic acid in health and disease. Mini Rev. Med. Chem.. 2013;13(2):201-210.
- [CrossRef] [Google Scholar]
- Formulation of vegetable soup mixture using physically modified sweet potato starch as a thickener. J. Food Process. Technol.. 2014;5(4):313.
- [CrossRef] [Google Scholar]
- Bread characteristics and antioxidant activities of Maillard reaction products of white pan bread containing various sugars. LWT- Food Sci. Technol.. 2018;95:308-315.
- [CrossRef] [Google Scholar]
- Nutritional considerations for healthy aging and reduction in Age-Related Chronic Disease. Adv. Nutr.. 2017;8(1):17-26.
- [CrossRef] [Google Scholar]
- Effectiveness of essence of chicken on cognitive function improvement: A randomized controlled clinical trial. Nutrients. 2018;10(7):845.
- [CrossRef] [Google Scholar]
- Optimization of the extraction and stability of antioxidative peptides from Mackerel (Pneumatophorus japonicus) protein. Biomed. Res. Int.. 2017;2017:1-14.
- [CrossRef] [Google Scholar]
- Processed foods: contributions to nutrition. Am. J. Clin. Nutr.. 2014;99(6):1525-1542.
- [CrossRef] [Google Scholar]
- Effects of different treatments on fishy odor of fish soups. J. Aquat. Food Prod. Technol.. 2018;27(6):722-732.
- [CrossRef] [Google Scholar]
- Analysis of flavor-related compounds in four edible wild mushroom soups. Microchem. J.. 2020;159:105548.
- [CrossRef] [Google Scholar]
- Changes in nutrient profile and antioxidant activities of different fish soups, before and after simulated gastrointestinal digestion. Molecules. 2018;23(8):1965.
- [Google Scholar]
- Effect of cooking temperatures on protein hydrolysates and sensory quality in crucian carp (Carassius auratus) soup. J. Food Sci. Technol.. 2013;50(3):542-548.
- [CrossRef] [Google Scholar]
- Purification and characterisation of a new antioxidant peptide from chickpea (Cicer arietium L.) protein hydrolysates. Food Chem.. 2011;128(1):28-33.
- [CrossRef] [Google Scholar]


