

Translate this page into:
Biosynthesis of Tithonia diversifolia leaf mediated Zinc Oxide Nanoparticles loaded with flamboyant pods (Delonix regia) for the treatment of Methylene Blue Wastewater
⁎Corresponding authors at: Department of Chemical Engineering, Landmark University, PMB 1001, Omu-Aran, Kwara State, Nigeria (K.S. Obayomi). obayomikehindeshola@gmail.com (Kehinde Shola Obayomi), obayomi.kehinde@lmu.edu.ng (Kehinde Shola Obayomi), johnlsy@curtin.edu.my (Sie Yon Lau)
-
Received: ,
Accepted: ,
This article was originally published by Elsevier and was migrated to Scientific Scholar after the change of Publisher.
Abstract
Abstract
The large capacity of wastewater production due to rapid growth of industries has resulted in limited water resources. The need to protect and conserved water resources have enforced researchers worldwide to focus on the development of an effective, economical and environmentally friendly novel materials. In this study, green synthesis of zinc oxide nanoparticles (ZnONPs) using T. diversifolia leaf extract by hydrothermal method was loaded on the surface of flamboyant pods (Delonix regia) activated carbon (FPAC). The developed ZnONPs loaded on the surface flamboyant pods activated carbon (ZnONPs-FPAC) was used successfully to remove of methylene blue (MB) from aqueous solution. The developed FPAC, ZnONPs and ZnONPs-FPAC were characterized UV–Vis spectroscopy, Fourier-transform infrared spectroscopy (FT-IR), X-ray diffraction (XRD), Scanning electron microscopy with energy dispersive X-ray spectroscopy (SEM/EDX), Transmission electron microscope (TEM) and Brunauer-Emmett-Teller (BET) techniques. The antibacterial activity of the synthesized FPAC, ZnONPs and ZnONPs-FPAC were screened and the results revealed that ZnONPs has an excellent antibacterial activity when compared. Batch adsorption studies were conducted to investigate the influence of process parameters such as initial concentration, contact time, pH, adsorbent dosage and temperature on MB uptake. The high BET surface area of 794.48 m2/g and mesoporous ZnONPS-FPAC developed gave good adsorption capacity of 186 mg/g. Equilibrium adsorption data of MB were modelled using Langmuir, Freundlich, Temkin and Dubinin–Radushkevich (D–R) isotherm model. The adsorption of MB onto ZnONPs-FPAC was best described by Freundlich model indicating surface heterogeneity, and pseudo-second-order kinetics according to (normalized standard deviation), SSE (sum of square error), and R2 (coefficient of determination) values. The results of the thermodynamic suggest that the adsorption process of MB onto ZnONPs-FPAC is endotherm, favourable, spontaneous, and physical. In nature. The reusability of ZnONPs-FPAC was examined upto five cycles with no significant loss in removal efficiency. The mean free energy (E), and Enthalpy ( ) values calculated, suggested that the adsorption mechanism of MB on ZnONPs-FPAC is dominated by physical adsorption.
Keywords
Green synthesis
Zinc oxide nanoparticles
Tithonia diversifolia
Antibacterial activity
Activated carbon (Delonix regia)
Adsorption studies

1 Introduction
Rapid industrialization, urbanization, population growth and advancement in science and technology has regarded as a major environmental catastrophe worldwide (Chakraborty et al., 2020a,b; Deb et al., 2021; Obayomi et al., 2020a). Industries such as pulp and paper, food technology, leather tanning, textile, leather tanning, paper, cosmetic, and plastic, discharge large volume of wastewater containing dyes (Devi et al., 2020). The indiscriminate discharge of coloured wastewater to the environment without adequate treatment could destabilize biological activity of aquatic life and ecosystem due to light penetration thereby affecting food chain (Hanafy, 2021). The existence of dyes in water bodies even at minute concentration is extremely undesirable and significant due to their mutagenic, carcinogenic and low degradability effect on human (Roy and Saha, 2021). Methylene blue (MB) is one of the most commonly used basic dyes in several applications most especially in textiles industry. It causes severe toxic effects to human such as dyspnea, profuse sweating, chest pain, severe headache, vomiting, diarrhea, cyanosis, skin irritation, nausea symptoms, methemoglobinemia and many more (Kamaraj et al., 2020). Thus, there is an urgent need to develop a robust, low cost and environmentally friendly innovative treatment technique to remove dye molecules from water bodies.
Numerous techniques such as coagulation, reverse osomosis, advanced oxidation, membrane separation, electrochemical processes, and adsorption among others have been employed to mitigate toxic dyes from wastewater (Liu et al., 2021a, 2021b; Wang and Yeap, 2021). Adsorption process is considered as the most popular technique, owing to its simplicity of design, availability of adsorbent materials, cost effective, eco-friendly, high removal efficiency, and ability to remove soluble as well as insoluble organic pollutants (Ebili et al., 2020; Awad et al., 2020; Palai et al., 2021). Activated carbon from natural and synthetic materials due to its porous structure and high surface area has considered as an effective adsorbent for removing organic and inorganic pollutants from wastewater. Several studies have utilized suitability of biowaste materials (agricultural wastes) for development of activated carbon as a result of their availability, cost effectiveness, environmental friendliness and high carbon content (Wong et al., 2018) as the presence of several functional groups such as carboxylic, keto, amine, aldehyde on its surface help to enhance the adsorptive efficiency of this waste thereby making them a potential adsorbent for pollutants removal (Chakraborty et al., 2020a,b). The use of biomasses as renewable precursors for the production of ACs has improved in recent years due to the need to reduce costs, reduce accumulated agro-industrial waste, and, most importantly, to carry out environmentally sound processes. The utilization of flamboyant pods (Delonix regia) as precursors for the production of a carbon activated material is a very successful example (Vargas et al., 2011a, 2011b; Vargas and Lopes, 2020). Flamboyant pods (Delonix regia) are lignocellulosic wastes that are abundant in several countries and have been used as a renewable adsorbent and low-cost precursor to prepare activated carbon for the removal of dyes and heavy metals. Previous studies have reported the physicochemical characterization of this biomass, which has shown a promising potential for use in water treatment (Vargas et al., 2012a; Vargas et al., 2012b; Dhaouadi et al., 2021).
Antimicrobial agents are agents that are either bactericidal (kill bacteria) or bacteriostatic (slow the growth of bacteria) without being highly toxic to nearby tissues, and they are the most important in the fight against infectious diseases (Singh et al., 2019). However, due to their widespread use and abuse, the emergence of bacterial resistance to antibacterial agents has become a major challenge today. The increasing resistance of microorganisms to antibacterial agents has resulted in serious health issues in recent years. Most infectious bacteria are resistant to at least one of the antibiotics commonly used to eliminate infection (Singh et al., 2021). This problem has motivated the development of new agents capable of effectively inhibiting the growth of microorganisms. Researchers have recently studied various nanosized antibacterial agents such as carbon-based nanoparticles, polymeric chitosan nanoparticles, metallic and metal oxide nanoparticles.
Recently, nanomaterials have gained great attention by scientific community owing to their multitude of applications in various disciplines due their non-toxicity, biocompatibility and morphology (Fakhari et al., 2019; Vijayakumar et al., 2020). Of these, metal oxide nanoparticles gain huge attention for wastewater treatment due to their unique properties which include excellent chemical and thermal stability, high surface area, surface functional groups and high adsorption capacity (Katarai and Garg, 2017; Zafar et al., 2018). Plants and their derivatives have been successfully used in the synthesis of various green nanoparticles, including zinc oxide, tungsten oxide, tin dioxide, iron oxide, titanium dioxide, platinum, palladium, silver, cobalt, gold, magnesium oxide, and copper (Mali et al., 2020; Luque et al., 2020). Among the various aforementioned nanoparticles, zinc oxide nanoparticles (ZnO-NPs) because of its vital qualities which include non-toxic nature, effectiveness, inexpensive production and surface functional groups has been used in wastewater treatment (Agarwal et al., 2017; Kamaraj et al., 2020). The development of ZnO-NPs via chemical, and physical techniques has been explored by several researchers; however, these techniques have limitations. The high amount of energy consumption, high temperature and pressure conditions and robust equipment required make them unattractive. The green synthesis approach which is the biological method has risen as an alternative eco-friendly and effective method. It has adopted the principles of green chemistry by minimizing the use of unsafe reagents and maximizing the efficiency of chemical processes (Bandeira et al., 2020a, 2020b). Currently, biological approach to ZnO NPs synthesis has become the most preferred synthesis route due to absence of toxic chemicals, cost effectiveness, and eco-friendly. Several studies revealed that the biological synthesis of ZnO nanoparticles is environmentally friendly when compared to conventional physical or chemical methods (Debnath and Mondal, 2020). The main benefits of biological synthesis are the use of renewable resources, safer solvents and auxiliaries while producing safer chemicals (Bandeira et al., 2020a, 2020b). Due to the cost-effectiveness, easy to process and non-toxic nature, plants leaf extracts are the most commonly used biological substrate for the green synthesis of metal oxide NPs (Naveed et al. 2017). Also, there is no exposure to health risks or concerns about safety issues during the process and product purification, thereby a preferred choice of application as antibacterial agent and wastewater treatment. In addition, plant extracts can be obtained in a straightforward manner by exposing the plant to a solvent, which is usually distilled water or ethanol (Bandeira et al., 2020a, 2020b; Weldegebrieal, 2020). Several plants leaf extracts such as Cassia fistula (Suresh et al., 2015), Pongamia pinnata (Sundrarajan et al., 2015). Tecoma castanifolia (Sharmila et al., 2019), Acalypha fruticosa (Vijayakumar et al., 2020), Moringa oleifera (Letsholathebe et al., 2021a, 2021b), Parthenium hysterophorus (Umavathi et al., 2021a, 2021b), Hibiscus rosa-sinensis (Debnath and Mondal, 2020), Prosopis juliflora (Mydeen et al., 2020) have been utilized for the synthesis of ZnONPs. Tithonia diversifolia, an essential part of the sunflower family, Asteraceae is commonly known as Mexican sunflower. It is used in traditional medicine for the treatment of liver disease, menstrual pain, inflammation, malaria, sore throat, diabetes, malaria and diabetes. T. diversifolia contains potent anticancer, anti-obesity and anti-inflammatory, neuroprotective and antioxidant activities (dos Santos Silva et al., 2021; Chunudom et al., 2020). In this study, T. diversifolia leaf extract was utilized to synthesis ZnONPs via green synthesis and was loaded on flamboyant pods (Delonix regia) activated carbon (ZnONP-FPAC) for the elimination of MB from aqueous solution. The potential applicability of the developed adsorbent for the removal of MB was tested in a batch system under different experimental conditions to determine the effect of process parameters such as pH, contact time, initial concentration and adsorbent dosage. The adsorption isotherm and adsorption kinetic models were studied to understand the adsorption mechanism. Furthermore, antimicrobial activity of the developed adsorbents against E. Coli, Pseudomonas aeruginosa, Bacillus subtilis, and salmonella sp. was also examine
2 Materials and methods
2.1 Materials and chemicals
T. diversifolia fresh leaves and Flamboyant pod (Delonix regia) were collected from Teaching and Research Farm in Landmark University, Nigeria. Potassium hydroxide (KOH), sodium hydroxide pellets (NaOH), Methylene blue (C16H18CIN3S), Mueller hinton ager, dimethyl sulfoxide (DMSO) and zinc nitrate hexahydrate (Zn(NO3)2.6H20) of analytical grade were purchased from Sigma Aldrich and used without further purification.
2.2 Plant extract preparation
T. diversifolia leaves were washed, dried and powdered. 10 g of the dried powdered leaf was added to 100 mL of double distilled water and was boiled at 70 °C under continuous stirring to achieve proper mixing for 15 min in a magnetic stirrer. The aqueous extract was cooled and then filtered with Whatman No. 1 filter paper in other to remove leaf debris. The filtered extract was later subjected to phytochemical screening following the standard procedure to identify the presence of active constituents such as flavonoid, tannin, glycoside, alkaloids, saponin, steroids, and phenol.
2.3 Green synthesis of ZnONPs
20 mL of plant extracts solution was taken into a 250 mL beaker and 100 mL of 0.1 M zinc nitrate was added and the mixture was vigorously stirred at 80 °C for 2 h. 50 mL of 2 M NaOH was added dropwise to the mixture at an interval of 5 min to raise the pH of the solution to 8. A greenish yellow precipitate was observed at the initial stage and after 2 h the precipitate changes to white. After this, the precipitate was allowed for 24 h to settle and centrifuged at 8000 rpm for 15 min. The collected sample was washed 3 times with deionized water and then finally dried in an oven at 60 °C for 8 h. After drying, the sample was annealed at 400 °C for 1 h (Fagier and Kumar, 2021). The calcined sample was crushed into fine powder and stored in an airtight container for further use.
2.4 Development of flamboyant pods activated carbon (FPAC)
Flamboyant pods were collected, washed and sun dried for 6 h and then oven dried at 108 °C overnight. The dried pods were weighed into a crucible and placed in a muffle furnace. The furnace was heated at 400 °C for 60 min at a heating rate of 20 °C/min under purified nitrogen (99.99%) atmosphere and 100 cm3/min flow rate. The prepared char was impregnated with KOH at a ratio of 2:1 (KOH/char) and was left overnight. When the activation process was completed, the sample was thoroughly washed with 0.1 M HCl solution followed by distilled water until a PH range of 6.8–7.0 was achieved; it was oven dried at 109 °C for 2 h, crushed to a particle size of 125 and finally stored in an airtight container for further analysis.
2.5 Development of ZnONPs-FPAC adsorbent
The development of ZnONPs-FPAC was done as per procedure of Aigbe and Kavaz (2021). Briefly, 5 g of ZnO-NPs was measured into 250 mL beaker containing 100 mL distilled water and stirred vigorously using a magnetic stirrer for 45 min. After that, 10 g FPAC was added into the solution with continuous stirring for another 1 h at 150 °C.Thereafter, the product was filtered and washed with double de-ionized water to remove impurities which are soluble. The sample was then calcinated at 200 °C for 2 h and stored in an airtight container for characterization.
2.6 Characterization of ZnONPs, FPAC and ZnONPs-FPAC
The synthesized materials were analyzed by Shimadzu UV– vis spectrophotometer (UV-1800) with the scanning recorded from 190 to 800 nm. X-ray diffractometer (XRD), Bruker D8 Advance model) pattern was applied to examine the crystallographic of the prepared materials using Cu - Kα radiation, 2θ range from 10° to 80° with 0.02° step size. Fourier-transform infrared (FTIR) spectra were collected (using an FT-IR, Agilent Cary 600) and used to investigate the functional groups of the materials. The FTIR peaks were observed and recorded over the range of 4000– cm−1. The surface morphology of the materials was investigated using a scanning electron microscope (SEM) (Zeiss Sigma, Germany) equipped with a Bruker energy dispersive X-ray spectroscopy (EDX) detector. Brunauer Emmett Teller (BET) (TristarTM II 3020, Micromeritics, USA) was used to determine the materials surface area, pore size and pore volume. The synthesized ZnO nanoparticles were characterized for their shape and size distribution using a high-resolution transmission electron microscope (HTEM) (JEM-2100F, Japan) coupled with EDX detector (JEOL-JED-2300).
2.7 Antibacterial activity of FPAC, ZnONPs and ZnONPs-FPAC
Antibacterial activities of the three developed materials (ZnONPs-FPAC, FPAC and ZnONPs) at different concentrations (25, 50 and 100 mg/mL) were tested against Gram negative (Pseudomonas aeruginosa, Salmonella typhi and Escherichia coli) and Gram positive (Bacillus subtilis) organisms. Agar-well diffusion method was used with 9 mm diameter wells and approximately 20 mL of Muller Hinton Agar (MHA). Streptomycin (10 mg/mL) was used as positive control while dimethyl sulfoxide (DMSO) was used as negative control. The wells were filled with 100 mL of the test material, allowed to stand for a while and incubated at 37 °C for 24 h. Thereafter, the diameter of the zone of inhibition was measured in millimeter. Statistical analysis was carried out using one-way analysis of variance (p = 0.05).
2.8 Equilibrium and kinetic adsorption studies
Batch adsorption studies were carried out to investigate the effect of initial MB concentration, temperature, pH and contact time on the adsorption of MB onto ZnONPs-FPAC adsorbent. Equilibrium adsorption studies were performed in a set of Erlenmeyer flasks (250 mL) containing 100 mL of the MB solutions at different initial concentrations (20–100 mg/L). About 0.1 g of ZnONPs-FPAC adsorbent was added, mixed and placed in water bath isothermal shaker at 35 °C for 2 h, and shaker speed of 140 rpm to attain equilibrium. The water-bath shaker temperature was adjusted to 45 °C and 55 °C, and similar procedure was repeated with another set of flasks containing same different initial dye concentrations (20–100 mg/L). The flasks were afterwards removed from the shaker for determination of final concentration of the solution using UV–vis spectrophotometer at maximum wavelength of 664 nm. The percentage removal and amount of the MB adsorbed at time t, at equilibrium
(mg/g) was calculated using the following equations.
The amount of MB dye adsorbed at a fixed time interval (t),
(mg/g) is given by;
2.9 Error analysis
Error analysis such as sum of square error (SSE) and normalized standard deviation
were employed in this study to predict the fitness suitability of the adsorption isotherm and kinetics models as a result of the integral bias resulting from the transformation which riding towards a diverse form of parameters estimation errors and fits distortion. The error analysis equations for sum of square error (SSE) and normalized standard deviation
is given by;
2.10 Adsorbent reusability
The ZnONPs-FPAC after MB adsorption experiment was simply recovered from the aqueous medium by filtering with filter paper, washed several times with ethanol and distilled water, and dried finally in an oven at 108 °C for 1 h. The recovered adsorbent was used again for the adsorption of MB repeatedly for five cycles under predetermined process conditions.
3 Results and discussion
3.1 Phytochemical screening of T. diversifolia
Phytochemical screening was done in this study to identify the presence of secondary metabolites in T. diversifolia extract and the resulted is presented in Table 1. The phytochemical screening of T. diversifolia extract revealed the presence of flavonoids, tannins, glycosides, alkaloids, saponins, steroids, and phenol while terpenoids was absent. flavonoids, glycosides, alkaloids, steroids and phenol in the extract were more when compared with tannins and saponins which were observed to be present in low amount. The presence of these bioactive compounds serves as antioxidants for neutralizing chelate metals, free radicals and reactive oxygen species (ROS) (Bandeira et al., 2020a, 2020b). Reports from literature have confirmed the active involvement of phenol and flavonoids in the formation, bio reduction, and stabilization of metals and metal oxide Marsoul et al., 2020; Sujamol et al., 2021). The functional groups present in the phytochemicals of T. diversifolia leaf extract is an indication that it can utilized for the green synthesis of nanoparticles thereby making the leaf a more valuable product. T. diversifolia leaf extract antioxidants are responsible for reducing zinc (II) ions to metallic zinc rather than forming coordinated complexes with them. Following zinc bioreduction, metallic zinc reacted with dissolved oxygen in the solution to form ZnO nuclei. It was discovered that T. diversifolia compounds act as a stabilizer, preventing agglomeration of particle and crystal growth. This mechanism is similar to the study reported by Gupta et al., (2018). Absence of plant constituents + Presence of plant constituents.
Plant constituents
Flavonoids
++
Tannins
+
Glycosides
++
Alkaloids
++
Saponins
+
Steroids
++
Phenol
++
Terpenoids
–
3.2 Characterization
3.2.1 UV–Vis absorption measurement of synthesized ZnONPs
UV–Vis absorption spectroscopy shows that synthesized ZnONPs exhibited strong absorption peak at 385 nm as depicted in Fig. 1.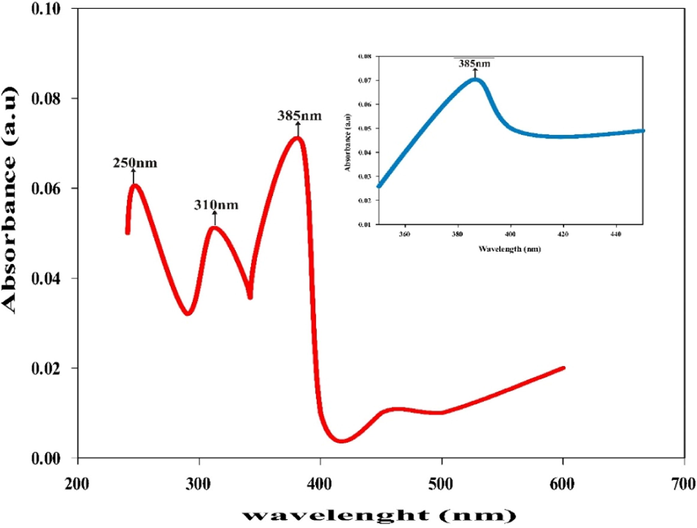
UV–Vis absorption spectra of ZnONPs by T. diversifolia leaf extract.
This peak confirmed the effective synthesis of ZnONPs from T. diversifolia leaf extract. This result was in agreement with recent findings of Sharmila et al., (2019) studied green synthesis of ZnO nanoparticles using Tecoma castanifolia leaf extract and reported the absorption peak at 380 nm. Umavathi et al. (2021a, 2021b), also reported the absorption peak of ZnONPs from P. hysterophorus at 380 nm.
3.2.2 TEM analysis
Transmission electron microscopy (TEM) is one of the vital tools for characterizing both nanoparticles and nanocomposites because it unravels their sizes, shapes and morphology (Dada et al., 2017). Fig. 2(a-d) show the TEM images at different magnifications. High resolution TEM images revealed a spherical shape of biosynthesized ZnO nanoparticles with average particles sizes ranging from 9.83 nm to 28.85 nm. The TEM images show that ZnO nanoparticles are not in physical contact with one another but are separated by uniform inter-particle distance. The presence of secondary metabolites serving as the capping agent and bioinorganic compounds in the leaves extract contributed to the thickness of the nanoparticles. Similar spherical shape was obtained from the studies carried out by Sharmila et al., (2019) and Rana et al., (2016). ZnO nanoparticles were synthesized by green synthetic route using Tecoma castanifolia and Terminalia chebula fruit extracts respectively (Rana et al., 2016; Sharmila et al., 2019). The reports from literature (Basnet et al., 2018; Brayner et al., 2010; Mahamuni et al., 2019; Talam et al., 2012) further supported the spherical shape of biosynthesized ZnO NPs found in the study.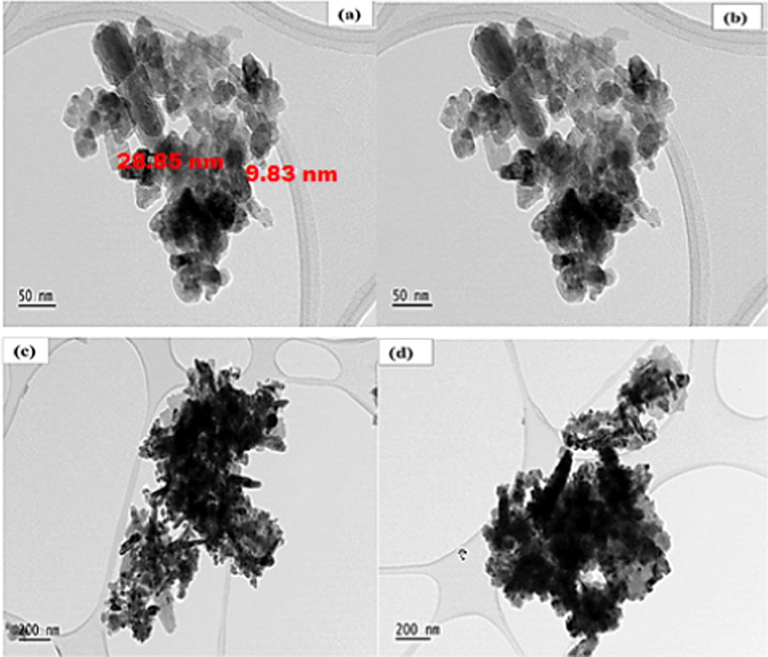
TEM images of biosynthesized ZnO nanoparticles using T. diversifolia leaf extract at different magnifications.
3.2.3 XRD analysis
The XRD patterns and crystalline phase of synthesized FPAC, ZnONPs and ZnONPs-FPAC at room temperature are depicted in Fig. 3. The observed peaks 26.5° and 43.0° correspond to (0 0 2) and (0 0 1) indicates the presence of activated carbon (Fig. 3a). The absence of sharp peaks and the exhibition of a broad diffraction peaks revealed that the activated carbon is amorphous in nature (Saini et al., 2017; Yahya et al., 2020). Fig. 3b revealed the diffraction patterns of green synthesized ZnONPs, diffraction angles 2
and peak intensity. The result shows different diffraction peaks at 31.7°, 34.5°, 36.6°, 47.1°, 56.9°, 63.2°, 66.7°, 68.1°, 69.5°, 73.0° and 77.2° which correspond to the muller indices or diffraction plane (hkl) (1 0 0), (0 0 1), (1 0 1), (1 0 2), (1 1 0), (1 0 3), (2 0 0), (1 1 2), (2 0 1), (1 0 4) and (2 0 2) confirms the hexagonal phase of wurtzite structure of the synthesized ZnONPs (Chakraborty et al., 2020a,b; Soares et al., 2020). The absence of additional peaks indicates that the synthesized ZnONPs was pure crystalline in nature (Umavathi et al., 2021a, 2021b). The size of the prepared ZnONPs was calculated using Scherrer’s equation as below
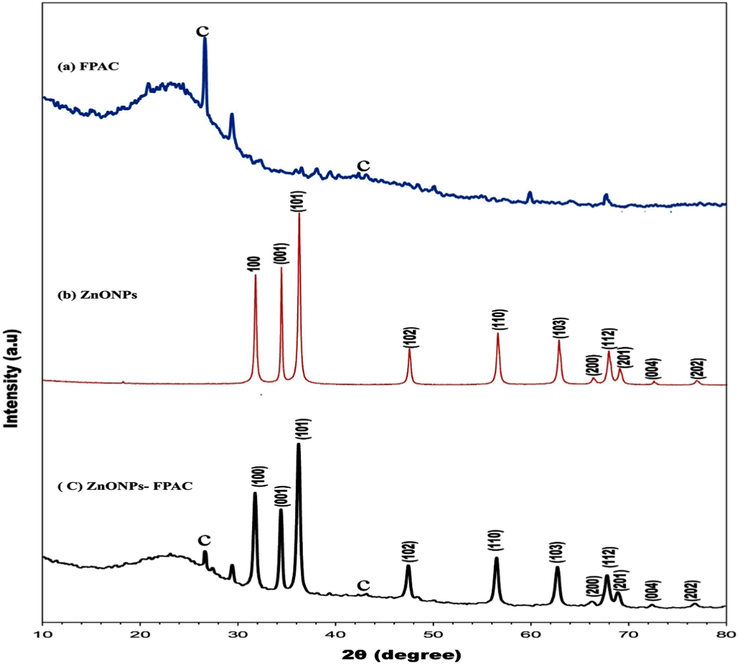
XRD analysis of (a) FPAC (b) ZnONPs and (c) ZnONPs-FPAC.
3.2.4 FTIR analysis
The characteristic surface chemistry of FPAC, ZnONPs and ZnONPs-FPAC were investigated using the FTIR spectral techniques as presented in Fig. 4(a-c), respectively. Based on Fig. 4a, the FPAC spectra revealed the presence of O-H and N-H functional groups at 3600 cm−1 absorption peaks which could be assigned to some adsorbed water or hydroxyl group. The FPAC absorption peaks at 2839, 2904 and 3398 cm−1 could be due to the carbonization and chemical activation of the carbon material. The bands at 1750 and 2349 cm−1 were assigned to C-H vibration stretching. The spike in the absorption peak around 1589 cm−1 was assigned to C-O formation (Chafidz et al. 2018). The absorption peaks at 1381 cm−1 may be assigned to the presence of C-OH stretching vibration (Sharmila et al.,2019). The absorption band at 1103 cm−1 correspond to the angular deformation in the plane of C-H bonds of the aromatic rings (Vargas et al., 2011a, 2011b).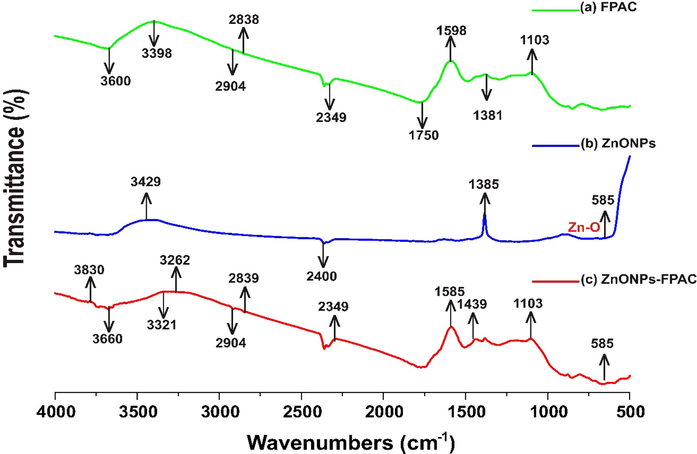
FTIR analysis of (a) FPAC (b) ZnONPs and (c) ZnONPs-FPAC.
As given in Fig. 4b, the ZnONPs spectra absorption bands between 3429 and 3394 cm−1 were assigned to O-H and N-H stretching vibrations. The absorption band at 2400 cm−1 corresponds to C≡N and C≡C stretching vibrations. The absorption band at 1385 cm−1 was assigned to C-OH stretching vibrations. The absorption bands at 585 cm−1 confirmed the presence of Zn-O vibrations (Kasi and Seo, 2019; Rodwihok et al., 2021). The functional groups observed in the FTIR analysis of ZnONPs revealed that phytochemicals such as alkaloids, flavonoids, and phenolics present in the T. diversifolia leaves extract contributed greatly to the formation and stability of ZnO NPs synthesized via biogenic reduction (Ahmed and Kalra, 2020).
ZnONPs-FPAC (Fig. 4c), on comparison with FPAC and ZnONPs shows that that some peaks have shifted or disappeared and new onces were formed. The adsorption peak at 3660 cm−1 confirmed that the O-H stretching vibration could be attributed to the presence of water molecules. The ZnONPs-FPAC FTIR spectra shows some more peaks at 1103, 2349, and 2839 cm−1, which are similar to FPAC. The adsorption peaks at 585, 1439, 1583, 2904, 3262, 3321 and 3830 cm−1 are apparent when ZnO-NPs was loaded on FPAC.
3.2.5 SEM/EDX analysis
The SEM images at different magnifications and chemical composition (EDX) of FPAC, ZnONPs and ZnONPs-FPAC are depicted in Fig. 5. The morphology of FPAC was observed to contains various pores caves as shown in Fig. 5(a). This could be attributed to the aggressive attack of KOH during chemical activation. The FPAC porous nature has a possibility of providing additional spaces for ZnONPs when supported on the external surface. The chemical composition of the prepared FPAC as identified by the EDX spectrum confirmed the presence of carbon (77.47%) and oxygen (22.53%) signals while the other signals demonstrated level of unpredictable substance in form of organic materials as contained in the sourced sample (Obayomi and Auta, 2019). The formation of aggregates in the form of small spherical grains which are homogenous and uniformly distributed were observed for ZnONPs SEM images as depicted in Fig. 5(b). The predominant spherical shapes could be attributed to the metal reducing capacity of T. diversifolia leaf extract (Rajakumar et al., 2018). The EDX spectrum revealed the presence of elements in the K-orbital shell such Zn (87.47%) and oxygen (12.53%). The other signals maybe attributed to bioorganic presence in the T. diversifolia leaf extract (Sharmila et al., 2019). The SEM images of ZnONPs-FPAC as presented in Fig. 5(c) showed the agglomeration of ZnONPs on the FPAC surface. The distribution of white spots over the surface of FPAC, confirms the presence of ZnONPs on the external surface of FPAC. It was observed from the images that the addition of ZnONPs on FPAC surface resulted in active sites and surface area of ZnONPS-FPAC increased thereby improving the adsorption uptake of pollutants (Liu et al., 2017). Although some pores of FPAC were seen to have been dominated by ZnONPs. The EDX analysis revealed the presence of Zn (11.43%), C (82.43%) and O (6.14%) which are the constituents of ZnONPs-FPAC.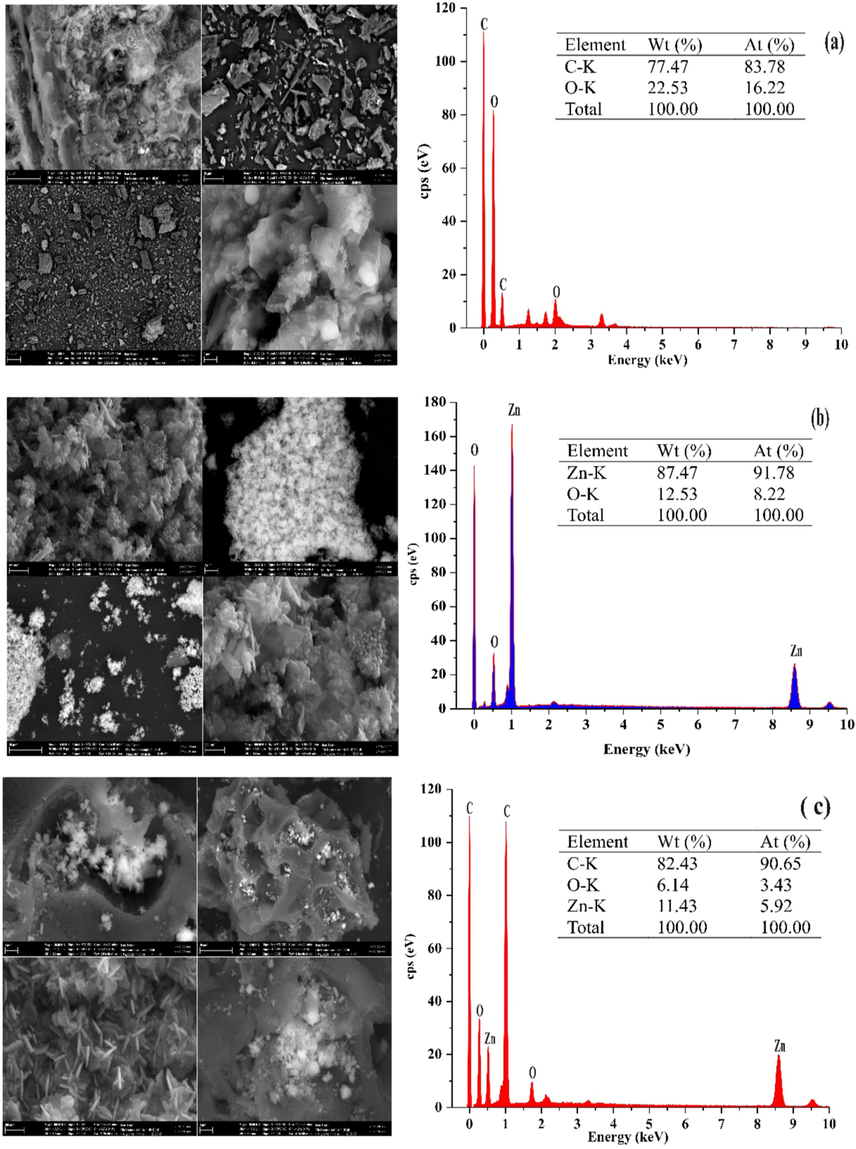
SEM/EDX analysis of FPAC (a); ZnONPs (b) and ZnONPs-FPAC (c).
3.2.6 BET analysis
The nitrogen adsorption–desorption isotherms and Brunauer-Joyner-Halenda (BJH) pore size distribution plots for FPAC, ZnONPS and ZnONPS-FPAC are depicted in Fig. 6. The values of the BET surface area for FPAC, ZnONPS and ZnONPS-FPAC were 744.66, 241.20, and 794.48 m2/g; total pore volume of 0.47, 1.004 and 0.57 cm3/g; and average pore diameter of 2.72, 5.86 and 3.079 nm. The BET surface area of ZnONPS-FPAC was observed to much higher when compared to that of FPAC. The increased surface area of ZnONPS-FPAC could be attributed to the surface modification of FPAC with ZnONPS. The modification of FPAC with ZnONPs was observed to have also increased the pore diameter resulting in the collapse of some micropores structures (Kamaraj et al., 2020; Liu et al., 2021a, 2021b). In accordance with the International Union of Pure and Applied Chemistry (IUPAC) classification, the isotherm curve of FPAC and ZnONPS-FPAC exhibited Type II isotherm behaviour (Fig. 6a & e) while ZnONPs exhibited Type III behaviour (Fig. 6c.) which signifies nonporous and mesoporous structures (2–50 nm) (Sing et al., 1985; Thommes et al., 2015). It was observed from the BET results that the micropore volume (internal surface) of FPAC and ZnONPs-FPAC provides the major proportion of the total pore volume (61.70 and 61.40%) while, the ZnONPs contributed more to the mesopore volume (98.61%) which is the external surface (Table not shown).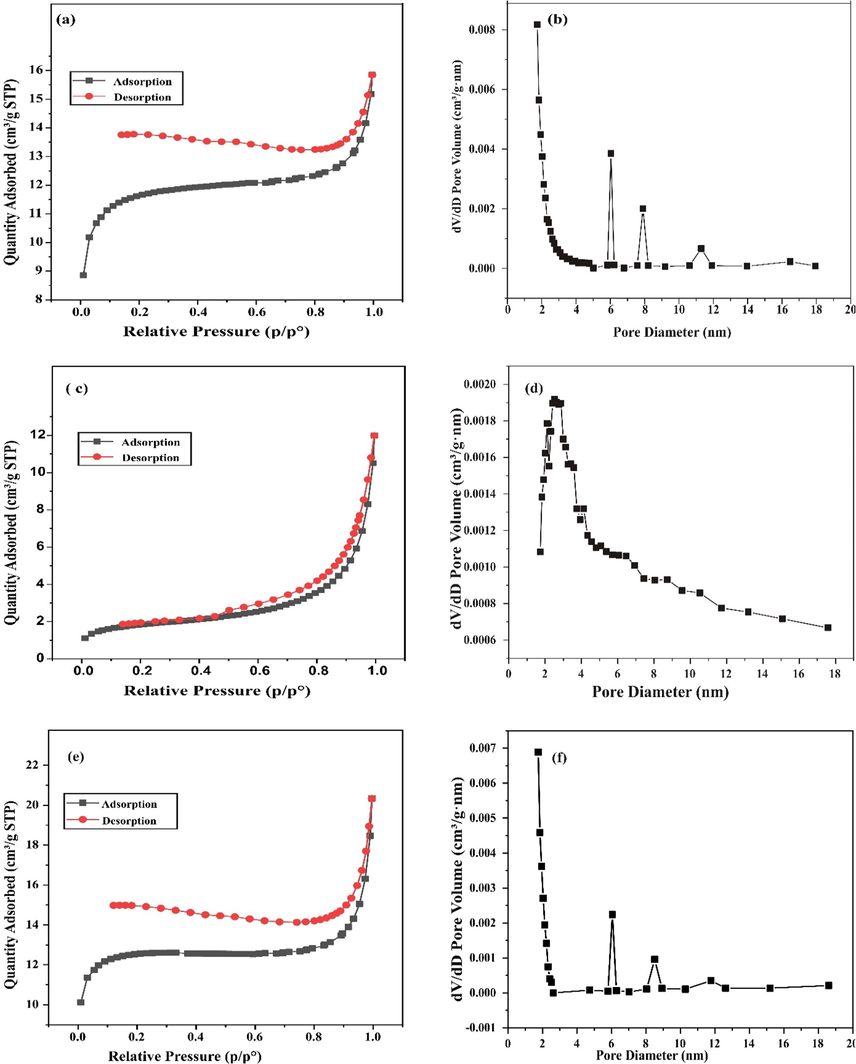
N2 adsorption–desorption isotherm and pore diameter distribution for FPAC (a-b) ZnONPs (c-d) and ZnONPs-FPAC (e-f).
3.3 Antibacterial activity
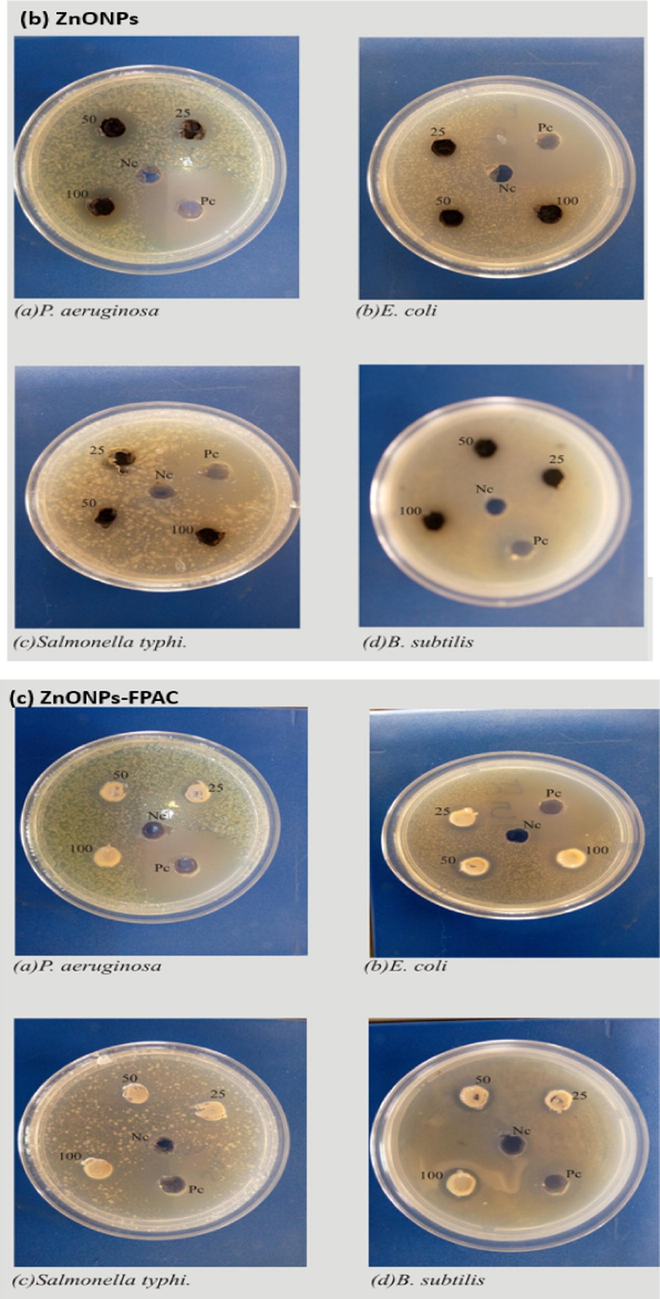
The antibacterial activity of FPAC, ZnONPs and ZnONPs-FPAC were presented in Figs. 7 and 8 respectively. The mean plot presented in Fig. 7 revealed that ZnONPs-FPAC at 25 mg/mL was most effective against P. aeruginosa, but no effect against the other three organisms. The same trend was observed at 50 mg/mL and 100 mg/mL. However, the difference was only significant at 100 mg/mL compared to the activity of ZnONPs-FPAC against other tested bacteria (p = 0.05) (Fig. 8c). FPAC at 25 mg/mL and 50 mg/mL, were again active against P. aeruginosa, while there was no effect against the other organisms tested. However, at 100 mg/mL, the activity of FPAC against P. aeruginosa had increased at from a mean value of 13.5 mm to 18.0 mm. FPAC also showed activity against E. coli at 100 mg/mL (Fig. 8a). ZnONPs recorded activity against all bacteria tested except Salmonella typhi at 25 mg/mL. however, at 50 mg/mL, it was active against all bacteria tested. Increase in the concentration of ZnONPs to 100 mg/mL did not have a corresponding effect in the cases of P. aeruginosa and Bacillus subtilis but an increase in activity against Salmonella typhi and E. coli was observed (Fig. 8b). Generally, it was observed that all the samples tested (FPAC, ZnONPs, and ZnONPs-FPAC) were effective against P. aeruginosa, though FPAC at 100 mg/mL was the most effective. It was observed from the results that ZnONPs at 50 mg/mL and 100 mg/mL were active against all the tested bacteria. This could also be attributed to the bioactive phytochemical constituents present in the plant extract which plays a vital role in the biogenic formation of ZnONPs. The activity of these materials could be as a result of their attachment to the cell wall of the bacteria thereby lysing it, causing the loss of cell membrane integrity and causing leakage of the content of the cell and subsequent cell death (Sharmila et al., 2019; Umavathi et al., 2021a, 2021b).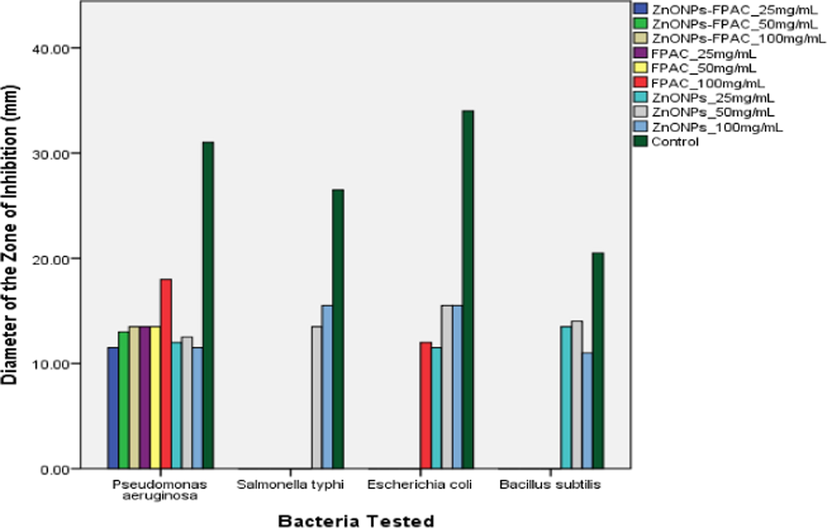
Antibacterial activity mean plot for FPAC, ZnONPs and ZnONPs-FPAC at different concentrations.
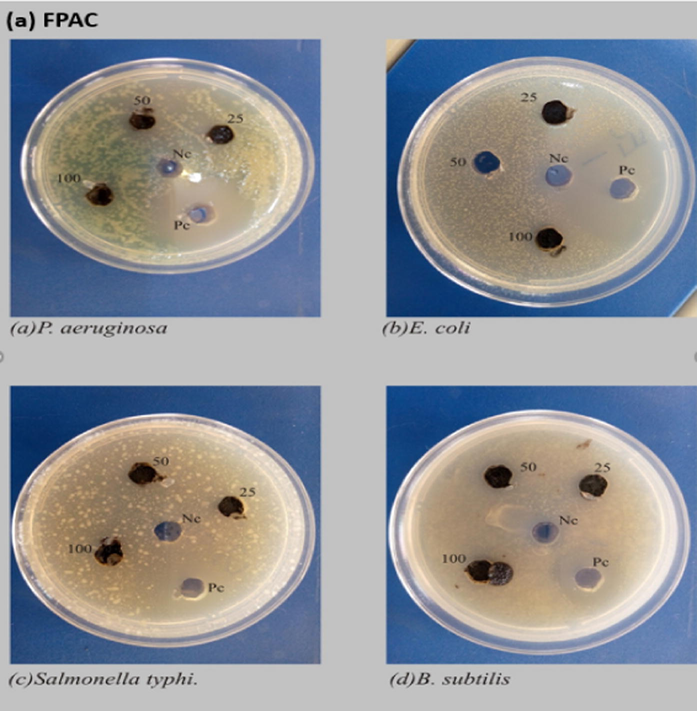
Antibacterial activity of (a) FPAC, (b) ZnONPs and (c) ZnONPs-FPAC.
Antibacterial activity of (a) FPAC, (b) ZnONPs and (c) ZnONPs-FPAC.
3.4 Adsorption studies
3.4.1 Effect of pH
The effect of solution pH on the removal of MB onto ZnONPs-FPAC nanocomposite was investigated (Fig. 9a). The experiment was performed at varied pH 2–12 for 60 min. The maximum removal was attained at higher pH 10 and lower removal was obtained at pH 2. This is due to the fact that at lower pH, more hydrogen ions (protonation) were formed in the solution thereby making the adsorbent surface positively charged resulting in electrostatic repulsion between the positively charged MB and positively charged adsorbent surface (Muniyandi et al., 2021). The presence of more negative ions (deprotonation) on the adsorbent surface at higher pH, promoted the maximum removal of MB by electrostatic attraction between positively charged MB and negatively charged adsorbent surface. An increased in solution pH (10), resulted in the adsorption capacity of 93.13 mg/g and percentage removal of 99.07%. The effect of solution pH on the removal of MB onto ZnONPs-FPAC can be conveyed by ion exchange and electrostatic interaction. Similar trend was reported by Zhang et al., (2021) who studied the efficient removal of MB using the mesoporous activated carbon obtained from mangosteen peel waste. The solution pH 10 was used throughout the adsorption processes.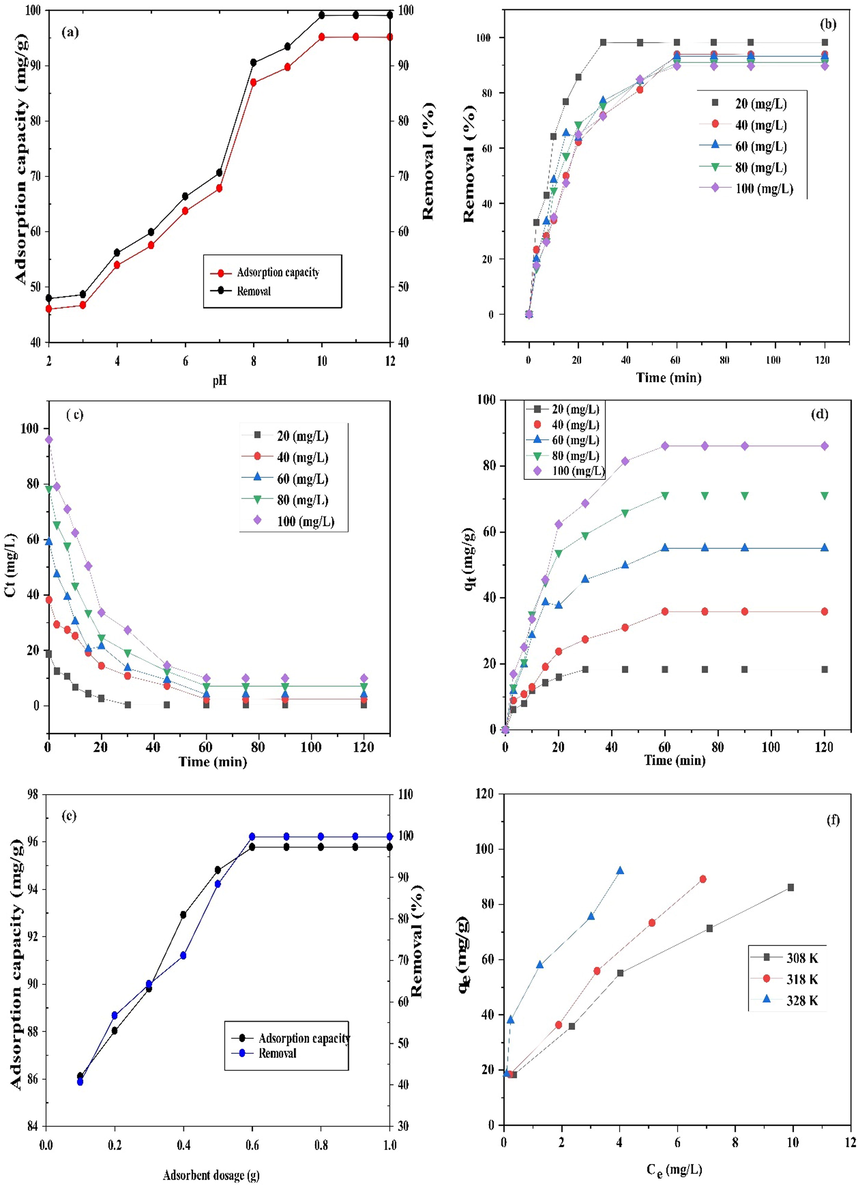
Effect of pH (a), contact time and initial concentration (b-d), adsorbent dosage (e) and temperature (f) on MB adsorption by ZnONPs-FPAC.
3.4.2 Effect of contact time and initial MB concentration
The effect of contact time was investigated to measure the adsorption equilibrium rate. The batch adsorption technique was carried out at different initial MB concentration (20–100 mg/L) for 120 min. As shown in Fig. 9b, it was observed that on increasing time, the removal efficiency of MB also increased and no further removal was observed after 60 min. This could be attributed to the availability of more vacant sites on the adsorbent surface at the initial stage thereby leading to rapid MB adsorption rate. As the time progresses, the removal efficiency slowly becomes steady, because the adsorbent vacant sites became occupied with the MB molecules and this resulted in slow adsorption rate. Furthermore, the MB molecules provides a vital driving force to sweep the overall mass transfer resistance between the solid and aqueous phases (Kamaraj et al., 2020). However, the MB removal efficiency was found to have decreased from 98.18 to 89.67% as the initial MB concentration increases (Seera et al., 2021). Fig. 9c shows the effect of initial MB concentration on the adsorption rate. At lower concentration (20 mg/L), equilibrium position was achieved in 30 min, while it took 60 min before equilibrium position was established at higher concentrations (40–100 mg/L). This is because at lower concentration, more vacant sites were available on the adsorbent surface with limited number of MB molecules to occupy and so, limited available MB molecules were rapidly adsorbed. More MB molecules in solution at fixed adsorbent dosage with limited vacant sites compete for the available binding sites of the adsorbent before saturation at higher concentrations (Auta and Hameed, 2011). Therefore, equilibrium condition was achieved faster at lower concentration than at higher concentrations. The MB adsorption capacity at equilibrium was found to have increased from 18.31 to 86.1 mg/g with initial MB concentration from 20 to 100 mg/L. Therefore, it can be said from the results obtained that the adsorption of MB on ZnONPs-FPAC increases with increase in initial MB concentration as presented in Fig. 9d.
3.4.3 Effect of ZnONPS-FPAC dosage
The experiment was conducted with varied dosage of ZnONPs-FPAC from 0.1 to 1 g, constant initial MB concentration of 100 mg/L and 60 min of agitation time at 308 K. It was observed from the plot (Fig. 9e) that the adsorption capacity and percentage removal of MB adsorbed varied with varying adsorbent dosage. Rapid increase in the adsorption capacity (86.1–95.77 mg/g) and percentage uptake (40.67–99.74%) of MB was observed with increased adsorbent dosage from 0.1 to 0.6 g. Furthermore, as the adsorbent dosage increases beyond this point (>0.6), there was no significant increase in the uptake and adsorption capacity as the MB reaches saturation level. Finally, it can be said that at lower adsorbent dosage, MB molecules compete for adsorption with limited adsorbent sites. However, as the adsorbent dosage is increased, more adsorbent sites are present thereby resulting in a greater adsorption capacity and percentage removal of MB (Olgun and Atar, 2012; Enniya et al., 2018).
3.4.4 Effect of temperature
The experiment was conducted at varied temperatures of 308, 318 and 328 K as shown in Fig. 9f. The result showed greater adsorption capacity of MB with increasing temperature. This could be attributed to the fact that temperature increase helps to make the adsorbent sites more active thereby leading to increase in electrostatic interaction between MB and the ZnONPs-FPAC. Furthermore, the increase in temperature which translated into increasing adsorption capacity of MB could also be attributed to the fact that the adsorption process was more endothermic in nature.
3.4.5 Adsorption isotherms
The adsorption of MB from aqueous solution by ZnONPs-FPAC in a batch test was obtained and fitted using the following isotherm models; Langmuir, Freundlich, Temkin and Dubinin-Radushkevich (D-R). The linearized form of the model isotherm equations is presented in Table 2. The Langmuir model assumes the existence of monolayer coverage of the adsorbate at the outer surface of the adsorbent where all sorption sites are similar (Li et al., 2021). The Freundlich model assumes that the surface of sorbent has non-uniform distribution of sorption heat. The model is applicable in fitting experimental data over a wide concentrations range (Momina et al., 2020). The Temkin model assumes that heat adsorption of all molecules in the layer would decrease linearly rather than logarithmic with coverage. The Temkin model is characterized by a uniform distribution of binding energies up to some maximum binding energy (Foo and Hameed, 2010). The Dubinin-Radushkevich (D-R) is used to determine the adsorption characteristic porosity and apparent free energy. The model also helps in investigating the nature of adsorption mechanisms whether physical or chemical.
Isotherm models
Linear form
Plot
Parameters
References
Langmuir
=
+
Langmuir, (1916)
Freundlich
+
Freundlich, (1906)
Temkin
+
Tempkin and Pyzhev, (1904)
Dubinin-Radushkevich (D-R)
Dubinin and Radushkevich, (1947)
Where
is the maximum adsorption capacity of metal ions (mg/g);
is the Langmuir isotherm constant (L/g); RL is the Langmuir dimensionless constant; C0 = initial concentrations (mg/L),
is Freundlich constant related to adsorption capacity, n is the adsorption intensity;
is Tempkin isotherm equilibrium binding constant (L/g),
is the Tempkin isotherm constant (kJ/mol);
is the theoretical isotherm saturation capacity (mg/g);
is Dubinin–Radushkevich isotherm constant (mol2/kJ2);
is the mean free energy (kJ/mol);
is the universal gas constant (8.314 J/mol K) and T is the temperature in Kelvin (K). The linearized Langmuir, Freundlich, Temkin and Dubinin-Radushkevich (D-R) models adsorption plots is shown in Fig. 10(a, b, c & d). Isotherm models were studied to determine the relationship between MB dye and ZnONPs-FPAC, evaluate the adsorbent adsorption capacity and investigate the bisorption mechanism. The isotherm best fitness to the experimental data was selected based on the highest correlation coefficient (R2) (closest to unity) and smallest values of SSE and
Based on the results shown in Table 3, the experimental data was best fitted to the Freundlich isotherm than the other three (Langmuir, Temkin and Dubinin–Radushkevich (D–R) models for the adsorption of MB on ZnONPs-FPAC. Thus, suggesting that adsorption process occurs on a multilayer and heterogeneous surface of the adsorbent. The Freundlich isotherm parameter, 1/n gives a clear information on surface heterogeneity and the exponential distribution of active sites and their energy. The heterogeneity factor of 0 < 1/n < 1 shows the adsorption process is favourable with the surface becoming more heterogenous as the values approaches zero. The adsorption of MB on ZnONPs-FPAC according to Freundlich model, was favourable and heterogeneous in nature from the values of 1/n obtained which is between obtained 0.329–0.421 (Table 3). Similar findings have been reported by Alver et al., (2020) who reported the use of magnetic alginate supported on rice husk for MB adsorption. This finding was also in agreement with the work of Ahmad et al., (2021) on MB adsorption from aqueous solution using peanut shell based activated carbon as an adsorbent. To further ascertain the nature of the isotherm, an equilibrium parameter expressed as dimensionless constant RL was evaluated. The outcome of RL values obtained is interpreted as follows: adsorption systems with RL > 1 (unfavorable), 0 < RL < 1 (favorable), RL = 1 (linear) or RL = 0 (irreversible). As presented in Table 3, the characteristics constant values were all within the range (0.0142–0.126) of favorability. The D-R adsorption mean free energy (E) of which specifies whether the adsorption mechanism physical (E < 8 kJ/mol) or chemical (8 < E < 16 kJ/mol) was also evaluated. The E values of calculated which is between 1.943 and 3.789 kJ/mol showed that the adsorption process of MB on ZnONPs-FPAC is physical. The maximum adsorption capacity for MB removal by ZnONPs-FPAC was 186 mg/g. A comparison on the maximum adsorption capacity of MB adsorption on different adsorbents from literatures is tabulated in Table 4.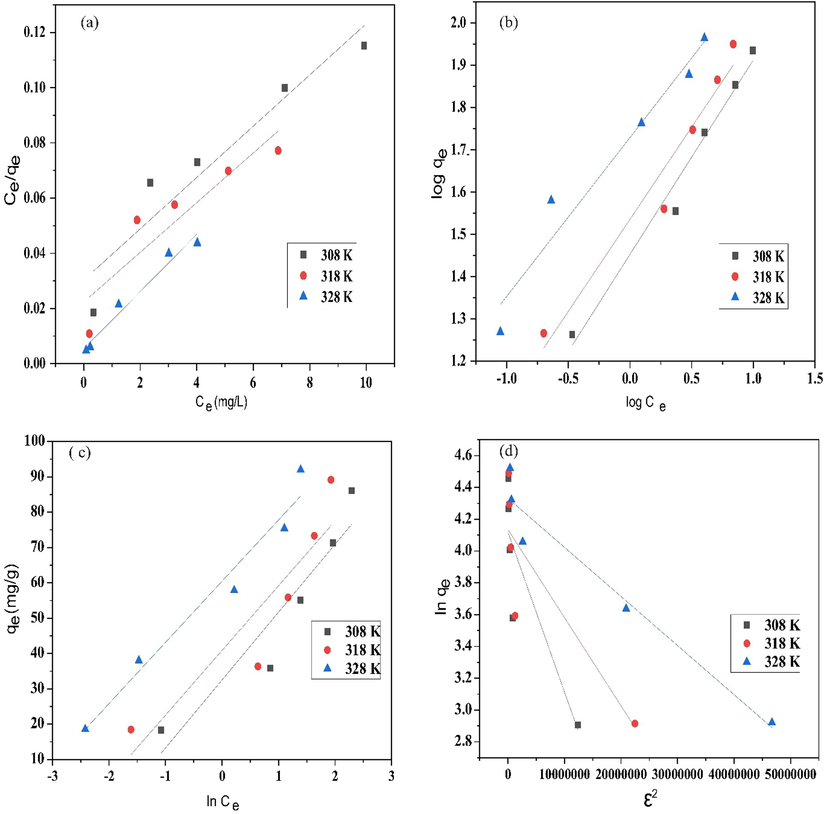
Plots of (a) Langmuir, (b) Freundlich, (c) Temkin, and (d) Dubinin–Radushkevich (D–R) isotherm models.
Temperature (K)
(L/mg)
SSE
Langmuir isotherm
308
131
0.372
0.911
20.98
17.89
318
148
0.525
0.839
48.48
19.02
328
186
0.722
0.972
60.27
21.45
Temperature (K)
20 mg/L
40 mg/L
60 mg/L
80 mg/L
100 mg/L
Langmuir dimensionless constant (RL)
308
0.126
0.0709
0.0435
0.0331
0.0272
318
0.0927
0.0475
0.0312
0.0237
0.0195
328
0.0691
0.0350
0.0229
0.0174
0.0142
Temperature (K)
1/n
%SSE
Freundlich isotherm
308
26.623
0.421
0.979
4.31
10.86
318
31.672
0.381
0.955
7.98
12.02
328
49.948
0.329
0.956
2.69
12.33
Temperature (K)
(L/mg)
(kJ/mol)
%SSE
Temkin isotherm
308
5.530
0.167
0.890
9.80
23.21
318
12.128
0.194
0.834
12.49
23.90
328
42.030
0.177
0.964
19.21
27.06
Temperature (K)
(kJ/mol)
%SSE
Dubinin–Radushkevich (D–R) isotherm
308
73.403
1.325
1.943
0.766
13.22
36.23
318
75.266
0.739
2.601
0.752
15.44
38.22
328
83.592
0.350
3.780
0.950
12.77
41.22
Adsorbents
Maximum adsorption capacity (mg/g)
References
PVA/PCMC/GO/bentonite
136.56
Dai et al., (2018)
AC from coconut shell
156.00
Yagmur and Kaya (2021)
ZSM-5 zeolite (CZ).
105.82
Ji et al., (2021)
Frozen alginate–clay
181.81
Uyar et al., (2016)
CH-Mt/PANI
111.00
Minisy et al., (2021)
Mesoporous coral limestones
34.24
Nkutha et al., (2020)
Alginate/Polyvinyl Alcohol - Kaolin Composite
17.33
Wang et al., (2018)
Carbon/mt
138.10
Tong et al., (2018)
Eucalyptus Bark
104.20
Dawood et al., (2016)
PANI/graphene oxide
14.20
Cedrela odorata (capsule-like interior)
158.50
Subratti et al., (2021)
Pine cone
117.65
Dawood et al., (2017)
Coating okra mucilage on biochar (BC)
78.13
Nath et al., (2021)
Activated carbon/cellulose
103.70
Somsesta et al., (2020)
ZnONPs-FPAC
186.57
This study
3.4.6 Adsorption kinetics
The linear form of pseudo-first-order, pseudo–second-order and intraparticle diffusion models as presented in Table 5 were used to fit the experimental data of MB removal on ZnONPs-FPAC. The intraparticle diffusion model was studied on MB adsorption by ZnONPs-FPAC to determine whether the adsorption process was controlled by intraparticle diffusion, boundary layer diffusion or both. Where k1 is the rate constant of adsorption (min−1), k2 (g/mgmin) is the rate constant of second order adsorption; kip (mg/g min1/2) is the intra-particle diffusion rate constant and C gives idea on the boundary thickness.
Kinetic models
Linear form
Plot
Parameters
Reference
Pseudo-first-order
)=
) vs t
Lagergren and Svenska (1898)
Pseudo-second- order
=
vs t
Ho and McKay, 1999
Intra-particle diffusion
vs
Weber and Morris, 1963
The adsorption kinetic model plots for MB dye were presented in Fig. 11. According to results obtained in Table 6, the adsorption of MB on ZnONPs-FPAC was best described by pseudo-second order kinetic model (see Fig. 11 (a &b)). This was based on the highest correlation coefficient values (R2), smaller difference between the experimental adsorption capacity (
) and the calculated adsorption capacity (
, smaller adsorption rate constant, and low error analysis (SSE and
) values when compared to pseudo-first order (Liu et al., 2021a; Wang et al., 2021). Adsorption rate constant decrease as initial concentration increase suggest that equilibrium constant is attained faster at a lower concentration than at higher concentration (Obayomi et al., 2020b). Thus, the modeling adsorption of MB on ZnONPs-FPAC seems to be more suitable with pseudo-second order model. Similar finding was reported by Yagmur and Kaya (2021) who reported that pseudo-second order model is based on the assumption that the rate-limiting step can be chemosorption involving valence forces through sharing or exchanging electrons between the adsorbent and adsorbate and the adsorption of MB was due to the availability of active sites on the sorbent. The intraparticle diffusion multi-linearity (three stages) plots signifies that the adsorption process is controlled by two or more steps as depicted in Fig. 11 c. The first stage could be attributed to the MB diffusion through the solution to the external surface of the ZnONPs-FPAC or the boundary layer diffusion of the MB molecules (external diffusion); the second stage is referring to the slow intraparticle pore diffusion (membrane diffusion); the last stage could be due to the final equilibrium for which the intraparticle diffusion starts to slow down due to extremely low MB concentration left in solution (internal diffusion) (Ji et al., 2021). Since the plot did not through the origin, there was an indication that the intraparticle diffusion was not the only limiting step but also by other adsorption processes. The intraparticle diffusion rate constant,
and the boundary layer, C were observed to have increased with increasing in MB concentration. This could be attributed to the increased internal mass transfer process as against external mass transfer which decreases as the boundary layer thickness increases (see Table 6). The three stages present in the plot is an indication that the adsorption mechanism of MB on ZnONPs-FPAC involved intraparticle pore and external film diffusion (Doke and Khan, 2017). The intraparticle diffusion multi-linear plot has been reported by Pholosi et al., (2020).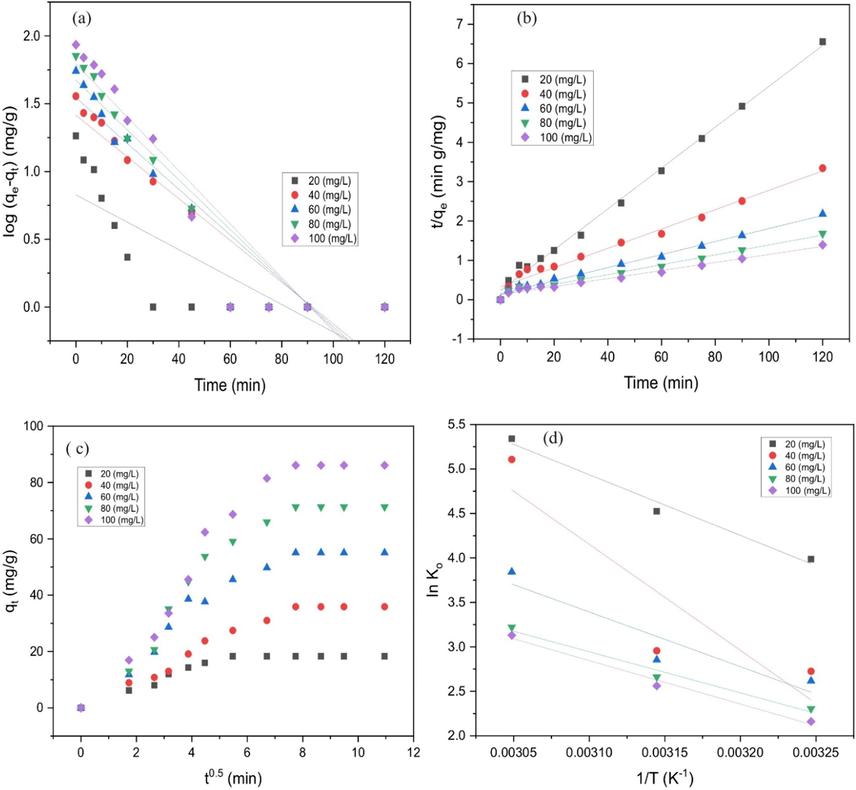
Plots of (a) pseudo-first-order (b) pseudo-second-order (c) Intraparticle diffusion and (d) thermodynamic.
Dye conc. (mg/L)
(min−1)
SSE
Pseudo-first-order
20
18.31
4.925
0.0291
0.621
179.16
36.55
40
35.89
20.773
0.0397
0.879
228.52
21.06
60
55.08
27.195
0.0436
0.874
777.57
25.31
80
71.31
35.861
0.0473
0.875
1256.63
24.46
100
86.10
46.278
0.0509
0.873
1585.79
23.13
Dye conc. (mg/L)
(g/mg.min)
SSE
Pseudo-second-order
20
18.31
19.681
0.0150
0.996
1.88
3,74
40
35.89
42.644
0.00211
0.979
45.62
9.41
60
55.08
62.267
0.00206
0.991
51.65
6.52
80
71.31
82.988
0.00134
0.985
136.38
8.19
100
86.10
102.470
0.000917
0.980
267.98
9.51
Dye conc. (mg/L)
Intraparticle diffusion
20
1.280
1.553
0.743
40
3.248
2.915
0.917
60
4.590
3.507
0.868
80
6.147
4.488
0.862
100
7.772
5.289
0.887
3.4.7 Adsorption thermodynamic studies
The decision on the feasibility and spontaneous nature of MB adsorption on ZnONPs-FPAC was revealed by thermodynamic parameters such as free energy change (
), entropy change (
) and enthalpy change (
), were studied using the distribution coefficient (
at different temperatures (308, 318 and 328 K). The adsorption free energy was evaluated using the equation:
The Van’t Hoff equation was used to evaluate the thermodynamic parameters such as change entropy (
and enthalpy (
and the equation is given as:
The thermodynamic distribution coefficient was evaluated using the equation given as:
T (K)
kJ/mol)
kJ/mol)
Jmol/K)
R2
308
−5.534
4.887
0.150
0.986
318
−6.772
328
−8.537
3.5 ZnONPs-FPAC reusability on MB removal
Reusability is one the ways to economically measure the ability of a good adsorbent. The result depicted in Fig. 11, showed that the recovered adsorbent was promising, with slight decrease in the percentage removal of MB after five times of use and there was no noticeable adsorption performance loss. The MB removal percentage of MB that was sustained even after five cycles was 95% (see Fig. 12).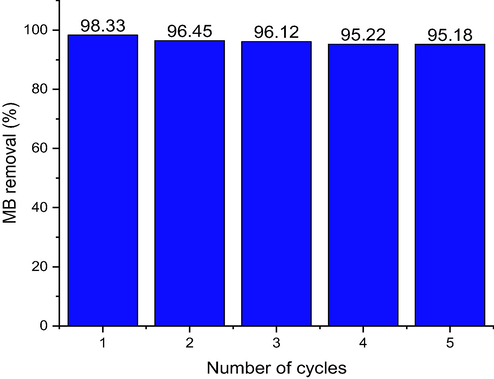
Reusability of ZnONPs-FPAC nanocomposite for MB dye removal (Co = 100 mg/L; T = 308 K; W = 0.1 g; pH = 10).
4 Conclusion
In this study, ZnONPs-FPAC was successfully developed by loading T. diversifolia mediated ZnONPs on the surface of flamboyant pods activated carbon (FPAC). Antibacterial activities were examined for FPAC, ZnONPs and ZnONPs-FPAC. The results revealed that ZnONPs showed better antibacterial activities due to the synergistic effect of bioactive phytochemical constituents in the plant extract. The developed materials were subjected to characterization using XRD, FTIR, SEM/EDX and BET techniques. The FPAC, ZnONPs and ZnONPs-FPAC exhibited high BET surface area of 744.66, 241.20 and 794.48 m2/g. The potential applicability of ZnONPs-FPAC composites was tested on the uptake of MB dye. The effect of various adsorption parameters such as adsorbent dosage, initial concentration, contact time and pH were test in a batch experiment. The maximum adsorption capacity of MB on ZnONPs-FPAC was calculated as 186 mg/g. The experimental data were tested in terms of isotherms, kinetics and thermodynamic studies. The results revealed that the isotherm and kinetic models were well fitted to the Freundlich and Pseudo-second order model equations. According to the thermodynamic results, the adsorption of MB on ZnONPs-FPAC was favourable, spontaneous, endothermic and physical in nature. The reusability of ZnONPs-FPAC after MB adsorption, revealed that it can be used couple of times before disposal. These findings confirmed the effectiveness of ZnO/activated carbon nanocomposites for MB adsorption and also demonstrated significant potential for further research into the effective removal of other dyes. Aside from their excellent adsorption performance, the antimicrobial profile of ZnO promotes their effective use in water management.
CRediT authorship contribution statement
Kehinde Shola Obayomi: Conceptualization, Methodology, Software, Visualization, Writing - original draft, Validation, Data curation, Supervision, Funding acquisition. Ayomide Elizabeth Oluwadiya: Methodology, Data curation, Funding acquisition, Software. Sie Yon Lau: Writing - review & editing, Supervision. Adewumi Oluwasogo Dada: Visualization, Supervision, Writing - review & editing. Divine Akubuo-Casmir: Methodology, Software, Funding acquisition, Project administration. Tabitha Adunola Adelani-Akande: Methodology, Writing - original draft. A.S.M. Fazle Bari: Funding acquisition, Formal analysis, Writing - review & editing. Samuel Olorunfemi Temidayo: Methodology. Mohammad Mahmudur Rahman: Funding acquisition, Writing - review & editing, Formal analysis, Supervision.
Acknowledgements
The authors acknowledged Global Centre for Environmental Remediation (GCER), laboratory and EMX unit, The University of Newcastle, Callaghan, NSW 2308, Australia instrumental supports. We also appreciate the contribution of Evalvihara media concept for creation and compilation of visual images required for this research work. The Fundamental Research Grant Scheme (FRGS) is also duly acknowledged.
Declaration of Competing Interest
The authors declare that they have no known competing financial interests or personal relationships that could have appeared to influence the work reported in this paper.
References
- A review on green synthesis of zinc oxide nanoparticles –An eco-friendly approach. Res. Effic. Tech.. 2017;3(4):406-413.
- [Google Scholar]
- Ahmad, M.A., Yusop, M.F.M., Zakaria, R., Karim, J., Yahaya, N.K.E.M., Yusoff, M.A.M., Hashim, N.H.F., Abdullah, N.S., 2021. Adsorption of methylene blue from aqueous solution by peanut shell based activated carbon. https://doi.org/10.1016/j.matpr.2021.02.789.
- Unravel the potential of zinc oxide nanoparticle-carbonized sawdust matrix for removal of lead (II) ions from aqueous solution. Chin. J. Chem. Eng.. 2021;29:92-102.
- [CrossRef] [Google Scholar]
- Methylene blue adsorption on magnetic alginate/rice husk bio-composite. Int. J. Macromol.. 2020;154:104-113.
- [Google Scholar]
- Optimized waste tea activated carbon for adsorption of Methylene Blue and Acid Blue 29 dyes using response surface methodology. Chem. Eng. J.. 2011;175:233-243.
- [Google Scholar]
- Adsorption of organic pollutants by nanomaterial-based adsorbents: An overview. J. Mol. Liq.. 2020;301:112335.
- [CrossRef] [Google Scholar]
- Green synthesis of zinc oxide nanoparticles: A review of the synthesis methodology and mechanism of formation. Sustain. Chem. Pharm.. 2020;15:100223.
- [CrossRef] [Google Scholar]
- Green synthesis of zinc oxide nanoparticles: A review of the synthesis methodology and mechanism of formation. Sustain. Chem. Pharm.. 2020;15:100223.
- [CrossRef] [Google Scholar]
- A review on bio-synthesized zinc oxide nanoparticles using plant extracts as reductants and stabilizing agents. Journal of Photochemistry and Photobiology B: Biology. 2018;183:201-221.
- [CrossRef] [Google Scholar]
- ZnO nanoparticles: Synthesis, characterization, and ecotoxicological studies. Langmuir. 2010;26(9):6522-6528.
- [CrossRef] [Google Scholar]
- Removal of methyl violet dye via absorption using activated carbon prepared from randu sawdust (Ceiba pentandra) IOP Conf. Ser: Earth Environ. Sci.. 2018;167:012013
- [Google Scholar]
- Adsorption of heavy metal ions by various low-cost adsorbents: a review. Int. J. Environ. Anal. Chem. 2020
- [CrossRef] [Google Scholar]
- Averrhoe carrambola fruit extract assisted green synthesis of ZnO nanoparticles for the photodegradation of congo red dye. Surf. Interfaces. 2020;19:100488.
- [CrossRef] [Google Scholar]
- Tithonia diversifolia aqueous fraction plays a protective role against alloxan-induced diabetic mice via modulating GLUT2 expression. S. Afr. J. Bot.. 2020;133:118-123.
- [Google Scholar]
- Liquid phase scavenging of Cd(ll) and Cu(ll) ions onto novel nanoscale zerovalent manganese (nZVMn): Equilibrium, kinetic and thermodynamic studies. Environmental Nanotechnology, Monitoring and Management. 2017;8:63-72.
- [CrossRef] [Google Scholar]
- Eco-friendly polyvinyl alcohol/carboxymethyl cellulose hydrogels reinforced with graphene oxide and bentonite for enhanced adsorption of methylene blue. Carbohydr. Polym.. 2018;185:1-11.
- [Google Scholar]
- Adsorption removal of Methylene Blue (MB) dye from aqueous solution by bio-char prepared from Eucalyptus sheathiana bark: kinetic, equilibrium, mechanism, thermodynamic and process design. Desalin. Water Treat.. 2016;57(59):28964-28980.
- [Google Scholar]
- Dawood, S., Sen, T.K., Phan, C., 2017. Synthesis and characterization of slow pyrolysis pine cone bio-char in the removal of organic and inorganic pollutants from aqueous solution by adsorption: kinetic, equilibrium, mechanism and thermodynamic. Bioresour. Technol. 246, 76–81.
- Synthesis of environmentally benign ultra-small copper nanoclusters-halloysite composites and their catalytic performance on contrasting azo dyes. Appl. Surf. Sci.. 2021;546:149122.
- [CrossRef] [Google Scholar]
- Effective removal of congo red dye from aqueous solution using biosynthesized zinc oxide nanoparticles, Environmental Nanotechnology. Monit. Manage.. 2020;14:100320.
- [CrossRef] [Google Scholar]
- Adsorption of Congo red from aqueous solution onto Antigonon leptopus leaf powder: Equilibrium and kinetic modeling. Mater. Today:. Proc.. 2020;26:3197-3206.
- [CrossRef] [Google Scholar]
- Application of a heterogeneous physical model for the adsorption of Cd2+, Ni2+, Zn2+ and Cu2+ ions on flamboyant pods functionalized with citric acid. Chem. Eng. J.. 2021;417:127975.
- [CrossRef] [Google Scholar]
- Equilibrium, kinetic and diffusion mechanism of Cr(VI) adsorption onto activated carbon derived from wood apple shell. Arabian J. Chem.. 2017;10(1):S252-S260.
- [Google Scholar]
- The equation of the characteristic curve of the activated charcoal. Proc. Acad. Sci. USSR Phys. Chem. Sect.. 1947;55:331-337.
- [Google Scholar]
- Comparative analysis of linear and nonlinear equilibrium models for the removal of metronidazole by tea waste activated carbon. Water Sci. Technol.. 2020;82(7):1484-1494.
- [Google Scholar]
- Adsorption of hexavalent chromium in aqueous solution on activated carbon prepared from apple peels. Sustain. Chem. Pharm.. 2018;7:9-16.
- [Google Scholar]
- Fagier, M.A., 2021. Plant-Mediated Biosynthesis and Photocatalysis Activities of Zinc Oxide Nanoparticles: A Prospect towards Dyes Mineralization, 6629180, https://doi.org/10.1155/2021/6629180.
- Fakhari, S., Jamzad, M., Fard, H.K., 2019. Green synthesis of zinc oxide nanoparticles: a comparison. Green Chem. Lett. Rev., 12(1), 19–24.
- Insights into the modeling of adsorption isotherm systems. Chem. Eng. J.. 2010;156(1):2-10.
- [Google Scholar]
- Effective antimicrobial activity of green ZnO nano particles of Catharanthus roseus. Front. Microbiol.. 2018;9:1-13.
- [Google Scholar]
- Adsorption of methylene blue and bright blue dyes on bayleaf capertree pods powder: Understanding the adsorption mechanism by a theoretical study. J. Mol. Liq.. 2021;332:115680.
- [CrossRef] [Google Scholar]
- Pseudo-second order model for sorption processes. Process Biochem.. 1999;34(5):451-465.
- [Google Scholar]
- Efficient and fast adsorption of methylene blue dye onto a nanosheet MFI zeolite. J. Solid-State Chem.. 2021;295:121917.
- [CrossRef] [Google Scholar]
- Facile development of sunlit ZnO nanoparticles-activated carbon hybrid from pernicious weed as an operative nano-adsorbent for removal of methylene blue and chromium from aqueous solution: Extended application in tannery industrial wastewater. Environ. Technol. Innovation. 2020;17:100540.
- [CrossRef] [Google Scholar]
- Influence of Mg doping on the structural, morphological, optical, thermal, and visible-light responsive antibacterial properties of ZnO nanoparticles synthesized via co-precipitation. Mater. Sci. Eng: C.. 2019;98:717-725.
- [Google Scholar]
- Removal of Congo red and Brilliant green dyes from aqueous solution using flower shaped ZnO nanoparticles. J. Environ. Chem. Eng.. 2017;5(6):5420-5428.
- [Google Scholar]
- On the theory of so-called adsorption of dissolved substances. Roy. Swedish Acad. Sci. Docum.. 1898;24:1-13.
- [Google Scholar]
- The constitution and fundamental properties of solids and liquids. J. Am. Chem. Soc.. 1916;38(11):2221-2295.
- [Google Scholar]
- Green synthesis of ZnO doped Moringa oleifera leaf extract using Titon yellow dye for photocatalytic applications. Mater. Today:. Proc.. 2021;36:475-479.
- [CrossRef] [Google Scholar]
- Letsholathebe, D., Thema, F. T., Mphale, K., Maabong, K., Magdalane, C. M., 2021. Green synthesis of ZnO doped Moringa oleifera leaf extract using Titon yellow dye for photocatalytic applications. https://doi.org/10.1016/j.matpr.2020.05.119.
- Fabrication of novel starch-based composite hydrogel microspheres combining Diels-Alder reaction with spray drying for MB adsorption. J. Environ. Chem. Eng.. 2021;9(5):105929.
- [CrossRef] [Google Scholar]
- Facile synthesis of Cu (II) impregnated biochar with enhanced adsorption activity for the removal of doxycycline hydrochloride from water. Sci. Total Environ.. 2017;592:546-553.
- [Google Scholar]
- Preparation of well-developed mesoporous activated carbon fibers from plant pulp fibers and its adsorption of methylene blue from solution. Chem. Phys. Lett.. 2021;771:138535.
- [CrossRef] [Google Scholar]
- Manganese-modified lignin biochar as adsorbent for removal of methylene blue. J. Mater. Res. Technol.. 2021;12:1434-1445.
- [Google Scholar]
- Improved photocatalytic efficiency of SnO2nanoparticles through green synthesis. Optik – Int. J. Light Electron Optics. 2020;206:164299.
- [CrossRef] [Google Scholar]
- Synthesis and characterization of zinc oxide nanoparticles by using polyol chemistry for their antimicrobial and antibiofilm activity. Biochemistry and Biophysics Reports. 2019;17:71-80.
- [CrossRef] [Google Scholar]
- Green synthesis of copper nanoparticles using Celastrus paniculatus Willd. leaf extract and their photocatalytic and antifungal properties. Biotechnol. Rep,. 2020;27:e00518.
- [CrossRef] [Google Scholar]
- Phytochemical screening, total phenolic and flavonoid methanolic extract of pomegranate bark (Punica granatum L): Evaluation of the inhibitory effect in acidic medium 1 M HCl. Materialstoday. 2020;27(4):3193-3198.
- [Google Scholar]
- Adsorption of methylene blue onto chitosan–montmorillonite/polyaniline nanocomposite. Appl. Clay Sci.. 2021;203:105993.
- [CrossRef] [Google Scholar]
- Study of the adsorption/desorption of MB dye solution using bentonite adsorbent coating. J. Water Process Eng.. 2020;34:101155.
- [CrossRef] [Google Scholar]
- Potential removal of Methylene Blue dye from synthetic textile effluent using activated carbon derived from Palmyra (Palm) shell. Materialstoday: Proceedings 2021
- [CrossRef] [Google Scholar]
- Biosynthesis of ZnO nanoparticles through extract from Prosopis juliflora plant leaf: Antibacterial activities and a new approach by rust-induced photocatalysis. J. Saudi Chem. Soc. 2020:93-406.
- [Google Scholar]
- Removal of methylene blue from water using okra (Abelmoschus esculentus L.) mucilage modified biochar. Bioresour. Technol. Rep.. 2021;14:100689.
- [CrossRef] [Google Scholar]
- Synthesis approaches of zinc oxide nanoparticles: the dilemma of ecotoxicity. J. Nanomater 2017:1-14.
- [Google Scholar]
- Adsorption studies of methylene blue and lead ions from aqueous solution by using mesoporous coral limestones. S Afr. J. Chem. Eng.. 2020;34:151-157.
- [CrossRef] [Google Scholar]
- Development of microporous activated Aloji clay for adsorption of lead (II) ions from aqueous solution. Heliyon. 2019;5(11):e02799.
- [CrossRef] [Google Scholar]
- Isotherm, Kinetic and thermodynamics studies for the adsorption of Pb(ll) onto modified Aloji clay. Desalin. Water Treat.. 2020;181:1-9.
- [Google Scholar]
- Statistical analyses on effective removal of cadmium and hexavalent chromium ions by multiwall carbon nanotubes (MWCNTs) Heliyon. 2020;6(6):e04174.
- [CrossRef] [Google Scholar]
- Equilibrium, thermodynamic and kinetic studies for the adsorption of lead (II) and nickel (II) onto clay mixture containing boron impurity. J. Ind. Eng. Chem.. 2012;18(5):1751-1757.
- [Google Scholar]
- A facile green synthesis of ZnO nanoparticles and its adsorptive removal of Congo red dye from aqueous solution. Mater. Today: Proc.. 2021;38:2445-2451.
- [CrossRef] [Google Scholar]
- Intraparticle diffusion of Cr(VI) through biomass and magnetite coated biomass: A comparative kinetic and diffusion study. S. Afr. J. Chem. Eng.. 2020;32:39-55.
- [Google Scholar]
- Green approach for synthesis of zinc oxide nanoparticles from Andrographis paniculata leaf extract and evaluation of their antioxidant, anti-diabetic, and anti-inflammatory activities. Bioprocess Biosyst. Eng.. 2018;41(1):21-30.
- [Google Scholar]
- Green synthesis of zinc oxide nano-sized spherical particles using Terminalia chebula fruits extract for their photocatalytic application. International Nano Letters. 2016;6(2):91-98.
- [Google Scholar]
- Improved photocatalytic activity of surface charge functionalized ZnO nanoparticles using aniline. J. Mater. Sci. Technol.. 2021;76:1-10.
- [Google Scholar]
- Dyes and their removal technologies from wastewater: 2021. A critical review. Intell. Environ. Data Monit. Pollut. Manage. 2021
- [CrossRef] [Google Scholar]
- Removal of Orange G and Rhodamine B dyes from aqueous system using hydrothermally synthesized zinc oxide loaded activated carbon (ZnO-AC Journal of Environmental. Chem. Eng.. 2017;5(1):884-892.
- [Google Scholar]
- Synthesis and characterization of xylan-gelatin cross-linked reusable hydrogel for the adsorption of methylene blue. Carbohydr. Polym.. 2021;256:117520.
- [CrossRef] [Google Scholar]
- Green synthesis of ZnO nanoparticles using Tecoma castanifolia leaf extract: Characterization and evaluation of its antioxidant, bactericidal and anticancer activities. Microchem. J.. 2019;145:578-587.
- [Google Scholar]
- Effects of irrigation and nitrogen fertilization rates on yield, agronomic efficiency and morphophysiology in Tithonia diversifolia. Agric. Water Manag.. 2021;248:106782.
- [CrossRef] [Google Scholar]
- Reporting Physisorption Data for Gas/Solid Systems with Special Reference to the Determination of Surface Area and Porosity”. Pure Appl. Chem.. 1985;57(4):603-619.
- [Google Scholar]
- Antiviral and Antimicrobial Potentiality of Nano Drugs. Applic. Targ. Nano Drugs Deliv. Syst. 2019:343-356.
- [Google Scholar]
- Antioxidant and antimicrobial study of Schefflera vinosa leaves crude extracts against rice pathogens. Arabian J. Chem.. 2021;14(7):103243.
- [CrossRef] [Google Scholar]
- Green synthesis of ZnO nanoparticles using whey as an effective chelating agent. Mater. Lett.. 2020;259:126853.
- [CrossRef] [Google Scholar]
- Adsorption removal of methylene blue onto activated carbon/cellulose biocomposite films: Equilibrium and kinetic studies. Mater. Chem. Phys.. 2020;240:122221.
- [CrossRef] [Google Scholar]
- Study on the effect of the concentration of Hibiscussabdariffa extract on the green synthesis of ZnOnanoparticles. Results Phys.. 2019;15:102807.
- [CrossRef] [Google Scholar]
- Preparation and characterization of biochar derived from the fruit seed of Cedrela odorata L and evaluation of its adsorption capacity with methylene blue. Sustain. Chem. Pharm.. 2021;21:100421.
- [CrossRef] [Google Scholar]
- Phytochemical screening and antimicrobial activity of Coleus aromaticus leaf extract. Materialstoday.. 2021;41(3):596-599.
- [Google Scholar]
- Plant-extract mediated synthesis of ZnO nanoparticles using Pongamia pinnata and their activity against pathogenic bacteria. Adv. Powder Technol.. 2015;26(5):1294-1299.
- [Google Scholar]
- Green synthesis of multifunctional zinc oxide (ZnO) nanoparticles using Cassia fistula plant extract and their photodegradative, antioxidant and antibacterial activities. Mater. Sci. Semicond. Process.. 2015;31:446-454.
- [Google Scholar]
- Synthesis, Characterization, and Spectroscopic Properties of ZnO Nanoparticles. ISRN Nanotechnology 2012:1-6.
- [CrossRef] [Google Scholar]
- Kinetics of ammonia synthesis on promoted iron catalyst. Acta Phys. Chim. USSR. 1904;12:327-356.
- [Google Scholar]
- Thommes, M., Kaneko, K., Neimark, A.V., Olivier, J.P., Rodriguez-Reinoso, F., Rouquerol, J., Sing, K.S.W., 2015. Physisorption of gases, with special referenceto the evaluation of surface area and pore sizedistribution (IUPAC Technical Report). Pure Appl. Chem.
- Adsorption of methylene blue from aqueous solution onto porous cellulose-derived carbon/montmorillonite nanocomposites. Appl. Clay Sci.. 2018;161:256-264.
- [Google Scholar]
- Green synthesis of ZnO nanoparticles for antimicrobial and vegetative growth applications: A novel approach for advancing efficient high quality health care to human wellbeing. Saudi J. Biol. Sci.. 2021;28(3):1808-1815.
- [CrossRef] [Google Scholar]
- Umavathi, S., Mahboob, S., Govindarajan, M., Al-Ghanim, K. A., Ahmed, Z., Virik, P., Al-Mulhm, N., Subash, M., Gopinath, K., Kavitha, C., 2021. Green synthesis of ZnO nanoparticles for antimicrobial and vegetative growth applications: A novel approach for advancing efficient high quality health care to human wellbeing. https://doi.org/10.1016/j.sjbs.2020.12.025.
- Methylene blue removal by alginate–clay quasicryogel beads. React. Funct. Polym.. 2016;106:1-7.
- [Google Scholar]
- Adsorption of methylene blue on activated carbon produced from flamboyant pods (Delonix regia): Study of adsorption isotherms and kinetic models. Chem. Eng. J.. 2011;168(2):722-730.
- [Google Scholar]
- Kinetic and equilibrium studies: Adsorption of food dyes Acid Yellow 6, Acid Yellow 23, and Acid Red 18 on activated carbon from flamboyant pods. Chem. Eng. J.. 2012;181-182:243-250.
- [Google Scholar]
- Activated carbons from flamboyant pods: New types of adsorbents and application to laundry effluents. J. Water Process Eng.. 2020;36:101277.
- [CrossRef] [Google Scholar]
- Ternary adsorption of acid dyes onto activated carbon from flamboyant pods (Delonix regia): Analysis by derivative spectrophotometry and response surface methodology. Chem. Eng. J.. 2012;195-196:173-179.
- [Google Scholar]
- Absorption of methylene blue on activated carbon produced from flamboyant pods (Delonix regia): Study of absorption isotherms and kinetic models. Chem. Eng. J.. 2011;168:722-730.
- [Google Scholar]
- Acalypha fruticosa L. leaf extract mediated synthesis of ZnO nanoparticles: Characterization and antimicrobial activities. Mater. Today:. Proc.. 2020;23:73-80.
- [CrossRef] [Google Scholar]
- Using magneto-adsorbent for methylene Blue removal: A decision-making via analytical hierarchy process (AHP) J. Water Process Eng.. 2021;40:101948.
- [CrossRef] [Google Scholar]
- Graphene-based materials for adsorptive removal of pollutants from water and underlying interaction mechanism. Adv. Colloid Interface Sci.. 2021;289:102360.
- [CrossRef] [Google Scholar]
- Methylene blue removal from water using the hydrogel beads of poly (vinyl alcohol)-sodium alginate-chitosan-montmorillonite. Carbohydr. Polym.. 2018;198:518-528.
- [Google Scholar]
- Kinetics of adsorption on carbon from solution J. Sanitary Eng. Div. Proceed. Am. Soc. Civil. Eng.. 1963;89(2):31-59.
- [Google Scholar]
- Synthesis method, antibacterial and photocatalytic activity of ZnO nanoparticles for azo dyes in wastewater treatment: A review. Inorg. Chem. Commun.. 2020;120:108140.
- [CrossRef] [Google Scholar]
- Recent advances in applications of activated carbon from biowaste for wastewater treatment: A short review. J. Cleaner Prod.. 2018;175:361-375.
- [Google Scholar]
- Yagmur, H.K., Kaya, I., 2021. Synthesis and characterization of magnetic ZnCl 2 -activated carbon produced from coconut shell for the adsorption of methylene blue. J. Mol. Struct. 1232, 130071.
- Adsorption equilibrium study on the characterization of cobalt-ferrite supported on activated carbon for the removal of chromium and lead ions from tannery wastewater. Water Sci. Eng.. 2020;13(3):202-213.
- [Google Scholar]
- Effective adsorptive removal of azo dyes over spherical ZnO nanoparticles. J. Mater. Res. Technol.. 2018;8(1):713-725.
- [Google Scholar]
- Efficient removal of methylene blue using the mesoporous activated carbon obtained from mangosteen peel wastes: Kinetic, equilibrium, and thermodynamic studies. Micropor. Mesopor. Mater.. 2021;315:110904
- [Google Scholar]


