Bisphenol F and bisphenol S induce metabolic perturbations in human ovarian granulosa cells
⁎Corresponding author at: Inflammation & Allergic Diseases Research Unit, The Affiliated Hospital of Southwest Medical University, No. 25 Taiping Street, Jiangyang District, Luzhou City 646000, Sichuan Province, China. youngm1@126.com (Meng Yang)
-
Received: ,
Accepted: ,
This article was originally published by Elsevier and was migrated to Scientific Scholar after the change of Publisher.
Abstract
Owing to its capacity to damage the endocrine system, bisphenol A (BPA) is being substituted in common consumer products by chemically related compounds, including bisphenol F (BPF) and bisphenol S (BPS). Although BPF and BPS in body fluids are comparable in concentration and frequency to BPA, the toxicity of these analogs in female reproduction remains largely unknown. Using a nontargeted metabolomics technique, this study aimed to examine the effect of BPF and BPS exposure on the metabolism of human ovarian granulosa (KGN) cells. Analysis of the differentially expressed metabolites (DEMs) identified 991 and 609 DEMs in the KGN cells exposed to BPF and BPS, respectively, at three various concentrations (0.1, 1, and 10 µM), with BPF having a greater interfering effect than BPS. Specifically, exposure to low concentrations (0.1 µM) of both bisphenols more greatly affected cellular metabolism than exposure to higher concentrations. Metabolic pathway enrichment analysis using the KEGG database revealed that the mechanisms by which BPF and BPS induced toxicity in the granulosa cells were different: BPF exposure significantly altered purine metabolism, autophagy-related pathways, and ferroptosis, whereas BPS mainly interfered with one-carbon metabolism (vitamin B6, riboflavin, and folate). These results demonstrated the differences in the mechanisms by which BPF and BPS induced to granulosa cell dysfunction.
Keywords
Bisphenol F
Bisphenol S
Cell metabolism
Granulosa cells
Metabolomics
1 Introduction
Bisphenol A (BPA) is frequently employed in the production of polycarbonate plastics, phenolic resins, and epoxy resins and serves as a crucial element in several consumer goods (Michałowicz, 2014). However, BPA gradually leaches from these products, contaminating animals and humans (both directly and indirectly) through household dust and other environmental media (Vandenberg et al., 2007). Bisphenols, with BPA being the most common, has been connected with higher risks of developing numerous illnesses and health issues, including ovarian dysfunction (Cimmino et al., 2020; Iles and Docherty, 2010; Konieczna et al., 2015; Ziv-Gal and Flaws, 2016).
Owing to its elevated toxicity and environmental persistence, measures aimed at eliminating the usage of BPA in consumer products have been proposed. Legislative action and consumer pressure have promoted the widespread usage of bisphenol F (BPF) and bisphenol S (BPS), two structural analogs of BPA, as alternatives of BPA for industrial applications and consumer products.
The most common alternative in BPA-free products, BPS is often used as a fundamental component in the manufacturing of conventional plastics, as a washing and curing agent in cleaning products, and as a component of coatings and thermal paper (Liao et al., 2012b). Meanwhile, BPF is used in the production of products that need enhanced thickness and endurance, such as pipe linings, adhesive plastics, and water pipes. Moreover, BPF epoxy resins are used in a wide range of consumer goods, such as paints, varnishes, dental sealants, mouth restorations, tissue substitutes, and food-packaging coatings (Usman et al., 2019). Due to the extensive use of these bisphenol analogs, they have been detected in different environmental media, including surface water, sediment, and sewage effluent (Česen et al., 2018; Jin and Zhu, 2016; Yamazaki et al., 2015; Yu et al., 2015). In humans, BPF and BPS in urine have been shown to be comparable to BPA in concentrations and frequency (Liao et al., 2012a; Zhou et al., 2014).
Infertility affects 10–15 % of couples worldwide, with female factors alone accounting for at least 35 % of all infertility (Li et al., 2021). Although there are many factors causing reproductive health disorders, mounting evidence has shown that exposure to endocrine-disrupting chemicals, such as bisphenols, is one of the most significant causes (Sifakis et al., 2017). Follicles are the basic functional units of mammalian ovaries, and disorder of ovarian follicle development is the main cause of female infertility. Thus, the interference effect of BPA on developing ovarian follicles has been studied. BPA exposure is associated with follicular atresia, luteal degeneration, and ovarian dysfunction (Cao et al., 2018; Santamaría et al., 2016; Ziv-Gal and Flaws, 2016). Owing to their structural similarity to BPA, BPF and BPS are thought to have comparable adverse effects on the body. Several studies have confirmed the negative consequences of BPF and BPS exposure to the ovaries (Gingrich et al., 2021; Ijaz et al., 2020). Sarwat et al. reported that exposure to both BPF and BPS caused negative changes in the physical structure and tissue pathology of rat ovaries, including an increase in the number of atretic and cystic follicles and a decrease in the number of antral and corpus luteum follicles (Ijaz et al., 2020). However, the specific mechanism by which BPF and BPS interfere with ovarian follicle development remains unknown.
Metabolomics is a useful tool for elucidating the underlying pathogenic mechanisms that result from xenobiotic exposure and can be used to study endogenous metabolic disorders (Goodrich et al., 2023). In this study, we first evaluated the effects of BPF and BPS exposure on granulosa cell viability using the KGN cell line, a human ovarian granulosa cell line with physiological functions and often used in ovarian toxicological studies. Subsequently, we investigated how these bisphenols influenced cellular metabolism using a non-targeted metabolomics approach. The metabolic changes caused by bisphenol exposure on cells were analyzed using multivariate statistical analysis and metabolic pathway analysis of differentially expressed metabolites. Our findings provide new insights into the differences in the mechanisms by which different bisphenols induce ovarian toxicity and serve as toxicological evidence for evaluating the feasibility of BPF and BPS as alternatives to BPA.
2 Materials and methods
2.1 Reagents
BPF and BPS (99.0–99.5 % purity) were purchased from Sigma-Aldrich (Darmstadt, Germany). Dimethyl sulfoxide (DMSO) was purchased from Solarbio Science & Technology Co., Ltd. (Beijing, China). Water (for HPLC) and methanol (HPLC-grade) were purchased from Thermo Fisher Scientific (Waltham, MA, USA).
2.2 Cell culture
KGN cells were purchased from Cellcook Biotech Co., Ltd. (Guangzhou, China). STR profiling was performed to ensure authenticity. To avoid the interference of phenol red on cellular metabolism, the KGN cells were cultivated in DMEM/F12 medium without phenol red (BDBIO, Hangzhou, China). The medium was enhanced with 10 % charcoal-stripped fetal bovine serum (VivaCell, Shanghai, China) and 1 % penicillin–streptomycin solution (Beyotime, Shanghai, China). Then, cells were incubated in a controlled environment with 5 % CO2 at 37 °C.
Herein, KGN cells were selected as the research object Because the primary human granulosa cells were acquired from individuals undergoing in vitro fertilization, cell metabolism may be vary owing to the different ovulation induction schemes (Guo et al., 2023; Hood et al., 2023). Furthermore, maintenance of the primary culture system poses significant challenges. In addition, KGN cells are often used in the study of ovarian toxicology and ovarian dysfunction.
2.3 Cell treatments
BPF and BPS were dissolved in DMSO to prepare various solutions (0.2, 2, and 20 mM), which were stored at –20 °C. Cells were treated for 24 h with BPF or BPS at 0.1, 1, and 10 µM. For the control, the cells were treated with an equivalent amount of DMSO (0.05 %) as the volume of the bisphenol stock solution.
2.4 Cell viability assay
Cell viability changes were determined using the Cell Counting Kit-8 (CCK-8; Beyotime Biotechnology, Shanghai, China) according to the manufacturer’s instructions. KGN cells were cultivated on 96-well plates at a density of approximately 2 × 10³ cells/well and exposed to varying concentrations of BPF and BPS (0.1, 1, and 10 μM) for 24 h. The cells were incubated at 37 °C for 2 h after CCK-8 solution (10 μL) was added to each well subsequent to the treatment. Absorbance readings at 450 nm were recorded using a microplate reader (Molecular Devices, CA, USA).
2.5 Autophagy analysis
Autophagy was determined by flow cytometry using the CYTO-ID® autophagy detection kit 2.0 (Enzo Life Sciences, USA) according to manufacturer’s instructions. Cells were cultured in 6-well plates at a density of approximately 3 × 10⁵ cells/well were trypsinized, washed once with PBS, and centrifuged at 1000 rpm for 5 min. Cell pellets were collected and incubated with CYTO-ID staining solution at 37 °C for 30 min in the dark. After incubation, fluorescence intensity was detected by flow cytometry in the FITC channel (ACEA Biosciences, USA).
2.6 Metabolomics sample preparation
KGN cells were cultivated in 10-cm plates at a density of approximately 2 × 10⁶ cells/plate and treated with BPF and BPS at concentrations of 0.1, 1, and 10 μM. The experiment was performed with six biological replicates and lasted for 24 h. Following the treatment, the cells were promptly cryopreserved in liquid nitrogen and stored at −80 °C in a solution containing methanol and water (4:1, v/v). Shanghai OE Biotech (Shanghai, China) prepared the samples, identified the metabolites, and quantified them.
2.7 Non-targeted metabolomics analysis
A non-selective metabolomic examination of the specimens was conducted using liquid chromatography-mass spectrometry (LC-MS). The initial LC-MS data were analyzed using Progenesis QI V2.3 software (Nonlinear Dynamics, Newcastle, UK) for baseline filtering, peak identification, integration, retention time correction, peak alignment, and normalization. The retrieved data were then subjected to further processing, whereby any peaks with a missing value (ion intensity = 0) were eliminated. The matrix was imported into R, and principal component analysis (PCA) was conducted to examine the overall distribution among the samples and assess the stability of the whole study. The metabolites that varied across groups were identified using orthogonal partial least-squares-discriminant analysis (OPLS-DA) and partial least-squares-discriminant analysis (PLS-DA). The model’s quality was assessed, and overfitting was prevented using seven-fold cross-validation and 200 response permutation testing (RPT). The Variable Importance of Projection (VIP) values obtained from the OPLS-DA model were used to ascertain the relative importance of each variable in terms of its contribution to group discrimination.
A two-tailed Student’s t-test was used to determine the statistical significance of the differential metabolites between the groups. Metabolites with p < 0.05 and VIP > 1 were classified as differentially expressed metabolites (DEMs). The DEMs underwent metabolic pathway enrichment analysis using the Kyoto Encyclopedia of Genes and Genomes (KEGG) database. Shanghai OE Biotech (Shanghai, China) performed the sample preparation, metabolite identification, and quantification.
2.8 Statistical analysis
Data are presented as the mean ± SD of at least three independent experiments. Groups were compared using one-way analysis of variance (ANOVA), followed by Tukey’s multiple-comparison test. Statistical significance was set at p < 0.05.
3 Results
3.1 Effects of BPF and BPS on KGN cell viability
We ascertained the cytotoxicity of BPF and BPS in KGN cells using CCK-8 assays to obtain the optimal exposure level for metabolomics analysis. As shown in Fig. 1, compared to the control group, there were no significant disparities in the viability of KGN cells after exposure to 0.1, 1, and 10 μM BPF (Fig. 1A), and BPS (Fig. 1B) for 24 and 48 h (both p > 0.05). In this study, we used bisphenols to select a concentration range from 0.1–to 10 μM for exposure to KGN cells that did not exhibit significant cytotoxicity.
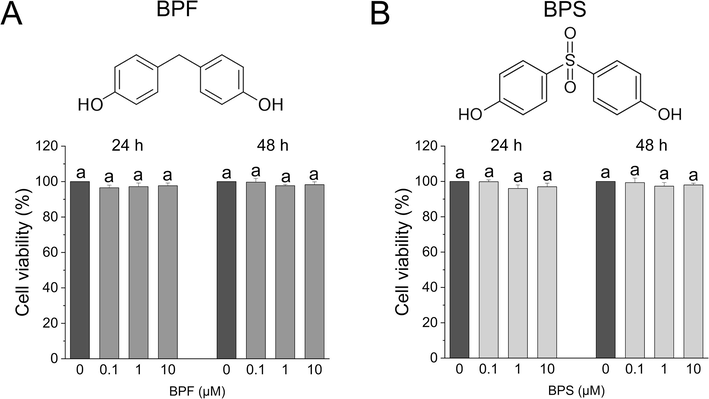
- Cytotoxicity effect of bisphenol exposure in KGN cells. (A) Molecular structure of BPF and the cytotoxicity of different concentrations of BPF (0, 0.1, 1, and 10 μM) in KGN cells was evaluated using CCK-8 assays. (B) Molecular structure of BPS and cytotoxicity of different concentrations of BPS in KGN cells. Data are expressed as the mean ± SD (n = 6). Different lowercase letters denote significant differences between the treatment groups (p < 0.05).
3.2 Multivariate statistical analysis
Multivariate statistical analysis using unsupervised PCA was performed to ascertain the overall distribution of metabolites across specimens and assess the whole analytical procedure stability (Fig. S1). Subsequently, PLS-DA added grouping variables to compensate for the shortcomings of PCA. The PLS-DA results showed an evident separation of metabolic patterns between the BPF (0.1, 1, and 10 µM) (Fig. 2A), and BPS (0.1, 1, and 10 µM) (Fig. 2C) groups and the control group (DMSO), suggesting that BPF and BPS treatment changed the metabolite profiles of KGN cells.
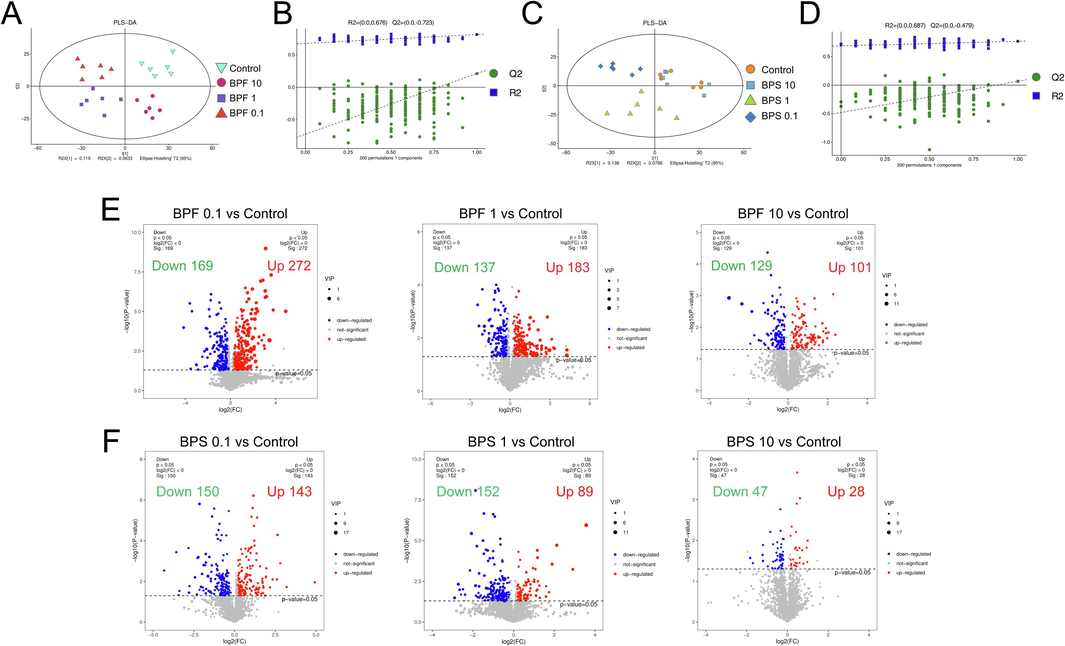
- Multivariate statistical analysis of comparison of different groups of samples. Partial least-squares-discriminant analysis (PLS-DA) score plot of BPF (A) and BPS (C) exposure and control groups, respectively. Validation models of a 200-response permutation testing (RPT) for the supervised models generated from different groups of samples (B and D). The number of DEMs is shown as volcano plots in KGN cells cultured with BPF (E) and BPS (F).
OPLS-DA is a modification of PLS-DA that filters out noise unrelated to classification information and improves the model’s analytical power and effectiveness. The OPLS-DA results showed the clustering of different treatment groups, emphasizing the differences between each treatment group (Fig. S2). Then, the model’s quality was assessed using RPT, obtaining R2 values of 0.676, and 0.687 and Q2 values of –0.723, and –0.479, respectively (Fig. 2B and D). These results indicate no overfitting and confirm that the model was effective.
3.3 Identification of differentially expressed metabolites
Volcano plots are a highly effective means to visualize the p, VIP, and fold-change (FC) values for screening DEMs, wherein the red or blue dots represent the significant DEMs. After BPF exposure at 0.1, 1, and 10 μM, 441 (272 upregulated and 169 downregulated), 320 (183 upregulated and 137 downregulated), and 230 (101 upregulated and 129 downregulated) DEMs were identified, respectively, relative to the control group (Fig. 2E). After BPS exposure at 0.1, 1, and 10 μM, 293 (143 upregulated and 150 downregulated), 241 (89 upregulated and 152 downregulated), and 75 (28 upregulated and 47 downregulated) DEMs were identified, respectively, relative to the control group (Fig. 2F). These data suggest that exposure to lower concentrations of bisphenols had a greater effect on the metabolic profiles of KGN cells, with BPF generating more DEMs than BPS.
3.4 Enrichment of significantly disturbed metabolic pathways
After exposure to 0.1, 1, and 10 μM BPF, 29 (19 upregulated and 10 downregulated), 12 (3 upregulated and 9 downregulated), and 7 (4 upregulated and 3 downregulated) pathways were enriched in KGN cells, respectively (Fig. 3A). After exposure to BPS at 0.1, 1, and 10 μM, 9 (6 upregulated and 3 downregulated), 18 (3 upregulated and 15 downregulated), and 5 (4 upregulated and 1 downregulated) pathways were significantly enriched in KGN cells, respectively (Fig. 3B).
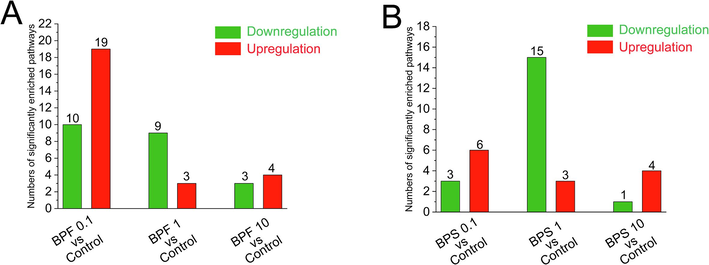
- Effect of BPF and BPS on metabolic pathway in KGN cells. The bar graph shows the number of pathways significantly enriched in KGN cells after BPF (A) and BPS (B) exposure. Red means significantly up-regulated pathways (p < 0.05), and green means significantly down-regulated pathways (p < 0.05).
The top 20 metabolic pathways with the highest enrichment were chosen from the KEGG database. In the KGN cells treated with 0.1 µM BPF, purine metabolism, cAMP signaling, and autophagy-related pathways were significantly upregulated compared to the control cells. Purine metabolism was significantly downregulated in KGN cells after exposure to 10 µM and 1 µM BPF compared to the control. In addition, ferroptosis was significantly downregulated in the KGN cells exposed to 1 µM and 0.1 µM BPF compared to the control group (Fig. 4).

- Enrichment of relevant metabolic pathways affected by BPF exposure based on the KEGG database. Red indicates significantly up-regulated pathways (p < 0.05), and green indicates significantly down-regulated pathways (p < 0.05).
Meanwhile, BPS exposure mainly upregulated vitamin B6 and riboflavin metabolism. After exposure of the KGN cells to 1 µM BPS, autophagy-related pathways were significantly downregulated compared to the control group (Fig. 5). These results demonstrated that BPF and BPS had distinct implications on the metabolism of human ovarian granulosa cells.

- Enrichment of relevant metabolic pathways affected by BPF exposure based on the KEGG database. Red indicates significantly up-regulated pathways (p < 0.05), and green indicates significantly down-regulated pathways (p < 0.05).
4 Discussion
BPA interferes with the endocrine processes, causing reproductive dysfunction by interfering with ovarian follicular development. Although BPA in commercial products is being substituted by BPF and BPS owing to their perceived safety, the effect of these structural analogs on female reproductive health remains uncertain. In this study, we revealed that exposure to BPF or BPS within the range of 0.1 and 10 μM poses no significant cytotoxicity in KGN cells. This finding is consistent with our previous results and those of Marie et al. in human granulosa cells (de la Riviere et al., 2023; Huang et al., 2020; Xu et al., 2024). Liao et al. collected urine samples from non-occupationally exposed adults in the United States. Of these samples, 55 % tested positive for the presence of BPF at concentrations ranging up to 212 ng/mL (1058.8 nM) (Liao et al., 2012a). A study on the serum concentration of bisphenol analogs in Chinese pregnant women showed that the highest detectable concentration of BPS was 141 ng/mL (563.4 nM) (Li et al., 2020). Therefore, the concentration range of BPF in our study (0.1–10 μM) corresponded to those from 20 ng/mL to 2002.3 ng/mL, thus covering the physiological concentrations of BPF detected in plasma and urine from previous studies. Similarly, the BPS concentrations used in our study were near to those of the human exposure risks.
Metabolomics involves the comprehensive analysis of the metabolites in cells, tissues, biofluids, or organisms and is a useful strategy to elucidate the mechanism of disease development and toxicity of exogenous substances. Metabolomics has been used to ascertain the toxicity of environmental heavy metal pollutants, such as cadmium, copper, and nickel, and organic pollutants, such as perfluorooctanoic acid, in living organisms. In this study, we used metabolomics to examine the effects of BPF and BPS exposure on the metabolite levels in human ovarian granulosa cells.
Cell metabolism is a series of continuously occurring biochemical reactions that are precisely regulated to produce substrates required for basic cellular processes. Purines are prevalent metabolites in mammalian cells. Purine nucleotides, such as ATP and GTP, play crucial roles in cellular energy production, internal signal transduction, and synthesis of DNA and RNA. In addition, purines can function as cofactors (e.g., NADH and coenzyme A) that are incorporated into more complex biomolecules (Pedley and Benkovic, 2017). Although purines play an essential contribution to the physiological function of cells, they also maintain oocytes in meiotic arrest (Downs, 1993; Downs et al., 1989). In this study, we found that BPF exposure was associated with an increase in purine levels, including those of AMP (Fig. 6B), ADP (Fig. 6C), dGMP, dGDP, GMP, inosine, adenosine, and guanosine; meanwhile, 0.1 μM BPS exposure increased xanthosine levels (Fig. 6A).
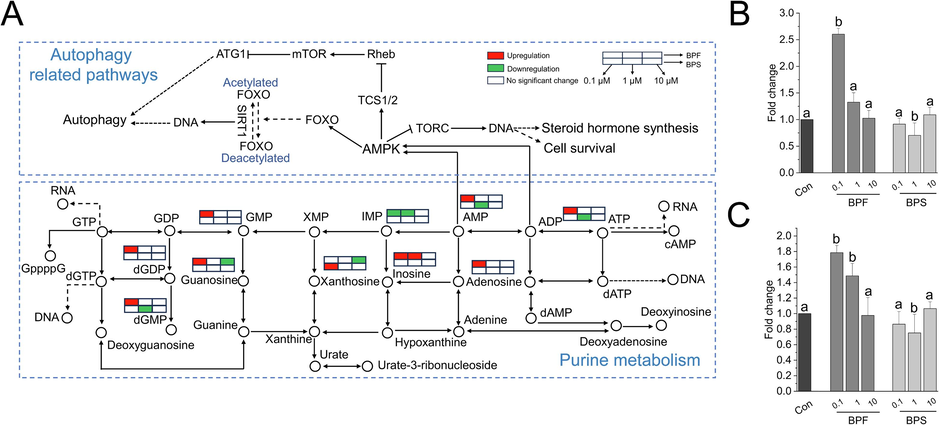
- Change in purine metabolism and autophagy-related pathways after exposure to bisphenols. (A) Change in purine metabolism and autophagy-related pathways after exposure to bisphenols. Red indicates upregulation, green indicates downregulation, and arrows indicate the direction of change. Bisphenols induced changes in the AMP (B) and ADP (C) levels in KGN cells. GMP: guanosine monophosphate; IMP: inosine monophosphate; AMP: adenosine 5′ −monophosphate; ADP: adenosine 5′-diphosphate; dGDP: 2′-deoxyguanosine 5′-diphosphate; dGMP: deoxyguanosine monophosphate; dITP: 2′-deoxyinosine-5′-triphosphate.
Guanosine, hypoxanthine, and adenosine have previously been shown to inhibit the spontaneous meiotic maturation of denuded oocytes in a concentration-dependent manner. Inhibition of follicle-stimulating hormone (FSH) or dibutyryl cAMP-induced germinal vesicle breakdown by adenosine and inosine was further confirmed by the ex vivo culture experiment (Downs, 1993; Eppig et al., 1985; Törnell et al., 1990). Furthermore, adenosine completely prevented the de novo FSH-induced purine synthesis in oocyte–cumulus cell complexes (Törnell et al., 1990). The synchronized bidirectional connection between the growing follicle and its oocyte is necessary for the proper development of both components. Somatic cells, particularly granulosa cells, facilitate the development of oocytes by producing certain metabolites and controlling their growth and maturation. Purines, along with other metabolites, may be transported from granulosa cells to oocytes via heterologous gap junctions, as evidenced by the decreased inhibitory effect of purines on oocytes when the granulosa cells around the oocyte were eliminated (Collado-Fernandez et al., 2012; Fontana et al., 2020).
Importantly, we found that purine metabolism lies in a central position in cell metabolism alterations induced by bisphenols, especially BPF. Other significantly enriched pathways induced by BPF, such as the AMPK, mTOR, FoxO, and PI3K-Akt pathways, are related to the AMP and ADP provided by purine metabolism (Table 1). Moreover, the disturbance of purine metabolism has been found in many diseases related to ovarian dysfunction, such as polycystic ovary syndrome. This condition is the predominant reproductive and metabolic problem that affects women in their reproductive years (Iles and Docherty, 2010; RoyChoudhury et al., 2016; Yu et al., 2021). Overall, we speculated that interference with purine metabolism in granulosa cells is the predominant mechanism by which BPF and BPS induce ovarian toxicity, especially BPF at low concentrations.
| KEGG pathways | Associated DEMs | p value |
|---|---|---|
| AMPK signaling pathway | AMP a, ADP b | 0.013 |
| mTOR signaling pathway | AMP | 0.031 |
| FoxO signaling pathway | AMP, ADP | 0.0005 |
| Lysosome | ADP | 0.031 |
| PI3K–Akt signaling pathway | AMP | 0.031 |
| cGMP–PKG signaling pathway | AMP, GMP c | 0.00004 |
| cAMP signaling pathway | AMP, Adenosine | 0.015 |
Autophagy is a cellular process in which damaged cell organelles are broken down to generate new building blocks necessary for sustaining cellular homeostasis (Mizushima, 2007). In both physiological and pathological conditions, autophagy is a highly controlled process that involves several upstream signal regulatory mechanisms, including mTOR and AMPK (Galluzzi et al., 2017). In this study, we found that low concentrations (0.1 μM) of BPF resulted in a significant upregulation of autophagy-related pathways, including those of AMPK, mTOR, PI3K-Akt, and FoxO (Fig. 6).
Autophagy is essential for directing the maturation of oocytes in the ovary until they are fertilized. Activation of the mTOR pathway in granulosa cells inhibits autophagy and promotes follicular development. After the identification of the dominant follicles, the remaining secondary follicles are destroyed by autophagy-induced apoptosis (Kumariya et al., 2021). Granulosa cells from degraded follicles have an upregulated expression of oxidized low-density lipoprotein receptor 1, which promotes autophagy by stimulating the generation of reactive oxygen species, thereby causing granulosa cell death via apoptosis (Kumariya et al., 2021; Zheng et al., 2019). The inhibitory action of MTORC1 is counterbalanced by the action of AMPK, which is activated by stresses that deplete cellular ATP levels and increase the AMP/ATP and ADP/ATP ratios (Dikic and Elazar, 2018; Galluzzi et al., 2017).
In this study, we found that the KGN cells exposed to low concentrations of BPF had elevated levels of AMP (Fig. 6B) and/or ADP (Fig. 6C), which likely induced the activation of the AMPK pathway (Fig. 6A). Currently, there are only a few reports on BPF-induced autophagy in granulosa cells. Lin et al. reported that low concentrations of BPA can induce autophagy in granulosa cells, which is mainly mediated by the AMPK pathway, and this induction effect was confirmed when KGN cells were pretreated with AMPK knockdown or 3-MA (Lin et al., 2021). To explore the effect of bisphenol on autophagy, we used flow cytometry to detect the changes in autophagy levels in KGN cells after exposure to BPF and BPS. As expected, BPF exposure significantly promoted autophagy, whereas BPS exposure had an inhibitory effect on autophagy (Fig. S3). This is consistent with recent reports on BPS inhibiting autophagy in ovarian and hepatocytes (Gao et al., 2024; Liang et al., 2023).
Although the involvement of autophagy in the physiological development of follicles has been confirmed, its role in pathological changes, such as ovarian dysfunction, remains controversial. The apoptosis of granulosa cells has been verified as the main cause of follicular atresia; however, increasing evidence has shown that granulosa cells undergo autophagy during follicular atresia, which promotes follicular atresia through excessive self-digestion and degradation of essential cellular components, in synergy with apoptosis (Kumariya et al., 2021; Tilly et al., 1991; Yu et al., 2004). Although the physiological atresia of follicles is necessary to maintain a healthy reproductive system, abnormal atresia is a major mechanism of ovarian dysfunction (Kumariya et al., 2021; Li et al., 2018; Tong et al., 2022). In particular, recent studies have reported that autophagy is crucial in the synthesis of sex steroid hormones, as it facilitates the lysosomal breakdown of lipid droplets, leading to the release of cholesterol (Esmaeilian et al., 2023; Texada et al., 2019). We speculate that excessive autophagy induced by bisphenols is one of the potential mechanisms promoting female reproductive dysfunction.
Unlike BPF, BPS mainly affected the metabolism of KGN cells by inducing changes in vitamin-related metabolic pathways, including vitamin digestion and absorption (p < 0.01), vitamin B6 metabolism (p < 0.01), riboflavin metabolism (p < 0.01), thiamine metabolism (p < 0.05), and folate metabolism pathway (p < 0.05), at concentrations of 1 μM or 0.1 μM (Table 2). Notably, vitamin B6, riboflavin, and folate are all key players in one-carbon metabolism as methyl donors or cofactors (Ducker and Rabinowitz, 2017; Lyon et al., 2020).
| KEGG pathways | Associated DEMs | p value | |
|---|---|---|---|
| up-regulated | down-regulated | ||
| Vitamin digestion and absorption | PLP a, PL b, FMN c, FAD d | – | 0.00004 (BPS-0.1); 0.007 (BPS-1) |
| Vitamin B6 metabolism | 4-pyridoxate, Pyridoxal, PLP | – | 0.0004 (BPS-0.1) |
| Riboflavin metabolism | FMN, FAD | – | 0.007 (BPS-0.1); 0.002 (BPS-1) |
| One carbon pool by folate | 5,10-methenyl-THF e | – | 0.047 (BPS-0.1) |
| Folate biosynthesis | – | Tetrahydrobiopterin, 4a-hydroxytetrahydrobiopterin |
0.011 (BPS-0.1) |
In addition, we found that one-carbon metabolism was significantly upregulated in KGN cells after exposure to BPS (Fig. 5). Although vitamins are cofactors in many metabolic processes, their beneficial effects on follicle development and the maintenance of normal reproductive function have been reported previously. Nevertheless, the atypical stimulation of one-carbon metabolism is intricately linked to mitochondrial malfunction and hinders the production of good-quality oocytes in polycystic gilt ovaries (Jia et al., 2016). Previous studies have reported the significant enrichment of vitamin digestion and absorption following BPS exposure in mice and human embryonic stem cells (Liang et al., 2021).
Although KGN cells are human ovarian granulosa-like cells and often used in ovarian toxicological studies, they also have the characteristics of tumor cells. Because one-carbon metabolism plays a critical role in tumor proliferation and invasion, its role in the reproductive toxicity of BPS requires further investigation. Animal experiments should be conducted to determine the role of one-carbon metabolism in BPS-mediated ovarian toxicity. In this study, the mechanisms of interference of BPF and BPS exposure on the metabolism of granulosa cells (KGN cells) are distinct. We speculate that this may be related to their molecular structures. Although BPF and BPS are structural analogs of BPA, BPF has a methylene group instead of a propane group, similar to BPA, whereas BPS has a sulphonyl group instead of the propane bridge of BPA. Thus, BPS is more polar than BPF. Because cytotoxicity decreases with increasing polarity (Mokra et al., 2018; Molina-Molina et al., 2013; Xu et al., 2024). However, there are only a few studies investigating the link between the molecular structure of bisphenols and toxicity, and further studies are required to confirm this hypothesis.
5 Conclusions
Using a metabolomics approach, we revealed that both BPF and BPS interfered with the cellular metabolism of KGN cells. In particular, based on the number of DEMs identified (991 vs. 609, respectively), BPF had a greater effect on cell metabolism than BPS. Specifically, exposure to low concentrations (0.1 μM) of both bisphenols had a stronger interfering effect on cellular metabolism than exposure to higher concentrations. In addition, KEGG pathway enrichment analysis revealed that BPF and BPS had various implications on the regulation of metabolic pathways in KGN cells. These results suggest that the mechanisms by which the two bisphenols induce female reproductive toxicity are distinct. To our knowledge, this was the first comparative study of the metabolic disturbances associated with BPF and BPS exposure in human granulosa cells. Future studies should focus on investigating the harmful impacts of BPA analogs.
CRediT authorship contribution statement
Shaolong Cheng: Writing – original draft, Investigation, Formal analysis, Data curation. Mingquan Huang: Writing – original draft, Investigation. Shuang Liu: Writing – review & editing, Investigation. Meng Yang: Writing – review & editing, Supervision, Resources, Project administration, Methodology, Funding acquisition.
Acknowledgments
The funding for this investigation was provided by the Natural Science Foundation of Sichuan Province (24NSFSC3878), Wu Jieping Medical Foundation (320.6750.2023-18-100, HD24003) and the Affiliated Hospital of Southwest Medical University Start‐up Fund for Doctoral Scientific Research (16236).
Declaration of competing interest
The authors declare that they have no known competing financial interests or personal relationships that could have appeared to influence the work reported in this paper.
References
- The correlation between exposure to BPA and the decrease of the ovarian reserve. Int. J. Clin. Exp. Pathol.. 2018;11:3375.
- [Google Scholar]
- The occurrence and source identification of bisphenol compounds in wastewaters. Sci. Total Environ.. 2018;616:744-752.
- [Google Scholar]
- Potential mechanisms of bisphenol A (BPA) contributing to human disease. Int. J. Mol. Sci.. 2020;21:5761.
- [Google Scholar]
- Metabolism throughout follicle and oocyte development in mammals. Int. J. Dev. Biol.. 2012;56:799-808.
- [Google Scholar]
- Cumulative and potential synergistic effects of seven different bisphenols on human granulosa cells in vitro? Environ. Pollut.. 2023;330:121818
- [Google Scholar]
- Mechanism and medical implications of mammalian autophagy. Nat Rev Mol Cell Biol. 2018;19:349-364.
- [Google Scholar]
- Purine control of mouse oocyte maturation: evidence that nonmetabolized hypoxanthine maintains meiotic arrest. Mol. Reprod. Dev.. 1993;35:82-94.
- [Google Scholar]
- Maintenance of meiotic arrest in mouse oocytes by purines: modulation of cAMP levels and cAMP phosphodiesterase activity. Gamete Res.. 1989;23:323-334.
- [Google Scholar]
- Hypoxanthine and adenosine in murine ovarian follicular fluid: concentrations and activity in maintaining oocyte meiotic arrest. Biol. Reprod.. 1985;33:1041-1049.
- [Google Scholar]
- Autophagy regulates sex steroid hormone synthesis through lysosomal degradation of lipid droplets in human ovary and testis. Cell Death Dis. 2023;14:342.
- [Google Scholar]
- Molecular definitions of autophagy and related processes. EMBO J. 2017;36:1811-1836.
- [Google Scholar]
- Perinatal bisphenol S exposure exacerbates the oxidative burden and apoptosis in neonatal ovaries by suppressing the mTOR/autophagy axis. Environ Pollut. 2024;349:123939
- [Google Scholar]
- Bisphenol S enhances gap junction intercellular communication in ovarian theca cells. Chemosphere. 2021;263:128304
- [Google Scholar]
- Metabolic Signatures of Youth Exposure to Mixtures of Per-and Polyfluoroalkyl Substances: A Multi-Cohort Study. Environ. Health Perspect.. 2023;131:027005
- [Google Scholar]
- Metabolomics analysis of follicular fluid in ovarian endometriosis women receiving progestin-primed ovary stimulation protocol for in vitro fertilization. Sci Rep. 2023;13:5747.
- [Google Scholar]
- Serum and follicular fluid metabolome and markers of ovarian stimulation. Hum Reprod. 2023;38:2196-2207.
- [Google Scholar]
- Bisphenol A and its analogues bisphenol S, bisphenol F and bisphenol AF induce oxidative stress and biomacromolecular damage in human granulosa KGN cells. Chemosphere. 2020;253:126707
- [Google Scholar]
- Exposure of BPA and its alternatives like BPB, BPF, and BPS impair subsequent reproductive potentials in adult female Sprague Dawley rats. Toxicol. Mech. Methods. 2020;30:60-72.
- [Google Scholar]
- Purine metabolite levels in preovulatory human follicles may hold the key to ovarian hyperstimulation syndrome. Metabolism. 2010;59:e10-e11.
- [Google Scholar]
- Abnormally activated one-carbon metabolic pathway is associated with mtDNA hypermethylation and mitochondrial malfunction in the oocytes of polycystic gilt ovaries. Sci. Rep.. 2016;6:19436.
- [Google Scholar]
- Occurrence and partitioning of bisphenol analogues in water and sediment from Liaohe River Basin and Taihu Lake. China. Water Res.. 2016;103:343-351.
- [Google Scholar]
- Konieczna, A., Rutkowska, A., Rachon, D., 2015. Health risk of exposure to Bisphenol A (BPA). Rocz Panstw Zakl Hig 66.
- Autophagy in ovary and polycystic ovary syndrome: role, dispute and future perspective. Autophagy. 2021;17:2706-2733.
- [Google Scholar]
- Integrative proteome analysis implicates aberrant RNA splicing in impaired developmental potential of aged mouse oocytes. Aging Cell. 2021;20:e13482.
- [Google Scholar]
- Autophagy is activated in the ovarian tissue of polycystic ovary syndrome. Reproduction. 2018;155:85-92.
- [Google Scholar]
- Serum concentration of bisphenol analogues in pregnant women in China. Sci Total Environ. 2020;707:136100
- [Google Scholar]
- PPARα Senses Bisphenol S to Trigger EP300-Mediated Autophagy Blockage and Hepatic Steatosis. Environ Sci Technol. 2023;57:21581-21592.
- [Google Scholar]
- Evaluation of the effects of low nanomolar bisphenol A-like compounds’ levels on early human embryonic development and lipid metabolism with human embryonic stem cell in vitro differentiation models. J. Hazard. Mater.. 2021;407:124387
- [Google Scholar]
- Bisphenol S in urine from the United States and seven Asian countries: occurrence and human exposures. Environ. Sci. Technol.. 2012;46:6860-6866.
- [Google Scholar]
- Bisphenol S, a new bisphenol analogue, in paper products and currency bills and its association with bisphenol A residues. Environ. Sci. Technol.. 2012;46:6515-6522.
- [Google Scholar]
- Bisphenol A promotes autophagy in ovarian granulosa cells by inducing AMPK/mTOR/ULK1 signalling pathway. Environ. Int.. 2021;147:106298
- [Google Scholar]
- B vitamins and one-carbon metabolism: implications in human health and disease. Nutrients. 2020;12:2867.
- [Google Scholar]
- Bisphenol A–sources, toxicity and biotransformation. Environ. Toxicol. Pharmacol.. 2014;37:738-758.
- [Google Scholar]
- Low-concentration exposure to BPA, BPF and BPAF induces oxidative DNA bases lesions in human peripheral blood mononuclear cells. Chemosphere. 2018;201:119-126.
- [Google Scholar]
- In vitro study on the agonistic and antagonistic activities of bisphenol-S and other bisphenol-A congeners and derivatives via nuclear receptors. Toxicol Appl Pharmacol. 2013;272:127-136.
- [Google Scholar]
- A new view into the regulation of purine metabolism: the purinosome. Trends Biochem. Sci.. 2017;42:141-154.
- [Google Scholar]
- Serum metabolomics of Indian women with polycystic ovary syndrome using 1 H NMR coupled with a pattern recognition approach. Mol. Biosyst.. 2016;12:3407-3416.
- [Google Scholar]
- Ovarian dysfunctions in adult female rat offspring born to mothers perinatally exposed to low doses of bisphenol A. J Steroid Biochem Mol Biol. 2016;158:220-230.
- [Google Scholar]
- Human exposure to endocrine disrupting chemicals: effects on the male and female reproductive systems. Environ. Toxicol. Pharmacol.. 2017;51:56-70.
- [Google Scholar]
- Autophagy-mediated cholesterol trafficking controls steroid production. Dev Cell. 2019;48(659–671):e654.
- [Google Scholar]
- Involvement of apoptosis in ovarian follicular atresia and postovulatory regression. Endocrinology. 1991;129:2799-2801.
- [Google Scholar]
- Insulin resistance, autophagy and apoptosis in patients with polycystic ovary syndrome: Association with PI3K signaling pathway. Front. Endocrinol. (lausanne). 2022;13:1091147.
- [Google Scholar]
- Effects of follicle stimulating hormone and purines on rat oocyte maturation. Mol. Reprod. Dev.. 1990;27:254-260.
- [Google Scholar]
- Occurrence, toxicity and endocrine disrupting potential of Bisphenol-B and Bisphenol-F: A mini-review. Toxicol. Lett.. 2019;312:222-227.
- [Google Scholar]
- Bisphenol A and its structural analogues exhibit differential potential to induce mitochondrial dysfunction and apoptosis in human granulosa cells. Food Chem Toxicol. 2024;188:114713
- [Google Scholar]
- Bisphenol A and other bisphenol analogues including BPS and BPF in surface water samples from Japan, China, Korea and India. Ecotoxicol. Environ. Saf.. 2015;122:565-572.
- [Google Scholar]
- Apoptosis in granulosa cells during follicular atresia: relationship with steroids and insulin-like growth factors. Cell Res.. 2004;14:341-346.
- [Google Scholar]
- Untargeted metabolomic approach to study the serum metabolites in women with polycystic ovary syndrome. BMC Med. Genomics. 2021;14:1-15.
- [Google Scholar]
- Occurrence and estrogenic potency of eight bisphenol analogs in sewage sludge from the US EPA targeted national sewage sludge survey. J. Hazard. Mater.. 2015;299:733-739.
- [Google Scholar]
- Autophagy and apoptosis of porcine ovarian granulosa cells during follicular development. Animals. 2019;9:1111.
- [Google Scholar]
- Automated on-line column-switching high performance liquid chromatography isotope dilution tandem mass spectrometry method for the quantification of bisphenol A, bisphenol F, bisphenol S, and 11 other phenols in urine. J. Chromatogr. B. 2014;944:152-156.
- [Google Scholar]
- Evidence for bisphenol A-induced female infertility: a review (2007–2016) Fertil. Steril.. 2016;106:827-856.
- [Google Scholar]
Appendix A
Supplementary data
Supplementary data to this article can be found online at https://doi.org/10.1016/j.arabjc.2024.105904.
Appendix A
Supplementary data
The following are the Supplementary data to this article:
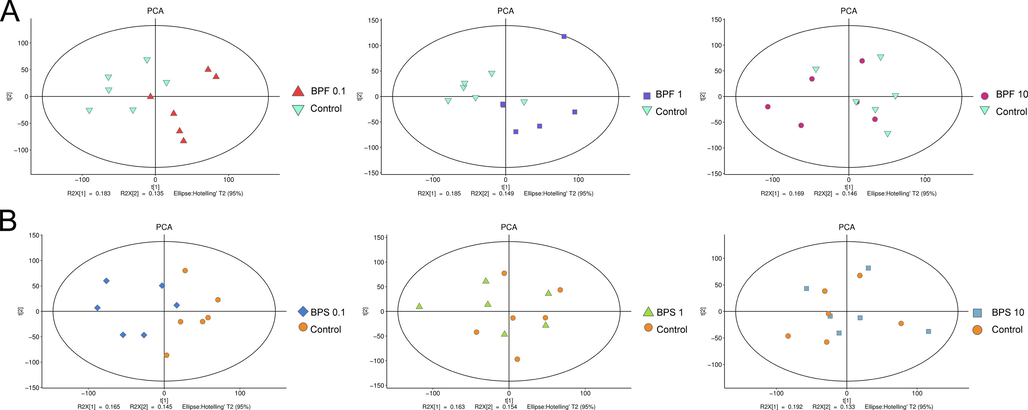
- Principle component analysis (PCA) based on the metabolic profiling of KGN cells exposed to BPF (A) and BPS (B).
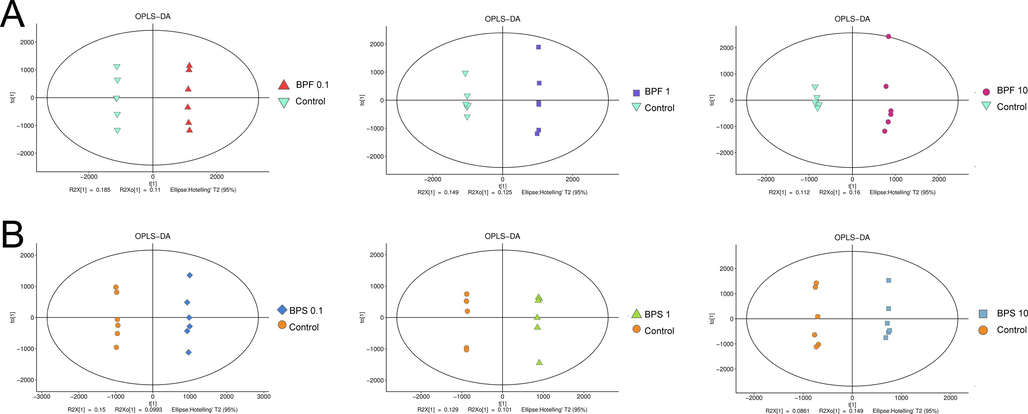
- Orthogonal partial least squares discriminant analysis (OPLS-DA) score plot based on the metabolic profiling of KGN cells cultured with BPF (A) and BPS (B).
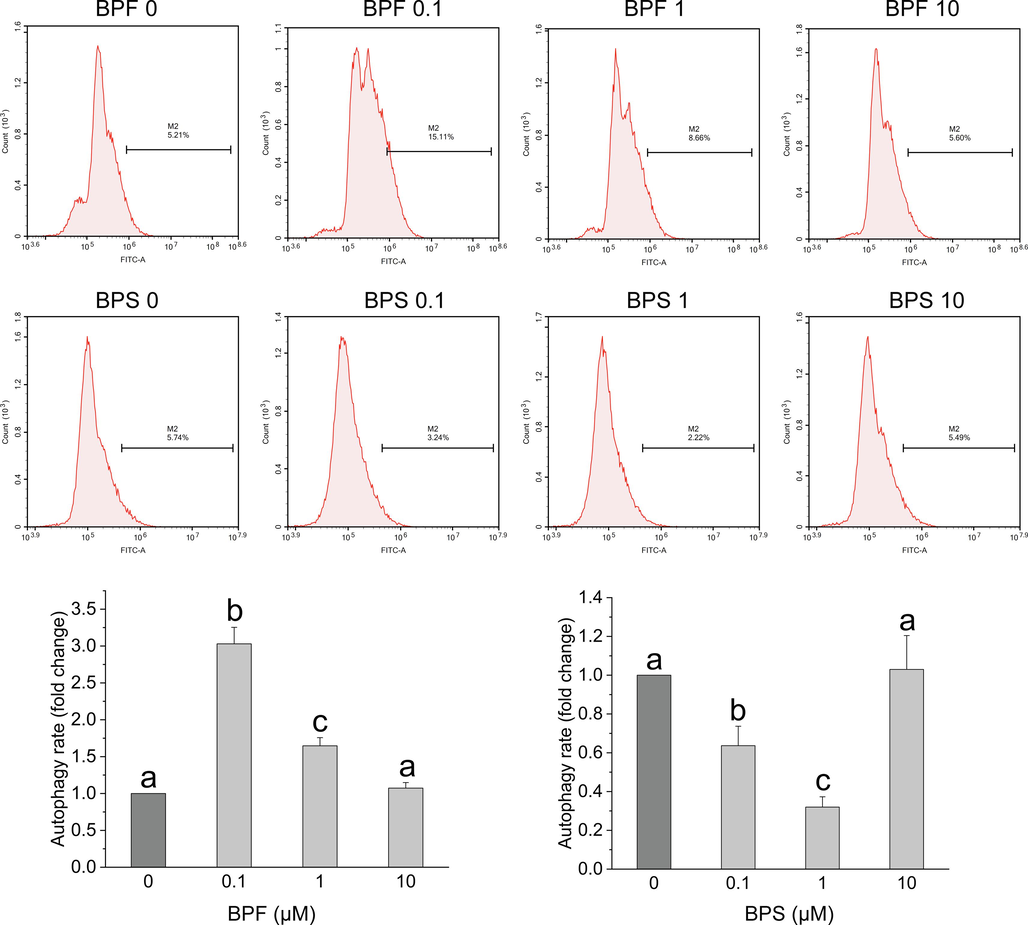
- Analysis of the effect of bisphenol on autophagy in KGN cells using flow cytometry. After 24 h of exposure to BPF (A) and BPS (B), flow cytometry was performed to evaluate the changes in autophagy levels in KGN cells by labeling with the CYTO-ID fluorescent dye. Data are expressed as the mean ± SD (n = 3). Different lowercase letters denote significant differences between the treatment groups (p < 0.05).


