

Translate this page into:
Blood chemical components analysis of honeysuckle and formulation of xanthan gum/starch-based (PVA-co-AA) hydrogels for controlled release
⁎Corresponding authors. Lyzlyg@163.com (Zheng-gen Liao), anaeemktk@gmail.com (Abid Naeem), guanym2008@163.com (Yongmei Guan)
-
Received: ,
Accepted: ,
This article was originally published by Elsevier and was migrated to Scientific Scholar after the change of Publisher.
Peer review under responsibility of King Saud University.
Abstract
Honeysuckle is a commonly used Chinese medicine for treating intestinal inflammation and other diseases. Compounds that are absorbed into the blood produce pharmacodynamic effects. However, it is still unclear which compounds in honeysuckle are absorbed into the blood. Thus, the purpose of this study was to investigate the composition and in vivo absorption of active components in honeysuckle in male Sprague-Dawley rats, and develop a controlled release hydrogel system. UPLC-LTQ-Orbitrap-MS was used to determine the active ingredients of honeysuckle in vitro and in vivo. A total of 80, out of which 42 components were found to be absorbed into the blood, which includes flavonoids, iridoids, organic acids and other compounds. FTIR analysis confirmed crosslinking between hydrogel content and drug loading, and TGA and DSC analysis indicated a high thermal stability. XRD analysis showed a decrease in crystallinity following crosslinking, and SEM revealed an irregular and hard surface. The maximum swelling and drug release were observed at pH 7.4 as compared to pH 1.2. The identified blood components can be used to determine Q-markers, while the prepared hydrogels can serve as an effective and promising carrier for the controlled release of honeysuckle extracts.
Keywords
Lonicera japonica
Extracts
Hydrogels
Decoction
UPLC-LTQ-Orbitrap-MS

1 Introduction
Honeysuckle (Lonicera japonica Thunb.) has long been used as a traditional medicinal herb in East Asia. The flowers and leaves of this plant contain a high level of chlorogenic acids, and it has been used in Chinese medicine for many years for clearing heat, intestinal inflammation, and detoxifying. It is most oftenly used to treat all kinds of hot venereal diseases, such as fever, hair spots, sore throat, etc. Honeysuckle has many active ingredients, including phenolic acids, flavonoids, terpenoids, triterpene cycloalkene ether etc. (Shang et al., 2011). Various pharmacological studies have shown that honeysuckle has anti-inflammatory, antipyretic, anti-tumor, anti-viral, anti-aging antioxidant, lowering blood sugar, hepatoprotective, lung protective, the nervous system protective, immunoenhancive and platelet aggregation properties (Zhimei et al., 2014). At present, honeysuckle has been widely used in compound preparations.
The Chinese Pharmacopoeia 2020 specification for honeysuckle stipulates that chlorogenic acid (C16H18O9) shall not be less than 1.5 %. The total amount of 5-dio-O-caffeylquinic acid (C25H24O12) should not be less than 3.8 %, and luteolin (C21H20O11) should not be less than 0.050 % (TIAN et al., 2021). However, it is quite challenging to comprehensively assess the quality of honeysuckle until the pharmacological mechanisms of Traditional Chinese Medicine are not fully understood. Most studies on the quality of Traditional Chinese medicine focus on the quantification of ingredients in vitro, and the concentration of ingredients in traditional Chinese medicines are regarded as the main feature of quality marker selection (Yang et al., 2017), which is not strongly correlated with efficacy. To solve this problem, Liu Changxiao et al. (Li et al., 2019) proposed the new concept of Q-marker to clarify the correlation between TCM quality control indicators and efficacy, and improve the specificity and measurability of quality control indicators. Quality control in Traditional Chinese Medicine is based on “Effectiveness”, which is the core element of q-Marker's “Five Principles”. Following oral administration of honeysuckle, the active ingredients will exert their clinical effects after quality transfer and metabolic transformation. The effective components in the blood constitute the final link in the quality transfer process (Cai et al., 2019). Therefore, the absorbed components of honeysuckle in the blood are closely related to its effectiveness, and can be used as an important basis for screening quality markers of honeysuckle.
UPLC-LTQ-Orbitrap-MS technology has the advantages of high resolution, high selectivity and high sensitivity, and can quickly and simultaneously realize the high resolution data acquisition of parent and daughter ions, and obtain the fragment information of multistage mass spectrometry (Duan et al., 2021). At present, UPLC-LTQ-Orbitrap-MS technology has been widely used in the analysis of Traditional Chinese medicine and its compound components, in vivo metabolomics, serum pharmacochemistry, etc. (Zhou et al., 2020). Therefore, in this study, UPLC-LTQ-Orbitrap-MS technology was used to analyze the chemical components contained in honeysuckle together with serum pharmacochemistry. In vivo detection of the active substances of honeysuckle were determined using the prototype drug components absorbed into the blood. This provided a basis for determining the quality markers of honeysuckle. Therefore, it is of great significance to establish a set of comprehensive quality control methods for honeysuckle.
Moreover, phytoactive compounds have been found to possess a number of beneficial properties including antiviral, antimicrobial, anticarcinogenic, antioxidant, anti-inflammatory, and cardio-protective properties. In general, active ingredients found in plants or portions of plants, such as polyphenols, are stable and active within the plant. However, once they have been extracted, they are prone to degradation, which poses a significant challenge when processing foods or herbal medicines and storing food/drug products. It is important to maintain the bioactivity, stability, and bioavailability of these chemicals (polyphenols) to ensure their effectiveness (Estevinho et al., 2021). Encapsulated polyphenols can offer many advantages over free polyphenols including their stability, reactivity with other compounds, oxidation, diminished taste, controlled delivery, separation of incompatible compounds, and increase bioavailability as well as half-life in vivo and in vitro (Quintal Martínez et al., 2018). Hydrogels are considered the most suitable carrier agent for controlled delivery of therapeutic agents owing to their unique properties, such as high hydrophilicity, swelling, stability, gelling, biodegradability, biocompatibility, and low toxicity (Bernhard and Tibbitt 2021). Therefore, the authors developed xanthan gum/starch-based hydrogels to deliver honeysuckle while avoiding its degradation and increasing its bioavailability. Generally, hydrogels are three-dimensional crosslinked polymeric hydrophilic networks that absorb a large amount of water without losing their structural integrity. In recent years, hydrogels have become increasingly popular in the pharmaceutical and biomedical fields due to their excellent response to external stimuli, such as temperatures, pH levels, magnetic and electrical fields, and ionic strength. One of the most studied and widely utilized types of stimuli-sensitive hydrogels is pH-sensitive hydrogels which are frequently utilized for controlled and site-specific drug delivery (Vigata et al., 2020). In the present study, pH-responsive xanthan gum/starch-based hydrogels are prepared for controlled delivery of honeysuckle aqueous extracts.
Xanthan gum is one of the most promising biodegradable, highly molecular weight extracellular polymers that can be obtained by fermenting a gram negative bacteria known as Xanthomonas campestris (Cortes et al., 2020). This polysaccharide (polyelectrolyte) contains glucuronic acid and pyruvic acid in its side chains, and has a cellulose base. Gums can be limited in their application for sustained release of drugs due to some inherent characteristics, such as hydrophilicity, solubility at different pH levels, and microbial contamination. Gum polysaccharides are generally cross-linked with other natural polymers in order to eliminate these drawbacks. The cross-linking of two polymers in the presence of a free radical initiator results in the formation of a three-dimensional network. Hydrogels with these cross-linked multipolymer architectures are mechanically and thermally stable (Ngwabebhoh et al., 2021). Starch is a natural polysaccharide that has a wide range of applications within the food and pharmaceutical industries. Basically, it is a semi-crystalline homopolysaccharide that consists of chains of amylose and amylopectin. Xanthan gum and starch can be combined through cross-linking to improve hydrogel thermal stability and mechanical properties (Lemos et al., 2021). In recent years, PVA (polyvinyl alcohol) has proven to be an effective and practical synthetic polymer for use in biomedical applications. PVA is widely used to prepare hydrogel formulations in the pharmaceutical field due to its high biocompatibility and non-toxic properties in both in-vitro and in-vivo studies (Khan et al., 2021). Acrylic acid enhanced the sensitivity of the developed hydrogel, enabling it to swell considerably at high pH values (pH 7.4), as opposed to low pH values (pH 1.2). The present hydrogel has the advantage of protecting honeysuckle extracts from stomach acidity as well as protecting the stomach itself from any adverse effects of honeysuckle extracts. Since the fabricated hydrogel swelled most at pH 7.4, a large amount of drug was released in a controlled manner at basic pH 7.4. Further studies were performed on the prepared hydrogels.
2 Materials and methods
2.1 Materials
Polyvinyl alcohol (PVA; M. weight = 85000–124,000, 87–89 % hydrolyzed, lot number: MKCK7633), acrylic acid (AA; M. weight = 72.06 g/moL, lot number: STBJ9698), Ethylene glycol dimethacrylate (EGDMA; MW: 198.22 g/moL, lot number: MKCM9080), and ammonium persulfate (APS, lot number: MKCM6448) were purchased from Sigma-Aldrich (Germany). Sodium bisulfite (SHS, lot number: C2120118) was procured from Shanghai Aladdin biochemical technology, China. Xanthan gum (MW: 1016.8 g/moL, purity = 99 %, and viscosity = mPa.s ≥ 1200, lot number: H1852097) was obtained from cool chemical science technology, China. Starch soluble (M. weight = 342.3 g/moL, lot number: RH242965) was obtained from Rhawn chemical technology, China.
Reference standards, such as chlorogenic acid (lot number: RDD-L007001908029), neochlorogenic acid (lot number: RDD- X01402112013), strychnic acid (lot number: RDD-D09602012028), strychnoside (lot number: RDD-Y08002106016), rutin (lot number: 21010803), isoquercetin (lot number: RDD-Y07601904023), luteoloside (lot number: RDD-M02501910014), lonicidin (lot number: RDD-R06702112017), isochlorogenic acid A (lot number: RDD-Y06802109007), and isochlorogenic acid C (lot number: RDD-Y07002105012) were purchased from Chengdu Pufield Biotechnology Co., ltd (China), and the purity of all reference products was>98 %. Methanol (lot number: MS1922-801) and acetonitrile (lot number: AS1122-801) were from TEDIA reagent Co., ltd. (China), and formic acid (lot number: 210603) was obtained from Xilong Scientific Co., ltd. China. Highly purified water (lot number: 202108262112HT) were obtained from Hangzhou wahaha group Co., ltd. China. Honeysuckle was collected from Shandong province and identified as Lonicera japonica Thunb. (Voucher No. SD20211219) by professor Fei Ge of Jiangxi university of traditional Chinese medicine, Nanchang, China.
2.2 Experimental animals
A total of 12 Sprague-Dawley rats (SD rats, weighing 250 ± 50 g, male) were obtained from Hunan Slacker Jingda Experimental Animal Co., ltd. China. The animal experiments were performed in accordance to the “ARRIVE guidelines”, and the study was approved by the animal ethical committee of Jiangxi University of Chinese medicine, China (study approval no. JZLLSC20220584). The animals were kept at room temperature of 23 ± 2 ℃, humidity of 50 ± 5 %, normal light (12 h light /12 h dark environment), fed twice a day, free drinking water. The animals were adapted to the environment for 1 week before doing any experiments. The animals were anesthetized by intraperitoneal injection of 3 % pentobarbital sodium (0.15 mL/100 g body weight) and the animals were sacrificed using cervical dislocation under anesthesia.
2.3 Methods
2.3.1 Preparation of honeysuckle decoction (aqueous extract)
Honeysuckle slices (20 g) were accurately weighed and added 240 mL of purified water in an electric heating sleeve and soaked for 30 min, boiled gently with reflux conditioner for 30 min and then filtered. The extract of Honeysuckle was obtained by adding ultra-pure water to make up the volume, mixed with ultrasonic machine and then filtered using 0.22 µm microporous filter membrane.
2.3.2 Preparation of honeysuckle standard decoction (aqueous extract)
Honeysuckle standard decoction were prepared according to the principles of “Chinese Medicine Granule Management Method (Draft)” issued by the National Pharmacopoeia Committee of China. The honeysuckle decoction pieces (75 g) were accurately weighed, soaked in 12 times as much water for 30 min, gently boiled for 30 min, then filtered while still hot. The residue was decocted with 10 times of water, kept boiling for 20 min on gentle heating, and filtered while hot. The decoctions were combined and then concentrated under pressure to obtain a concentration of 1 g/mL (Xiong and Long 2020).
2.3.3 Preparation of reference solution
The standard substances used, such as neochlorogenic acid, chlorogenic acid, strychnic acid, strychnoside, rutin, isoquercetin, luteoloside, lonicidin, isochlorogenic acid A and isochlorogenic acid C, were accurately weighed and mixed with methanol to obtain the concentrated solution. Then the concentrated solution was diluted with methanol to prepare 80 μg·mL−1 reference solution, which was filtered by 0.22 µm microporous membrane to obtain the in vitro reference solution of Honeysuckle.
2.4 Preparation of drug-containing serum
2.4.1 Drug administration and serum collection
The SD rats (n = 12, Male) were randomly divided into 4 groups (A, B, C and D) with 3 animals in each group. According to the Chinese Pharmacopoeia (2020 edition) (Leong et al., 2020), the daily clinical dosage of Honeysuckle (Lonicera japonica) is 6–15 g, and the maximum dosage of 15 g was selected (Fang et al., 2021). According to the literature and preliminary experimental results, the intragastric dose of rats was increased to 10 times that of human clinical medication, i.e., raw drug dose of 16 g·kg−1. Rats in groups B, C and D were intra-gastrically gavaged with honeysuckle decoction, and rats in group A received same amount of normal saline. Blood samples were collected from abdominal aorta of rats in groups B, C and D at 60, 80 and 100 min after administration, respectively. The blood samples were kept for 1 h at 4 ℃ and centrifuged at 3500 rpm/min for 15 min to obtain upper serum. Then, stored at −80 ℃ refrigerator for subsequent processing and analysis.
2.4.2 Serum samples preparation
For each group, placed 300 uL serum into a 2 mL EP tube, added 900 µL methanol–acetonitrile (1:1), vortex mixed for 3 min, stand it for 30 s, centrifuged at 12000 rpm at 4 °C for 10 min, taken the supernatant and blow dried with nitrogen at 40 °C. The residue was redissolved with 200 μL methanol, then vortex mixed for 3 min, centrifuged at 12000 rpm at 4 ℃ for 10 min, and then the supernatant was taken for testing.
2.5 UPLC-LTQ-Orbitrap-MS analysis conditions
2.5.1 Chromatographic conditions
The chromatographic separation was performed on an ACQUITY UPLC HSS T3 column (100 mm × 2.1 mm, 1.8 μm) with a mobile phase of 0.2 % formic acid aqueous solution (A) and acetonitrile (B) by gradient elution as follows: 0–9 min, 5 %-20 % B; 9–10 min, 20 %-25 % B; 10–20 min, 25 %-80 % B; 20 ∼ 30 min, 80 % ∼ 90 % B; 30 ∼ 30.1 min, 90 % ∼ 5 % B; and 30.1 ∼ 33 min, 5 % B. The column temperature was 40 ℃, the injection volume was 2 μL, and the flow rate was 0.3 mL/min.
2.5.2 Mass spectrometry conditions
The mass spectrometry conditions were as follows: Electrospray ion source (ESI); positive and negative ion detection modes, capillary temperature was 350 ℃; flow of sheath gas was 30 L/h; and auxiliary gas flow was 10 L/h. In positive ionization mode the spray voltage was 3 kV, capillary voltage was 35 V, tube lens voltage was 110 V, and in negative ionization mode the spray voltage was −3 kV, capillary voltage was −35 V, and tube lens voltage was −110 V. The sample was scanned in full scan mode with a resolution of 30000, a mass scan range of m/ Z50-1250, and a data-dependent scan of DDA-MS2. Parent ion pil-MS2, and fragment ions were obtained by CID and HCD pyrolysis.
2.6 Data processing
2.6.1 Identification of chemical constituents of honeysuckle
The Xcalibur version 2.1 workstation was used for mass spectrometry data processing. The MS and MS/MS data information in the positive and negative mode of honeysuckle sample solution were compared and analyzed with reference to standards, literature retrieval and database retrieval. The retention time and peak intensity were combined to identify and confirm the chromatographic peaks, so as to identify the chemical components contained in honeysuckle.
2.6.2 Identification of blood prototypic components from honeysuckle
Mass spectrometry data was processed using the Xcalibur workstation. Chromatograms of honeysuckle sample solution, rat serum samples and blank serum samples were compared. MS and MS/MS data information in positive and negative modes were analyzed by reference to standard substances, literature retrieval and database retrieval. Combined with retention time and peak intensity, the chromatographic peaks were identified and confirmed to identify the prototype components of honeysuckle absorbed into the blood.
2.7 Xanthan gum/starch- based hydrogels preparation
The hydrogels were prepared using free radical polymerization method by varying the amount of polymer, monomer, and crosslinker, as shown in Table 2. The specified amounts of polyvinyl alcohol, xanthan gum, starch, APS/SHS, acrylic acid and EGDMA were carefully weighed before being placed into glass vials. All labeled vials were filled with water and continuously stirred until the solution became clear. A mixture of the labeled solutions was prepared according to the defined mixing order in which PVA was added first to the starch solution, which was then well mixed, followed by its addition to the xanthan gum solution. Then add APS/SHS into acrylic acid and mix evenly before pouring into the xanthan gum-PVA/starch mixture and let it mix evenly with stirring. The resulting mixed homogeneous solution was ultrasonicated and purged with nitrogen for 15 min to remove bubbles. Finally, EGDMA is poured drop by drop into the mixture. The final solution was shifted to a water bath already set at 50 °C and slowly increased the water bath's temperature up to 65 °C. The hydrogels were obtained after 24 h and then cut into 8 to 10 mm discs and dried in vacuum oven at 40 °C for 1 week. Note: The bold letters in the columns shows the increase in the feeding amount in the formulations.
Formulation
PVA (g)
Xanthan gum (g)
Starch (g)
APS/SHS (g)
Acrylic Acid (g)
EGDMA (g)
Drug loaded/0.3 g (g)
V2,s
PXS-1
0.5
0.2
0.3
0.3/0.3
12
1
0.102
0.135
PXS-2
0.5
0.2
0.3
0.3/0.3
12
0.5
0.088
0.146
PXS-3
0.5
0.2
0.3
0.3/0.3
12
1.5
0.049
0.236
PXS-4
1
0.2
0.3
0.3/0.3
12
1
0.074
0.164
PXS-5
2
0.2
0.3
0.3/0.3
12
1
0.079
0.258
PXS-6
1
0.3
0.3
0.3/0.3
12
1
0.083
0.161
PXS-7
1
0.1
0.3
0.3/0.3
12
1
0.060
0.218
PXS-8
1
0.2
0.5
0.3/0.3
12
1
0.082
0.145
PXS-9
1
0.2
0.7
0.3/0.3
12
1
0.092
0.203
No.
tR/min
Ion mode
Expected
Detected
δ /ppm
Formula
MS/MS fragmentation
Identification
1
0.85
[M + H]+
175.1190
175.1194
2.74
C6H14N4O2
158.08232,130.09775,116.07078,70.06510,60.06384
Argininic acid
2
0.89
[M−H]-
191.0561
191.0556
−2.83
C7H12O6
173.00853,128.03519,115.00340,96.96007
Quinic acid
3
1.26
[M + H]+
118.0863
118.0865
1.61
C5H11NO2
59.06760,58.06851
Valine
4
1.36
[M−H]-
180.0666
180.0662
−2.44
C9H11NO3
163.03944,119.04991,93.03464
Tyrosine
5
1.64
[M + H]+
132.1019
132.1020
0.61
C6H13NO2
86.09641,69.06993
l-isoleucine
6
2.6
[M + H]+
166.0863
166.0866
1.99
C9H11NO2
120.08092,103.05435,77.03862,51.01662
Phenylalanine
7
4.47
[M−H]-
205.0718
205.0710
−3.66
C8H14O6
191.01920,187.06093,177.01881,137.02420
4,6-O-Ethylidene-alpha-d-glucose
8
5.00
[M−H]-
353.0878
353.0870
−2.18
C16H18O9
191.05542,179.05577,135.04514,96.96008
Neochlorogenic acid
9
5.53
[M + H]+
377.1442
377.1430
−3.13
C16H24O10
215.09181,179.07072,151.07573,123.08067
Loganic acid
10
5.59
[M + H]+
181.0495
181.0500
2.38
C9H8O4
163.03963,145.03558,135.04451,117.05788,89.00835,63.21408
Caffeic acid
11
5.73
[M−H]-
353.0878
353.0876
−0.74
C16H18O9
706.80560,191.05562,179.03438,135.04501,96.96010
Chlorogenic acid
12
5.87
[M−H]-
389.1089
389.1082
−1.93
C16H22O11
373.11682,352.90778,191.05569,173.04546,116.92847,96.96009
Secologanoside
13
6.09
[M−H]-
193.0506
193.0502
−2.43
C10H10O4
134.03714,178.05070,149.06019
Ferulic acid
14
6.17
[M−H]-
353.0878
353.0870
−2.27
C16H18O9
191.05556,179.05569,135.04489,96.96007
Cryptochlorogenic acid
15
6.23
[M−H]-
373.1140
373.1125
−4.18
C16H22O10
337.87375,193.04970,149.04500
Secologanic acid
16
6.45
[M−H]-
507.1719
507.1734
2.90
C21H32O14
464.90247,447.91412,401.92435,190.92805
6′-O-beta-Glucosylaucubin
17
7.53
[M−H]-
403.1246
403.1233
−3.27
C17H24O11
385.87949,367.91437,357.92191,241.89919
Gardenoside
18
7.57
[M + Na]+
381.1156
381.1168
3.04
C16H22O9
219.17503,149.02365,382.12051,220.05878
Sweroside
19
8.39
[M−H]-
367.1035
367.1034
−0.11
C17H20O9
335.94199,192.06619,173.04494,134.04697,93.00778
3-O-Feruloylquinic acid
20
9.23
[M−H]-
433.1352
433.1359
1.80
C18H26O12
414.91183,403.90591,387.87674,225.06097
d-Glucitol,1,2,3,4,5,6-hexaacetate
21
9.29
[M + Na]+
411.1262
411.1277
3.70
C17H24O10
800.55139,390.89310,338.66925
Vogeloside
22
10.68
[M−H]-
463.0882
463.0871
−2.38
C21H20O12
435.90457,417.89917,284.91772
Quercetin-7-O-beta-d-glucopyranoside
23
10.68
[M−H]-
463.0882
463.0871
−2.38
C21H20O12
926.75177,301.91135,271.11978
Hyperoside
24
10.98
[M−H]-
593.1512
593.1499
−2.17
C27H30O15
447.91345,285.29340
Lonicerin
25
11.56
[M + H]+
177.0546
177.0549
1.41
C10H8O3
149.02351,145.03540,134.06010
7-Methoxycoumarin
26
12.13
[M−H]-
447.0933
447.0930
−0.58
C21H20O11
401.92252,373.91125,239.07648
Cynaroside
27
12.22
[M−H]-
515.1176
515.1186
1.92
C25H24O12
353.04727,335.94318,191.05530
Isochlorogenic acid C
28
12.24
[M−H]-
515.1195
515.1186
−1.77
C25H24O12
353.04727,335.94318,191.05521
Isochlorogenic acid B
29
13.02
[M−H]-
285.0405
285.0402
−0.84
C15H10O6
255.08665,191.07083
Kaempferol
30
13.58
[M−H]-
493.1352
493.1360
1.64
C23H26O12
447.91461,286.80640
2′-O-p-hydroxybenzoylgardoside
31
13.72
[M−H]-
285.0405
285.0393
−3.93
C15H10O6
267.07288,256.95416,199.06018,151.03949,133.01379
Luteolin
32
15.35
[M−H]-
401.0878
401.0869
−2.32
C20H18O9
357.05997,339.18335
Danthron Glucoside
33
15.45
[M−H]-
491.1195
491.1186
−1.91
C23H24O12
313.10522
Tricin 7-O-glucoside
34
15.47
[M + Na]+
471.0898
471.0877
−4.52
C21H20O11
287.16422,270.92056
Quercitrin
35
16.4
[M−H]-
515.1195
515.1201
1.09
C25H24O12
352.91153,335.01767,191.05573
Isochlorogenic acid A
36
17.6
[M + H]+
405.1391
405.1379
−3.04
C17H24O11
243.94196,225.02992,193.04970,151.01076
Secoxyloganin
37
19.58
[M−H]-
415.1246
415.1238
−1.93
C18H24O11
397.25961,335.10165,295.22632,265.14716
2-Hydroxybenzaldehyde-O-[Xylosyl-(1 → 6)-Glucoside]
38
19.61
[M−H]-
533.1301
533.1310
1.73
C25H26O13
515.13116,489.06949,450.29688
Ruberythric acid
39
21.43
[M−H]-
447.0933
447.0930
−0.65
C21H20O11
285.08334,269.08673
Kaempferol 7-O-β-d-glucopyranoside
40
24.15
[M−H]-
595.2913
595.2927
2.35
C34H44O9
564.35486,471.30054
Salannin
41
28.31
[M−H]-
641.0996
641.0967
−4.38
C26H26O19
510.88596,367.91757,353.19965,191.01840,179.05582
3,4-Di-O-caffeoylquinic acid methyl ester
42
28.95
[M−H]-
455.3531
455.3532
0.18
C30H48O3
411.31839,371.86255,116.92840
Oleanic acid
2.7.1 Drug loading
The honeysuckle was loaded into the hydrogels by preparing a 1 % solution of honeysuckle in pH 7.4 buffer and then the dried hydrogels were weighed and place inside the solution and incubated for 3 days. Then the hydrogels discs were taken out and dried at 40 °C for 1 week. The drug loading was determined by subtracting the initial dry weight of hydrogels before drug loading from the final weight of hydrogels after drug loading, as shown in equation (1).
2.8 In-vitro characterization
2.8.1 Fourier transform infrared spectroscopy (FTIR)
FTIR study was conducted to assess the type of bond, structure, and formation of new bonds. FTIR spectra of PVA, xanthan gum, starch, AA, EGDMA, honeysuckle, unloaded and drug-loaded hydrogels were obtained using the attenuated total reflectance FTIR (Spectrum two, Platinum Elmer). FTIR spectra of ground samples were obtained at a wavelength of 4000–400 cm−1.
2.8.2 Thermal analysis (TGA and DSC)
Analyses of pure materials and hydrogels were conducted using a DSC analyzer (Diamond DSC, Perkin Elmer). Heat was applied to the samples at a temperature range between 25 °C and 350 °C at a rate of 10 °C/min, with nitrogen flow remaining constant throughout the study. The experiment was conducted in triplicate, and the data are expressed as means and standard deviations.
Polymers and hydrogels were evaluated for thermal stability with a thermogravimetric analyzer (TG/DTA6300, Seiko, Japan). The sample was accurately weighed (5 mg) and placed in a platinum pan. The analysis was performed at room temperature, and the temperature was maintained at 20 °C per minute until 600 °C of heat was reached under atmospheric nitrogen.
2.8.3 X-ray diffraction (XRD)
The crystalline and amorphous properties of xanthan gum, starch, PVA, and honeysuckle hydrogels were investigated using a TD-3500 X-ray diffractometer (China). A powdered sample was placed in an XRD-sample tray and then XRD was conducted. This test was conducted under the following conditions: irradiation of the target (CuKα), 30 kV of voltage, and 20 mA of current. XRD patterns were acquired by scanning at 2°/minute between 10° and 60°. The data was processed using Jade/MDI software. The crystallinity of the compound was confirmed from peaks, such as sharp intensive peaks in pure materials, whereas diffused peaks in hydrogel samples suggested that the hydrogels are amorphous.
2.8.4 Volume fraction of polymer (V2,s)
Polymer volume fraction (V2,s) indicates the percentage of the polymer in a fully swollen state. Polymer volume fraction was estimated based on equilibrium volume swelling (Veq) data for hydrogel formulations at two different pH values (1.2 and 7.3). This was done by using the following formula.
2.8.5 Scanning electron microscopy (SEM)
SEM (Quanta 250, FEI, Czech) was used to investigate the microstructure, porosity, and morphology of the hydrogels. During this experiment, vacuum-dried samples were fixed to aluminum stubs and sputter-coated with gold, and the surface morphology was observed under 15 kV accelerated current under a cross-sectional view.
2.8.6 Sol–gel study
The sol–gel analysis of all developed formulations was performed in order to determine the soluble and insoluble crosslinking components of the hydrogels. Gel is the insoluble fraction of hydrogels, whereas sol is the soluble fraction. The sol–gel analysis was conducted using a Soxhlet extraction technique. A specific volume of deionized distilled water was added to a round bottom flask containing the hydrogel disc and connected with the condenser. Extraction continued at 85 °C for 14 h. Following extraction, the hydrogel disc was dehydrated in a vacuum oven until completely dry, and then weighed again. The following equations were used to determine the sol–gel analysis.
The weight shown in Y1 is the initial weight of the hydrogels (prior to extraction), whereas the weight shown in Y2 is the final weight of the dried hydrogels (after extraction).
2.8.7 Porosity study
The porosity of all the hydrogels was evaluated and analyzed using a solvent replacement technique. The hydrogel discs (L1) of all the formulations were immersed in absolute ethanol (purity > 99.9 %) for three days. Hydrogel discs were removed after three days, blotted with filter paper to remove excess solvent, and weighed again (L2). Disc thickness and diameter were also measured. Porosity was determined using the given equation.
ρ represents the density of absolute ethanol, while V represents the swelling volume of the hydrogel.
2.8.8 Equilibrium swelling ratio
The equilibrium-swelling ratio (ESR) of hydrogels was measured at pH 1.2 and pH 7.4. Hydrogels were weighed accurately and regularly in order to determine how much their weight had changed over time. Hydrogel weights were recorded until equilibrium was reached. The percentage swelling was calculated by using the following formula.
Where, Wf is the final weight and Wi represents initial weight of hydrogel.
2.8.9 In-vitro drug release and data modeling
Drug release from developed hydrogels was studied in vitro at two pH values, namely pH 1.2 and pH 7.4. Dry discs of hydrogels containing the drug were immersed individually in 900 mL of phosphate buffer solutions at pH 1.2 and 7.4 in a USP dissolution apparatus type II at 37 ± 0.5 °C and 50 revolutions per minute. A 5-ml aliquot was taken at specified intervals and replenished with a fresh medium of the same volume to maintain sink conditions. After the samples were collected, they were filtered and analyzed using a UV–vis spectrophotometer (T6 New Century; Beijing GM) at λmax of 324 nm (standard chlorogenic acid) in triplicate.
Release of drugs from a hydrogel matrix is affected by a number of factors, including polymer chain relaxation and swellability, matrix composition, type of drug, and pH of the release medium. Because hydrogels exhibit controlled swelling, solvent diffusion is necessary in order to cause hydrogel swelling. Models of zero order, first order, Higuchi and Korsmeyer Peppas were used to predict drug release patterns.
2.8.10 Statistical analysis
The data was analyzed using ANOVA method to determine the significant differences. A (p-value of less than 0.05) was considered significant. The data is presented as mean ± standard deviation.
3 Results and discussion
3.1 UPLC-LTQ-Orbitrap-MS chromatogram acquisition
In this study, the UPLC-LTQ-Orbitrap-MS method was successfully developed for the detection of honeysuckle-containing serum. A qualitative analysis of honeysuckle sample solution, blank serum (Figure S1), and rat serum after oral gavage with honeysuckle decoction (aqueous extract) was conducted in both positive and negative ion modes, as shown in Fig. 1. A total of 80 compounds were identified in the honeysuckle (Table S1). The chromatograms and related information about the reference substances are shown in Table S2, Figure S2 and Figure S3.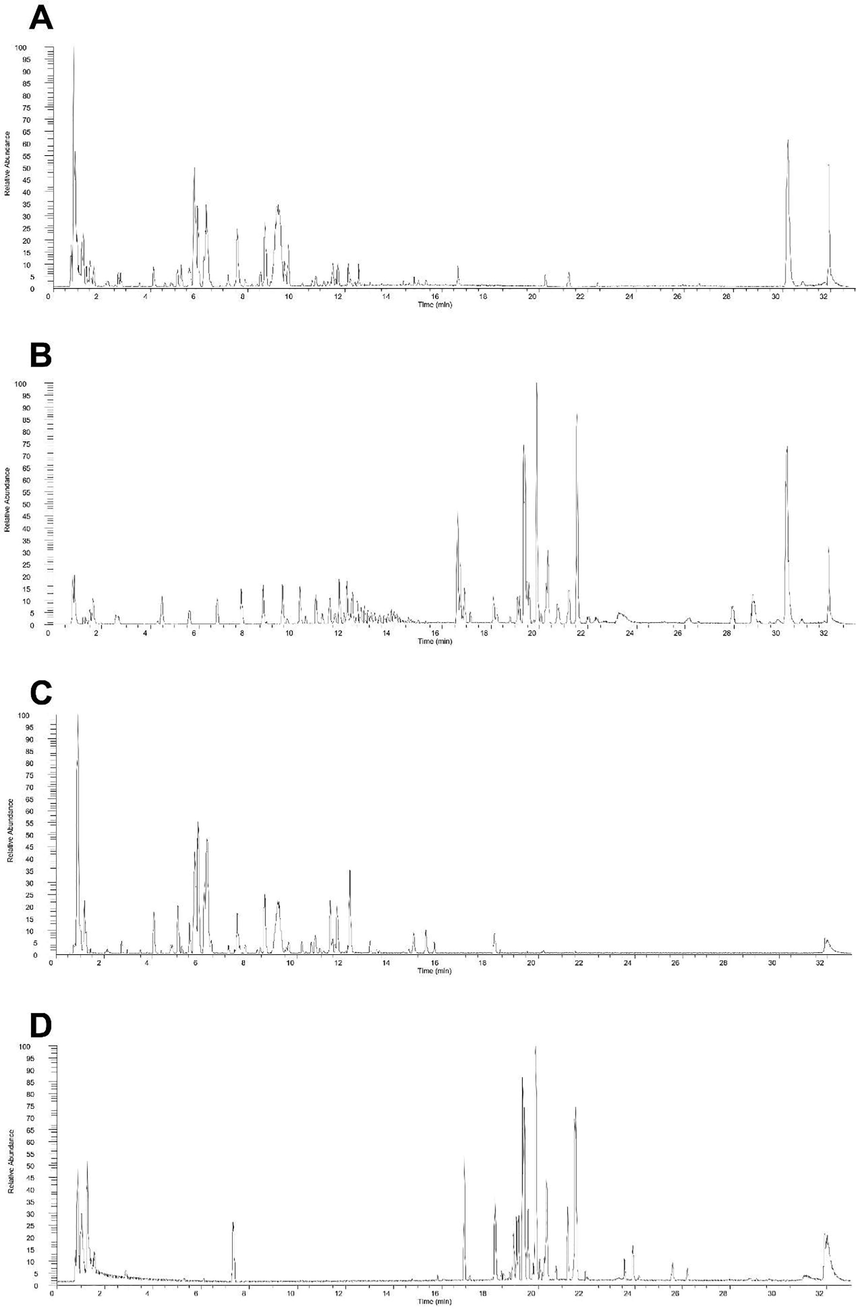
The total ion chromatograms of components of honeysuckle in positive ionization mode in vitro (A) and in vivo (B). The ion chromatograms in negative ionization mode in vitro (C) and in vivo (D).
The UPLC-LTQ-Orbitrap high-resolution mass spectrometry system is able to simultaneously acquire both parent and product ionic information in a relatively short period of time, resulting in accurate identification of compounds. Based on the molecular formulas and analyses of samples in both positive and negative ion modes, we can obtain more information about the honeysuckle components absorbed into the blood. The advantages of this method over traditional mass spectrometry include higher resolution and sensitivity, which can be useful in clarifying scientific concerns.
3.2 Analysis of components of honeysuckle absorbed into the blood
UPLC-Q-Orbitrap-MS was used to compare the spectra obtained from blank serum and drug-containing serum, in order to determine the components that get absorbed into the blood. The molecular ion peaks and secondary fragment peaks of the chemical components [12–17] were compared with various chemical databases, such as MassBank 2.1.6 [18], HMDB 4.0 [19], PubChem [20], and structural analyses were performed to determine the composition of the compounds. Our comprehensive analysis revealed that only 42 of the 80 chemical components of honeysuckle enter the blood after oral administration of honeysuckle solution to rats, as shown in Table 1. After analyzing the results, it was found that the main components absorbed into the blood were flavonoids, organic acids, iridoids and other types of compounds.
As a commonly used traditional Chinese medicine, honeysuckle exhibits a variety of pharmacological effects and has high medicinal value. After the rats were administered honeysuckle extract, the mass spectrometry information of the serum at 60-, 80-, and 100-minutes post-administration was investigated, and the peaks of the chromatogram were compared. The optimal collection time after gavage was determined to be 80 min based on peak intensity and peak number. Based on the comparison between the chromatograms and mass spectra of honeysuckle sample solution, drug-containing serum, and blank serum, 42 prototype components of honeysuckle were detected which enter the blood, mostly flavonoids, organic acids, and iridoids. Among these compounds, chlorogenic acid compounds represent the majority of honeysuckle's composition. Furthermore, it shows that these substances account for the main medicinal effects of honeysuckle plants in vivo. Studies have also shown that chlorogenic acid compounds have antibacterial, antiviral, and antitumor properties. A number of pharmacological effects have been observed including anti-oxidation, anti-inflammatory, and treatment of metabolic disorders [26], resulting from the removal of intracellular ROS, inhibition of p38 cascade phosphorylation, and activation of the nuclear factor kappa-βeta (NF-kβ) signaling pathway. As a result, it inhibits the production of interleukin-8 (IL-8), thus contributing to anti-inflammatory effects [27].
3.3 Mass spectrometry analysis of the main chromatographic peaks of honeysuckle components absorbed into the blood
The current study characterized and identified 42 components that entered the bloodstream, all of which were prototypes.
3.3.1 Flavonoids
Flavonoids undergo a series of cleavage, loss and rearrangement reactions centered on the C ring. Most of the free flavonoids have molecular ion peaks [M] + as base peaks, [M−H]+, [M−CO] + and RDA. Fragment ion peaks generated by fragmentation are important peaks, which can determine the type of aglycone and the type and number of substituents on the A, B, and C rings. Flavonoid glycosides are classified into flavonoid C glycosides and flavonoid O-glycosides due to the difference in the glycoside bond atoms connecting to the sugar group being C atom and O atom. The flavonoid C-glycosides are mainly cleaved by the cross-ring excision of the sugar ring, and almost no aglycone ions are produced; the cleavage of the flavonoid O-glycosides is mainly based on the cleavage of the glycosidic bond, the cleavage of the sugar-sugar bond and the cross-ring excision and cleavage of the sugar ring [21].
Taking compound No. 31 as an example, the quasi-molecular ion peak was detected as m/z 285.0393[M-H]- in the negative ion mode. The software Xcalibur 2.1 was used to analyze its elemental composition and deduce its possible molecular formula as C15H10O6. In mass spectrometry, quasi-molecular ions are more likely to lose H2O and CO to generate fragment ions m/z 267.07288 ([C15H8O5]-) and m/z 256.95416 ([C14H10O5]-), respectively. As a result of fragment ions 151.03949 ([C7H4O4]-), and 133.01379 ([C8H6O2]-) combined with relevant references [22], compound No. 31 was identified as luteolin. Its MS spectrum and its possible cleavage pathway is shown in Fig. 2.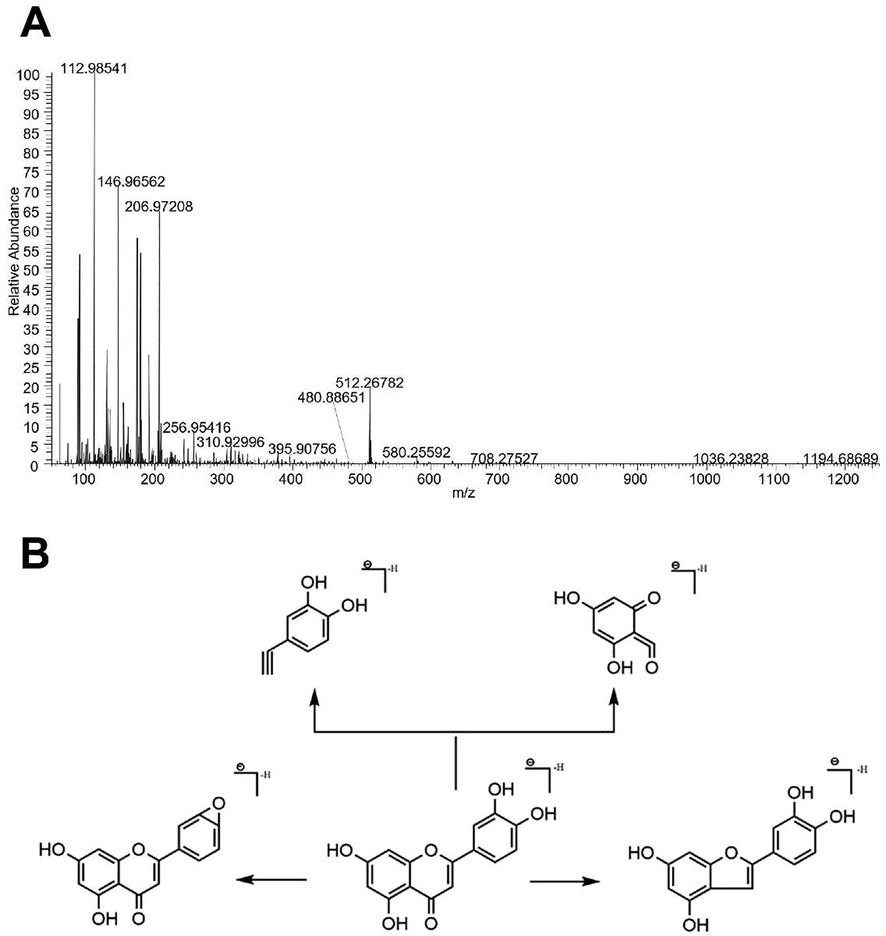
MS spectrum (A) and the possible cleavage pathway (B) of luteolin.
3.3.2 Organic acid components
The basic structures of these compounds are aromatic rings substituted with phenolic hydroxyl groups, fatty acids, etc., which are easily broken at the carbonyl group to form fragment ions [23]. Among them, chlorogenic acid compounds have ester groups in their structures. In mass spectrometry, the ester groups are easily broken to form fragment ions with a smaller mass-to-nucleus ratio and higher abundance than the parent ion. Fragment ions of [M−H2O]- and [M−CO2]- appeared in secondary mass spectrometry [24].
Taking compound No. 11 as an example, the quasi-molecular ion peak was detected as m/z 353.0876 [M−H]- in the negative ion mode, and its possible molecular formula was deduced to be C16H18O9. In its secondary mass spectrometry, the quasi-molecular ion removed 1 molecule of caffeoyl group and 1 molecule of quinacyl group respectively and generated fragment ions like quinic acid ion (m/z1 91.05562) and caffeic acid ion (m/z 179.03438), and after comparing with the reference substances, it is inferred that compound No. 11 is chlorogenic acid. Its secondary mass spectrum and its possible cleavage pathway are shown in Fig. 3.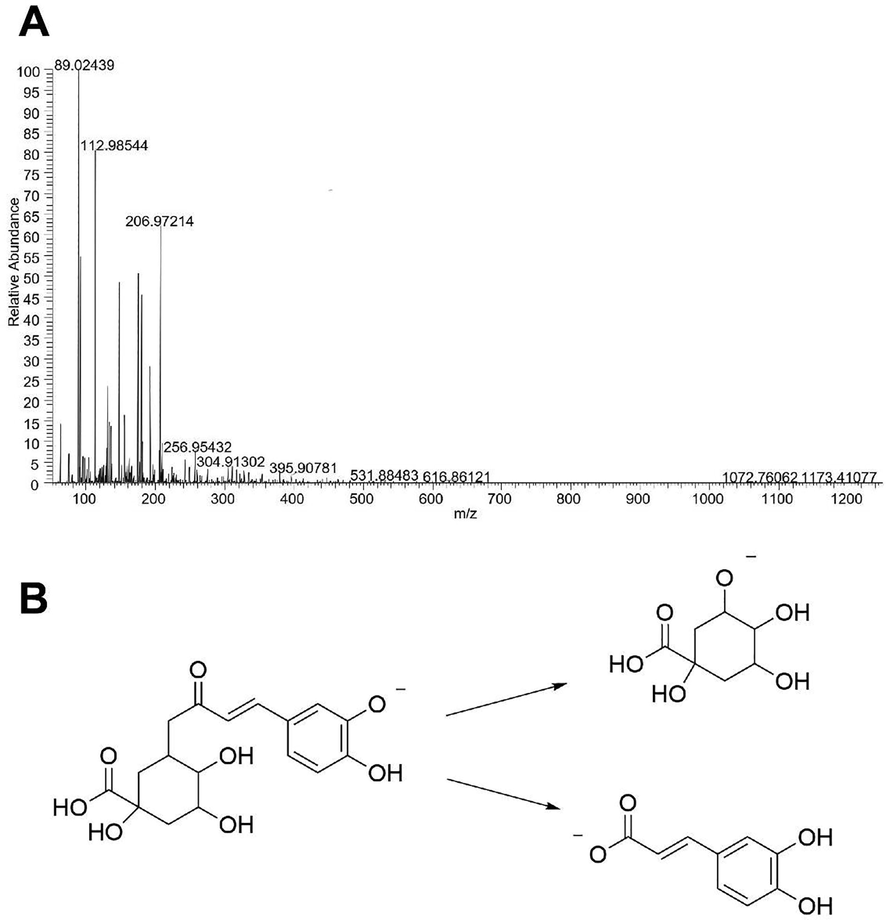
Secondary mass spectrum (A) of Chlorogenic acid and its proposed fragmentation pathway (B).
Taking compound No. 10 as an example, the quasi-molecular ion peak was detected as m/z 181.05 [M + H] + in positive ion mode, and its possible molecular formula was deduced to be C9H8O4. In the secondary mass spectrometry, the fragment ion was m/z 163.03963, and it is speculated that the quasi-molecular ion should be obtained by removing [M + H-COOH] +. The m/z 135.04451 indicates that [M + H-H2O-CO] + is removed from the parent ion, and based on a comparison of its spectrum to that of the reference substance, it has been deduced that compound No. 10 is caffeic acid, and its MS spectrum and possible cleavage pathway are depicted in Fig. 4.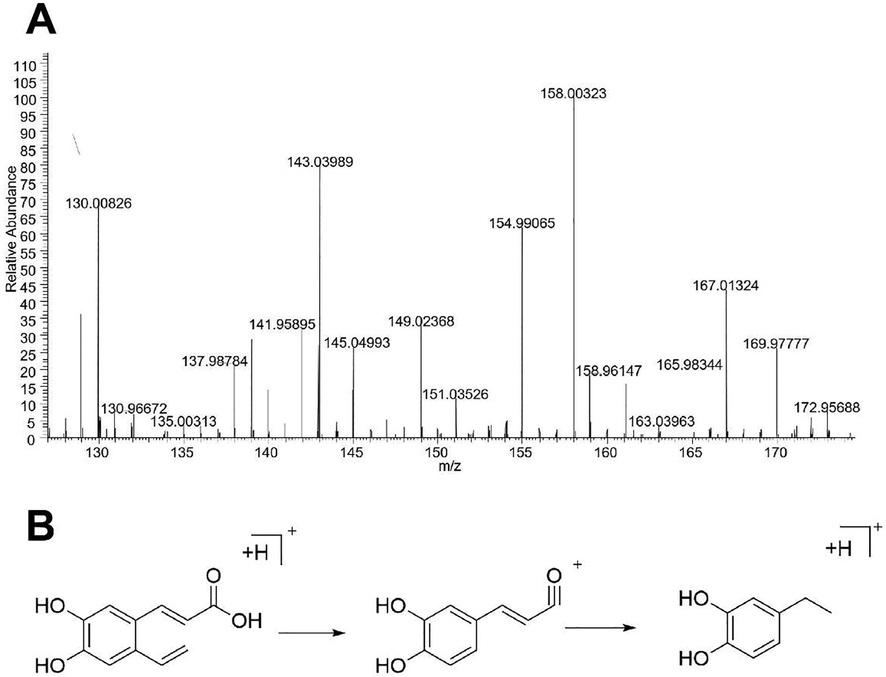
Secondary mass spectrum (A) of caffeic acid and its proposed fragmentation pathway (B).
3.3.3 Iridoid components
The primary spectrum of iridoids in positive ion mode commonly contains [M + H]+, [2 M + H]+, [M + Na]+, and [2 M + Na] + ions, as well as sometimes [M + K]+, and [2 M + K] + ion peaks. The negative ion mode is characterized by [M−H]- and its dimer [2 M−H]-. An iridoid glycoside quasimolecular ion or its adducted molecular ion is used as a parent ion in the positive or negative ion mode. The MS/MS cleavage is characterized by the loss of neutral molecules, such as CO2, H2O, Glc, etc., and some substituents, with the sequence of cleavage relating to the parental nucleus or side chains [25].
Taking compound No. 36 as an example, the [2 M + H]+, [2 M + Na]+, and [M + H] + in positive ion mass spectrometry were analyzed, and the quasi-molecular ion peak was detected at m/z 405.1379 [M + H]+, and its possible molecular formula is deduced to be C17H24O11. Based on the secondary mass spectrometry results of the fragment ion at m/z 243.94196, it is speculated that the quasi-molecular ion is formed by the removal of [M + H-Glc]+, based on the reference [17], so a comparison with the reference substance indicates that compound No. 36 is deoxyloganin. The results show that UPLC-LTQ-Orbitrap-MS can quickly and systematically analyze the components of honeysuckle into the blood, and it suggests that the components directly absorbed into the blood may be the medicinal substances of honeysuckle, which lays the foundation for the subsequent determination of honeysuckle quality markers. basis, so as to realize the quality control of honeysuckle.
3.4 Hydrogels characterization
3.4.1 FTIR analysis
The preparation of xanthan gum/starch based-(PVA-co-AA) hydrogels was confirmed by evaluating the FTIR spectra of xanthan gum, starch, PVA, AA, honeysuckle and developed hydrogels, as shown in Fig. 5A. FTIR spectrum of xanthan gum showed stretching vibration of C — O of primary alcohols and asymmetrical stretching of carboxylate ions by peaks at 1011 and 1598 cm−1, respectively. Starch showed peaks at 3270, 2917 and 987 cm−1°indicating stretching vibration of the O—H, C—H, and C—O groups, respectively (Sethi et al., 2020). The characteristic peaks of PVA appeared at 3281, 2907, 1709 and 1234 cm−1, which were assigned to stretching vibration of O—H, CH2 asymmetric stretching, C⚌O carbonyl stretching, and C—H deformation, respectively (Kharazmi et al., 2015). Similarly, FTIR spectra of AA showed peaks at 2983, 1690, and 1427 cm−1, which were assigned to stretching vibration of C—H, C—O, C⚌O, and deformation of C—O—H (Liew et al., 2016). FTIR spectra of EGDMA showed peaks at 1722, 937, and 809 cm−1, which were assigned to the stretching vibration of C—O, and waging and twisting bands of = CH2, respectively (Barkat et al., 2021). The crosslinking of polymers and monomers and the chemical interaction among the contents of hydrogel led to changes in the peak distribution of certain polymers and monomers. The prominent peaks of xanthan gum were changed from 1011 and 1598 cm−1 to 1152 and 1690 cm−1 peaks in the synthesized hydrogels. Similarly, a few peaks of AA and starch were moved from 2983 and 1235 cm−1 and 987 to the 2915 and 1132 cm−1 and 1152 cm−1 peaks in the developed hydrogel network. Some of the peaks of xanthan gum, PVA, AA, and starch disappeared, while certain new peaks appeared. Thus, shifting peaks, disappearances, and the formation of new peaks indicated that AA, starch, and PVA were successfully grafted onto the backbone of xanthan gum, producing a new polymeric network. The FTIR spectral analysis of honeysuckle revealed stretching vibration of O—H and N—H, C—H, C⚌O, C⚌C, and C—N by peaks at 3289, 2905, 1683, 1585, and 1034 cm − 1, respectively (Zhang et al., 2022). Drug-loaded hydrogels showed a fluctuation in certain peaks of honeysuckle. The peaks at 2905 and 1585 cm−1 were moved to 2916 and 1570 cm−1 peaks of the drug-loaded hydrogel. Due to the successful loading of the drug into the hydrogel, there was no chemical interaction observed between honeysuckle peaks and hydrogel components.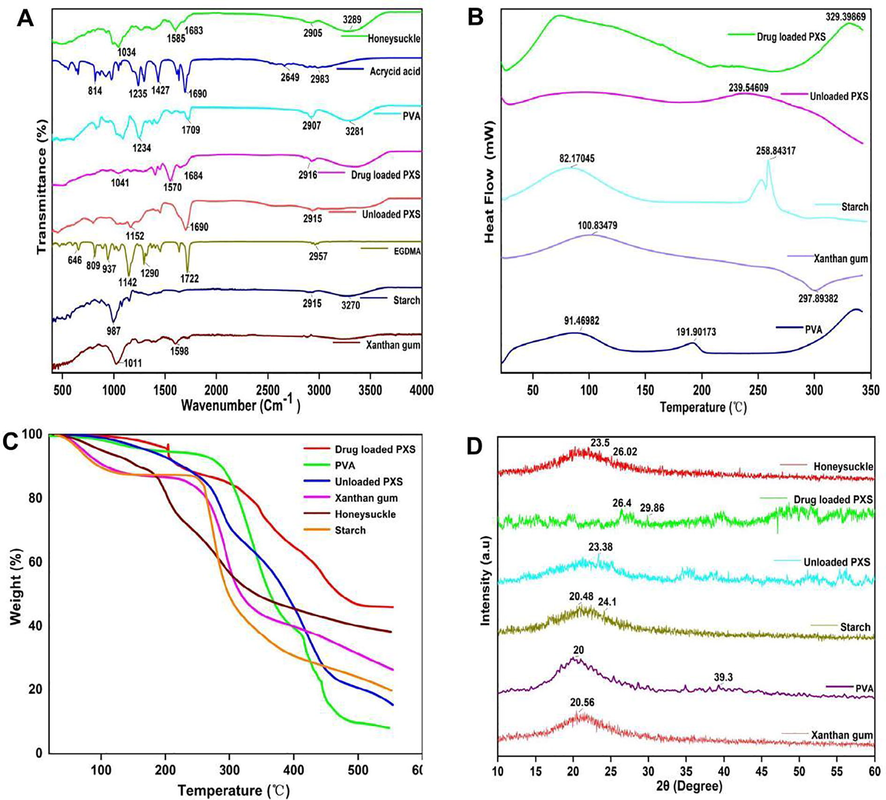
FTIR (A), DSC (B), TGA (C) and XRD (D) of the pure materials and developed hydrogels.
3.4.2 Thermal analysis
Polymers and hydrogels were tested for thermal stability using a DSC analysis, as shown in Fig. 5B. Xanthan gum shows an endothermic peak at 100 °C (melting) and an exothermic peak at 297 °C (degradation). Starch shows an endothermic peak at 82 ℃ (initial moisture loss) and exothermic peak at 258 ℃ (melting and decomposition of the polymer). The endothermic peak of PVA occurs at 91 °C (glass transition and moisture loss) and a sharp peak at 191 °C (melting of the polymer), while the endothermic peak of the unloaded hydrogels occurs at 100 °C (evaporation of water) and the second endothermic peak occurs at 239 °C (onset of degradation of the gel network). This is in line with previous studies which demonstrate a highly stable polymeric gel network (Shalviri et al., 2010).
The thermogravimetric analysis of xanthan gum, starch, PVA, and XG/starch-based (PVA-co-AA) hydrogels was carried out to determine the thermal stability of the developed hydrogels. The initial weight loss of starch at 97 °C was found to be 10 % as a result of the release of moisture and volatile matter absorbed by the starch. Weight loss was observed in two steps, and was found to be 60 % and 81 % at 335 °C and 551 °C, respectively, indicating that the initial weight loss was much greater than the final weight loss of starch. The initial weight loss of xanthan gum was estimated to be approximately 14 % due to the release of moisture and volatile matter at 178 °C. Afterwards, a two-step decomposition process occurred, with a first-stage weight loss of 60 % occurring in the temperature range of 214–297 °C and a second-stage weight loss of 74 % occurring in the range of 326–550 °C. When PVA was heated to 288.5 °C, it lost 10.3 % of its weight, which indicates that the bound water had been lost. As the temperature increased, the weight of the PVA decreased further, and when the temperature reached 363.8 °C, the PVA weight was reduced by 50.2 %, demonstrating that the PVA had been continuously degraded with increased temperature. The honeysuckle loaded XG/starch-based (PVA-co-AA) hydrogels showed an initial weight loss of approximately 4 % at 203 °C. This may be explained by the loss of hydroxyl groups and the removal of absorbed and bonded moisture. Approximately 18 % of the weight was lost during the first stage of decomposition at 316 °C. Afterwards, there was a further decomposition of approximately 54 % weight loss at 553 °C, which resulted from fragmentation of side chains and the polymer infrastructure, producing carbonaceous residues. As a result of chemical and physical interactions between different polymer constituents, hydrogel shows a lower thermal decomposition rate than starch, xanthan gum, and PVA. As a result of the formation of a dense cross-linked structure within the hydrogel, its resistance to thermal decomposition was enhanced (Lemos et al., 2021). Decomposition of the hydrogel generally occurred at a higher temperature than the decomposition of its basic components. As a result of the above discussion, it was concluded that the cross-linked hydrogel is more thermally stable than pure polymers (Fig. 5C). We found that XG/starch-based hydrogels (PVA-co-AA) were comparable in thermal stability to xanthan gum-based hydrogels previously reported in the literature (Sethi et al., 2020).
3.4.3 X-ray diffraction analysis
XRD analysis was used to evaluate the physical properties of xanthan gum, starch, PVA, and the developed hydrogel, as shown in Fig. 5D. Compounds that exhibit sharp and highly intense peaks are usually described as having a crystalline nature, while compounds exhibiting diffuse peaks are described as having an amorphous nature. Xanthan gum exhibited a broad and amorphous peak at 2θ = 20.50°. Due to its amorphous nature, xanthan gum aggregates with other side chains, making packaging polymers difficult. The XRD analysis of starch revealed both crystalline and amorphous peaks at 2θ = 20.48°, and 24.1°, indicating that the starch possesses a semi-crystalline structure. PVA is a semicrystalline material with hydrogen bonds between its OH groups that enable it to interlink its chains. XRD analysis of PVA revealed prominent peaks at 2θ = 20° and 39.3°. XRD analysis of honeysuckle revealed prominent peaks at 2θ = 23.5° and 26.02°. XRD analysis of the developed hydrogel matrix indicated that the crystalline and intense peaks of xanthan gum, PVA and starch had been reduced or disappeared as a result of crosslinking and grafting. The results demonstrate that crosslinking, grafting, and polymerization of hydrogel contents reduced crystallinity of pure reagents and replaced sharp peaks with low-intensity peaks, showing successful crosslinking, grafting, and polymerization. Our findings are consistent with those reported in the literature, which also demonstrated that fabricated hydrogels have a decreased crystallinity (Luo et al., 2021).
3.4.4 Polymer volume fraction
Table 1 shows the polymer volume fraction determined at pH 7.4 for the developed hydrogels. A significant effect was observed in the polymer volume fraction due to the contents of the hydrogel, such as xanthan gum, starch, PVA, and EGDMA. The volume fraction of polymers decreased with increasing polymer composition. I.e., xanthan gum, PVA, and starch. Due to high concentrations of monomers and polymers, the hydrogel swells significantly, which is the main cause of this phenomenon. In contrast to the polymer and monomers, with the increase in composition of EGDMA, the polymer volume fraction increased due to low swelling in hydrogels. The high swelling index of the hydrogel was indicated by low and high polymer volumes.
3.4.5 Scanning electron microscopy
SEM was used to examine the morphology and surface properties of the synthesized hydrogels, as illustrated in Fig. 6 (A, B, and C). The SEM analysis of the hydrogel formulation revealed an irregular porous surface with a hard texture. This is due to the partial collapse of gel during the process of dehydration, which is evident from the presence of large cracks and wrinkles on the surface. Hydrogels with hard and porous surfaces demonstrate strong interactions between their components after polymerization.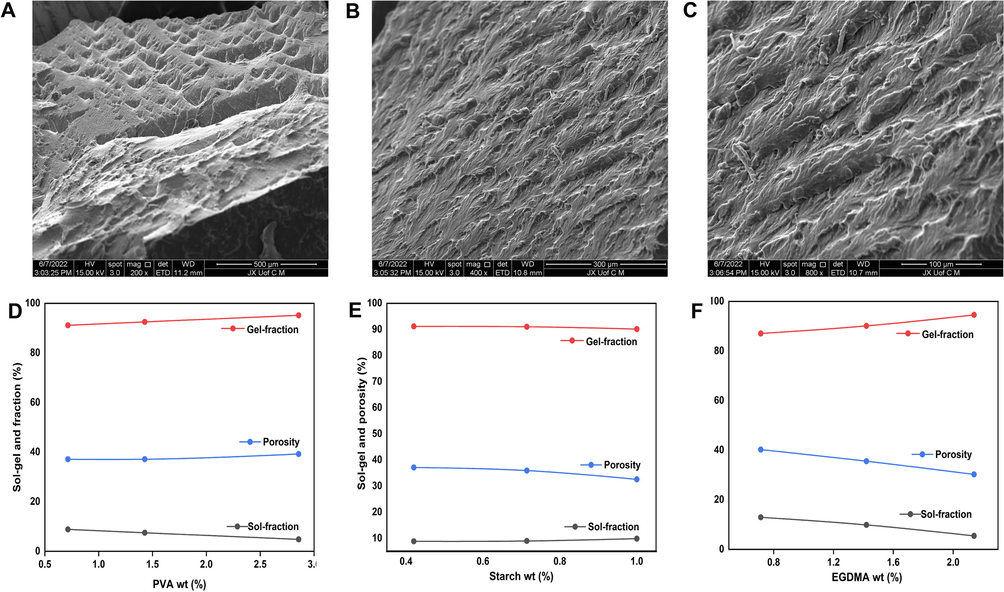
Scanning electron microscopic images of the developed hydrogels at 200 X (A), 400 X (B), and 800 X(C). The effect of the concentration of the feeding components on the porosity and sol–gel fraction, such as PVA (D), Starch (E) and crosslinker EGDMA (F).
3.4.6 Sol gel analysis
Sol represents the uncrosslinked soluble fraction of hydrogel, while gel represents the crosslinked insoluble fraction. Since the gel and sol fractions have an inverse relationship, an increase in one causes a decrease in the other, as shown in Fig. 6 D–F. The concentrations of different hydrogel contents, such as PVA, starch, and EGDMA, had a significant impact on both the sol and gel fractions. By increasing the feed ratio of PVA, there was an increase in the gel fraction. This result could be attributed to the increase in the number of free radicals generated by increasing PVA feed ratios, which were highly reactive. As a result, a higher concentration of PVA will result in more free radicals being generated for polymerization and cross-linking of hydrogel contents, resulting in a greater content of gel. In contrast to PVA, the gel fraction decreased with the increase in starch content and had an unfavorable effect on gelation. Hydrogel bulk and crosslinking densities increased as the EGDMA feed ratio increased. As a result of the high crosslinking of the hydrogel, the pore size decreased, and the gel fraction increased. A higher polymer, monomer, and crosslinker feed ratio was associated with an increase in gel fraction, as stated by Khanum and her colleagues (Khanum et al., 2018). This finding supports our hypothesis. The sol fraction decreased with an increase in PVA feed ratio, unlike the gel fraction and vice versa for EGDMA.
3.4.7 Porosity study
The porosity of all formulations of Xanthan gum/starch-based (PVA-co-AA) hydrogels was evaluated. In the present study, the primary objective was to assess the ability of fluids to penetrate the pores of hydrogel networks. The porosity of the reaction mixture was affected by the various combinations of hydrogel contents. Fig. 6D and 6F indicate that porosity increased with increasing PVA composition. This may be caused by the highly viscous nature of the reaction mixture formed after the hydrogel materials were polymerized. Increasing the concentration of PVA in the mixture resulted in the formation of a highly viscous mixture, which prevented bubbles from evaporating. As a result, interconnected channels were formed, increasing the porosity of the hydrogel. Porosity decreased as the feed ratio of EGDMA and starch was increased, contrary to what was observed for the PVA. As the concentration of EGDMA increased, porosity decreased as a result of the formation of high crosslinked bulk networks of hydrogel, which reduced the size of the pores in the developed hydrogel. Thus, there were fewer channels, resulting in lower penetration and porosity. In conclusion, higher porosity results in greater swelling and higher drug loading.
3.4.8 Swelling study
As shown in Fig. 7 (A and C), swelling studies were conducted on xanthan gum/starch-based (PVA-co-AA) hydrogels to determine their response to pH levels of 1.2, and 7.4. Swelling was almost negligible at pH 1.2 in comparison with pH 7, which indicates the hydrogel's pH sensitivity. Protonation and deprotonation of the –COOH groups of the polymers and monomers are responsible for the low and high swelling of the prepared hydrogel. When –COOH groups were protonated, conjugates were generated with counterions by strong hydrogen bonding, causing the charge density of the –COOH groups to decrease, resulting in a reduction in pore size and low swelling at pH 1.2. When the pH was increased from 1.2 to 7.4, there was a noticeable difference in the swelling of the synthesized hydrogel. During alkaline conditions, carboxyl groups ionize, which results in electrostatic attraction between –COO- groups, thus forming loose network structures that are able to accommodate a large volume of water. Moreover, polysaccharides contain hydroxyl groups that may also deprotonate in alkaline conditions, resulting in greater swelling (Hua et al., 2020). Therefore, fabricated hydrogels showed swelling in the order of pH 7.4 > 1.2. Different combinations of xanthan gum, starch, PVA, and EGDMA affected the swelling of formulated hydrogels. An increase in the polymer and crosslinker content resulted in an increase in swelling. Initial increases in xanthan gum concentration resulted in an increase in swelling ratio due to its hydrophilicity and anionic properties, but the swelling ratio decreased as xanthan gum concentration was increased further. As the concentration of xanthan gum is increased, the amount of network space that is available for water is reduced, thus decreasing the swelling capacity of the formulation. A reduction in swelling of hydrogel was observed with the increasing concentration of EGDMA, contrary to what was observed for the polymers (Thombare et al., 2018). The polymeric hydrogel's pore size decreased as the crosslinking and bulk density were increased, resulting in a decrease in the penetration of water into the formulated hydrogel. With an increase in composition, EGDMA developed a harder network and had a decrease in water penetration, which led to a decrease in swelling as the composition increased. Other polysaccharide hydrogels showed similar results in alkaline media (Gholamali 2021).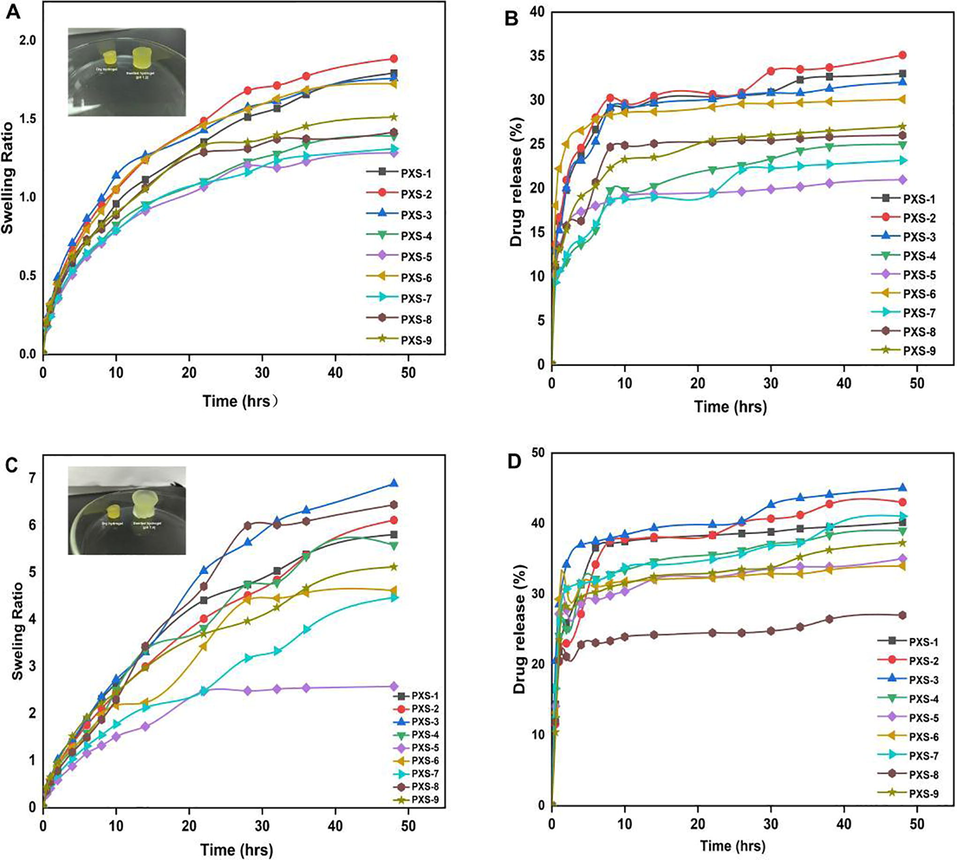
PXS hydrogels swelling at pH 1.2 (A), drug release at pH 1.2 (B), swelling at pH 7.4 (C), and drug release at pH 7.4 (D).
3.4.9 Drug release and kinetics modelling
In vitro drug release studies were conducted using a xanthan gum/starch-based (PVA-co-AA) hydrogel at two pH values, namely pH 1.2 and pH 7.4 (Fig. 7B and D). The maximum amount of drug was released at pH 7.4 compared to pH 1.2, which was attributed to the pH-sensitive swelling behavior described above. There was also protonation and deprotonation of COOH groups of monomers, resulting in low and high levels of drug release from the fabricated hydrogel. At pH 7.4, deprotonation increased the charge density of COOH groups substantially (Cortes et al., 2020). At pH 7,4 due to the high charge density, the attractive force between COOH groups decreased and the repulsive force increased, resulting in increased swelling and drug release. The protonation of monomers at pH 1.2, however, led to the formation of conjugates with counterions, leading to the strengthening of the polymeric structure of the hydrogel through hydrogen bonding. The strong hydrogen bonding resulted in a low amount of swelling, resulting in a low amount of drug release. In a similar manner to swelling, drug release was also affected by the combination of polymers and crosslinkers. The incorporation of xanthan gum, starch, and PVA increased the rate of drug release. The release of drugs decreased as the composition of EGDMA increased. The reason for this is the crosslinking and hardness of the hydrogel, which both inhibit water penetration through the small pores, leading to a decrease in the release of the drug (Akhtar et al., 2015). Our results demonstrate that hydrogel remains protonated/unionized at low pH values of 1.2 as a result of the pKa values of its reagents, resulting in low swelling and drug release. Deprotonation and ionization of the polymer and monomer functional groups occurred as the pH increased from 1.2 to 7.4, causing the hydrogel networks to expand, leading to an increase in swelling and drug release.
The best fit release kinetic model was determined based on in vitro drug release data for all formulations by modeling zero order, first order, Higuchi, and Korsmeyer-Peppas models (Table 3). According to the r2 and n values, the best-fit model and drug release mechanism are confirmed. The “r2″ value indicates the regression coefficient. The ”r2″ values of Korsmeyer-Peppas model for all formulations of the fabricated hydrogel are closer to 1 compared with other kinetic models, which indicates that this was the best fit model. Furthermore, the type of diffusion is determined by the value of “n”. Whenever “n” > 0.45, the diffusion is non-Fickian, while when “n” ≤ 0.45, the diffusion is Fickian. The Fickian diffusion was observed in all formulations with n values ranging from 0.084 to 0.222 (Emam and Shaheen 2022).
F. Codes
pH
Zero Order
First Order
Higuchi Model
Korsmeyer-Peppas Model
Ko (h-1)
r2
K1 (h-1)
r2
K2 (h-1)
r2
r2
n
PXS-1
1.2
1.027
0.7104
0.016
0.7524
6.328
0.8554
0.9807
0.166
7.4
1.274
0.6498
0.019
0.7017
7.913
0.8099
0.9625
0.152
PXS-2
1.2
1.068
0.7230
0.014
0.7574
6.563
0.8617
0.9825
0.167
7.4
1.328
0.7388
0.020
0.7893
8.121
0.8772
0.9708
0.199
PXS-3
1.2
1.004
0.6958
0.013
0.7322
6.197
0.8461
0.9766
0.164
7.4
1.387
0.6495
0.022
0.6939
8.612
0.7916
0.9822
0.119
PXS-4
1.2
0.755
0.8244
0.009
0.8456
4.554
0.9325
0.9907
0.222
7.4
1.209
0.6824
0.017
07,237
7.468
0.8270
0.9696
0.153
PXS-5
1.2
0.658
0.6228
0.008
0.6420
4.103
0.774
0.9839
0.114
7.4
1.094
0.6095
0.015
0.6429
6.816
0.7558
0.9644
0.110
PXS-6
1.2
0.971
0.5455
0.013
0.5770
6.105
0.7083
0.9871
0.084
7.4
1.083
0.5005
0.015
0.5338
6.828
0.6595
0.9303
0.086
PXS-7
1.2
0.706
0.7965
0.008
0.8164
4.289
0.9140
0.9932
0.198
7.4
1.224
0.6700
0.018
0.7025
7.567
0.8024
0.9773
0.124
PXS-8
1.2
0.830
0.6954
0.010
0.7255
5.121
0.8456
0.9691
0.168
7.4
0.833
0.5869
0.010
0.6088
5.204
0.7351
0.9678
0.099
PXS-9
1.2
0.840
0.7477
0.011
0.7751
5.148
0.8834
0.9913
0.176
7.4
1.135
0.6554
0.016
0.6896
7.025
0.7973
0.9540
0.142
4 Conclusions
UPLC-LTQ-Orbitrap-MS technology was employed in this study to analyze the chemical constituents of honeysuckle, as well as serum pharmacokinetics. According to the results, a total of 80 components were found in vitro but in vivo analysis showed that only 42 of the active components of honeysuckle were absorbed into the bloodstream, which can pave the way for the determination of the quality markers of honeysuckle. Furthermore, free radical polymerization technique was successfully applied to produce hydrogels for controlled drug delivery of honeysuckle. The structural configuration of the hydrogel and its contents were evaluated using FTIR analysis. According to DSC and TGA thermograms, xanthan gum, PVA, and starch have less thermal stability than formulated hydrogels. XRD analysis revealed that xanthan gum, PVA, and starch exhibit a decrease in crystallinity and sharp peaks after crosslinking. SEM also revealed a hard and porous surface. The fabricated hydrogel is pH-responsive, as swelling and drug release are higher at pH 7.4 than pH 1.2.. Increased incorporation of PVA and xanthan gum increased gel fraction, swelling, drug loading, and drug release, while increasing inclusion of EGDMA decreased these characteristics. Sol fractions dropped as hydrogel compositions increased, whereas gel fractions increased. A lower percentage of polymer volume fractions was observed at pH 1.2 and a higher percentage at pH 7.4, indicating that there is maximum swelling capability of the developed hydrogel at high pH values. Therefore, we can conclude from the discussion that grafted hydrogels could be used for controlled delivery of honeysuckle extract.
CRediT authorship contribution statement
Zhenzhong Zang: Data curation, Investigation, Writing – original draft, Methodology. Shichun Zhao: Data curation. Ming Yang: Supervision. Chengqun Yu: Data curation. Hui Ouyang: Formal analysis. Lihua Chen: Visualization. Weifeng Zhu: Project administration, Resources. Zheng-gen Liao: Supervision, Writing – original draft. Abid Naeem: Investigation, Writing – original draft, Methodology, Writing – review & editing. Yongmei Guan: Writing – review & editing, Resources.
Acknowledgement
This study was supported by the National Natural Science Foundation of China, (grant no.82060722), Chinese Medicine Preparation Technology and Equipment Innovation Team, China (CXTD22006), Key Research and Development Innovation Method Special Project, China (2020IM010500), and Science and Technology Research Project of Jiangxi Provincial Department of Education, China (GJJ201230).
Declaration of Competing Interest
The authors declare that they have no known competing financial interests or personal relationships that could have appeared to influence the work reported in this paper.
References
- Effect of ethylene glycol dimethacrylate on swelling and on metformin hydrochloride release behavior of chemically crosslinked pH–sensitive acrylic acid–polyvinyl alcohol hydrogel. DARU J. Pharm. Sci.. 2015;23:1-10.
- [Google Scholar]
- Understanding mechanical characteristics of pH-responsive PEG 4000-based polymeric network for colorectal carcinoma: its acute oral toxicity study. Polym. Bull.. 2021;78:5075-5101.
- [Google Scholar]
- Supramolecular engineering of hydrogels for drug delivery. Adv. Drug Deliv. Rev.. 2021;171:240-256.
- [Google Scholar]
- Investigation on spectrum-effect correlation between constituents absorbed into blood and bioactivities of Baizhu shaoyao san before and after processing on ulcerative colitis rats by UHPLC/Q-TOF-MS/MS coupled with gray correlation analysis. Molecules. 2019;24:940.
- [Google Scholar]
- Identification and characterization of potential antioxidant components in Isodon amethystoides (Benth.) Hara tea leaves by UPLC-LTQ-Orbitrap-MS. Food Chem. Toxicol.. 2021;148:111961
- [Google Scholar]
- Design of a dual pH and temperature responsive hydrogel based on esterified cellulose nanocrystals for potential drug release. Carbohydr. Polym.. 2022;278:118925
- [Google Scholar]
- Development of controlled delivery functional systems by microencapsulation of different extracts of plants: Hypericum perforatum L., Salvia officinalis L. and Syzygium aromaticum. Food Bioprocess Technol.. 2021;14:1503-1517.
- [CrossRef] [Google Scholar]
- An orthogonal experimental design and QuEChERS based UFLC-MS/MS for multi-pesticides and human exposure risk assessment in Honeysuckle. Ind. Crops Prod.. 2021;164:113384
- [Google Scholar]
- Stimuli-responsive polysaccharide hydrogels for biomedical applications: a review. Regener. Eng. Transl. Med.. 2021;7:91-114.
- [Google Scholar]
- A novel xanthan gum-based conductive hydrogel with excellent mechanical, biocompatible, and self-healing performances. Carbohydr. Polym.. 2020;247:116743
- [Google Scholar]
- Chitosan/poly vinyl alcohol/graphene oxide based pH-responsive composite hydrogel films: drug release, anti-microbial and cell viability studies. Polymers. 2021;13:3124.
- [Google Scholar]
- Fabrication and in vitro characterization of HPMC-g-poly (AMPS) hydrogels loaded with loxoprofen sodium. Int. J. Biol. Macromol.. 2018;120:1624-1631.
- [Google Scholar]
- Structural, optical, opto-thermal and thermal properties of ZnS–PVA nanofluids synthesized through a radiolytic approach. Beilstein J. Nanotechnol.. 2015;6:529-536.
- [Google Scholar]
- Starch chemical modifications applied to drug delivery systems: From fundamentals to FDA-approved raw materials. Int. J. Biol. Macromol.. 2021;184:218-234.
- [Google Scholar]
- Quality standard of traditional Chinese medicines: comparison between European Pharmacopoeia and Chinese Pharmacopoeia and recent advances. Chinese Medicine.. 2020;15:1-20.
- [Google Scholar]
- Quality markers of traditional Chinese medicine: concept, progress, and perspective. Engineering. 2019;5:888-894.
- [Google Scholar]
- Poly (acrylic acid)–based hybrid inorganic–organic electrolytes membrane for electrical double layer capacitors application. Polymers. 2016;8:179.
- [Google Scholar]
- Construction of porous starch-based hydrogel via regulating the ratio of amylopectin/amylose for enhanced water-retention. Molecules. 2021;26:3999.
- [Google Scholar]
- Self-crosslinked chitosan/dialdehyde xanthan gum blended hypromellose hydrogel for the controlled delivery of ampicillin, minocycline and rifampicin. Int. J. Biol. Macromol.. 2021;167:1468-1478.
- [Google Scholar]
- Release kinetic studies of <i>Stevia rebaudiana</i> extract capsules from sodium Alginate and Inulin by Ionotropic Gelation. Adv. Mater. Sci. Eng.. 2018;2018:6354924.
- [CrossRef] [Google Scholar]
- Cross-linked xanthan gum–starch hydrogels as promising materials for controlled drug delivery. Cellulose. 2020;27:4565-4589.
- [Google Scholar]
- Novel modified starch–xanthan gum hydrogels for controlled drug delivery: synthesis and characterization. Carbohydr. Polym.. 2010;79:898-907.
- [Google Scholar]
- Lonicera japonica Thunb.: ethnopharmacology, phytochemistry and pharmacology of an important traditional Chinese medicine. J. Ethnopharmacol.. 2011;138:1-21.
- [Google Scholar]
- Design and development of guar gum based novel, superabsorbent and moisture retaining hydrogels for agricultural applications. Carbohydr. Polym.. 2018;185:169-178.
- [Google Scholar]
- TIAN, S., M.-s. MIAO, W.-z. XIONG, et al., 2021. Analysis on External Function and Application of Medicinal Materials and Decoction Pieces in 2020 Edition of Chinese Pharmacopoeia (Volume 1). Chinese Journal of Experimental Traditional Medical Formulae. 161-167.
- Hydrogels as drug delivery systems: a review of current characterization and evaluation techniques. Pharmaceutics. 2020;12:1188.
- [Google Scholar]
- An ethnoveterinary study on medicinal plants used by the Buyi people in Southwest Guizhou, China. J. Ethnobiol. Ethnomed.. 2020;16:1-20.
- [Google Scholar]
- Approaches to establish Q-markers for the quality standards of traditional Chinese medicines. Acta Pharm. Sin. B. 2017;7:439-446.
- [Google Scholar]
- Zhang, Y.-C., J. Deng, X.-L. Lin, et al., 2022. Use of ATR-FTIR Spectroscopy and Chemometrics for the Variation of Active Components in Different Harvesting Periods of Lonicera japonica. International Journal of Analytical Chemistry. 2022,
- Research progress of active ingredients and pharmacological action of honeysuckle. Animal Husbandry Feed Sci.. 2014;6:22.
- [Google Scholar]
- Identification and attribution of chemical constituents of Qingfei Paidu Decoction based on UHPLC-LTQ-Orbitrap-MS technology. Zhongguo Zhong yao za zhi= Zhongguo Zhongyao Zazhi= China. J. Chinese Mater. Med.. 2020;45:3035-3044.
- [Google Scholar]
Appendix A
Supplementary material
The following are the supplementary materials: Table S1. Analysis of chemical components of Honeysuckle (in vitro) in both positive and negative ionization modes. Figure S1. Ion chromatograms of blank plasma in positive mode (A) and negative mode (B). Table S2. Analysis of reference substances used in the study. Figure S2. Reference compounds chromatograms: chlorogenic acid (A), isochlorogenic acid A (B), isochlorogenic acid C (C), neochlorogenic acid (D), strychnic acid (E). While small letter (a) represents chromatograms and (b) shows its mass spectrum. Figure S3. Reference compounds chromatograms: luteoloside (A), isoquercitin (B), lonicidin (C), rutin (D), strychnoside (E). While small letter (a) represents chromatograms and (b) shows its mass spectrum. Supplementary data to this article can be found online at https://doi.org/10.1016/j.arabjc.2022.104312.
Appendix A
Supplementary material
The following are the Supplementary data to this article:Supplementary data 1
Supplementary data 1


