

Translate this page into:
BoxCar data-dependent acquisition improves the MS/MS coverage in liquid chromatography-mass spectrometry-based metabolomics analysis
⁎Corresponding author at: Jilin Ginseng Academy, Changchun University of Chinese Medicine. wang.yang1986@hotmail.com (Yang Wang) wangyang@ccucm.edu.cn (Yang Wang)
-
Received: ,
Accepted: ,
This article was originally published by Elsevier and was migrated to Scientific Scholar after the change of Publisher.
Peer review under responsibility of King Saud University.
Abstract
Tandem mass spectrometry (MS2) information is always applied for compound identification or annotation in liquid chromatography-mass spectrometry (LC-MS)-based untargeted metabolomics study. Due to the complex chemical composition of the biological sample, acquiring MS2 spectra that cover all components is still challenging. Data-dependent acquisition (DDA) is commonly applied to obtain the MS2 data, but intensity-based trigger criteria restrict low abundance ions for fragmentation. BoxCar DDA was introduced on an LC- quadrupole time of flight (Q-TOF) MS in this study to improve the MS2 coverage of conventional DDA. BoxCar DDA with sub-mass ranges of 50, 25, and 10 was applied to perform sample analysis, respectively. The performance of multi-parallel collision-induced dissociation MS (MSe), DDA, and BoxCar DDA was compared. The results showed BoxCar DDA significantly increased the MS2 coverage and improved the signal quality. The MS2 coverage increased with the reduction of the sub-mass range. BoxCar (10) DDA exhibited the highest coverage of MS2 information. The signal quality acquired from DDA is better than that obtained under MSe, and the BoxCar (10) also showed superior for ions with low intensity. The plant material of gross saponin of Tribulus Terrestris L. fruit (GSTTF) was detected using the established BoxCar DDA, and the informative MS2 data was used to perform compound identification. The newly developed BoxCar DDA method could provide comprehensive MS2 data of analyte, which will not only be helpful to increase the confidence of compound identification in untargeted metabolomics but also facilitate ion pair detection in pseudotargeted analysis.
Keywords
Mass spectrometry
Data dependent acquisition
BoxCar DDA
Metabolomics
MS2 coverage

1 Introduction
LC-MS-based metabolomics has been widely applied in numerous research fields, and metabolite identification or annotation is always a challenge(Wang et al., 2015). Recent studies have provided powerful tools for improving metabolite identification (Blaženović et al., 2018, Chaleckis et al., 2019, Misra 2021). The depth and breadth of acquired data are prerequisites for confident identification when using those tools. The accurate m/z and isotope distribution obtained by high-resolution MS enable molecular formula prediction. MS2 information further improves the confidence of metabolite identification. MS2 analysis in metabolomics can be achieved using data-dependent acquisition (DDA) (Defossez et al., 2023) or data-independent acquisition (DIA) (Kitata et al., 2022). Both methods are able to obtain MS and MS2 data in one injection, and they also have their inherent merits and limitations. DDA selects TopN intense ions to trigger MS2 acquisition, which gives a clear linkage between precursor and corresponding product ions but reduces the MS2 coverage. DIA theoretically fragments all ions detected in full scan, greatly improving the detect coverage. However, the mixed MS2 spectra obtained from DIA make it challenging to construct the relation between MS and MS2 information.
An increasing number of studies have been conducted to improve MS2 data acquisition. Reducing the co-eluted ions is the most commonly used strategy in both DDA and DIA. For DDA, a reduced precursor number increases the probability of being selected for fragmentation, which enhances its MS2 detection coverage. By splitting the m/z range into several intervals, gas-phase fractionation (GPF) DDA was successfully applied in LC-MS-based metabolomics and lipidomics to increase the amount of MS2 information (Calderón-Santiago et al., 2014, Nazari and Muddiman 2016). Another approach is setting up a pre-filtering step to highlight the true precursors for subsequent DDA analysis. A precursor-directed DDA method using scheduled precursor lists was developed to trigger the features of interest to MS2 analysis without considering their signal intensity (Hoffmann et al., 2014). Wang et al. further enhance the MS2 detection coverage of DDA using the target inclusion list with a time-staggered precursor ion list (Wang et al., 2017). For DIA, the latest progress in data acquisition or data analysis is constantly improving the quality of MS2 spectra. The sequential window acquisition of all theoretical fragment ion spectra MS (SWATH-MS) was developed in 2012, which used a series of precursor isolation windows (e.g., 25 Da) over a wide m/z range, and obtained relatively clear MS2 spectra (Gillet et al., 2012). Then more narrow isolation window (4 Da) with random window selection termed multiplex MS (MSX) DIA was established on a Q-Orbitrap MS to further improve the precursor selectivity and signal quality (Egertson et al., 2013). Besides, the SONAR acquisition mode constantly scans ions over the entire precursor mass range using a 20 Da window width swiped with a 2 Da increment in the Q-TOF MS, which also ameliorated the signal quality (Moseley et al., 2018).
A new data acquisition strategy called BoxCar was recently established to achieve in-depth proteome profiling on a Q-Orbitrap MS, in which the whole m/z range was decomposed into several narrow segments to achieve better sensitivity, increased spectral quality and extended dynamic range for complex samples in shotgun proteomics analysis (Meier et al., 2018). This novel acquisition method and its derivatized approach, like BoxCarmax, have been applied for the in-depth profiling of proteomes from cell and urine samples (Salovska et al., 2021, Sinitcyn et al., 2021). Since BoxCar was merely involved in the metabolomics analysis, we proposed a BoxCar DDA acquisition on a Q-TOF MS instrument for small molecule detection in this study. Different BoxCar sub-mass ranges were used to perform sample analysis. Then the comparison among MSe, DDA, and BoxCar DDA was conducted, and this method was successfully applied to the analysis of the gross saponin of Tribulus Terrestris L. fruit (GSTTF). This method will provide an alternative way to acquire metabolomics data, expand the metabolite detection coverage, and increase confidence in metabolite annotation.
2 Material and methods
2.1 Chemicals
Both acetonitrile and methanol in HPLC grade were purchased from Fisher Scientific (Fair Lawn, NJ, USA). HPLC grade of formic acid was obtained from Sigma-Aldrich (St. Louis, MO, USA). Ultra-pure water was prepared by a Milli-Q system (Millipore, Bedford, MA, USA). The gross saponin of Tribulus Terrestris L. fruit (GSTTF) was Changbaishan Pharmaceutical Co. Ltd. (Jilin, China).
2.2 LC-MS condition
The GSTTF solution at 1 mg/mL was prepared by mixing 5 mg GSTTF with 5 mL 70% methol aqueous solution. After being filtered by a syringe filter (0.22 μm), the filtrate was analyzed by an ultra high performance LC (UHPLC)-Q-TOF MS.
The LC separation was performed on an ACQUITY BEH C18 column (50 mm × 2.1 mm i.d., 1.7 μm) at 35 ℃ using a Waters ACQUITY™ UHPLC system (Waters Corp., Manchester, UK). The mobile phase consisted of ultra-pure water (A) and acetonitrile containing 0.1% formic acid (B). The injection volume was 5 μL. The gradient program was set as follows: 10%-30% B (0–10 min); 30%-85% B (10–15 min); 85%-10% B (15–16 min); 10% B (10–20 min). The flow rate was set at 0.4 mL/min. The elution was introduced in a SYNAPT G2Si Q-TOF MS equipped with an electrospray ionization (ESI) source (Waters Corp., Manchester, UK). The key parameters of the ESI source were set as follows: the capillary voltage was + 3.0 kV or –2.5 kV; source temperature was 150 ℃; sample cone voltage was 40 V; desolvation temperature was 500 ℃; nitrogen gas flow was 900 L/h; and cone gas flow was 50 L/h. The m/z range of mass spectra was set to m/z 100 to 1500.
As shown in Fig. 1, three MS acquisition modes were applied to analyze GSTTF respectively. For MSe, the continuum spectrum was acquired with a scan time of 0.3 s. The low energy of 3 V was used for MS1 detection, and a ramped high energy from 30 to 60 V was applied for MS2 analysis. For DDA, the fast-DDA function was utilized with the following settings: MS1 spectra were acquired at a scan time of 0.3 s, followed by MS/MS spectra acquisition at a scan time of 0.1 s. The top 10 most intense ions were selected for MS/MS acquisition. The collision energy was set to a ramp of 30–60 V for MS/MS acquisition. The precursors were moved to an exclusion list for 20 s. The BoxCar DDA was conducted by introducing two, four, and ten BoxCar injections with fourteen boxes each, and the detailed BoxCar scan design is shown in Table S1. Except for the above settings, all other conditions for the three acquisition methods were consistent. Before MS analysis, the MS was calibrated using sodium formate (5 mM). The lock spray setup was conducted to ensure the real-time calibration using leucine-enkephalin solution (200 ng/mL), which generates the reference ion of [M + H]+ = 556.2771 or [M−H]– = 554.2615 during analysis.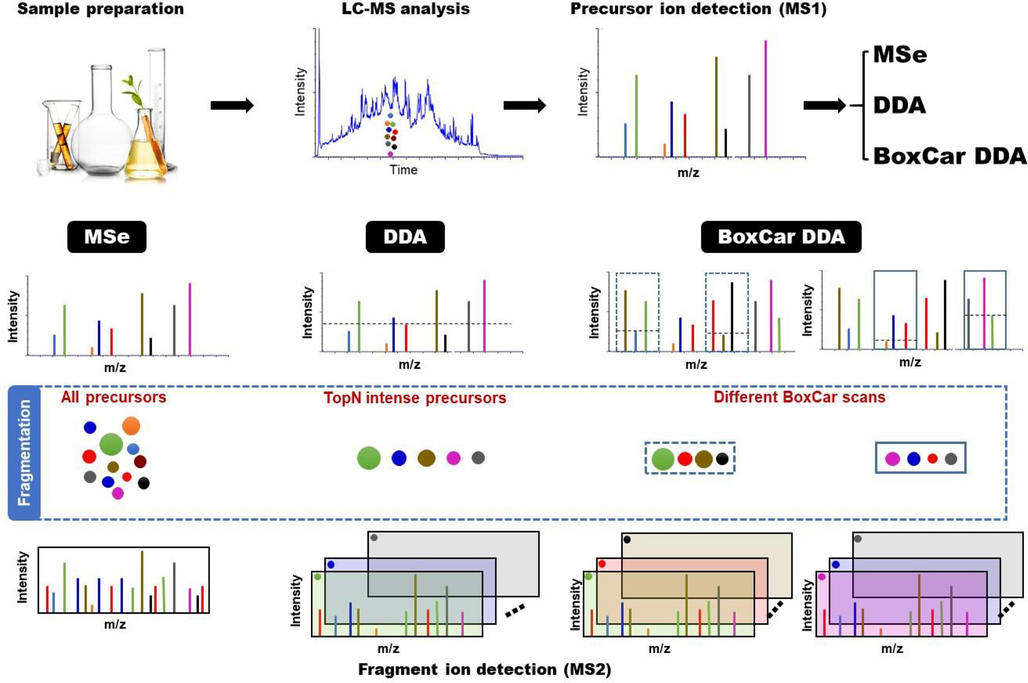
The workflow of this study.
2.3 Data analysis
The MSe raw data was processed by Progenesis QI software (Nonlinear Dynamics, Newcastle, UK) to generate the ion dataset. The adduct definition used in the experiment was [M + H]+, [M + Na]+, [M + H–H2O]+ in positive ion mode, and [M−H]–, [M + HCOO]–, [M−H−H2O]– in negative ion mode. Other parameters of Progenesis QI were default values. DDA tool was used to extract the precursor and related product ions of DDA and BoxCar DDA analysis. The compound annotation was conducted by comparing the accurate m/z and MS2 information with the records in databases and published literature.
3 Results
3.1 Establishment of BoxCar DDA method in LC-Q-TOF MS
BoxCar was initially established on a Q-Orbtirap MS instrument to achieve in-depth proteome coverage by Mann et al. (Meier et al., 2018). The whole analysis was divided into several segments, each containing the multiple narrow m/z range of equal intervals. Compared with the conventional MS1 analysis, the mean ion injection time of the BoxCar acquisition strategy is increased more than ten times, which will further benefit the MS2 data collection. This developed strategy can only be utilized on several Q-Orbitrap instruments, e.g., Q Exactive HF and HF-X systems. In this study, we aimed to transfer this approach from a Q-Orbitrap MS to a Q-TOF MS by using the DDA inclusion list. There are two options for the DDA inclusion list: “inclusion from file” and “inclusion from range”. Then narrow sub-mass ranges of BoxCar were input in “inclusion from range” for DDA analysis. Due to instrument design differences, only one MS scan event can be added in the method editor in an analytical run. Thus, different BoxCar scans needed to be conducted in separate injections. As listed in Table S1, BoxCar scans with different sub-mass ranges were used for MS analysis. The narrow sub-mass range was applied, the more injections were needed to complete the DDA analysis. There are 2, 4, and 10 injections contained in the BoxCar DDA with the sub-mass range of 50, 25, and 10, respectively. After finishing all the injections, the whole m/z range was covered.
3.2 LC-MS profiling of GSTTF
The GSTTF sample was analyzed by LC-Q-TOF MS under MSe, DDA, and BoxCar DDA mode. The base peak chromatograms (BPCs) obtained from a full scan are shown in Fig. 2A and B, in which numerous peaks from GSTTF are well separated within 18 min. After data preprocessing, a total of 7128 and 11,100 features were extracted from the raw data obtained from the GSTTF sample under positive and negative ion modes, respectively. The uneven distribution of these features was observed in Fig. 2C and D. The high co-eluted areas were mainly concentrated in the retention time (RT) range of 2–5 min and 7–15 min. A large number of co-eluted ions means that several ions cannot be selected as targets for fragmentation during DDA acquisition, which results in the data loss of some interest features. Therefore, it is necessary to develop a method for comprehensive detection of MS2 information.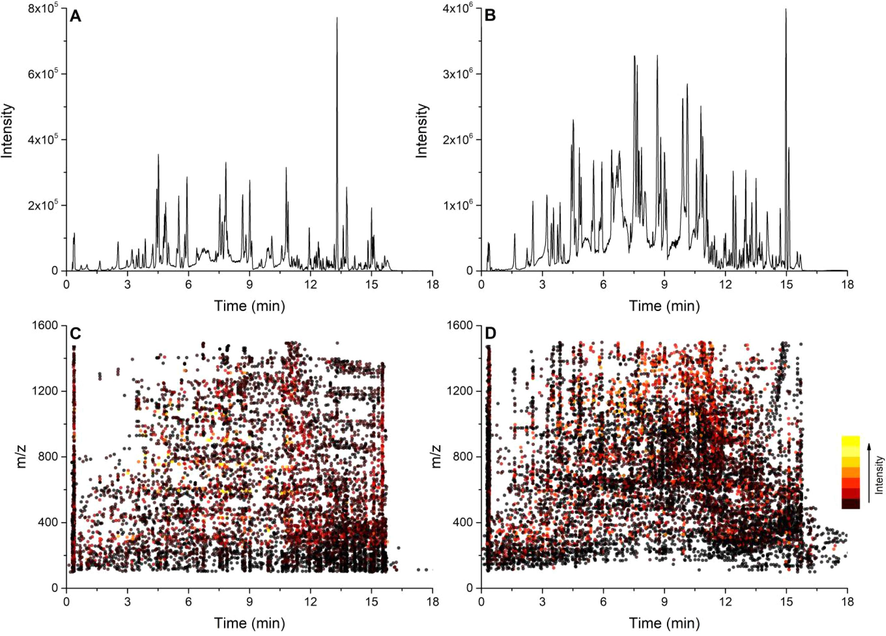
The representative base peak chromatography of the GSTTF sample obtained by full scan in positive (A) and negative (B) ion mode; and the ion distribution in positive (C) and negative (D) ion mode.
3.3 MS2 coverage of BoxCar DDA
In this study, the MS2 data were obtained using conventional MSe, DDA, and BoxCar DDA with three different sub-mass ranges. As shown in Fig. 2, more than seven thousand features were extracted from the LC-MS raw data. It will be a time-consuming process if we manually inspect all these target ions. To simplify the process, we randomly selected 225 and 350 representing ions from positive and negative ion modes to compare the performance of different acquisition methods. As shown in Fig. S1, the distribution of these representing ions covered different RT and intensity in both positive and negative ion modes. The performance of data acquisition methods was evaluated by checking how many of those selected ions obtained MS2 spectra using three methods. The results were displayed in the form of MS2 coverage. As shown in Fig. 3A, the MS2 coverage of DDA was 53.3% and 48.9% in positive and negative ion modes, respectively. When the BoxCar DDA was applied, the percentage increased to 69.3% and 66% with the sub-mass range of 50. With the further reduction of the sub-mass range, the MS2 coverage was increased significantly. The highest MS2 coverage of 87.1% and 88.6% in positive and negative ion modes were acquired with the sub-mass range of 10.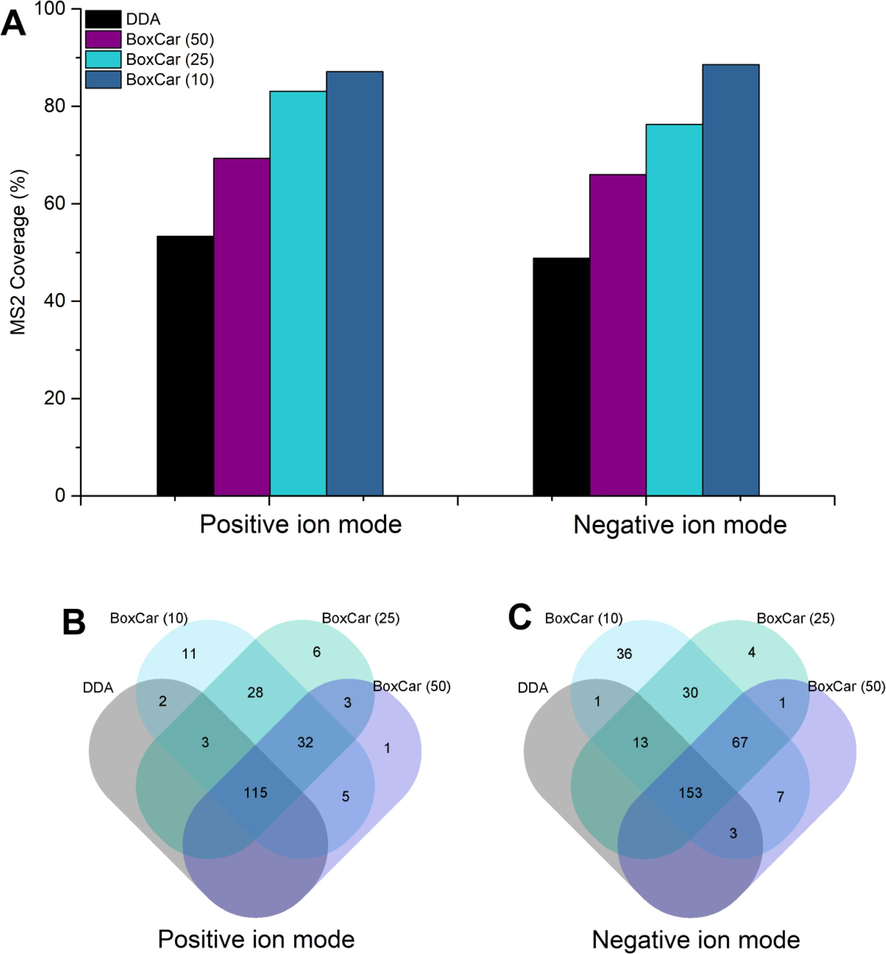
MS2 coverage of selected ions using DDA and BoxCar DDA methods (A), and Venn diagrams showing the common and unique ions triggered by different methods in positive (B) and negative (C) ion modes.
A Venn diagram was constructed to exhibit the detailed information of each method. As shown in Fig. 3B–C, 115 and 153 ions can be selected as precursors for fragmentation by using three methods in positive and negative ion modes, respectively. However, 11 (positive) and 36 (negative) ions can only be fragmented using BoxCar DDA with a sub-mass range of 10. The results indicated that the BoxCar DDA has superior performance on the MS2 spectra acquisition, and the increased detection coverage could be obtained by narrowing down the sub-mass range.
3.4 The quality of MS2 spectra
The compound identification always relies on the MS2 spectra quality of the interest features. During the DDA analysis, the main factor affecting the detection coverage is the huge number of co-eluted ions in a period of time. The BoxCar strategies, using the relatively narrow sub-mass range, significantly reduce the number of co-eluted ions. The distributions of the selected represent ions are shown in Fig. 4, in which we can observe the number of co-eluted ions in a certain period of time. The high co-elution zone for the ions detected in positive ion mode was around RT 12.5–13.5 min and RT 13.5–14.5 min, which have 31 and 28 ions, respectively (Fig. 4A). The insert panel displayed the trigger rate of different methods for the co-eluted ions. The trigger rate refers to the percentage of ions that were selected as precursors to conduct MS2 analysis in all co-eluted ions. In the positive ion mode (Fig. 4A), the lowest trigger rates of 45% and 61% were obtained by the conventional DDA for both co-eluted areas. When using BoxCar DDA strategies, the trigger rate was gradually improved. The highest percentage of 84% and 82% were generated with the help of the BoxCar (10) method. In the negative ion mode (Fig. 4B), the high co-eluted area, containing 38 (RT 12.5–13.5 min) and 34 (RT 12.5–13.5 min) ions, were selected to evaluate the trigger rate of different methods. Up to 58% and 54% of ions were not fragmented, which was significantly decreased when using BoxCar DDA approaches. The data obtained by BoxCar (10) showed the lowest number of signals without MS2 data.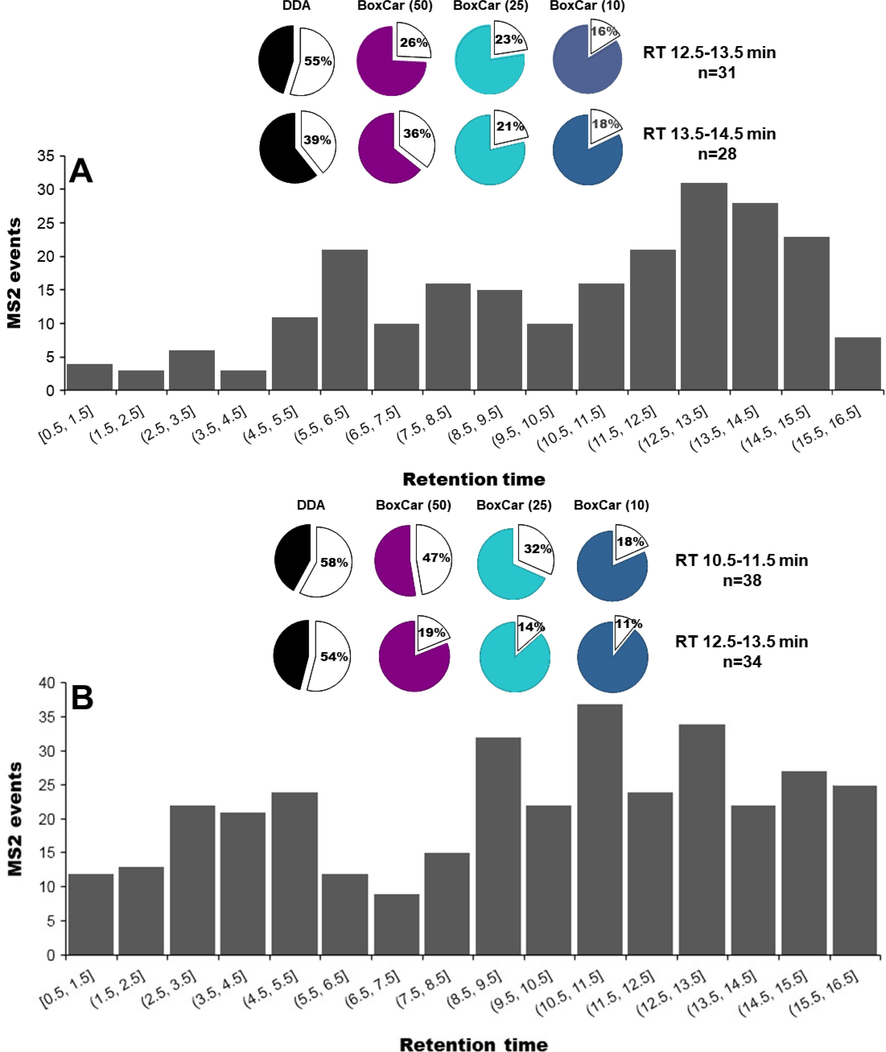
The histogram plot shows the distribution of MS2 events based on the selected ions in positive (A) and negative (B) ion modes. The insert panel indicates the trigger rate of each method, and the blank sectors are the percentage of ions without MS2 spectra.
The MSe acquisition is a type of DIA method that can obtain all MS2 spectra in a period of RT. The MS2 spectra acquired by MSe and DDA were compared to evaluate the performance of different methods, especially for the ions in highly co-eluted areas. As shown in Fig. 5A, the full scan MS spectra at RT 12.25 min showed that several peaks with different signal responses were co-eluted. Therefore, when the MSe was performed to obtain the MS2 spectrum (Fig. 5B), we could not assign the product ions to their corresponding precursors. The MS2 spectra from DDA analysis could establish a clear linkage between fragments and related precursors. Fig. 5C-E shows the MS2 spectra of ions at m/z 623.3843, m/z 799.4072, and 1265.5460. Compared with the MS2 spectrum from MSe, we can observe that the signals at m/z 753.4030 and m/z 591.3573 were from the precursor of m/z 799.4072; and the signals at m/z 1087.4939 and m/z 1219.5354 were the product ions of m/z 1265.5460. In the case of the ion with low abundance, the BoxCar DDA exhibited superiority to the conventional DDA. As shown in Fig. 6A, the ion at RT 12.30_m/z 1168.6871 with the intensity of 1.6 × 10³ was covered up by other signals, which cannot be selected for fragmentation analysis. This ion was successfully triggered using the BoxCar (10) method to obtain the MS2 spectrum (Fig. 6B).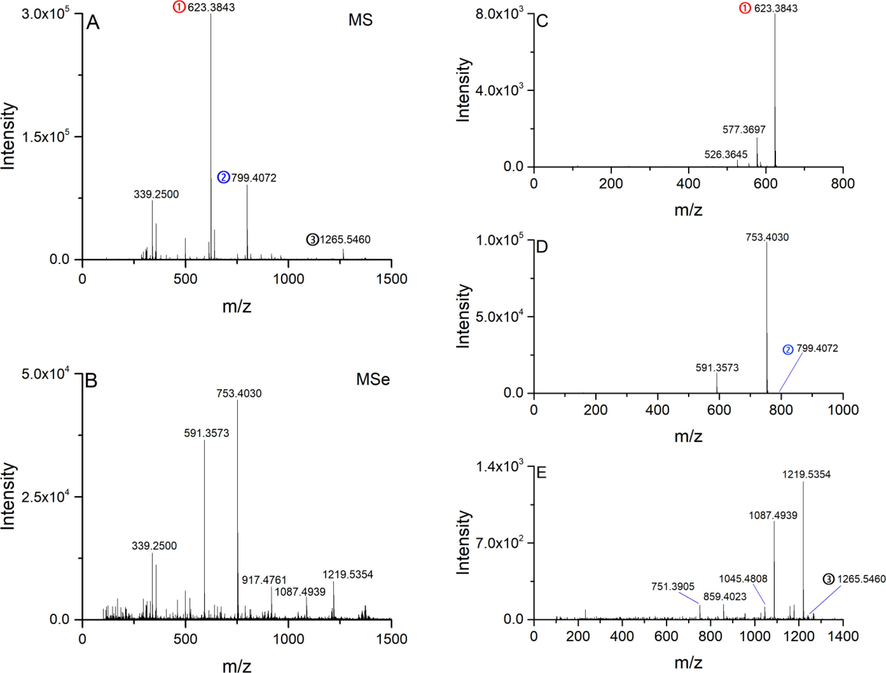
Full scan mass spectrum (A) and MSe spectrum (B) acquired at RT 12.25 min. DDA MS2 spectra of precursors at m/z 623.3843 (C), 799.4072 (D), and 1265.5460 (E).
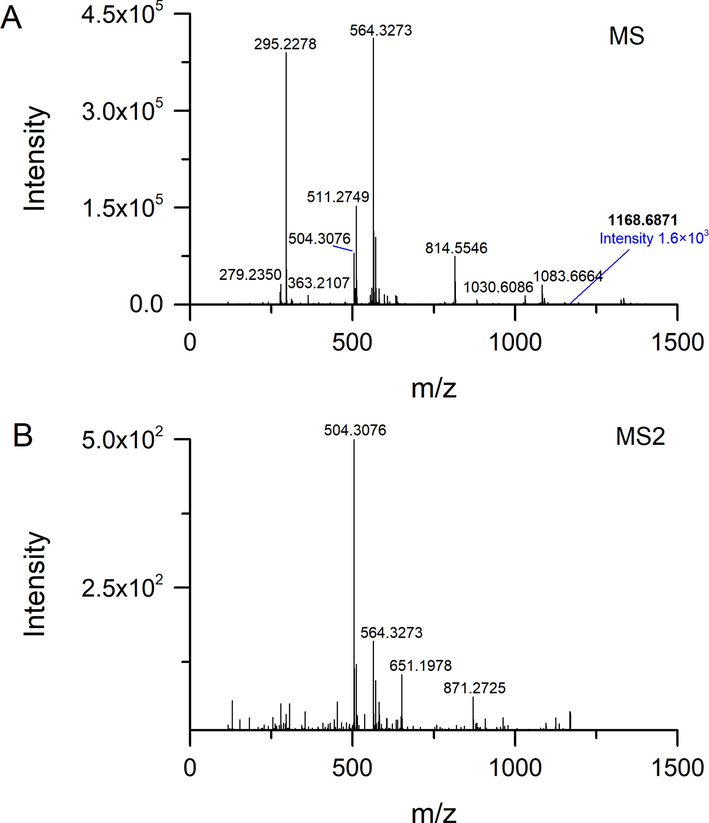
MS and MS2 spectra of the ion at RT 12.30_m/z 1168.6871.
3.5 Compound identification
The GSTTF was detected using the developed method under positive and negative ion modes, respectively. The identification of the chemical compounds was conducted by comparing the MS and MS2 information with the published data. Here we take terrestrinin S at RT 5.92 min as an example to demonstrate the identification procedures. The full scan MS spectra from positive and negative ion modes are shown in Fig. 7A–B. The Δm/z between m/z 1389.6260 and m/z 1343.6165 is 46.0095 Da, corresponding to a formic acid molecule. Due to the formic acid being used as an additive in the mobile phase, we inferred that these two ions were [M + HCOO]– and [M−H]–. In positive ion mode, the ions at m/z 1367.6089 and m/z 1327.6132 were observed in the MS spectrum, which corresponded to [M + Na]+ and [M + H–H2O]+. Using the accurate m/z obtained from positive and negative ion modes, we can infer the molecular weight of this compound. Then the MS2 information from the negative ion mode was applied further to confirm its structure information (Fig. 7C). The Δm/z of 132 Da and 162 Da were observed in the MS2 spectrum, corresponding to the loss of pentose and hexose units, respectively. To be specific, the ion at m/z 1211.5723, 1079.5300, and 917.4761 corresponded to [M−H−Xyl]–, [M−H−2Xyl]–, [M−H−2Xyl−Glc]–. The proposed fragmentation pathway is displayed in Fig. 7D. Finally, this feature was assigned to terrestrinin S. After collecting the MS and MS2 information of each feature, we annotated them using the above procedure, and the results were listed in Table 1.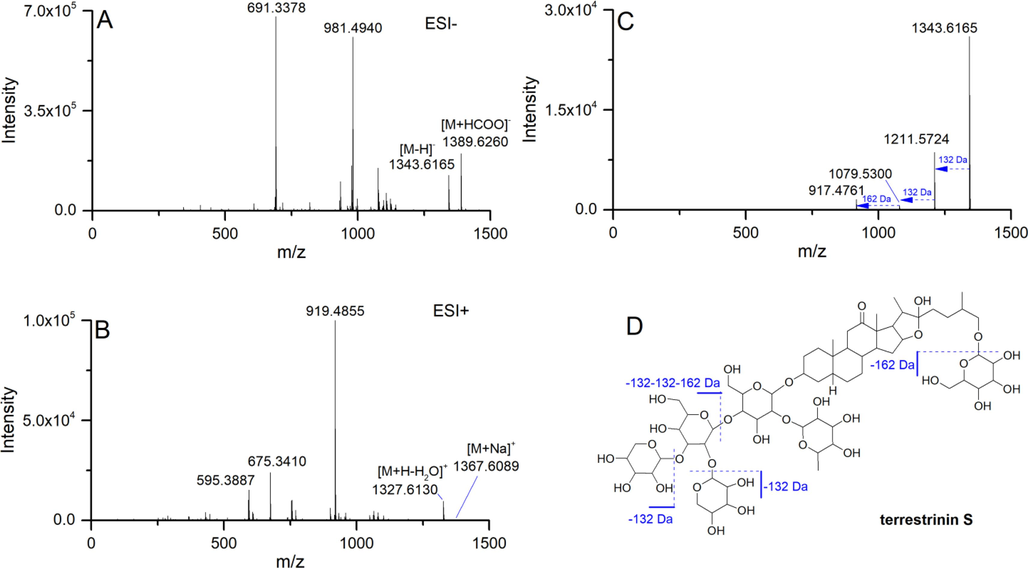
MS spectra of terrestrinin S in negative (A) and positive (B) ion mode, MS2 spectrum (C) obtained in negative ion mode, and the proposed fragmentation pathway (D).
No.
Compound name
Formula
RT (min)
m/z (ESI+)/mass error (ppm)
m/z (ESI–) /mass error (ppm)
Fragment (ESI–)
Ref.
1
Quercetin 3-gentiobioside
C27H30O17
1.65
627.1589[M + H]+/4.43
649.1350[M + Na]+/–4.73
*625.1411[M–H]–/1.01
301.0338[M–H–2Glc]–
(Zheng et al., 2017)
2
Kaempferol-3-gentiobioside
C27H30O16
2.25
611.1598[M + H]+/–2.31
633.1418[M + Na]+/–2.13
*609.1500[M–H]–/7.29
285.0372[M–H–2Glc]–
(Zheng et al., 2017)
3
Astragaloside
C28H32O17
2.53
*641.1743[M + H]+/3.95
663.1564[M + Na]+/4.04
*639.1624[M–H]–/9.83
1279.3169[2 M−H]–/–2.48315.0518[M–H–2Glc]–
(Zheng et al., 2017)
4
Tribufuroside I
C51H84O26
3.44
1135.5129[M + Na]+/–1.72
1111.5172[M–H]–/–0.05
*1157.5265[M + HCOO]–/3.251111.5172[M–H]–, 949.4709[M–H–162]–, 787.4137[M–H–162–162]–, 769.4057[M–H2O–162–162]–
(Xu et al., 2009a)
5
isomer of Tribufuroside I
C51H84O26
3.55
1135.5072[M + Na]+/–6.74
1111.5172[M–H]–/–0.05
*1157.5265[M + HCOO]–/3.251111.5172[M–H]–, 949.4709[M–H–162]–, 787.4137[M–H–162–162]–, 769.4057[M–H2O–162–162]–
(Xu et al., 2009a)
6
Tribufuroside D
C45H74O21
3.75
973.4659[M + Na]+/3.98
949.4574[M–H]–/–7.40
*995.4713[M + HCOO]–/1.40949.4709[M–H]–, 787.4137[M–H–162]–,769.4057[M–H–H2O–162]–
(Xu et al., 2009b)
7
Tribufuroside E
C45H74O21
3.88
973.4659[M + Na]+/3.98
949.4709[M–H]–/6.86
*995.4713[M + HCOO]–/1.40949.4709[M–H]–, 787.4137[M–H–162]–,769.4057[M–H–H2O–162]–
(Xu et al., 2009b)
8
25S-Terrestrosin I
C51H84O25
4.43
1119.5159[M + Na]+/–3.61
*1095.5159[M–H]–/–5.88
1141.5354[M + HCOO]–/6.64933.4717[M–H–162]–, 771.4178[M–H–162–162]–, 753.4149[M–H–H2O–162–162]–
(Wang et al., 1997)
9
25R-Terrestrosin I
C51H84O25
4.52
1119.5159[M + Na]+/–3.61
*1095.5159[M–H]–/–5.88
1141.5391[M + HCOO]–/9.88933.4717[M–H–162]–, 771.4178[M–H–162–162]–, 753.4149[M–H–H2O–162–162]–
(Wang et al., 1997)
10
26-O-β-D-glucopyranosyl-(25S)-5α-furostan-12-one-3β,22α,26-triol-3-O-β-D-glucopyranosyl-(1 → 4)-[α-L-rhamnopyranosyl-(1 → 2)]-β-D-galactopyranoside
C51H84O24
4.82
1103.5221[M + Na]+/–2.65
1079.5300[M–H]–/2.38
*1125.5385[M + HCOO]–/4.971079.5300[M–H]–, 933.4717[M–H–146]–, 917.4761[M–H–162]–, 771.4178[M–H–146–162]–
(Kang et al., 2014)
11
26-O-β-D-glucopyranosyl-(25R)-5α-furostan-12-one-3β,22α,26-triol-3-O-β-D-glucopyranosyl-(1 → 4)-[α-L-rhamnopyranosyl-(1 → 2)]-β-D-galactopyranoside
C51H84O24
4.91
1103.5221[M + Na]+/–2.65
1079.5300[M–H]–/2.38
*1125.5385[M + HCOO]–/4.971079.5300[M–H]–, 933.4717[M–H–146]–, 917.4761[M–H–162]–, 771.4178[M–H–146–162]–
(Chen et al., 2013)
12
Terrestrosin G
C51H86O25
5.43
1121.5323[M + Na]+/–2.93
1097.5404[M–H]–/2.20
*1143.5430[M + HCOO]–/–0.411097.5404[M–H]–, 935.4875[M–H–162]–, 773.4327[M–H–162–162]–, 611.3532[M–H–162–162–162]–
(Wang et al., 1997)
13
26-O-β-D-glucopyranosyl-(25R)-5α-furostan-2α,3β,22α,26-tetrol-3-O-β-D-glucopyranosyl-(1 → 2)-β-D-glucopyranosyl-(1 → 4)-β-D-galactopyranoside
C51H86O25
5.52
1121.5323[M + Na]+/–2.93
1097.5404[M–H]–/2.20
*1143.5430[M + HCOO]–/–0.411097.5404[M–H]–, 935.4875[M–H–162]–, 773.4327[M–H–162–162]–, 611.3532[M–H–162–162–162]–
(Wang et al., 1997)
14
Terrestrinin R
C61H100O32
5.81
1367.6089[M + Na]+/–4.68
1343.6165[M–H]–/3.39
*1389.6260[M + HCOO]–/6.171343.6165[M–H]–, 1211.5724[M–H–132]–, 1079.5300[M–H–132–132]–, 917.4761[M–H–132–132–162]–
(Wang et al., 2016b)
15
Terrestrinin S
C61H100O32
5.92
1367.6089[M + Na]+/–4.68
1343.6165[M–H]–/3.39
*1389.6260[M + HCOO]–/6.171343.6165[M–H]–, 1211.5724[M–H–132]–, 1079.5300[M–H–132–132]–, 917.4761[M–H–132–132–162]–
(Wang et al., 2016b)
16
26-O-β-D-glucopyranosyl-(25S)-furostan-4(5)-en-12-one-3β,22α,26-triol-3-O-β-D-glucopyranosyl-(1 → 2)-β-D-glucopyranosyl-(1 → 4)-β-D-galactopyranoside
C51H82O25
6.41
1095.5177[M + H]+/–4.24
1117.5012[M + Na]+/–2.77
*1093.5079[M–H]–/1.11
1139.5149[M + HCOO]–/2.40931.4580[M–H–162]–, 769.3936[M–H–162–162]–, 607.3514[M–H–162–162–162]–
(Zhang et al., 2006)
17
26-O-β-D-glucopyranosyl-(25R)-furostan-4(5)-en-12-one-3β,22α,26-triol-3-O-β-D-glucopyranosyl-(1 → 2)-β-D-glucopyranosyl-(1 → 4)-β-D-galactopyranoside
C51H82O25
6.47
1095.5177[M + H]+/–4.24
1117.5012[M + Na]+/–2.77
*1093.5079[M–H]–/1.11
1139.5149[M + HCOO]–/2.40931.4580[M–H–162]–, 769.3936[M–H–162–162]–, 607.3514[M–H–162–162–162]–
a
18
Terrestrosin H
C51H86O24
7.34
1105.5386[M + Na]+/–1.88
*1081.5398[M–H]–/–3.03
1127.5465[M + HCOO]–/–1.83919.4879[M–H–162]–, 757.4360[M–H–162–162]–
(Wang et al., 1997)
19
26-O-β-D-glucopyranosyl-(25R)-furostan-4(5)-en-12-one-3β,26-triol-3-O-β-D-glucopyranosyl-(1 → 2)-β-D-glucopyranosyl-(1 → 4)-β-D-galactopyranoside
C51H82O24
7.55
1079.5247[M + H]+/–2.53
1101.5073[M + Na]+/–1.88
*1077.5078[M–H]–/–3.69
1123.5175[M + HCOO]–/0.21915.4666[M–H–162]–, 753.4030[M–H–162–162]–, 591.3573[M–H–162–162–162]–
a
20
26-O-β-D-glucopyranosyl-(25S)-furostan-4(5)-en-12-one-3β,26-triol-3-O-β-D-glucopyranosyl-(1 → 2)-β-D-glucopyranosyl-(1 → 4)-β-D-galactopyranoside
C51H82O24
7.67
1079.5247[M + H]+/–2.53
1101.5073[M + Na]+/–1.88
*1077.5078[M–H]–/–3.69
1123.5175[M + HCOO]–/0.21915.4666[M–H–162]–, 753.4030[M–H–162–162]–, 591.3573[M–H–162–162–162]–
a
21
26-O-β-D-glucopyranosyl-(25R)-furostan-4(5)-en-12-one-3β,26-triol-3-O-β-D-glucopyranosyl-(1 → 4)-[α-L-rhamnopyranosyl-(1 → 2)]-β-D-galactopyranoside
C51H82O23
7.76
1063.5354[M + H]+/2.72
1061.5122[M–H]–/–4.39
*1107.5168[M + HCOO]–/–5.001061.5264[M–H]–, 899.4695[M–H–162]–, 753.4030[M–H–162–146]–, 591.3573[M–H–162–162–146]–
a
22
26-O-β-D-glucopyranosyl-(25S)-5α-furostan-3β,22α,26-triol-3-O-β-D-glucopyranosyl-(1 → 4)-[α-L-rhamnopyranosyl-(1 → 2)]-β-D-galactopyranoside
C51H86O23
7.83
1049.5596[M + H–H2O]+/6.05
1065.5426[M–H]–/–5.22
*1111.5609[M + HCOO]–/6.531065.5426[M–H]–, 903.4949[M–H–162]–, 757.4360[M–H–162–146]–
(Liu et al., 2014)
23
26-O-β-D-glucopyranosyl-(25S)-furostan-4(5)-en-12-one-3β,26-triol-3-O-β-D-glucopyranosyl-(1 → 4)-[α-L-rhamnopyranosyl-(1 → 2)]-β-D-galactopyranoside
C51H82O23
7.89
1063.5354[M + H]+/2.72
1061.5122[M–H]–/–4.39
*1107.5168[M + HCOO]–/–5.001061.5264[M–H]–, 899.4695[M–H–162]–, 753.4030[M–H–162–146]–, 591.3573[M–H–162–162–146]–
a
24
Terrestrosin J
C51H84O24
8.05
1081.5479[M + H]+/4.46
1103.5221[M + Na]+/–2.65
*1079.5300[M–H]–/2.38
1125.5385[M + HCOO]–/4.97917.4761[M–H–162]–, 899.4564[M–H–H2O–162]–, 755.4181[M–H–162–162]–, 593.3661[M–H–162–162–162]–
(Wang et al., 1997)
25
Isomer of Terrestrosin J
C51H84O24
8.65
1081.5479[M + H]+/4.46
1103.5221[M + Na]+/–2.65
*1079.5300[M–H]–/2.38
1125.5385[M + HCOO]–/4.97917.4761[M–H–162]–, 755.4181[M–H–162–162]–, 593.3661[M–H–162–162–162]–
a
26
26-O-β-D-glucopyranosyl-(25R)-5α-furostan-20(22)-en-2α,3β,26-triol-3-O-β-D-glucopyranosyl-(1 → 4)-β-D-glucopyranoside
C45H74O19
9.01
919.4855[M + H]+/–5.18
941.4688[M + Na]+/–3.61917.4761[M–H]–/1.62
*963.4766[M + HCOO]–/–3.61917.4761[M–H]–, 755.4181[M–H–162]–, 593.3661[M–H–162–162]–
(Liu et al., 2010a)
27
(23S,24R,25S) -5α- spirostan-3β,23,24-triol-3-O-β-D-glucopyranosyl-(1 → 4)-[α-L-rhamnopyranosyl-(1 → 2)]-β-D-galactopyranoside
C45H74O19
9.10
919.4855[M + H]+/–5.18
941.4688[M + Na]+/–3.61917.4761[M–H]–/1.62
*963.4766[M + HCOO]–/–3.61917.4761[M–H]–, 755.4181[M–H–162]–, 609.3656[M–H–162–146]–
(Liu et al., 2010b)
28
Terrestrinin T-132
C51H84O23
10.58
1065.5436[M + H]+/–4.28
1087.5281[M + Na]+/–1.85
*1063.5336[M–H]–/1.02
1109.5380[M + HCOO]–/0.01901.4757[M–H–162]–, 739.4316[M–H–162–162]–, 577.3169[M–H–162–162–162]–
a
29
Tribulosaponin B
C51H84O22
10.80
1049.5596[M + H]+/6.05
1071.5366[M + Na]+/1.321047.5435[M–H]–/5.63
*1093.5509[M + HCOO]–/7.151047.5293[M–H]–, 885.4838[M–H–162]–, 739.4197[M–H–162–146]–, 577.3592[M–H–162–162–146]–
(Bedir and Khan 2000)
30
isomer of Tribulosaponin B
C51H84O22
10.90
1049.5596[M + H]+/6.05
1071.5366[M + Na]+/1.321047.5435[M–H]–/5.63
*1093.5509[M + HCOO]–/7.151047.5293[M–H]–, 885.4838[M–H–162]–, 739.4197[M–H–162–146]–, 577.3592[M–H–162–162–146]–
a
31
26-O-β-D-glucopyranosyl-(25S)-5α-furostan-20(22)-en--3β,26-diol-3-O-β-D-xylopyranosyl-(1 → 2)-[β-D-xylopyranosyl-(1 → 3)]-β-D-glucopyranosyl-(1 → 4)-[α-L-rhamnopyranosyl-(1 → 2)]-β-D-galactopyranoside
C61H100O30
11.07
1313.6377[M + H]+/–0.05
1335.6095[M + Na]+/–7.641311.6176[M–H]–/–3.45
*1357.6237[M + HCOO]–/–2.871311.6333[M–H]–, 1179.5757[M–H–132]–, 1047.5293[M–H–132–132]–, 885.4838[M–H–132–132–162]–, 739.4079[M–H–132–132–162–146]–
a
32
26-O-β-D-glucopyranosyl-(25R)-5α-furostan-20(22)-en-3 β,26-diol-3-O-β-D-xylopyranosyl-(1 → 2)-[β-D- xylopyranosyl-(1 → 3)]-β-D-glucopyranosyl-(1 → 4)-[α- L-rhamnopyranosyl-(1 → 2)]-β-D- galactopyranoside
C61H100O30
11.15
1313.6377[M + H]+/–0.05
1335.6254[M + Na]+/4.261311.6176[M–H]–/–3.45
*1357.6237[M + HCOO]–/–2.871311.6333[M–H]–, 1179.5757[M–H–132]–, 1047.5293[M–H–132–132]–, 885.4838[M–H–132–132–162]–, 739.4079[M–H–132–132–162–146]–
(Wang et al., 2009)
33
Terrestrosin C
C45H72O19
11.34
–
915.4585[M–H]–/–0.50
*961.4614[M + HCOO]–/–3.15915.4666[M–H]–, 753.4030[M–H–162]–, 591.3573[M–H–162–162]–
(Yan et al., 1996)
34
Terrestrinin I
C45H72O20
11.56
955.4495[M + Na]+/–2.05
931.4580[M–H]–/4.43
*977.4620[M + HCOO]–/2.71931.4580[M–H]–, 769.4057[M–H–162]–, 607.3514[M–H–162–162]–
(Kang et al., 2014)
4 Discussion
BoxCar DDA with different sub-mass ranges was applied to conduct the LC-MS analysis. By comparing the MS2 data acquired by different methods, we highlighted the advantages of BoxCar DDA, including high MS2 coverage, the clear linkage between precursor and product ions, and the ability to obtain the MS2 data of ions with low intensity. BoxCar DDA divided the whole mass range into several sub-ranges defined by the analysis requests, which could reduce the co-eluted ions efficiently and increase the chance of ions being selected as precursors. In the DDA analysis, the MS instrument automatically selects the ions higher than the threshold to conduct MS2 analysis. If the sample has complex matrices, like metabolomics samples, the trigger efficiency of interested ions will be greatly affected. Thus, many efforts have been dedicated to increasing the MS2 coverage in DDA analysis. The main purpose of these approaches is to reduce the number of ions in a period of RT. The targeted LC-MS2 analysis was established to increase the information content of LC-MS analysis by directly selecting the ions of interest for fragmentation (Hoffmann et al., 2014). During the analysis, the MS2 precursor list was generated by comparing the sample dataset with the blank dataset. The features only detected in the sample and never found in the blank were selected to compile the MS2 precursor list. Then the MS2 precursor list was input into the DDA inclusion list for tandem MS analysis. This approach removed the redundant information from the matrix, thus enabling us to focus on the valuable features and obtain high coverage of reasonable MS2 spectra of small molecules.
However, the pre-filtered features with similar physicochemical properties are prone to eluted in similar RT. Thus, if the scan time of the instrument is not that high, several ions still have the chance to be missed. Therefore, Wang et al. established a target-directed DDA approach to further enhanced the MS2 coverage by using the time-staggered precursor ion list, in which the ion list was split into three ion lists based on their RTs to reduce the number of co-eluted ions (Wang et al., 2017). The present study used BoxCar DDA to reduce the number of co-eluted ions based on the mass range, which omitted the precursor selection process and simplified the whole procedure of method editing. The plant material of GSTTF was used to perform the analysis using the established method, which showed a significant improvement in MS2 coverage and spectra quality.
BoxCar DDA employed the user-defined sub-mass range to split the whole mass range into several sections. We can adjust the mass window widths based on the ion distribution; for example, the wide sub-mass range is applied in the area of low ion density, and the narrow sub-mass range is used for the high co-eluted area. Besides, high MS2 coverage and good spectra quality are essential for analyte annotation, especially in the metabolomics analysis with complex sample matrix and the ambient MS-based analysis(Wang and Liu 2023). The proposed method could be easily included in untargeted analysis workflow by analyzing the pooled quality control (QC) sample to establish an MS2 library for compound identification. Pseudotargeted analysis requires comprehensive MS2 data to establish the precursor → product ion pairs for MRM analysis. The BoxCar DDA can act as an option for ion pair acquisition (Zheng et al., 2020). An improved pseudotargeted metabolomics was proposed using one high resolution MS instrument operated under multiple ion monitoring (MIM) mode, whose most significant limitation is the lack of MS2 data (Wang et al., 2016a). This limitation can be improved using the established BoxCar DDA. After MS2 data is acquired by BoxCar DDA, we can use these data to either perform multiple ion monitoring (MRM) acquisition or assist compound annotation. Due to the same instrument being used in both approaches, the MS2 data can be directly used without parameter transformation.
The BoxCar DDA cannot archive 100% MS2 coverage even with the narrow sub-mass range of 10 Da, which is likely caused by the complex chemical composition of samples. Enlarging chromatographic separation time as appropriate could improve the chromatogram resolution of analytes and reduce the number of ions in a period of time, which could finally increase the MS2 coverage. Therefore, the analysis time and high MS2 coverage should be a trade-off during BoxCar DDA analysis. We can also select a narrow full scan mass range that can cover the features of interest to perform BoxCar DDA analysis, in which the increasing number of interested ions can be triggered for fragmentation. Besides, multiple injections during BoxCar DDA analysis are challenging for valuable samples. Since the method validation is mandatory for metabolomics analysis by repeatedly analyzing pooled QC samples (Naz et al., 2014, Bijttebier et al., 2016), the BoxCar DDA can be applied using the QC samples to overcome this limitation. Using a wide sub-mass range according to the practical situation could also reduce the injection number. Increasing the number of boxes in each injection can also reduce the number of injections, but in this case, we need to consider the scan rate of the instrument.
5 Conclusion
The BoxCar strategy was initially developed on an Orbitrap MS instrument for in-depth proteome analysis. In this study, we configured this approach on a Q-TOF MS instrument to propose a BoxCar DDA approach. Compared with the conventional DDA, the established method showed significant improvement in MS2 coverage. BoxCar (10) DDA obtained the highest MS2 coverage, even for the low abundance ions. To evaluate the method applicability, the GSTTF was analyzed using the established method, and the acquired MS2 data was applied to perform compound identification. The newly developed method can be easily integrated with untargeted metabolomics workflow and also can be used to obtain comprehensive ion pairs for pseudotargeted analysis. Future efforts will focus on further MS2 coverage increase and injection number reduction.
Acknowledgment
This study was supported by the National Natural Science Foundation of China (Grant No. 82104366); the Department of Science and Technology of Jilin Province, (Grant No. 20210101426JC and 20220505047ZP); and the Changchun University of Chinese Medicine (Grant No. 202326).
Declaration of competing interest
The authors declare that they have no known competing financial interests or personal relationships that could have appeared to influence the work reported in this paper.
References
- New steroidal glycosides from the fruits of Tribulus terrestris. J. Nat. Prod.. 2000;63:1699-1701.
- [CrossRef] [Google Scholar]
- Bridging the gap between comprehensive extraction protocols in plant metabolomics studies and method validation. Anal. Chim. Acta. 2016;935:136-150.
- [CrossRef] [Google Scholar]
- Software tools and approaches for compound identification of LC-MS/MS data in metabolomics. Metabolites. 2018;8:31.
- [CrossRef] [Google Scholar]
- Enhanced detection and identification in metabolomics by use of LC–MS/MS untargeted analysis in combination with gas-phase fractionation. Anal. Chem.. 2014;86:7558-7565.
- [CrossRef] [Google Scholar]
- Challenges, progress and promises of metabolite annotation for LC–MS-based metabolomics. Curr. Opin. Biotech.. 2019;55:44-50.
- [CrossRef] [Google Scholar]
- Furostanol saponins from the fruits of Tribulus terrestris. Nat. Prod. Res.. 2013;27:1186-1190.
- [CrossRef] [Google Scholar]
- Eight key rules for successful data-dependent acquisition in mass spectrometry-based metabolomics. Mass Spectrom. Rev.. 2023;42:131-143.
- [CrossRef] [Google Scholar]
- Multiplexed MS/MS for improved data-independent acquisition. Nat. Methods. 2013;10:744-746.
- [CrossRef] [Google Scholar]
- Targeted data extraction of the MS/MS spectra generated by data-independent acquisition: a new concept for consistent and accurate proteome analysis. Mol. Cell. Proteomics. 2012;11(O111):016717
- [CrossRef] [Google Scholar]
- Improving natural products identification through targeted LC-MS/MS in an untargeted secondary metabolomics workflow. Anal. Chem.. 2014;86:10780-10788.
- [CrossRef] [Google Scholar]
- Steroidal saponins from Tribulus terrestris. Phytochemistry. 2014;107:182-189.
- [CrossRef] [Google Scholar]
- Advances in data-independent acquisition mass spectrometry towards comprehensive digital proteome landscape. Mass Spectrom. Rev.. 2022;e21781
- [CrossRef] [Google Scholar]
- New pregnane and steroidal glycosides from Tribulus terrestris L. J. Asian Nat. Prod. Res.. 2010;12:209-214.
- [CrossRef] [Google Scholar]
- Two new steroidal saponins from Tribulus terrestris L. J. Asian Nat. Prod. Res.. 2010;12:30-35.
- [CrossRef] [Google Scholar]
- Steroidal glycosides from the fruits of Tribulus terrestris. Chem. Nat. Compound.. 2014;50:483-488.
- [CrossRef] [Google Scholar]
- BoxCar acquisition method enables single-shot proteomics at a depth of 10,000 proteins in 100 minutes. Nat. Methods. 2018;15:440-448.
- [CrossRef] [Google Scholar]
- New software tools, databases, and resources in metabolomics: updates from 2020. Metabolomics. 2021;17:49.
- [CrossRef] [Google Scholar]
- Scanning quadrupole data-independent acquisition, Part A: qualitative and quantitative characterization. J. Proteome Res.. 2018;17:770-779.
- [CrossRef] [Google Scholar]
- Method validation strategies involved in non-targeted metabolomics. J. Chromatogr. A. 2014;1353:99-105.
- [CrossRef] [Google Scholar]
- Enhanced lipidome coverage in shotgun analyses by using gas-phase Fractionation. J. Am. Soc. Mass Spectrom.. 2016;27:1735-1744.
- [CrossRef] [Google Scholar]
- BoxCarmax: a high-selectivity data-independent acquisition mass spectrometry method for the analysis of protein turnover and complex samples. Anal. Chem.. 2021;93:3103-3111.
- [CrossRef] [Google Scholar]
- MaxDIA enables library-based and library-free data-independent acquisition proteomics. Nat. Biotechnol.. 2021;39:1563-1573.
- [CrossRef] [Google Scholar]
- Steroidal saponins from fruits of Tribulus terrestris. Phytochemistry. 1997;45:811-817.
- [CrossRef] [Google Scholar]
- Current state of the art of mass spectrometry-based metabolomics studies – a review focusing on wide coverage, high throughput and easy identification. RSC Adv.. 2015;5:78728-78737.
- [CrossRef] [Google Scholar]
- An improved pseudotargeted metabolomics approach using multiple ion monitoring with time-staggered ion lists based on ultra-high performance liquid chromatography/quadrupole time-of-flight mass spectrometry. Anal. Chim. Acta. 2016;927:82-88.
- [CrossRef] [Google Scholar]
- Enhanced MS/MS coverage for metabolite identification in LC-MS-based untargeted metabolomics by target-directed data dependent acquisition with time-staggered precursor ion list. Anal. Chim. Acta. 2017;992:67-75.
- [CrossRef] [Google Scholar]
- Recent application of direct analysis in real time mass spectrometry in plant materials analysis with emphasis on traditional Chinese herbal medicine. Mass Spectrom. Rev. 2023:1-22.
- [CrossRef] [Google Scholar]
- Furostanol and spirostanol saponins from Tribulus terrestris. Molecules. 2016;21:429.
- [CrossRef] [Google Scholar]
- Five furostanol saponins from fruits of Tribulus terrestris and their cytotoxic activities. Nat. Prod. Res.. 2009;23:1436-1444.
- [CrossRef] [Google Scholar]
- Two new furostanol saponins from Tribulus terrestris L. Fitoterapia. 2009;80:354-357.
- [CrossRef] [Google Scholar]
- Two new steroidal glucosides from Tribulus terrestris L. J. Asian Nat. Prod. Res.. 2009;11:548-553.
- [CrossRef] [Google Scholar]
- Steroidal saponins from fruits of Tribulus terrestris. Phytochemistry. 1996;42:1417-1422.
- [CrossRef] [Google Scholar]
- Furostanol saponins from the fresh Rhizomes of Polygonatum kingianum. Chem. Pharm. Bull.. 2006;54:931-935.
- [CrossRef] [Google Scholar]
- Rapid characterization of constituents in Tribulus terrestris from different habitats by UHPLC/Q-TOF MS. J. Am. Soc. Mass Spectrom.. 2017;28:2302-2318.
- [CrossRef] [Google Scholar]
- Development of a plasma pseudotargeted metabolomics method based on ultra-high-performance liquid chromatography–mass spectrometry. Nat. Protoc.. 2020;15:2519-2537.
- [CrossRef] [Google Scholar]
Appendix A
Supplementary material
Supplementary data to this article can be found online at https://doi.org/10.1016/j.arabjc.2023.105325.
Appendix A
Supplementary material
The following are the Supplementary data to this article:Supplementary data 1
Supplementary data 1
Table S1 The information on BoxCar scan design, and Figure S1 The distribution of the representative ions acquired from positive (A) and negative (B) ion modes.


