

Translate this page into:
Broad spectral inhibitory effects of pale green zinc oxide nanophosphor on bacterial and fungal pathogens
⁎Corresponding authors. bhushanvlc@gmail.com (H. Nagabhushana), darukap@bmsit.in (B. Daruka Prasad)
-
Received: ,
Accepted: ,
This article was originally published by Elsevier and was migrated to Scientific Scholar after the change of Publisher.
Abstract
Nd3+ doped zinc oxide nanophosphor were prepared by a modified sonochemical route. Adsorption of Aloe vera (A.V.) gel by the precursors made the final product with controlled morphology, that is A.V. gel acted as surfactant. Characterization studies confirmed the pure hexagonal phase with nanostructure, wide-bandgap was reported. Major electronic transitions in the prepared samples were due to 4f shell electrons of Nd3+ions. Emission peaks attributed to 2P3/2 → 4I13/2, 2P3/2 → 4I15/2, 1I6 → 3H4, 2P1/2 → 4I9/2 and 4G7/2 → 4I9/2 transitions under the excitation wavelength of 421 nm. The emitted wavelengths showed the redshift from blue to pale green region. Further, the prepared samples showed very good control over the growth of microbial pathogens such as Staphylococcus aureus, Escherichia coli, Klebsiella pneumonia, Pseudomonas aeruginosa, Alternaria alternata and Fusarium oxysporum. The proposed mechanism is that the ZnO:Nd3+ interwinds the bacteria and fungal pores with a heterogeneous range of superstructues, resulting in the local perturbation at cell membrane of fungal cells. This induces to decrease the potential energy at bacterial membrane and the leakage of electrolytes of fungal spores. There is a mechanical wrapping interaction between pathogens and the nanoparticles which locally damages of the cell membrane and causes cell lysis. Biocompatible, ZnO:Nd3+ nanostructures possesses antibacterial activity against more multi-resistant bacterial and fungal phytopathogens. This additional information provides useful scientific information to prevent the various crop diseases.
Keywords
Superstructures
Sonochemical
Photoluminescence
Crop diseases
Phytopathogens

1 Introduction
In the recent years, rare-earth (RE) ions-doped semiconductors creates wide range of interest due to their unique properties and versatile applications (Ma et al., 2016; Ali et al., 2016; Guilera et al., 2016; Ramanujam and Amit, 2016; Srikesh and Samson, 2016; Sara et al., 2016; Siraj et al., 2015). Among these materials, Zinc oxide (ZnO) is used in wide range of applications viz., optical devices, piezoelectric devices, sensors, solar cells, etc., (Ghandomani et al., 2014; Mucur et al., 2015; Albiss et al., 2016; Jain et al., 2016; Bouazizi et al., 2015). Generally, crystalline shape, structure and size of ZnO nanoparticles (NPs) are greatly affected by the physic-chemical properties (Sun et al., 2016; Cheng et al., 2016). Diverse nanostructures of ZnO NPs were synthesized by various methods such as hydrothermal, solvothermal, chemical vapour deposition, ionothermal, sol-gel, direct precipitation etc., (Duo et al., 2016; Moussa et al., 2016; Sharma and Ghose, 2015; Nithya et al., 2016; Suresh et al., 2015; Chawla et al., 2012; Song et al., 2016; Wang et al., 2014). These methods demands well equipped laboratory, tedious experimental procedures and laborious experimental conditions. Hence there is a requirement of simple method of preparation with consistency in the properties of prepared products. Synthesis method which generally utilizes bio-templates permits the reaction to continue in specific conditions. Multifunctional superstructured (SS) materials can be synthesized easily because of the capability of biomolecules to form self-assembling nature with least utilization of energy. Furthermore, for the synthesis of ZnO NPs, some bio-templates have been reported as a fuel/surfactant namely extracts of fruits, leaves, barks of plants and extracts from the animals and direct use of microorganisms (Amutha et al., 2016; Ambika and Sundrarajan, 2015; Ramesh et al., 2015). In general, the bio-template may be selected for obtaining the SS and to introduce the functionality of a biological species into the inorganic materials.
Recently, an ultrasound method has been adopted to obtain micro/mesoporous materials with high-purity, size tunable, rapid reaction rate, no waste/byproduct, convenient reaction rate and the ability to get various nanostructures (NS). Extreme conditions established during ultrasonication are useful for obtaining the nano/superstructured materials. Table 1 shows the list of ZnO NS prepared by sonochemical route using different surfactants/precipitating agents. (Yu et al., 2015; Peng et al., 2015; Meshram et al., 2016; Siddiquey et al., 2012; Khataee et al., 2015a,b,c; Sharifalhoseini et al., 2015; Eskandarloo et al., 2016; Bhattacharyya and Gedanken, 2008; Khataee et al., 2016).
Synthesis route
Name of the precipitating/capping/surfactant agent
Name of the precursors
Crystallite size (nm)
Obtained Phases
Morphology
Sonochemical Suresh et al. (2015)
Potassium hydroxide
0.1 M Zinc chloride aqueous solution
–
Orthorhombic
Flower like
Sonochemical Chawla et al. (2012)
Diethylene glycol
Zinc acetate dihydrate
–
Hexagonal wurtzite
Randomly
Sonochemical Song et al. (2016)
KOH
Zinc acetate dehydrate, copper nitrate and sodium oxalate
231
Wurtzite
Microball
Sonochemical Wang et al. (2014)
Ethanol
Non-coated Zinc oxide
–
Zincite phase
Spherical
Sonochemical Amutha et al. (2016)
NaOH
Pr(NO3)3·6H2O and Zncl2
9
Hexagonal phase wurtzite
Spherical
Sonochemical Ambika and Sundrarajan (2015)
NaOH
Zinc acetate and Gd(NO3)3·6H2O
–
Hexagonal phase wurtzite
Irregular shape
Sonochemical Ramesh et al. (2015)
NaOH
Zn(CH3COO)2·2H2O, C6H9EuO6·xH2O and C2H5OH
–
Hexagonal phase wurtzite
Irregular shape
Sonochemical Yu et al. (2015)
NaOH
Er(CH3COO)3H2O and Zncl2
–
Hexagonal phase wurtzite
Irregular shape
Sonochemical Peng et al. (2015)
NaOH
Zinc acetate dehydrate
–
Hexagonal phase
Flower like
Sonochemical Meshram et al. (2016)
Ethanol
Zinc acetate dehydrate, samarium (1 1 1)nitrate hexahydrate and oxalic dehydrate
16
Hexagonal phase Wurtzite
Spherical
Sonochemical
N,N-dimethyl formamide
Zinc (II) acetate,
31
–
Micro- and Mesoporous
Sonochemical Khataee et al. (2015)
NaOH
ZnCl2 and Neodymium nitrate
–
Hexagonal phase wurtzite
Irregular shape
Sonochemical (present work)
NaOH and A.V. bio-surfactant
Zinc nitrate and Neodymium nitrate
20–40
Hexagonal phase Wurtzite
Super structures (Hexagonal, flower, pyramidal, cone etc.)
Aloe vera (A. V.) was a juicy medicinal plant, comprises of about 80 active biological and chemical constituents such as polysaccharides, enzymes, minerals, amino acids, alkaloids, flavones etc. These phytochemicals acts as bio-template and helps in obtaining complex superstructures (SS) in the nano/micro level. Owing to these complex SS, there will be a change in the properties of the prepared compounds (Xiao and Cao, 2016).
To tune the morphology of the samples, the influential parameters such as sonication time, concentration, power and the pH of the precursor solution were optimized. Hierarchical SS were normally basic building blocks which reassemble in a well-defined manner using capping agents, surfactant molecules, bio-templates etc. (Pachauri et al., 2010) to obtain high surface to volume ratio and better properties due to charge confinement effect. Further, the photometric properties of Nd doped ZnO phosphors and their role in the inhibitory effect on the growth of pathogenic bacteria and fungi were reported.
2 Experimental
2.1 Preparation of A.V. gel extract
A.V. leaves were washed meticulously several times by distilled water. Inner gel of the leaves was collected carefully without contaminating. 100 ml of double distilled water was added to about 25 g of the gel and stirred well to obtain uniform homogeneous mixture. This mixture was stored in a refrigerator at 277 K for future use as a bio-template/surfactant for the preparation of ZnO.
2.2 Synthesis of ZnO: Nd3+ nanostructures
Pure and Nd3+ (0.5–9 mol %) doped ZnO SS were synthesized by using A.V. gel as a bio-template/surfactant via ultrasound method. Stoichiometric quantities of Neodymium (III) Nitrate {Nd (NO3)3} and zinc nitrate {Zn (NO3)3) were mixed with 50 ml of double distilled water and stirred to get a clear solution. In a separate beaker, 5 ml of A.V. gel extract was mixed with 100 ml double distilled water and later resultant mixture was added slowly. The resultant solution was stimulated ultrasonically for various sonication time (1–6 h). Obtained white precipitate was filtered and washed by distilled water and ethanol. Dried precipitate was used for further studies. The process of preparation was repeated for various concentrations of Nd3+ ions. Flowchart for the synthesis of Nd3+ doped ZnO SS was as shown in Fig. 1.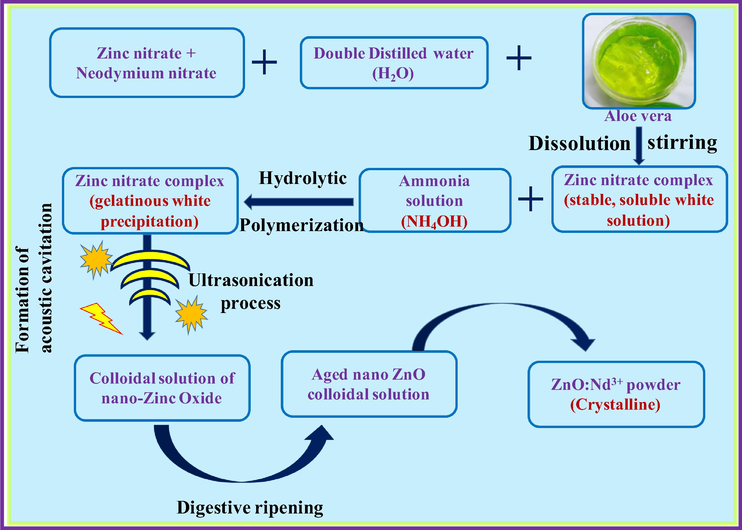
Schematic flowchart showing the synthesis of ZnO: Nd3+ nanostructures by ultrasonic process.
2.3 Evaluation of ZnO-Nd NPs for antibacterial activity
2.3.1 Preparation of test inoculums
The antimicrobial activity of the NPs was performed on four bacterial pathogens; one strain of gram-positive bacteria and Staphylococcus aureus (ATCC 6538) and three gram-negatives bacteria Escherichia coli (ATCC 8739), Klebsiella pneumoniae (ATCC 13883) and Pseudomonas aeruginosa (ATCC 9027) were considered.
All the microorganisms were cultured on Mueller-Hinton (M-H) agar (Hi-Media, Mumbai, India) and incubated at 310 K for 24 h in an aerobic condition. The bacterial suspensions were prepared by selecting a single colony from the stock bacterial culture with a loop and inoculating 20 ml of sterile nutrient broth in a 100 ml of Erlenmeyer flask. The flask was then incubated in a shaking incubator at 310 K with a rotation speed of 110 rpm for 24 ± 2 h. Further, a suspension of bacterial strains with an optical density of 0.5 obtained from McFarland 1 × 10⁸ CFU/mL was made separately in a 0.85% concentration of isotonic sodium chloride solution. This stock solution of bacterium was diluted ten times i.e., 1 × 10⁷ CFU/mL and used instantly for the analysis of inoculum as explained in below.
2.3.2 Measurement of the minimum inhibitory concentration (MIC) and minimum bactericidal concentration (MBC) of ZnO: Nd3+ NPs
Minimum inhibitory concentrations (MICs) were measured with the as gold-standard for defining the susceptibility of organisms to antimicrobial agents which was used to judge the performance of all other methods of susceptibility testing. The MIC and minimum bactericidal concentration (MBC) of the synthesized NPs under different reaction conditions were determined by broth micro-dilution method. MIC was determined according to Clinical and Laboratory Standards Institute (Ji and Zhang, 2016) with some minute modifications to use it in 96-well micro dilution plate where the bacterial strain concentration was 1 × 10⁷ CFU/mL. A stock suspension was prepared by re-suspending the NPs in milli Q water to yield the final concentration of 100 µg/mL; the suspension is kept at 277 K. Immediately the suspension was subjected to vigorous vortex mixing, aliquots of the suspension were added into M-H medium for the further experimental procedure. To identify the potentiality of ZnO: Nd3+ NPs as antibacterial agent, the bacterial strains were exposed to ten-fold dilution series ranging from 25 to 2.5 × 10⁻⁵ μg/mL. The same procedure was used to determine the MIC of the positive (tetracycline), negative controls and ZnO:Nd3+ NPs. Tetracycline (25 μg/mL) was considered as a standard antibiotic against the bacterial strains as a positive control. Sterile M-H broth with 0.85% of NaCl concentration was used as the negative control. MIC was defined as the lowest concentration of agent that restricted the growth to a level lower than 0.05 at 600 nm (no visible growth). The 20 μL of the bacterial suspension (107 CFU/mL) was added to each well and incubated at 310 K for 24 h in a bacteriological incubator. All the tests were performed in triplicate and consequently the MIC values of the compounds were detected by the addition of 25 μL of iodonitrotetrazolium chloride (INT at 0.5 mg/mL) to each well after 24 h. The microliter plates were additionally incubated at 310 K for 60 min. MICs of each compound were determined as the lowest concentration of the NPs or drug that stopped the colour change from colorless to red. MBC determination was done by using 50 μL of cultured aliquots (without INT) was streaked onto the M-H agar in petri plates and incubated for 24 h at 310 K. The lowest concentration that indicated complete non-appearance of the bacterial growth on M-H agar surface is considered as the MBC.
2.4 Antifungal activity of ZnO: Nd3+ NPs
The pathogenic fungi, Alternaria alternata (leaf spot and early blight of tomato) and Fusarium oxysporum (tomato blight) were procured from the culture collection centre of the Microbiology laboratory at Bangalore University, Bangalore, Karnataka, India. Alternaria alternata and Fusarium oxysporum were grown on SDA at 298 ± 10 K and incubated with alternative cycle of dark and light environment. Antifungal assay were accomplished by the agar dilution method or food poison method with slight modifications. The sterilized SDA media added with ecofriendly synthesized ZnO: Nd3+ NPs at 100, 200, 300, 400, 500, 600 and 700 μg/mL concentrations and a ZnO: Nd3+ NPs-free media were poured into the Petri dishes (9 cm diameter). The solidified SDA media were inoculated pathogenic fungal organisms separately. The mycelial agar disc was made aseptically from the margin of 7-day-old fungal cultures with a sterile steel cork-borer (5 mm diameter). This disc was placed in the center of each Petri dish on different concentrations of ZnO: Nd3+ NPs and controls media. All the Petri dish with the inoculated mycelial agar disc was then incubated at 298 ± 10 K for seven days. The effectiveness of ZnO: Nd3+ NPs on fungal growth was assessed at the time intervals of 7 days by mearing the diameter of fungal colonies. The antifungal property of the ZnO: Nd3+ NPs was studied and compared with the traditional antifungal agent nystatin. All the experiments were done in triplicate and the values were expressed in centimeters and the antifungal index of ZnO: Nd3+ NPs was determined.
2.5 Statistical analysis
The antifungal experimental data was analyzed by mean ± SE subjected to multivariant analysis. Means were separated by Duncan’s multiple range tests at 0.5 significant (P < 0.05) using SPSS software (version 19).
2.6 Characterization
PXRD measurements were done in Shimadzu 7000 X-ray diffractometer. Hitachi – TM 3000 was used for scanning electron microscopy (SEM). Hitachi H-8100 with LaB6 filament and Kevex sigma TM Quasar, USA were used for transmission electron microscopic (TEM) studies. The diffuse reflectance spectroscopy (DRS) of the samples was recorded on the Lambda-35 spectrometer. The spectrometer spectrum-1000 was used to perform FT-IR studies. The Jobin Yvon Spectrofluorometer Fluorolog-3 operational with 450 W Xenon lamp as an excitation source was used for photoluminescence (PL) measurement.
3 Results and discussion
3.1 PXRD analysis
PXRD patterns of the Nd3+ doped (0.5–9 mol %) ZnO NPs were as shown in Fig. 2a. All the profile peaks are well matched with the hexagonal phase with fine crystallinity. Fig. 2a shows that the intensity of (0 0 1) peak is more than the intensity of (0 0 2) peak was due to the SS formation. Further, the shift in the peak position of (1 0 1) was observed with an increase in dopant concentration. All these changes were due to the stress induced by the ultrasonic waves energy moved to the crystal lattice through electron–phonon coupling (Ji and Zhang, 2016).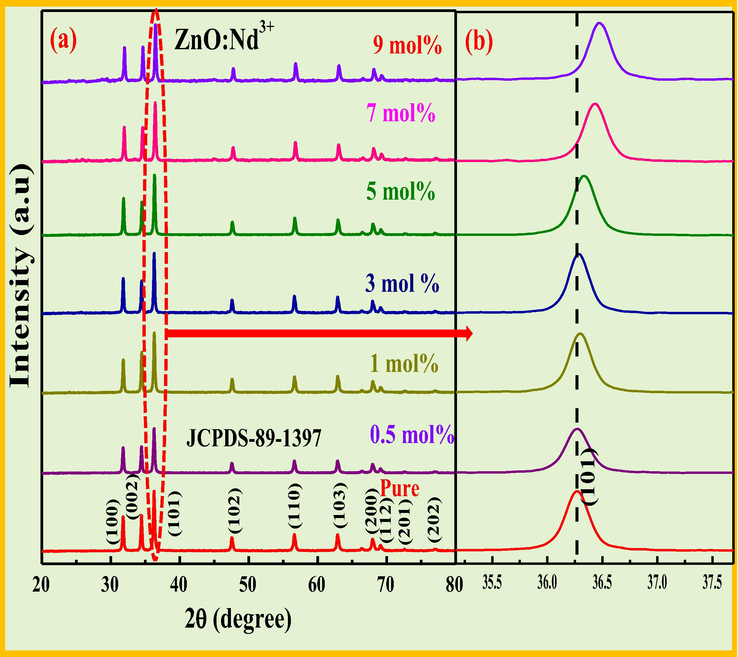
PXRD profiles of pure and Nd3+ (0.5–9 mol %) nanostructures, (b) magnified view of peak (1 0 1) showing shift towards larger angle side.
The acceptable percentage difference between Nd3+ (Rd = 1.112 Å) and Zn2+ (Rs = 0.88 Å) in ZnO host was and found to be 16% which is less than 30%, indicates that the dopant ions (Nd3+) effectively replaces Zn2+ ions in the ZnO host. The average crystallite size of the synthesized products was evaluated by utilizing Debye–Scherrer’s equation and was given by Basavaraj et al. (2015). The estimated values of crystallite size, strain, energy gap for the prepared samples were summarized in Table 2.
Nd3+ (mol %)
Crystallite size (nm)
Strain ε × (10−3)
Energy gap (Eg) in eV
Scherrer’s approach
W-H approach
Pure
20
23
1.10
3.05
0.5
22
25
1.13
3.07
1
24
26
1.16
3.06
3
31
33
1.19
3.04
5
33
35
1.21
3.08
7
34
36
1.27
3.15
9
36
40
1.24
3.12
Williamson-hall (W-H) approach was used to estimate crystallite size and strain present within the prepared samples and tabulated in Table 2 (Nagabhushana et al., 2016). A straight line between 4 sinθ versus β cosθ for ZnO: Nd3+ (0.5–9 mol %) nanophosphors (NPs) was as showed in Fig. 2b. Rietveld refinement method was quite useful to calculate the accurate structural and unit cell parameters of the compound. For this, PXRD raw data was used as input data to FullProf software. The refined parameters such as occupancy, atomic functional positions for ZnO: Nd3+ (0.5–9 mol %) were summarized Table 3. It was observed that ZnO shows hexagonal crystal structure with lattice parameter a = b=3.2463 Å, c = 5.1860 Å, V = 47.43 Å3 and space group = P63mc. The goodness of fit defined by χ2 = (Rp/Rwp)2 was found to be in the range of 1.1 which confirms the good fitting (Fig. 3). Diamond software (Morozov et al., 2015; Madan et al., 2016) was utilized for showing the possible packing diagram as in inset of Fig. 3.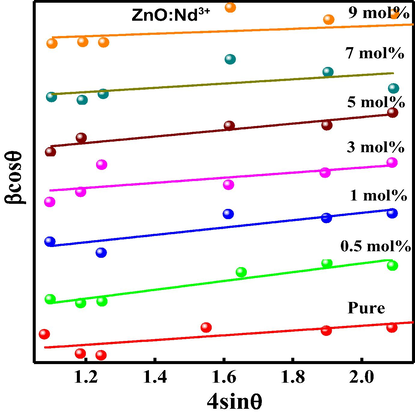
Williamson–Hall plots of ZnO: Nd3+ (0.5–9 mol %) nanostructures.
ZnO : 0.5 mol%
ZnO : 1 mol%
ZnO : 3 mol%
ZnO : 5 mol%
ZnO : 7 mol%
ZnO : 9 mol%
Crystal system
Hexagonal
Hexagonal
Hexagonal
Hexagonal
Hexagonal
Hexagonal
Space group
P 63 m c
P 63 m c
P 63 m c
P 63 m c
P 63 m c
P 63 m c
Hall Symbol
P 6c -2c
P 6c -2c
P 6c -2c
P 6c -2c
P 6c -2c
P 6c -2c
Lattice parameters (Å)
a = b
3.2494
3.2482
3.2453
3.2464
3.2456
3.2506
C
5.2041
5.2027
5.1977
5.1998
5.1980
5.2042
Unit cell volume (Å3)
47.586
47.538
47.407
47.458
47.42
46.236
Atomic coordinates
Zn
X
0.3333
0.3333
0.3333
0.3333
0.3333
0.3333
Y
0.6667
0.6667
0.6667
0.6667
0.6667
0.6667
Z
0.0000
0.0000
0.0000
0.0000
0.0000
0.0000
Occupancy
0.5973
0.8566
0.8571
0.8567
0.8568
0.8269
Nd3+
X
0.3333
0.3333
0.3333
0.3333
0.3333
0.3333
Y
0.6667
0.6667
0.6667
0.6667
0.6667
0.6667
Z
0.0000
0.0000
0.0000
0.0000
0.0000
0.0000
Occupancy
0.1702
0.1693
0.0669
0.1693
0.1691
0.1691
O2−
X
0.3333
0.3333
0.3333
0.3333
0.3333
0.3333
Y
0.6667
0.6667
0.6667
0.6667
0.6667
0.6667
Z
0.3907
0.3812
0.3729
0.3727
0.3667
0.3760
Occupancy
1.0057
1.0000
1.0011
1.0000
1.1141
1.1141
RP
3.48
1.97
2.53
2.72
3.15
3.44
RWP
5.49
2.67
4.58
4.78
5.62
5.72
RExp
3.53
3.74
2.64
4.49
4.52
4.52
χ2
2.42
0.509
3.02
1.13
1.55
1.60
GoF
1.5
0.71
1.7
1.1
1.2
1.3
RBragg
8.37
2.98
4.21
3.29
3.93
4.77
RF
5.66
2.45
2.47
1.90
2.30
3.61
X-ray density (g/cc3)
5.819
5.503
5.727
5.512
5.641
5.649
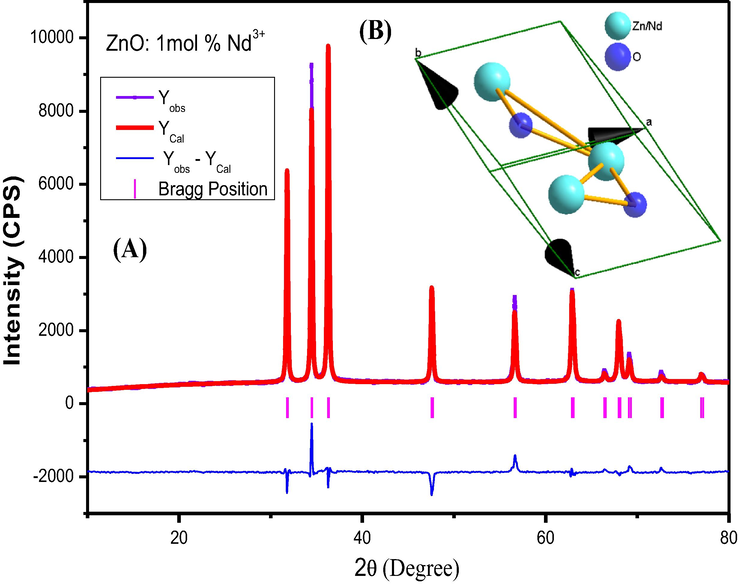
(A) Rietveld refinement of 1 mol % Nd doped ZnO. (B) Inset: Packing diagram.
Fig. 4(a) depicts the DRS of pure and Nd3+ doped ZnO NPs at room temperature (RT). A sharp peak at ∼385 nm, attributed to the intrinsic band-gap absorption of ZnO due to the electron transitions from the valence band to the conduction band (O2p → Zn3d). The spectra exhibited major peaks at 275, 360, 529, 586, 680,742 and 806 nm were due to the transitions of the 4f electrons of Nd3+ ions from the ground-state to 4I9/2 → 2F5/2, 4D3/2 + 4D5/2 + 2I11/2, 2K13/2 + 4G7/2 + 4G9/2, 4G5/2 + 2G7/2, 4F7/2 + 4S3/2, 4F5/2 + 2H9/2 and 4F3/2 respectively (Peng et al., 2014).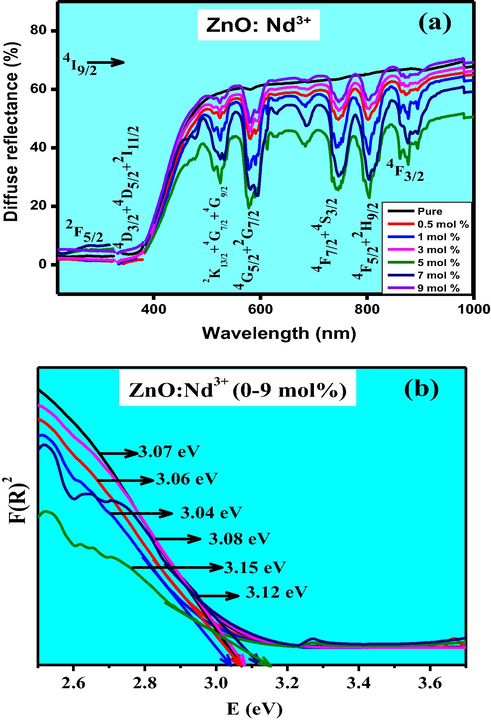
(a). Diffuse reflectance spectra & (b) energy band gap plots of ZnO: Nd3+ (0.5–9 mol %) NPs.
Kubelka–Munk function was utilized to determine the energy band gap (Eg) of ZnO: Nd3+ NPs (Zhang et al., 2012; Wan et al., 2007). The intercepts of the tangents drawn to the plots of [F(R∞) hν]1/2 versus photon energy (hν) provides the band gap values (Fig. 4(b)) and found to be ∼3.04–3.15 eV. Smaller band gap values compared to pure ZnO was due to the substitution of Nd3+ ions. Certain electronic states were offered into the band gap of ZnO by Nd3+ 4f electrons, which were situated close to the lower edge of the conduction band to form new lowest un-occupied molecular orbitals. The estimated values of Eg were tabulated in Table 2.
3.2 Morphological analysis
Schematic representations in Fig. 5 shows the formation of various ZnO: Nd3+ SS. The bio-surfactant with a suitable concentration can acquire different self-assembled SS (Kavyashree et al., 2015). Hence, in order to explore the above effect, several concentrations of A.V. (5–30 ml) on morphology were studied with a fixed 1 h sonication time. Fig. 6 shows the SEM images of the ZnO samples obtained at different A.V. concentration (5–30 ml). When the A.V. concentration was ∼5 ml (Fig. 6a), irregular quasi-spherical petal built aggregates with rugged surfaces. When the A.V. concentration was ∼10 ml, the initial product largely contained of quasi-spherical particles with thick hierarchical platelets (Fig. 6b) and the obtained flower shaped structures were not well developed. When the A.V. concentration was ∼15 ml (Fig. 6c), regular flower like spheres were formed and they were inter-connected strongly. When the A.V. gel concentration was further increased to 20 ml (Fig. 6d), flower-like microspheres of thin nano plates were formed. When further increase in the A.V. concentration to 25 and 30 ml (Fig. 6(e and f)), there was no variations in the morphology except flowers like morphology. The large porous surfaces of these zinc oxide flowers found various applications in a display devices, catalysis, solar cells, sensors etc. The decrease in the aspect ratio of ZnO with an increase in the mass ratio of A.V. gel can be explained based on the interactions between the A.V. molecules and the surfaces of the growing crystals. At a low A.V. gel, the surfactant molecules interact more freely with each other and with the crystal surface. However, at a high A.V., both the side facets and top facets of the crystals tend to adsorb ZnO molecules. The strong adsorption of the surfactants also blocks reactive sites to slow down the rate of addition of new element to the crystal facet and the supply of Zn2+ ions to the growing crystal surface becomes more constrained. Since the crystal surface tends to be shielded by slow-growing and low-energy facets, the kinetic and thermodynamic aspects works in aggregation with one another. The changes in morphology can be observed with added A.V. specified that the bio-surfactants manipulate particle nucleation and growth. These outcomes were basically in line with the before findings that additives and surfactants modify the crystal growth stages and control nucleation. The growth rate of the crystal planes in ZnO was due to differences in the surface free energies leads to various crystal morphologies. Presence of many polysaccharides in the media can tune the shape during the growth of crystal and changes the crystal structures to undergo self- assembly (Lakshmeesha et al., 2014). The schematic representation for the formation of ZnO: Nd3+ SS with and without A.V. are shown in Fig. 7.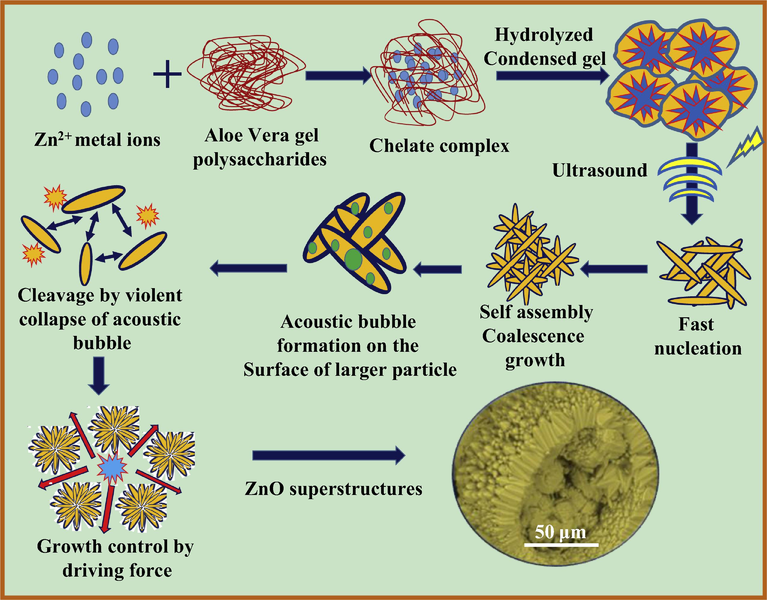
Schematic representation for the formation of ZnO: Nd3+ SS.
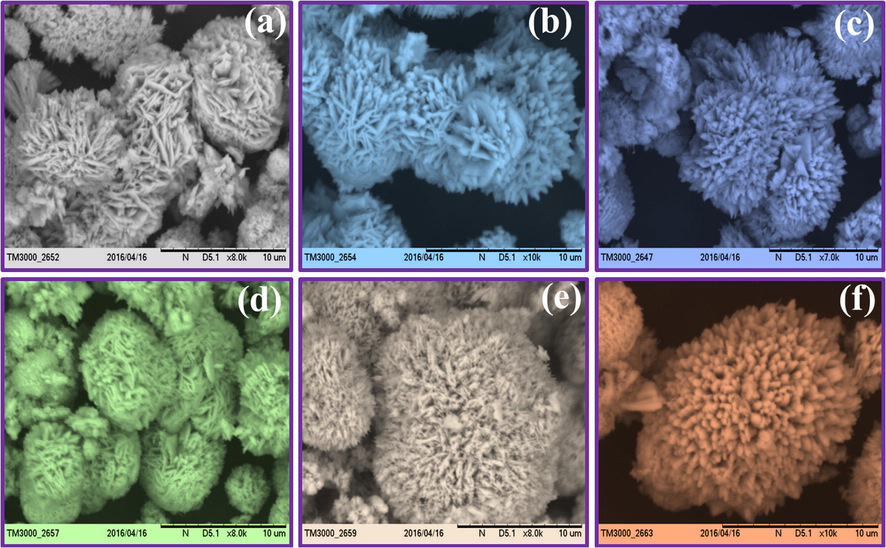
SEM images of ZnO:Nd3+ (1 mol %) superstructures with different A.V. concentrations (a) 5 ml, (b) 10 ml, (c) 15 ml, (d) 20 ml, (e) 25 ml and (f) 30 ml.
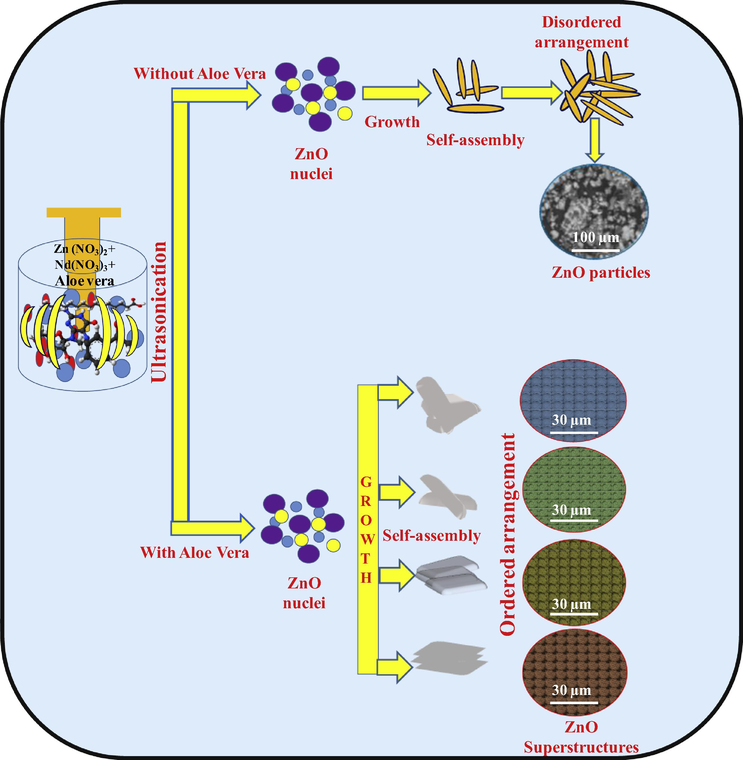
Schematic representation of formation of ZnO:Nd3+ superstructures with and without A.V.
The various morphologies of the ZnO: Nd3+ (0.5–9 mol %) SS synthesized at different pH values with A.V. were as shown in Fig. 8. At a low pH of 1, the hexagonal rod shaped particles stacked side by side (Fig. 8(a)). With an increase of pH to 3, sharp hexagonal shaped particles assembled one over the other to form a single pyramid. However, when the pH is 5, a flower shaped with elongated tip to form bullet shaped particles (Fig. 8(c)). When the pH increases to 7, the obtained crystals were hexagonal with sharp tips which were self-assembled and projected outwards (Fig. 8(d)). However, with the increase of pH value to 9, hexagonal disc shaped SS were obtained (Fig. 8(e)). Therefore, it can be established that A.V. as a bio-surfactant acts as a modifier to tune the structures. It seems plausible that bio-surfactant A.V. can absorb selectively on particular crystal facets or be integrated into the lattice leads to control over growth rate along different crystal axes to form various morphologies. It was observed that the pH may significantly impact the morphology of the material. In the growth stage, numerous tiny assembly units extend to grow into hierarchical SS and to decrease the surface energy. Numerous factors may influence to acquire SS, specifically crystal face attraction, electrostatic and dipolar fields associated with the aggregate, Vander Waals forces, intrinsic structures and external factors (Chandrashekar et al., 2015). The actual formation processes was more complicated and may require more studies.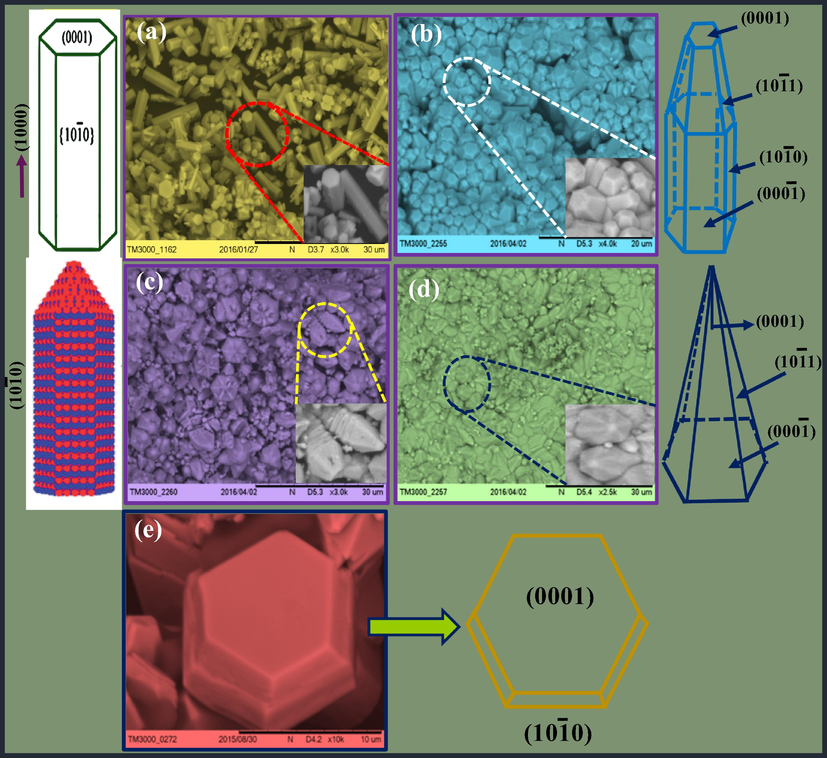
SEM images of ZnO: Nd3+ superstructures at (a) pH = 1, (b) pH = 3, (c) pH = 5, (d) pH = 7 and (e) pH = 9.
SEM micrographs of ZnO: Nd3+ (5 mol %) SS with different sonication times (1–6 h) with 30 ml A.V. surfactant and ultrasonic power of 24 kHz, clearly evident that a various structural morphology were obtained (Fig. 9). For the crystallization of SS, two things can be considered: (i). Growth of nuclei and generation of the symmetrical form and (ii). Self-assembly of grown NPs and their orientation in different directions to form SS. It has been scientifically proven that the existence of SS is due to the possessing of more stability in symmetric shapes (Liu et al., 2015). Concerning to the tendency of having the symmetry and observation of the flower-like structure with the equal length branches, the first path seems more possible to happen. By this assumption, the probable mechanism for crystallization of the flower-like structure could be illustrated as follows: At first, the hexagonal prisms were considered as the primary nuclei of ZnO. The (0 0 1) face, which belongs to the symmetry group (C6) has higher symmetry and growth occurs along it (c-axis) (Sharifalhoseini et al., 2015).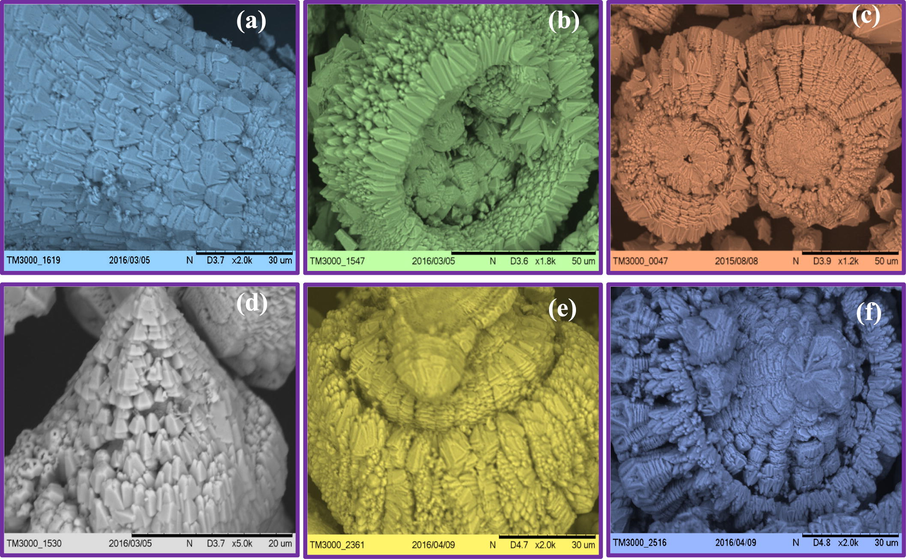
SEM images of ZnO: Nd3+ superstructures with different sonication time (a) 1 h, (b) 2 h, (c) 3 h, (d) 4 h, (e) 5 h (f) 6 h with 30 ml A.V. and 24 kHz ultrasonic power.
It could be assumed that some primary nuclei (such as six nuclei) were joined. The samples produced under the high intensity irradiation, the aggregation or fusion of the ZnO nuclei was due to the transferring of the acoustic energy to the reaction medium. The impulsive collapse of the bubble generates localized hot spots through adiabatic compression or shock waves. Fusion of these nuclei could be exemplified by the high temperature and high pressure produced in the hot spots.
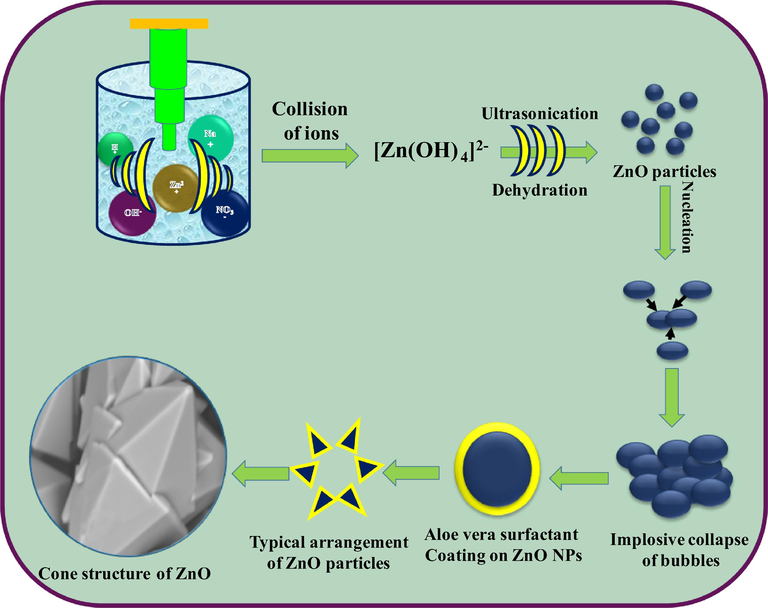
The mechanism of formation of ZnO nanostructures takes the consideration of the ionic species formed from water molecules by absorption of ultrasound energy. The reaction steps taking place inside sonochemical bath can be summarized in Fig. 10. Equations written inside the Fig. 10 were the possible reactions for the formation of primary ions by dissociation of water, sodium hydroxide and zinc acetate. Fourth equation in the inset of Fig. 10 shows the formation of [Zn(OH)4]2− species which further decomposes to give ZnO SS.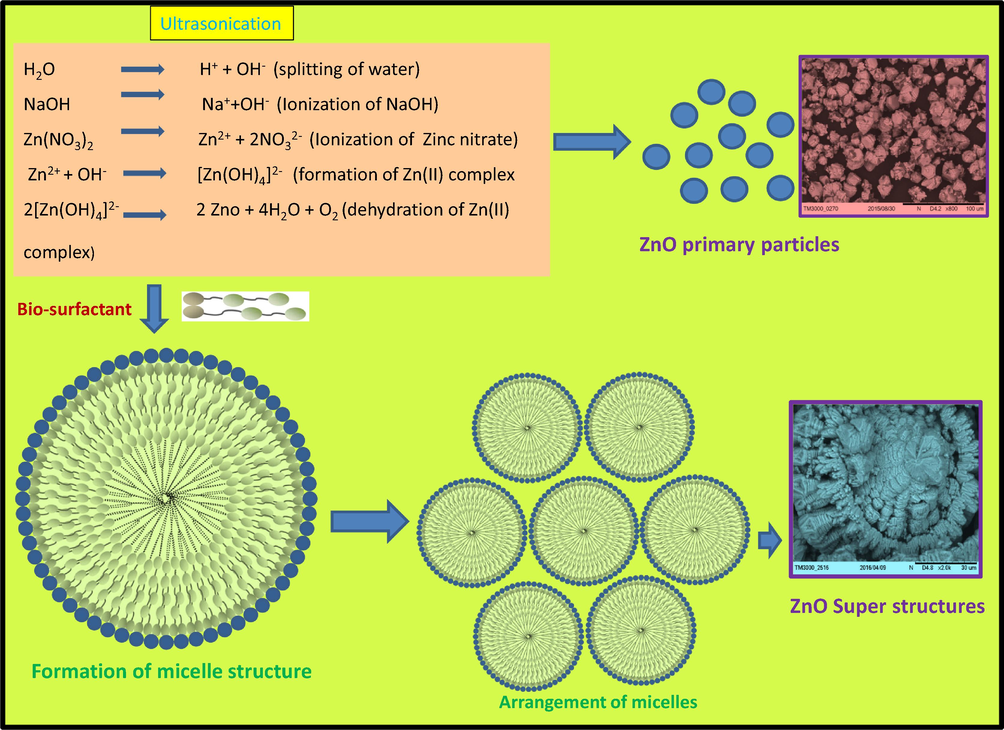
Mechanism showing growth, arrangement of micelle resulting to ZnO:Nd3+ superstructures.
When zinc nitrate mixed with A.V. plant gel, the Zn2+ ions will distribute uniformly, thus forming a three-dimensional polymeric network structure. The resulting polymeric network undergoes slow decomposition when subjected to ultrasonic irradiation. The detailed study was necessary to understand the formation of different ZnO: Nd3+ SS. The complexity and variety of polysaccharides can be explained by two ways, first monosaccharides can be linked together in different ways (1 to 2, 1 to 3, 1 to 4, 1 to 5 and 1 to 6 in an α and β configurations) and second due to the presence of branched chains (Ray et al., 2015). During the process, pectin and acemannan serve as bio templates to restrict the growth of ZnO structures, but also serve as assembling agents to get SS. Similarly cellulose, hemicelluloses, chitosan, xylan, etc. also contribute in stabilization of Nd3+ ions to obtain various morphologies. The nature prefers the least utilization of energy in any of the self-assemblies. Hence in this method of preparation for the formation of SS of ZnO was due to the natures least energy utilization concepts.
Fig. 11 shows the SEM images of ZnO: Nd3+ SS synthesized at various ultrasonic powers (20–36 kHz). It was noticed that by changing the sonication power may significantly influence the hexagonal pyramidal shape morphology of the product. By changing the suitable sonication power, the shape of the SS could prominently alter. In the growth stage, many of the tiny pyramidal assembly units extend to grow into hierarchical flower SS to reduce the surface energy. Numerous factors which may influence to achieve the flower like SS, includes crystal- face attraction, electrostatic and dipolar fields associated with the aggregate, Vander Waals forces, intrinsic structures and external factors. In order to find out the possibility for the formation of ZnO SS as a function of temperature a sonochemical reaction was performed in the temperature range of 313–343 K.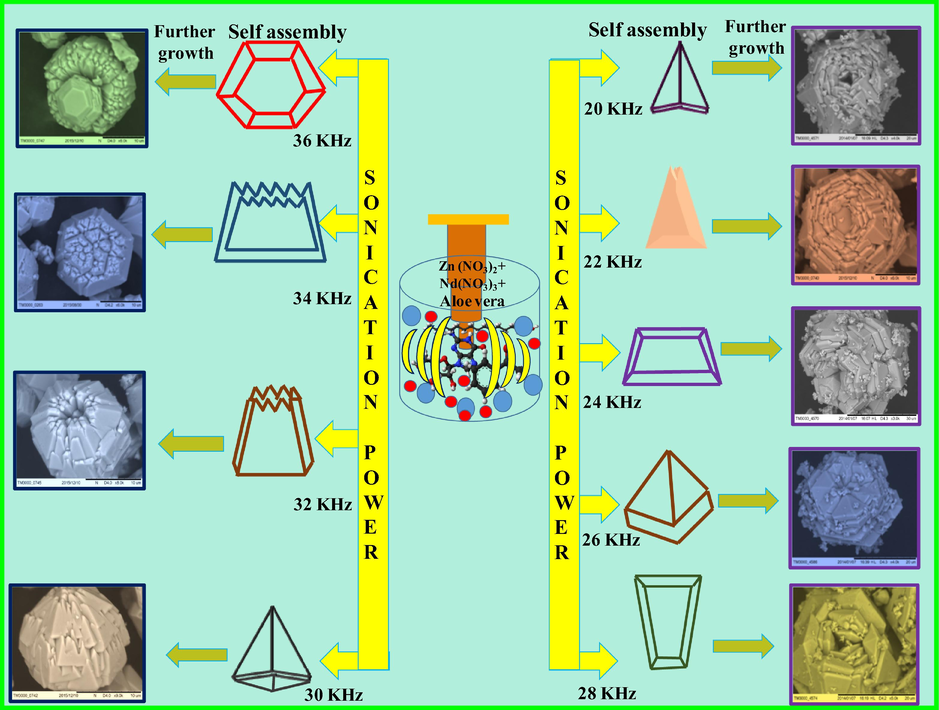
SEM images of ZnO: Nd3+ superstructures synthesized at various ultrasonic power (20–36 kHz).
It was interesting to note that pyramidal like structure with several solid agglomerates (irregular) instead of well-crystallized NPs were formed at 313–343 K (Fig. 12(a–d). However, when the temperature increased to 343 K a smooth hexagonal uniform pyramidal shaped particle were obtained (Fig. 12(e)) which indicates that temperature was an indispensable factor to determine the formation of well-crystallized hexagonal uniform pyramidal shaped particles. The schematic illustration for the formation of cone-like structures at different temperatures was shown in Fig. 13.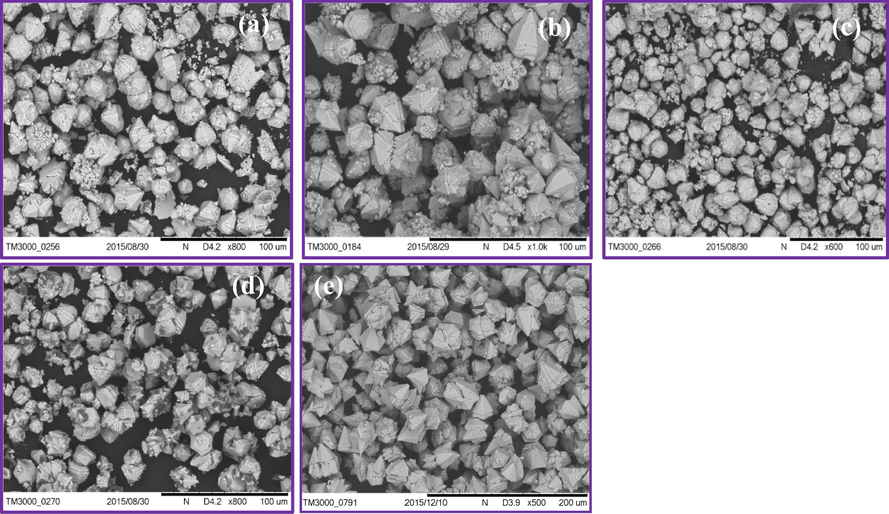
Formation of cone-like structures of ZnO: Nd3+ with 30 ml of A.V. and 24 kHz ultrasonication power at different temperatures (a) 313 K (b) 323 K (c) 233 K (d) 343 K (e).
Schematic illustration of formation of Cone-like structures of ZnO:Nd3+ at different temperatures.
Fig. 14 shows the FTIR spectra of pure and Nd3+ (0.5–9 mol %) doped ZnO NPs. The spectra exhibit significant absorption bands at 3748, 1218 and 772 cm−1 are due to O—H stretching, H—O—H bending vibrational modes due to the adsorption of moisture and Zn—O stretching vibrations respectively. Fig. 15 shows the TEM and HRTEM images of ZnO: Nd3+ (1 mol %) NPs. TEM images show that the particles were in nano size in the range 45–60 nm. The HRTEM images shows the polycrystalline nature with interplanar spacing of about 0.26–0.32 nm (Fig. 15(b)).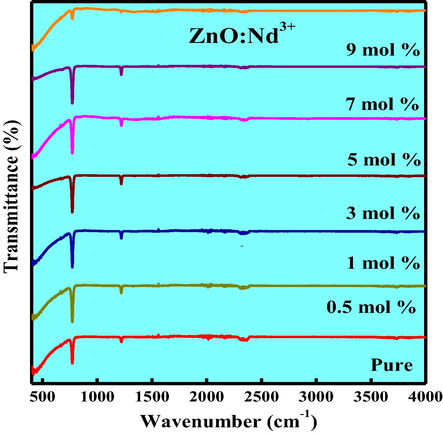
FTIR spectra of ZnO: Nd3+ (0.5–9 mol %) NPs.
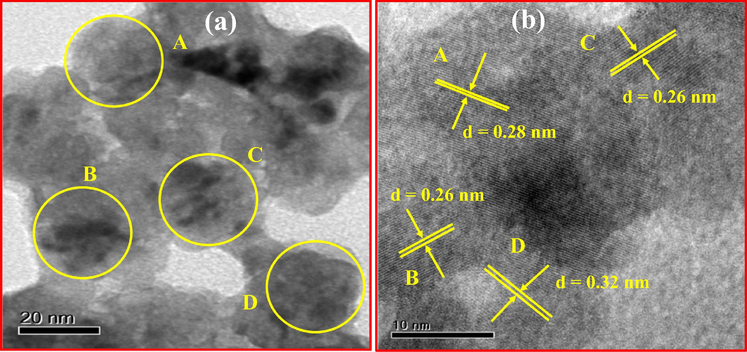
(a) TEM and (b) HRTEM of ZnO: Nd3+ (1 mol %) NPs.
3.3 Photoluminescence (PL) properties
The PL spectra inform surface defects, oxygen vacancies, photo induced charge carrier separation and recombination processes in nano sized semiconductor materials (Kolesnikov et al., 2015). Excitation spectra of the ZnO: Nd3+ NPs under λemi is equal to 459 nm (Fig. 16). Charge transfer band could be estimated using the following equation given by Jørgensen as reported elsewhere (Chen et al., 2015). For χ (Zn2+) = 1.65 and χ(Nd3+) = 1.14, the calculated CT position should be 15,300 cm−1, the measured positions of CT bands in the excitation spectra of obtained samples were at around 653 nm. But in the present case no CT band was observed. This uncommon phenomenon indicates that no efficient radiative energy transfer occurs between activator and host. PL emission spectra of ZnO: Nd3+ (0.5–9 mol %) phosphor excited by 421 nm at RT was shown in Fig. 17. The spectra exhibits strong near ultraviolet emission peaks at 444, 459, 484 nm and broad green emission centered at about 520 nm which corresponds to 2P3/2 → 4I13/2, 2P3/2 → 4I15/2, 2P1/2 → 4I11/2 and 4G7/2 → 4I9/2 transitions, respectively and these were the emission bands were the characteristic peaks of Nd3+. The near ultraviolet emission results from exciton recombination corresponds to the near edge emission of ZnO. The ultraviolet emission was closely connected with the density of free exciton in ZnO phosphor. Variations of PL intensities with respect to Nd3+ concentration were as shown in Fig. 18. The PL intensity increases up to 1 mol % and after that it diminishes due to the concentration quenching. Addition of 1 mol % of Nd3+ in ZnO, the crystalline quality increases leads to increase in the density of free excitons. The similar results were also observed in Mg and Al doped ZnO nanostructures (Giri and Chakrabarti, 2016). At higher concentration, the distance between the activator Nd3+ ions decreases which leads to the non-radioactive energy transfer among Nd3+ ions. In this context, the critical distance (Rc) was estimated and found to be ∼2.99 Å (Ramakrishna et al., 2016a,b). For Nd3+ ions, calculated value of Rc was less than 5 Å leads to the multipole–multipole interaction in the ZnO host. From Dexter and Schulman (Vinod et al., 2014; Venkataravanappa et al., 2016) statements, multi- polar interaction intensity can be resolved based on the change in the emission intensity from the emitting level that has multipolar interaction. The curve of log I/χ v/s. log χ in ZnO: Nd3+ phosphor was shown in Fig. 19 and which clearly shows that the relation is approximately linear and the value of slope was ∼−1.54. The calculated value Q was found to be 4.62 is almost equal to 5. This result indicates that the charge transfer mechanism was due to d–d interaction for the concentration quenching transition of ZnO: Nd3+ NPs.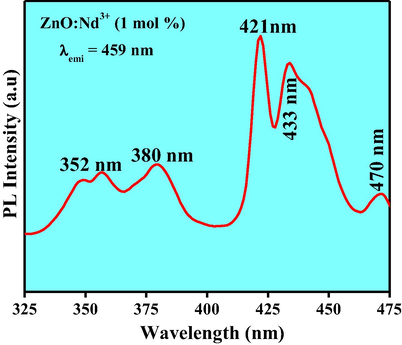
Excitation spectrum of ZnO:Nd3+ (1 mol %) NPs.
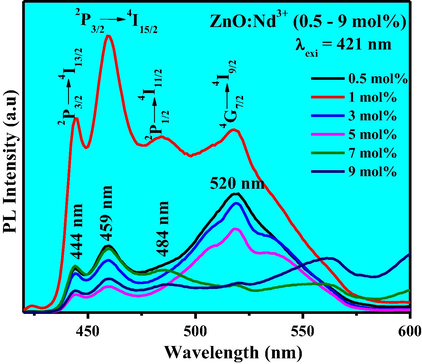
Emission spectra of ZnO:Nd3+ (0.5–9 mol %) NPs excited at 421 nm.
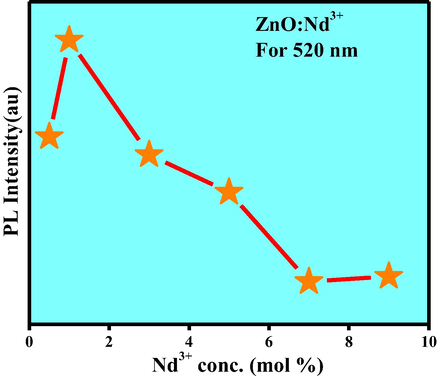
Variation PL intensity with concentration of Nd3+(0.5–9 mol %) in ZnO NPs.
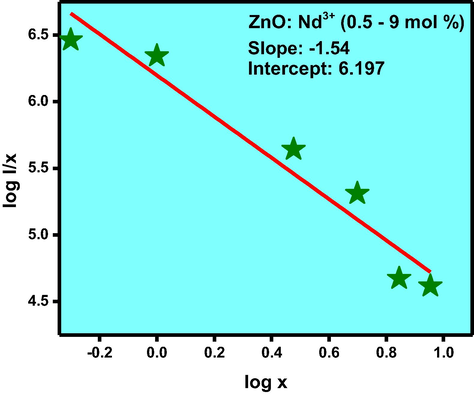
Relation between log(x) and log (I/x) in ZnO: Nd3+ (0.5–9 mol %) NPs.
The quantum efficiency (QE) of ZnO: Nd3+ (5 mol %) is estimated by the relation
The estimate CIE values using PL spectra were tabulated in Table 4. From Fig. 20(a) it was observed that the position of the colour coordinates were tuned from blue to pale green region by increasing the concentration of Nd3+ ions as a dopant (Schanda and Danyi, 1977). The CCT was estimated and by determining the temperature of the closest point of the Planckian locus to the light source on the (U0, V0) uniform chromaticity diagram (Fig. 20(b)).
Nd3+ (mol %)
CIE
CCT
CCT (K)
CRI (%)
X
Y
U′
V′
0.5
0.1668
0.4336
0.0847
0.4958
7800
88.13
1
0.1539
0.2801
0.1016
0.4165
7161
90.12
3
0.1664
0.4064
0.0882
0.4848
6855
91.00
5
0.1726
0.5205
0.0775
0.5263
6632
92.48
7
0.1546
0.3630
0.0877
0.4636
7394
93.16
9
0.1510
0.3221
0.0920
0.4417
6937
94.78
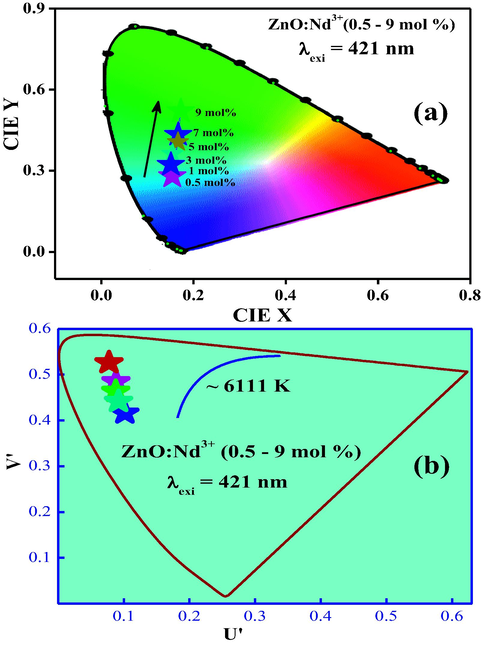
(a) CIE, (b) CCT diagram of ZnO:Nd3+ (0.5–9 mol %) NPs.
Also, the quality of white light in terms of colour correlated temperature (CCT) was given by McCamy empirical formula (theoretical) where ; the inverse slope line and chromaticity epicenter was at xc = 0.3320 and yc = 0.1858 (Ramakrishna et al., 2016a,b). Generally, a CCT value greater than 5000 K indicates the cold white light used for commercial lighting purpose. The obtained CCT value (6111 K) for the near white light emitting phosphor agrees with the CCT value of standard daylight at noon (D65, 6500 K) suitable for cold near white light emission. Calculated values of CCT for each sample was summarized in Table 4 and were in acceptable range and can be considered ‘‘warm’’ in appearance. Any NPs can be distinguished by their dominant wavelength and colour purity. The colour rending index (CRI) values (Table 4) varied very close to 93.38% indicates that the prepared phosphor materials may be excellent materials for WLED applications.
3.4 Antibacterial assay of ZnO-Nd3+ NPs
The present investigation focuses on pathogenic bacteria that were noteworthy medical implications. These pathogenic microorganisms were accountable for numerous diseases, cases of hospital infection, colonization of medical devices and also reported for the ability to acquire resistance (Sanchez et al., 2013; Toledo et al., 2012). MIC and MBC values of all the synthesized samples against bacteria were shown in Table 5 and Fig. 21. ZnO: Nd3+ NPs showed significant inhibition against E. coli, K. pneumoniae, P. aeurginosa and S. Aureus with discrete differences in the susceptibility to ZnO-Nd NPs in a dose-dependent manner. The MICs observed for the Gram-positive bacteria, Staphylococcus aureus with 0.0025 μg/mL (Table 5). For the Gram-negatives, ZnO-Nd NPs presented a MIC 0.025 μg/mL for E. coli, 0.0025 μg/mL for K. pneumoniae (the lowest observed in the Gram-negative bacteria) and 0.025 μg/mL for P. aeruginosa with NPs prepared with A.V. (1 ml), it also presents a higher potency compared to all other conditions (Table 5).
Organism
Nd3+ Conc. (mol %)
K. pneumoniae
S. aureus
P. aeuroginosa
E. coli
ZnO Pure
MIC
0.25
2.5
2.5
2.5
MBC
2.5
25
25
25
0.5
MIC
0.025
0.0025
0.25
2.5
MBC
0.25
0.025
2.5
25
1
MIC
0.0025
0.0025
0.025
0.25
MBC
0.025
0.025
0.25
2.5
3
MIC
0.025
0.25
0.25
0.25
MBC
0.25
2.5
2.5
2.5
5
MIC
0.25
2.5
0.25
2.5
MBC
2.5
25
2.5
25
7
MIC
2.5
0.025
2.5
2.5
MBC
25
0.25
25
25
9
MIC
0.25
0.25
0.25
0.025
MBC
2.5
2.5
2.5
0.25
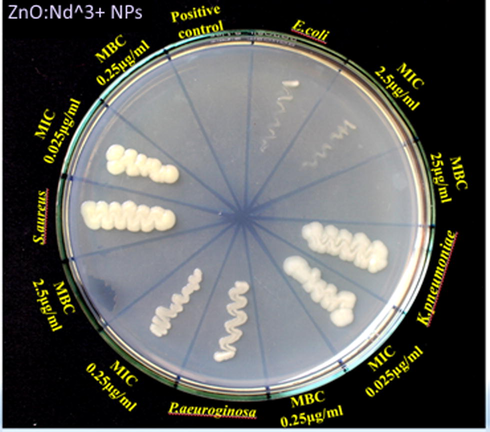
MIC and MBC values of ZnO:Nd3+ NPs synthesized using Aloe vera (1 ml).
In relation to MBC test, K. pneumonia again showed a higher susceptibility to ZnO-Nd NPs (0.025 μg/mL) than to E. coli (0.25) and P. aeruginosa with 0.25 μg/mL and to Staphylococcus aureus with 0.025 μg/mL with NPs prepared with A.V. (1 ml) and it was showed identical results to the MIC test for both the agents. However, NPs prepared with different volume of extract were having higher than the above mentioned concentrations (Table 5). This outstanding antibacterial activity of ZnO: Nd3+ NPs was due to the high surface area to volume ratio of NPs and reactive oxygen species production (Navale et al., 2015).
3.5 Antifungal activity of ZnO-Nd NPs
ZnO-Nd NPs showed the inhibitory effect on the growth of Alternaria alternata and Fusarium oxysporum that were cultured on SDA containing different concentrations of ZnO: Nd3+ NPs (100, 200, 300, 400, 500, 600 and 7000 μg/mL) incubated at 298 K for 7 days (Figs. 22–24). Commonly, the use of ZnO: Nd3+ NPs suspension was effective in inhibiting fungal growth for both Alternaria alternata and Fusarium oxysporum. The average growth of Alternaria alternate and was inhibited by from 91.77% in terms of colony growth diameters after 7 days of incubation as the concentration of ZnO: Nd3+ NPs increased from 100 to 700 μg/mL with a near complete inhibition at 700 μg/mL (Table 6). For Fusarium oxysporum, the reduction rate of fungal growth varied from 92.95% as the concentration of ZnO-Nd NPs increased from 100 to 700 μg/mL with a near complete inhibition at 700 μg/mL. Significant difference was found for different concentrations of ZnO: Nd3+ NPs treatment (P < 0.05). These results indicate that ZnO: Nd3+ NPs at concentration greater than 700 μg/mL can significantly inhibit the growth of the fungi, Alternaria alternata and Fusarium oxysporum.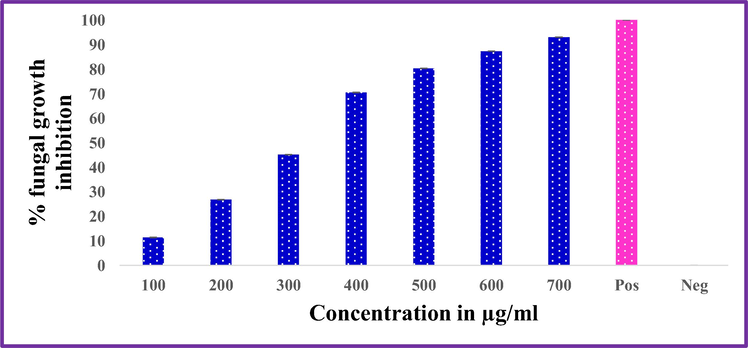
Inhibitory effect of ZnO Nd3+ NPs against Alternaria alternata.
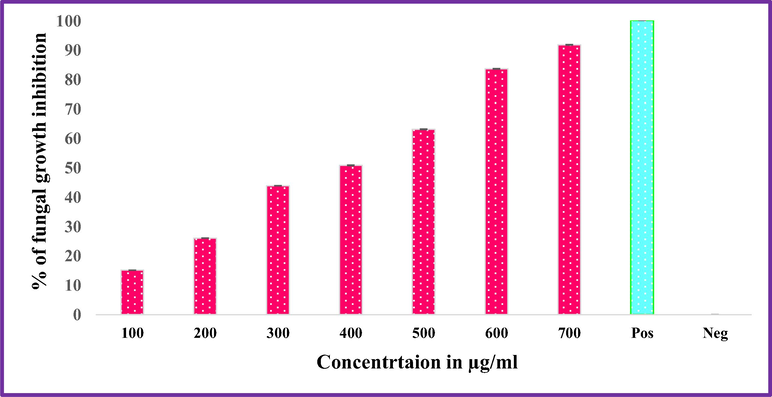
Inhibitory effect of ZnO:Nd3+ NPs against Fusarium oxysporum.
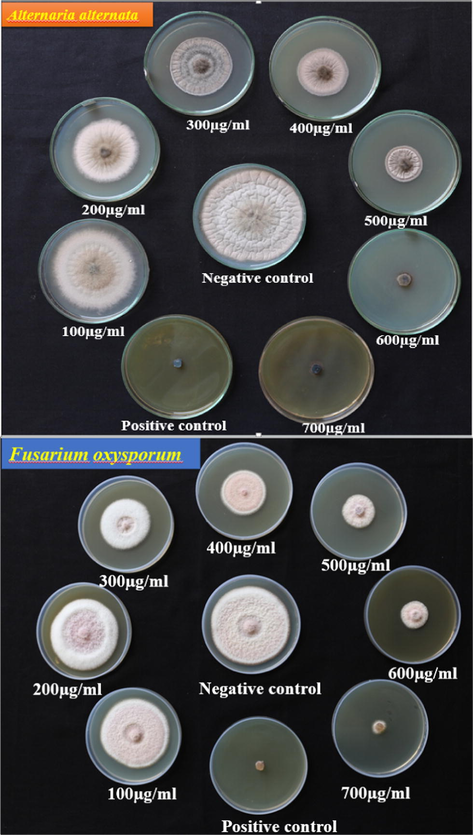
Antifungal activity of ZnO:Nd3+ NPs against Plant pathogenic fungi Alternaria alternata and Fusarium oxysporum.
Concentration in µg/ml (ZnO Nd)
Fusarium oxysporum
Alternaria alternata
100
11.26 ± 0.1154
15.06 ± 0.0333
200
26.76 ± 0.0577
26.02 ± 0.0577
300
45.07 ± 0.0667
43.83 ± 0.0577
400
70.42 ± 0. 0577
50.68 ± 0.1201
500
80.28 ± 0. 0577
63.01 ± 0.1201
600
87.38 ± 0. 0577
83.56 ± 0.1201
700
92.95 ± 0.0577
91.778 ± 0.1154
Positive control
100
100
Negative control
0
0
4 Conclusions
ZnO: Nd3+ (0.5–9 mol %) NPs prepared by bio-surfactant assisted ultrasound method. The growth mechanism for various SS formation was proposed with egg box concept. The use of A.V. helped in tuning the morphology of ZnO:Nd3+ samples due to the preferential adsorption of polysaccharides, resulted in a hexagonal like shapes. In addition, improved crystallization with less process time and energy consumptions was observed when compared to the other conventional techniques. Photometric properties of prepared NPs by ultrasound route can be highly useful for display and solid state lightning applications. Nanobactericides and nanofungicides can be obtained in a cost-effective manner and are suitable for articulating new categories of nanoantibiotics. These constituents would be used as an innovative, ecofriendly, antimicrobial for diverse bacterial and mycopathogenic organisms of humans and plants. ZnO:Nd3+ NPs prepared using A.V. gel of 1 ml showed better antibacterial and antifungal activities against the selected well known pathogenic bacteria and fungi.
Acknowledgement
The author Dr. H Nagabhushana thanks to DST Nano Mission New Delhi for the sanction of this Project.
We deeply acknowledge the contributions of our co-author Late Dr. M. K. Sateesh. Let his soul rest in peace in the feet of almighty.
References
- Ceram. Int.. 2016;42:3563-3568.
- Renew. Sustainable Energy Rev.. 2016;59:726-737.
- Optik. 2016;127:4281-4286.
- J. Photochem. Photobiol., B. 2015;149:143-148.
- Optik.. 2015;126:1745-1756.
- Micropor Mesopor Mat.. 2008;110:553-559.
- J. Mol. Catal. A Chem.. 2015;409:26-41.
- J. Mol. Catal. A Chem.. 2015;409:26-41.
- Anal. Biochem.. 2012;430:16-23.
- Chen, W., Hou, Yi, Osvet, Andres, Guo, Fei, Kubis, Peter, Batentschuk, Miroslaw, Winter, Benjamin, Spiecker, Erdmann, Forberich, Karen, Brabec, Christoph J.. 2015. Org. Electron. 19, 113–119.
- Mater Sci. Semicond. Process.. 2016;45:9-16.
- Mater Charact.. 2016;114:185-196.
- Ultrason. Sonochem.. 2016;28:169-177.
- Ceram. Int.. 2014;40:7957-7963.
- Superlattices Microstruct.. 2016;93:248-260.
- Sensor Actuat B-Chem.. 2016;221:104-112.
- Appl. Surf. Sci.. 2016;369:151-158.
- Phys. Lett. A.. 2016;380:1551-1555.
- Ultrason. Sonochem.. 2015;22:371-381.
- Ultrason. Sonochem.. 2015;23:219-230.
- Ultrason. Sonochem.. 2015;27:379-388.
- Ultrason. Sonochem.. 2016;29:146-155.
- ACS Sustainable Chem. Eng.. 2015;6:1066-1080.
- Mater. Res. Bull.. 2015;70:799-803.
- Cryst. Growth Des.. 2014;14:4068-4079.
- Liu, X., Huang, Wenyi, Cheng, Hao, Huang, Bangbiao, Bai, Dawei, Fu, Fengming, Wu, Hongda, Li Lijun, 2015. Appl. Surf. Sci. 356, 240–248.
- Nano Energy.. 2016;24:165-188.
- Spectrochim. Acta, Part A.. 2016;152:404-416.
- Ceram. Int.. 2016;42:7482-7489.
- J. Alloys Compd.. 2015;633:237-245.
- Appl Catal B-Environ.. 2016;185:11-21.
- Nano-Struct. Nano-Objects.. 2015;1:7-14.
- Nagabhushana, H., Basavaraj, R.B., Daruka Prasad, B., Sharma, S.C., Premkumar, H.B., Udayabhanu, Vijayakumar, G.R., 2016. J. Alloys Compd. 669, 232–239.
- J. Sci Med .Nanotechnol. Nanomed.. 2015;3:2-9.
- Mater. Sci. Eng., C. 2016;61:728-735.
- Chem. Phys. Lett.. 2010;498:317-322.
- J. Crys. Gro.. 2014;406:31-42.
- Appl Surf Sci.. 2015;356:762-768.
- Optik.. 2016;127:5310-5315.
- Optik.. 2016;127:2939-2945.
- Prog. Mater. Sci.. 2016;82:294-404.
- Spectrochim. Acta Part A.. 2015;136:864-870.
- Ind. Crops. Prod.. 2015;76:298-305.
- Emerg. Infect. Dis.. 2013;19:133-136.
- J. Lumin.. 2016;169:196-203.
- Color Res. Appl.. 1977;2:161-163.
- Ceram. Int.. 2015;41:967-975.
- Ultrason. Sonochem.. 2015;27:466-473.
- Ultrason. Sonochem.. 2012;19:750-755.
- Siraj, K., Hashmi, Jaweria Z., Shahzad, N., Muhammad, S.R., Saima, S., 2015. Mater Today 2, 5365–5372.
- Mater. Lett.. 2016;176:139-142.
- Ceram. Int.. 2016;42:5001-5010.
- Ceram. Int.. 2016;42:9648-9652.
- Mater. Sci. Semicond. Process. 2015;31:446-454.
- J. Hosp. Infect.. 2012;80:351-353.
- Ultrason. Sonochem.. 2016;33:226-239.
- Chem. Eng. J.. 2014;255:541-552.
- Mater. Sci. Eng. B.. 2007;139:216-220.
- Sens. Actuators, B: Chem.. 2014;195:549-561.
- J. Power Sourc.. 2016;305:1-9.
- Optik.. 2015;126:4397-4400.
- J. Mater. Chem.. 2012;22:17700-17708.


