

Translate this page into:
Capillary column inverse gas chromatography to determine the thermodynamic parameters of binary solvent poly (styrene-block-butadiene) rubber systems
⁎Corresponding author. taouak@ksu.edu.sa (Taïeb Aouak)
-
Received: ,
Accepted: ,
This article was originally published by Elsevier and was migrated to Scientific Scholar after the change of Publisher.
Abstract
Capillary column inverse gas chromatography (CCIGC) was adapted to determine the thermodynamic properties of poly (styrene-co-butadiene) rubber (SBR) and various molecules, including aliphatic alkanes (C6, C7 and C8), alicyclics (C5 and C6)), aromatics (benzene and toluene), ethanol, tetrahydrofuran and acetonitrile. Capillary column inverse gas chromatography (CCIGC) was adapted to determine the thermodynamic properties of poly (styrene-co-butadiene) rubber (SBR) and various molecules, including aliphatic alkanes (C6, C7 and C8), alicyclics (C5 and C6)), aromatics (benzene and toluene), ethanol, tetrahydrofuran and acetonitrile. The results obtained were compared with those of the literature determined by packed column (PCIGC) and by other methods. It was revealed that the values of the heat of vaporization and the Hansen solubility parameter determined by CCIGC in some cases agree well with those of the literature, while in other cases deviates significantly. The comparison of the values of the literature obtained by PCIGC determined by different authors, significant differences were also observed in certain cases. This gap is undoubtedly related to the experimental errors occurred during the support treatment and/or during the preparation of the column. The activity coefficients of the solvents at infinite dilution were calculated and compared with those obtained by fitting the non-random two-liquid and universal quasichemical models.
Keywords
Inverse gas chromatography
Capillary column
Poly(styrene-block-butadiene) rubber
Thermodynamic parameters
Nonrandom two-liquid model
Universal quasichemical model

- CCIGC
-
Capillary column inverse gas chromatography
- Ev(i)
-
Cohesion energy of the solvent
- T
-
Column temperature
- Tc
-
Critical temperature
- Vc
-
Critical volume
- ρp
-
Density of polymer at T
- ρ1
-
Density of the solvent
- DSC
-
Differential scanning calorimetry
- β
-
Entropic factor
- Tf
-
Flow meter temperature
- Q
-
Flow rate
- χ
-
Flury-Huggins interaction parameter
- Tg
-
Glass transition temperature
- δp
-
Hansen solubility parameter of polymer
- δi
-
Hansen solubility parameter of the solvent
- ΔHdiss
-
Heat of dissolution of molecule i
-
James-Martin gas-compressibility correction factor
- Kp
-
Partition coefficient
- α
-
Linear thermal expression coefficient
- ws
-
Mass of polymer
- Tm
-
Melting temperature
- ΔHs(i)
-
Molar heat of sorption of molecule i
- M1
-
Molar mass of solvent
-
Molar volume of solvent
- Mp
-
Mp: Molar mass of the polymer
- VN
-
Net retention volume
- NRTL
-
Non-random two-liquid
- rs
-
Number of segment in the polymer chain
- PCIGC
-
Pack-ed column inverse gas chromatography
- SBR
-
Poly(styrene-block-butadiene) rubber
- ε
-
Polymer thickness film
-
Polymer-solvent Flury-Huggins interaction parameter
- Po
-
Pressure in outlet of the column
- Pi
-
Pressure in the inlet of the column
- r
-
Radius of the capillary column
- tm
-
Retention time of methane
- tR
-
Retention time of probe molecule
- SEM
-
Scanning electron microscopy
- B11
-
Second Virial coefficient
-
Specific retention volume
- μ1
-
Start time of the peak
- TGA
-
Thermogravimetric analysis
- UNIQUAC
-
Universal quasichemical
-
Vapor pressure of solvent
Abbreviations
1 Introduction
The compatibility of polymer–solvent systems is extremely important for determining the suitability of a polymer for a given application. The widely used model for studying polymers in solutions is based on the Flory–Huggins theory (Flory, 1941), where the main objective is to estimate the polymer–solvent interaction parameter, χ. This unit-less entity is used to characterize the thermodynamic state of a mixture of a polymer and solvent or another polymer. In all cases, the interaction between a polymer and another compound plays a significant role (Horta and Pastoriza, 2005).
The determination of interaction parameters has been a subject of extensive research. For “solvent–polymer” systems, a large number of techniques and parameters, including the vapor pressure of the solvent, osmotic pressure, equilibrium of sedimentation, diffraction of light at small and large angles, and swelling (Flory, 1941) and inverse gas chromatography (IGC) are employed to determine these interaction parameters (Mohammadi-Jam and Waters, 2014; Voelkel et al., 2009). IGC is among the most efficient techniques for estimating the thermodynamic properties of polymers, solvents, and polymer–solvent and polymer–polymer systems. Additionally, ICG is regarded as the simplest, fastest, and most precise technique to perform physicochemical measurements on various nonvolatile materials in different forms and morphologies, including modified silica, glass fibers, and certain pharmaceutical products in the form of powders (Conder and Young, 1979). However, IGC is the preferred technique for polymers and has a wide range of applications (Mohammadi-Jam and Waters, 2014). ICG allows the rapid and precise estimation of the Hansen solubility parameters for solvents and polymers and for polymer–solvent and polymer–polymer systems. Moreover, IGC has been used to determine various other polymer properties, such as the glass-transition temperature, degree of crystallinity, activity coefficients, and adsorption isotherms (Guillet and Al‐Saigh, 2006). In our previous work, we used IGC to validate pervaporation results (Hadj-Ziane et al., 2005; Moulay et al., 2006).
IGC can be performed in two different modes: (1) infinite dilution (where Henry’s law is valid) and (2) finite concentration. IGC at infinite dilution (IGC ID) involves injecting very small quantities of probe molecules (at the limit of detection) to neglect interactions between the adsorbed molecules (Voelkel et al., 2009). IGC ID allows the determination of the thermodynamic quantities of the interactions developed between the polymer and molecules with which it is brought into contact. Therefore, ICG is among the simplest techniques for measuring the solubility and diffusivity of polymer systems with ID and polymer systems using filled and capillary columns. However, the filled-column model, which was initially employed by Gray and Guillet (Gray and Guillet, 1973), has the following disadvantage: non uniform distribution of polymer; moreover, the contribution of the factor linked to the adsorption of the support is not always negligible. Consequently, this method yields less-precise values for evaluating diffusion coefficients and sorption. As a result, the reported values of the intrinsic thermodynamic parameters related to a same solute in terms of the vaporization heat and solubility parameter determined by packed-column IGC (PCIGC) using different stationary phases sometimes differ (Cai et al., 2002; Diez et al., 2011; DiPaola-Baranyi, 1982; Hadj-Ziane et al., 2005; Ugraskan et al., 2020). This is mostly due to the effect of the adsorption of the support. To minimize this effect, the support must be perfectly inert and uniformly impregnated by the stationary phase.
However, taking into account the phenomenon of friction between the impregnated particles during the preparation of the column and the filling of the column, the minimization of errors in the determination of the weight of polymer in the column is not always ensured.
However, given the friction phenomenon between the impregnated particles during column preparation and column filling, the minimization of errors in the determination of the weight of polymer inside the column is not guaranteed every time. Moreover, such effects have been highlighted during the determination of the Flory–Huggins interaction parameters involving miscible blends using PCIGC. Indeed, it was revealed that the Flory–Huggins parameters vary according to the nature of the probe molecule (Al‐Ghait et al., 2012; Etxeberria et al., 1994; Huang, 2006), but in principle, this should not be assumed. In such a case, if this occurs, it is only because of the phenomenon of adsorption linked to the support. Indeed, the adsorption of the support depends on the nature of the adsorbed probe molecule; therefore, its effect is projected on the values of these parameters. Using a capillary column in which the polymer is more uniformly deposited on the walls of the column, Pawlisch et al. (Pawlisch et al., 1988; Pawlisch et al., 1987) proposed a more precise method for measuring these coefficients. Since then, capillary column IGC (CCIGC) has frequently been employed to study the transport and thermodynamic properties of polymer–solvent systems with ID (Balashova et al., 2001; Cai et al., 2002; Huang, 2006; Huang, 2004). The principle of this technique is based on the distribution of the volatile solvent between the gaseous mobile phase and stationary phase comprising the polymer. The most important factor is to determine the partition coefficient, KP, which is the ratio of the concentration of the solvent in the polymer phase to that of the solvent in the vapor phase.
Poly(styrene-co-butadiene) rubber (SBR) is an elastomer that exhibits excellent chemical, thermal, and mechanical stabilities. These properties enable SBR to be widely used in the rubber industry as latex for rubber adhesives and supports for carpets, belts, floor coverings, wires, and cables for installations (Chahal et al., 2012). Therefore, the knowledge of the thermodynamic properties of the SBR solution undoubtedly make it suitable for applications in other fields.
The contributions of this study include the importance of CCIGC for determining the thermodynamic properties of polymers and solvents and to minimize the experimental errors mainly due to the support treatment and/or column preparation used in the PCIGC method. In this work the CCICG technique is applied to estimate the solubility parameters of solvents and SBR. To achieve these objectives, a capillary column that was covered on its inside surface with a thin layer of SBR as the stationary phase was prepared via the casting method. This column was used to estimate the retention volumes of the solvents used as probes, the activity coefficients, polymer–solvent interactions, and solubility parameters of the copolymer and solvents were determined at different temperatures.
2 Materials and methods
2.1 Materials
SBR ( = 6.0·105 g∙mol−1) containing 45% styrene, cyclopentane (97% purity), toluene (99.5% purity), and ethanol (99.9% purity) was supplied by Sigma-Aldrich (Munich, Germany). n-Octane, n-heptane, acetonitrile, benzene, tetrahydrofuran (THF), and propanol were purchased from Panreaca Quimica SA (Barcelona, Spain). n-Hexane (99% purity) and cyclohexane (99% purity) were provided by Fluka (Buchs, Switzerland). All chemicals were used without further purification.
2.2 Characterization
Knowing the thermal properties, such as the glass-transition, melting, and degradation temperatures, of the polymer constituting the stationary phase is essential in the chromatography domain because these parameters determine the limit under which the column can be conditioned and used. We previously investigated the thermal properties of SBR via differential scanning calorimetry (DSC) and thermogravimetric analysis (TGA) (Benguergoura and Moulay, 2012). The profile of the DSC chromatogram of the terpolymer revealed that the glass-transition temperature, Tg, and melting temperature, Tm, were −55 °C and 246 °C, respectively, and its thermal decomposition, as determined by the TGA, started at 375 °C.
The uniformity of the internal coating and average film thickness were estimated by scanning electron microscopy (SEM) analyses using a JSM-6060LV microscope (JEOL, Tokyo, Japan), and the samples were coated with a gold grid.
2.3 Column preparation
A Supelco-type capillary column comprising fused silica of intermediate polarity (internal diameter, 0.35 mm; length, 30 m) was filled with 0.2 w/v% solution of SBR using a syringe pump according to a previously described dynamic filling procedure (Ugraskan et al., 2020). The column was maintained at a constant temperature by placing it in an oven specially modified for the purpose of allowing the solvent to slowly evaporate and form a uniform coating.
Fig. 1 shows the micrographs of the cross-sections of a virgin and SBR-coated capillary column. The cross-section of the SBR-coated capillary column showed a thin additional layer of SBR with a thickness varying between 1.53 and 1.64 μm according to the measurements of different sections, thus revealing that the capillary column was successfully prepared. Similar thickness is usually used in IGC (Bonifaci et al., 1994; Tihminlioglu and Danner, 1999).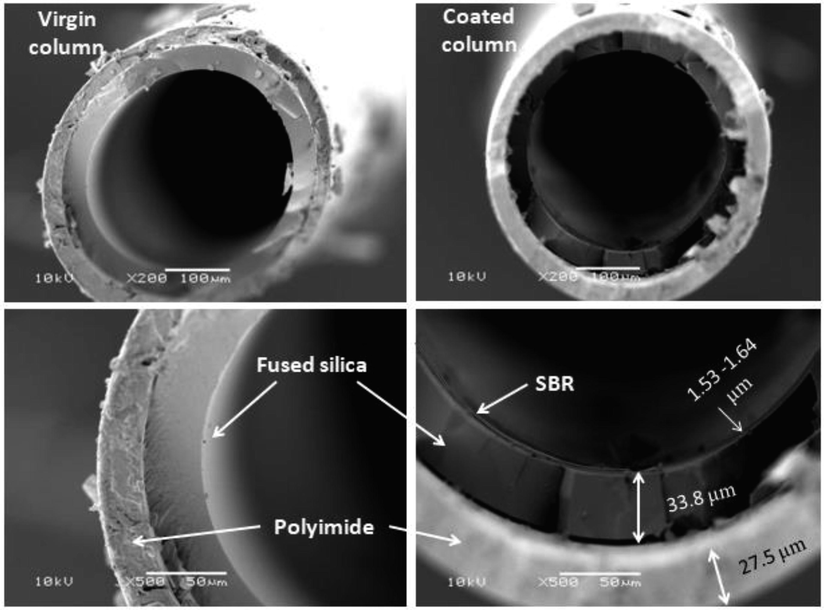
SEM micrographs of cross-sections of a virgin and SBR-coated capillary column.
Prior to use, the column was conditioned at 250 °C under a slow carrier-gas flow for 24 h. The flow rate (4 mL∙min−1) was controlled with a soap-bubble flowmeter for all the probes injected at room temperature (∼25 °C).
2.4 Retention volume measurements
We used a gas chromatograph-type 17A column (Shimadzu, Kyoto, Japan) equipped with a flame ionization detector to measure the retention volume. Injection was performed using a 5-μL Hamilton syringe (Hamilton, Reno, NV, USA) and 1.0 μL of each molecular probe in its vapor state for each analysis, and the experiment was conducted thrice for each solvent and temperature combination. The arithmetic average of the retention times of the repeated injections (with errors of ± 0.1 min) was used to calculate the retention volume. The net retention volume, VN, was calculated from the collected retention times of the studied probes using the following equation (Ugraskan et al., 2020):
The specific retention volume is vital in the calculation of thermodynamic parameters. For all molecular probes, the specific retention volume was calculated using Eq. (3), as adapted from Yampolskii et al. (Yampolskii and Belov, 2015) on the basis of the Davankov works (Domínguez et al., 2001), which was taken as the basis for novel official IUPAC recommendations:
The retention time can be determined either from the top of the peak or its first appearance in the chromatogram. According to previous studies (Balashova et al., 2012; Davis et al., 2004; Eser and Tihminlioglu, 2005), both methods yield precise values with regard to thermodynamic or transport properties for polymer–solvent systems. Several models exist for estimating the retention time based on the mathematical processing of elution data that correspond to the chromatographic peak of a theoretical concentration profile, generally by means of the Laplace transform. The simplest method is that employing the distribution of retention times by analogy with the distribution of the residence-time [Eq. (4)] and the partition coefficient, Kp, expressed by Eq. (4) (Balashova et al., 2012), which is the ratio of the concentration of the solvent in the polymer phase to that of the solvent in the gas phase.
Beyond Tg + ∼20 °C, as in the case of SBR (Tg = −55 °C), the linearity presumes the dissolution equilibrium of the solvent in the polymer, whose heat of dissolution,
, is directly deduced from the slope of the straight line, as expressed by Eq. (9):
2.5 Determination of the weight-fraction activity coefficient
According to Braum and Guillet (Gray and Guillet, 1973), the weight-fraction activity coefficient at infinite dilution,
is expressed by Eq. (10):
2.6 Determination of the Flory–Huggins interaction parameters
The Flory–Huggins interaction parameter,
, is used to measure the strength of interactions and, therefore, as a guide in the prediction of polymer–solvent compatibility. According to Gray and Guillet (Gray and Guillet, 1973), this parameter is related to the weight-fraction activity coefficient as follows:
Theoretically, the Flory interaction parameter decreases with increasing temperature (Flory, 1941). For a polymer–solvent binary system, the parameter is the sum of the two contributions depending on the temperature, the entropic parameter related to the free volume of the solvent (which increases with temperature), and the enthalpic parameter related to the intermolecular forces between the polymer and solvent (which decreases with temperature). Therefore, the overall dependence is determined by the predominant effect (Diez et al., 2011). According to the Flory–Huggins theory, a polymer is soluble in a given solvent if the value of such a system is < 0.5 (Balashova et al., 2012), and it becomes more soluble as this parameter approaches zero. For a close to 0.5, the polymer is only soluble in the solvent at a certain temperature (called θ-temperature), and such a solvent is called θ-solvent.
2.7 Determination of solubility parameters
2.7.1 Solubility parameters of solvents
The solubility parameter,
, of a compound, i, is related to the square root of the cohesion energy of i,
, which is also related to the heat of vaporization of i.
is then calculated as follows (Zhu et al., 2019):
The data used to determine the different thermodynamic parameters adapted from the literature are listed in Table 1.
(g∙ml−1)a
V1a (cm3∙mol−1)
M1a (g∙mol−1)
B11b
Temperature (oC)
30
40
50
60
70
n-Hexane
0.654
131.76
86.17
−12.37
−11.68
−11.05
−10.47
−9.94
n-Heptane
0.684
146.49
100.20
−13.68
−12.98
−12.22
−11.58
−11.00
n-Octane
0.703
162.49
114.23
15.13
−14.29
−13.53
−12.82
−12.17
Cyclopentane
0.751
93.38
70.13
−10.81
−10.21
−9.66
−9.15
−8.68
Cyclohexane
0.779
108.03
84.15
−12.25
−11.57
−10.95
−10.38
−9.85
Benzene
0.879
89.17
78.11
−11.28
−10.65
−10.08
−9.55
−9.07
Toluene
0.866
106.39
92.13
−12.93
−12.21
−11.56
−10.95
−10.4
THF
0.889
81.11
72.10
−9.96
−9.41
−8.90
−8.43
−8.01
Methanol
0.791
40.50
32.04
−10.77
−10.17
−9.12
−9.12
−8.65
Ethanol
0.789
58.38
46.06
−10.65
−10.06
−9.51
−9.02
−8.56
Propanol
0.803
74.83
58.07
−11.56
−10.92
−10.33
−9.79
−9.29
Acetonitrile
0.786
52.23
41.05
−13.76
−12.99
−12.29
−11.65
−11.06
2.7.2 Solubility parameter of SBR
According to the Flory–Huggins theory modified by Blanks and Prausnitz (Blanks and Prausnitz, 1964), the interaction parameter,
can be calculated from the difference between the solubility parameter of the solvent,
and that of the polymer,
according to the following equation:
This gives access to the polymer-solubility parameter, , which can be easily determined from the slope and intercept at the experimental temperature of the curve, indicating the variation of the left-hand side of this equation versus
3 Results and discussion
3.1 Determination of thermodynamic parameters
The specific retention volume,
, of each of the investigated solvents was calculated from the retention time at 30 °C, 40 °C, 50 °C, 60 °C, and 70 °C, which are remarkably higher than the Tg obtained from the top of the chromatogram peak and Eq. (3). The results obtained are listed in Table 2. Additionally, we determined the
of the solvents using the first moment of the elution peak, with similar results obtained with an error percentage of < 3%. The reported values of
refer to the average of the three measurements. In all cases, the standard deviation did not exceed 2.0% of the reported value. As shown in Table 1, the
of each molecular probe decreased as the temperature increased.
Solvent
30 °C
40 °C
50 °C
60 °C
70 °C
n-Hexane
133.72
91.29
63.93
44.70
32.27
n-Heptane
199.51
132.23
83.08
58.89
40.94
n-Octane
184.27
119.87
79.47
53.82
37.31
Cyclopentane
311.93
207.38
135.13
94.85
65.60
Cyclohexane
276.26
188.26
120.26
81.57
54.99
Benzene
311.27
210.02
146.55
105.93
76.84
Toluene
335.38
220.55
147.19
107.64
79.19
Ethanol
13.80
10.96
11.64
11.09
11.80
THF
332.36
200.74
131.47
87.46
60.96
Acetonitrile
24.48
17.58
13.26
10.40
8.33
We then calculated the activity coefficient at ID of solvent
from the
values at the same temperatures using Eq. (10) (Table 3). The data revealed that the weight-fraction activity coefficient varied along with temperature and depending on the nature of the molecular probe. Furthermore, the
of the alkanes slowly fluctuated, whereas those of the aromatics and acetonitrile slowly decreased, that of ethanol significantly decreased, and that of THF slowly increased. This could be attributed to the polarity of the molecular probes; the
of ethanol was reduced by ∼ 4-fold due to its high polarity. These findings were expected, given that increases in temperature reduces the repulsive interactions between the polymers, nonpolar (SBR), and polar (ethanol) molecules. This is explained by the
values of this system presented in the following section.
Solvent
30 °C
40 °C
50 °C
60 °C
70 °C
n-Hexane
7.23
7.16
7.12
7.28
7.38
n-Heptane
7.63
7.56
8.15
8.01
8.22
n-Octane
8.26
8.34
8.52
8.76
9.02
Cyclopentane
4.88
4.82
5.01
4.97
5.13
Cyclohexane
5.51
5.31
5.63
5.78
6.12
Benzene
4.89
4.76
4.62
4.45
4.38
Toluene
4.54
4.53
4.60
4.38
4.25
Ethanol
110.30
91.23
58.19
42.53
28.52
THF
4.58
4.98
5.15
5.39
5.52
Acetonitrile
62.18
56.85
51.07
45.32
40.38
As shown in Table 3, the values of for polar solvents, such as ethanol and acetonitrile, were higher than those of nonpolar solvents, indicating their incompatibility with regard to the SBR copolymer. Toluene, which has the lowest value, represents the best solvent for this copolymer. Importantly, note that the parameter is strongly dependent on temperature in the case of non polar and weakly-polar solvents.
This observation agrees with that reported by Balashova et al. (Balashova et al., 2001). However, ethanol, which has the highest polarity among all of the probes, is usually used as a precipitant for SBR; its dramatically decreases when the temperature increases. This phenomenon is attributed to the fact that an increase in the temperature of the ethanol–SBR mixture weakens the strong repulsive forces between the hydroxyl group of ethanol and the alkyl groups of the macromolecular segments.
3.1.1 Effect of temperature on the Flory interaction parameters
The
values calculated in this study using Eq. (13) are summarized in Table 4. As expected, these results were consistent with those of
(Table 3), as they are closely and proportionally related to
according to Eq. (13).
well translates the extent of polymer–solvent affinity, as its smaller value translates to greater compatibility. For example, the
for a SBR/toluene system agrees with that reported by previous studies and determined using other techniques (0.38–0.41) (Abd‐El‐Messieh and Abd‐El‐Nour, 2003; Cho et al., 2000; George et al., 1999; Scuracchio et al., 2004; Traeger and Castonguay, 1966). The
for SBR–solvent systems involving cyclohexane, cyclopentane, toluene, and THF range from 0.31 to 0.44, thus revealing moderate affinity for SBR at practically all investigated temperatures. Benzene is considered an θ-solvent; however, ethanol and acetonitrile, having an
largely > 0.5 at all the investigated temperatures, are considered precipitants. n-Hexane and n-heptane are considered non-solvents.
Solvent
30 °C
40 °C
50 °C
60 °C
70 °C
n-Hexane
0.59
0.58
0.57
0.59
0.61
n-Heptane
0.68
0.67
0.75
0.73
0.76
n-Octane
0.79
0.80
0.82
0.85
0.88
Cyclopentane
0.33
0.32
0.36
0.35
0.38
Cyclohexane
0.31
0.28
0.33
0.36
0.42
Benzene
0.49
0.46
0.43
0.39
0.38
Toluene
0.40
0.40
0.41
0.37
0.33
Ethanol
3.50
3.31
2.86
2.54
2.14
Tetrahydrofurane
0.44
0.52
0.55
0.60
0.62
Acetonitrile
2.92
2.83
2.72
2.60
2.49
3.1.2 Effect of the molar mass of the molecular probe on the Flory interaction parameters
Fig. 2 shows the variation in the Flory interaction parameter according to the molar mass and carbon number of the molecular probes. Furthermore, Fig. 2 shows that
increases along with the molar mass of the probe. Additionally, solvents containing the same carbon number, both aromatic and cyclic, are more compatible with the polymer.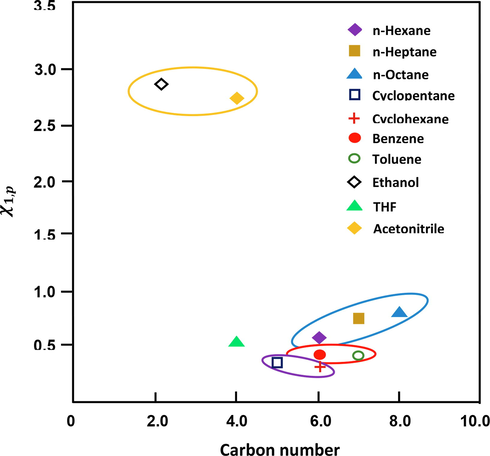
Variation in the Flory interaction parameter according to the molar mass and carbon number of the molecular probes.
3.1.3 Determination of solubility parameters
We calculated the Hildebrand and Scott solubility parameter of each compound using Eq. (15) and the corresponding heat of vaporization.
is obtained from
and
, which are deducted from the slope of the plots of Ln
and Ln
versus the inverse of temperature, respectively (Figs. 3 and 4). For all of the volatile compounds investigated,
,
and
were obtained with an
> 0.9. For comparison, Table 5 lists the different heats obtained in this study and the enthalpy of vaporization of similar organic molecules reported previously (Diez et al., 2011) and those calculated from the Watson model (Watson, 1943).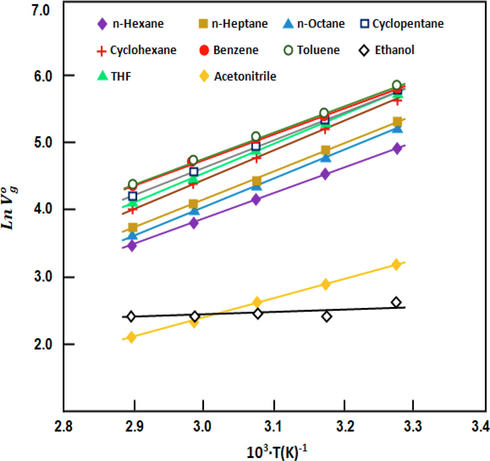
Variation in
versus the inverse of temperature for different solvent–SBR binary systems.
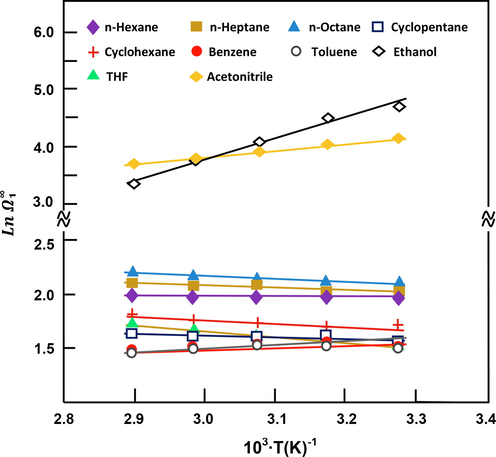
Variation in Ln
versus the inverse of temperature for different solvent–SBR binary systems.
Solvent
(KJ.mol−1)
(KJ.mol−1)
(KJ.mol−1)
This work
PCIGC
Watson modelf
n-Hexane
−31.16
−0.80
30.36 ± 0.20
29.9a; 29.5b
31.3
n-Heptane
−34.85
−1.76
33.09 ± 0.22
35.5a; 34.6b
36.2
n-Octane
−35.00
−0.89
34.11 ± 0.18
40.4a; 39.3b
40.9
Cyclopentane
−34.17
−2.15
32.02 ± 0.23
27.7a; 28.0c
28.0
Cyclohexane
−35.58
−3.44
32.13 ± 0.22
31.1a; 32.0c
32.1
Benzene
−30.52
2.52
33.04 ± 0.22
32.7a; 32.2b
33.5
Toluene
−31.62
7.57
39.20 ± 0.18
37.0a; 36.4b
36.6
Ethanol
−2.77
38.82
41.59 ± 0.15
38.9d; 40.8b
38.6
THF
−37.03
−5.57
31.46 ± 0.19
31.7a ; 30.6d
31.1
Acetonitrile
–23.52
9.49
33.01 ± 0.21
32.3d; 30.0e
–
We obtained and values over a temperature range of 30 °C to 70 °C. The results reveal that the exothermic molar enthalpy of sorption for the aliphatic and aromatic hydrocarbons increased along with the chain length, indicating that hydrocarbons with the highest number of carbon atoms were better appreciated by the copolymer. However, the molar heat of sorption of the probes was directly affected by the polarity and chemical structure of the probe. Therefore, ethanol, which has the highest polarity among the investigated molecules, was minimally appreciated by SBR. Moreover, for the SBR/THF system, the was highly exothermic, indicating that THF exhibits strong interactions with SBR.
Furthermore, Table 5 shows that the for all of the probes was generally comparable with those previously reported (Daubert and Danner, 1985; Diez et al., 2011; Dritsas et al., 2008), which were determined by PCIGC and confirmed by those calculated through the Waston approach (Watson, 1943). However, the difference between the different values obtained through the PCIGC method (although minimal in certain cases) is mainly attributed to the experimental errors occurred during the support traitment and/or the column preparation.
To verify this, it is possible to compare the values of
determined by PCIGC. Indeed, the presence of a significant gap in the heat of vaporization in certain cases, such as acetonitrile (2.3 KJ·mol−1), ethanol (1.9 KJ·mol−1), THF (1.1 KJ·mol−1), and n-octane (1.1 KJ·mol−1), is closely related to treatment of the support and column preparation. In many cases, controlling the complete coverage and inert character of the support particles is difficult. Table 6 shows the δi values obtained from Eq. (15) and those determined previously using PCIGC and other techniques (viscosimetry and swelling methods). To confirm these findings, it will be necessary to compare the results obtained in the present study with those obtained using the same technique (CCIGC) but employing stationary phases other than SBR. Currently, the absence of such studies precludes a comparison here.
Solvent
*
This work
PCIGC
Other methods
n-Hexane
14.27 ± 0.12
14.90a; 14.80b; 10.83c;14.90d; 15.35e;14.81g
14.93m; 14.87n; 14.81p
n-Heptane
14.39 ± 0.18
13.70a; 11.82c; 15.2e; 15.30d; 15.30f; 15.18g
15.24m; 15.34n
n-Octane
13.66 ± 0.15
11.80a; 15.40b; 15.6g; 15.50d; 15.70f; 15.44g
15.42n
Cyclopentane
18.03 ± 0.18
12.28c; 16.6h; 13.89i; 16.40f; 16.56g
16.57n
Cyclohexane
16.76 ± 0.14
16.70b; 13.34c; 16.80g;16.80f; 16.73g
16.77m;16.73n; 16.73p
Benzene
18.44 ± 0.13
19.60a; 18.70b; 18.80g;18.40f; 18.72g; 18.82e
18.72m; 18.45n; 18.72p
Toluene
17.52 ± 0.15
17.80a; 14.93c; 18.20j;18.23g; 18.20q
18.20m; 18.21n; 18.23p
Ethanol
22.80 ± 0.12
23.00a; 23.01h; 26.52i; 26.19e; 26.10q
26.55n; 26.52l
THF
19.35 ± 0.10
19.50a; 19.46l; 16.18f,
19.47n; 16.80l
Acetonitrile
24.10 ± 0.11
24.40l; 24.4d; 24.96e; 24.60d; 24.96e; 24.80q
24.43n; 24.34p
It is important to underline here, that the experimental errors have nothing to do with the method itself, on the contrary according to Braum and Gillet (Braum and Gillet, 1975) the PCIGC technique seems to be more adapted to this kind of work. Here we only report those experimental errors that can be made person to person in the stages of column preparation when it is a packed column.
These results indicated that the δ1 values determined for certain solvents, such as n-hexane, cyclohexane, benzene, toluene, THF, and acetonitrile, generally agreed well with those previously reported and determined by PCIGC and viscosimetry and swelling techniques (Koenhen and smolders, 1975; Scott and Magat, 1949; Hansen, 1967). However, anomalies in these values were also observed, despite use of PCIGC to determine certain solubility parameters, such as those provided by Sreekanth (Sreekanth et al., 2012), Lim (Lim et al., 2014), and Sreekanth and Reddy (Sreekanth and Reddy, 2008). In these cases, these values were relatively underestimated. These anomalies appeared to be a consequence of different factors, including imperfect treatment of support and column preparation. Because, insufficient treatment leads to adsorption of the probe molecule by the support and heterogeneity in the thickness of the polymer layer covering the support can distort the value of the weight of the polymer inside the column which is estimated from the ratio of the initial polymer/solvent mixture. Additionally, the friction of the particles of the impregnated support during preparation and loading of the column can generate debris or polymer powder, which can result in underestimation of the weight of the polymer in the column.
The
of SBR determined from the slope and the intercept of the curve of Fig. 5 revealed a value of 16.27 ± 0.12 MPa0.5. The absence of data in the literature on the solubility parameter of SBR containing the same composition in comonomer units did not allow a rigorous comparison of our results with others, nevertheless the presence of data on the SBR with other compositions allows to give an idea on the real value of this parameter. Table 7 shows the solubility parameters of SBR containing different styrene/butadiene ratios determined by different methods.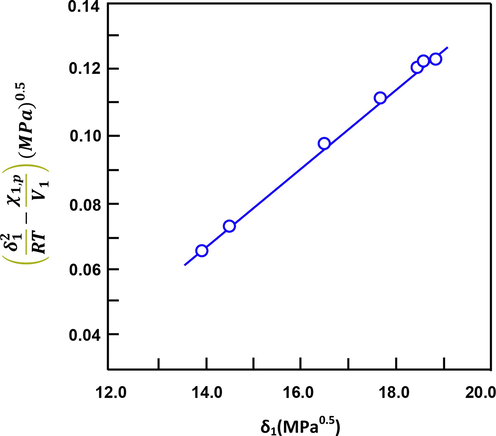
Variation in δ12/2 − (RT
/2V1) with the solubility parameters of the solvents. Estimation of the solubility parameter of SBR.
SBR composition styrene (%)
δp (Mpa0.5)
Method
Ref.
60
17.73
Swelling measurement
Scott and Maya (1949)
40
17.50
–
Brandrup et al. (1999)
40
17.79
Swelling measurement
Scott and Maya (1949)
25
17.59
Swelling measurement
Scott and Maya (1949)
30 triblock
17.60
PCIGC
Diez et al. (2011)
30 triblock
16.70
Viscosity measurement
Ovejero (2010)
31triblock
17.60*
PCIGC
Romdhane et al. (1992)
45
16.27
CCIGC
This work
As can be seen from these data, the value of the solubility parameter of SBR containing 30% styrene determined by viscosimetry seems to be closer to the value found in this work. On the other hand, that of SBR containing 40% styrene, determined by a swelling method, although the ratio of styrene unit in the copolymer is close to that used in this study, shows a higher value. The comparison of the two solubility parameters of the SBR containing the same styrene ratio (30%), one obtained by Diez et al using the PCIGC technique and the other by Ovejero using the viscosimetric method reveals significant deviation (∼5%).
3.2 Prediction of activity coefficients
3.2.1 Prediction using the non-random two-liquid (NRTL) model
The Flory–Huggins thermodynamic model expresses the relationship between the solvent activity,
, and the interaction parameter,
, as expressed by Eq. (20) (Flory, 1941):
We used this model to calculate the experimental equilibrium data of polymer–solvent solutions according to a previously described method (Ovejero et al., 2009). Estimation of P-xy values was possible using the polymer–solvent interaction parameters determined at a given temperature from these IGC experiments. Using the experimental values of
and the hypothesis that the vapor pressure of a polymer is zero, we obtained the nonlinear fit of the NRTL model according to Eq. (21) (Renon and Prausnitz, 1968) using the Solver tool in Microsoft Excel software (Microsoft Corp., Redmond, WA, USA). We then adjusted the parameters of the NRTL equation (
) and maintained
, which is ideal for nonpolar mixtures.
Table 8 shows the experimental values of
obtained from the IGC measurements and those obtained from the regression of the estimated P-xy data (
. In all the cases, we obtained a residual root-mean square error of < 4.67%, indicating a very good fit for the NRTL model.
Temperature
30 °C
40 °C
50 °C
60 °C
70 °C
CALa
EXPb
CALa
EXPb
CALa
EXPb
CALa
EXPb
CALa
EXPb
n-Hexane
6.30
7.23
6.24
7.16
6.20
7.12
6.35
7.28
6.43
7.38
n-Heptane
7.08
7.63
7.02
7.56
7.56
8.15
7.42
8.01
7.62
8.22
n-Octane
7.80
8.26
7.88
8.34
804
8.52
8.27
8.76
8.51
9.02
Cyclopentane
5.12
4.88
5.06
4.82
5.25
5.01
5.21
4.97
5.38
5.13
Cyclohexane
4.98
5.51
4.91
5.31
5.09
5.63
5.22
5.78
5.52
6.12
Benzene
5.98
4.89
5.82
4.76
5.65
4.62
5.45
4.45
5.36
4.38
Toluene
5.43
4.54
5.42
4.53
5.50
4.60
5.25
4.38
5.10
4.25
Ethanol
132.40
110.30
108.24
91.23
67.63
58.19
48.81
42.53
32.34
28.52
THF
5.86
4.58
6.35
4.98
6.56
5.15
6.86
5.39
7.02
5.52
Acetonitrile
–
62.18
–
56.85
–
51.07
–
45.32
–
40.38
3.2.2 Prediction using the universal quasichemical (UNIQUAC) model
The estimated P-xy was also fitted to the UNIQUAC model according to Eq. (22) (Prausnitz et al., 1999) using the Solver tool in the Microsoft Excel software (Microsoft Corp.):
For a polymer,
and
can also be calculated using the group-contribution method (Reid et al., 1987).
and
are the volume and surface fractions of solvent i, respectively. The value of
is calculated from
using the following equation:
4 Conclusion
In summary, we demonstrated successful determination of the thermodynamic parameters of SBR using a capillary column filled with a thin layer of SBR, followed by investigation of both polar and nonpolar solvents using CCIGC. The obtained solubility parameter of the SBR–solvent system was consistent with those previously determined and using different techniques. Comparison of the solubility parameters and the heats of vaporization of the investigated molecules with those obtained by PCIGC using different stationary phases revealed in the most studied molecules similar values. The gap observed between some values of the solubility parameters and the heat of vaporization obtained by CCIGC and those reported in the literature or between those of the same PCIGC method obtained by different authors seems to be due to the experimental errors occurred during the support traitement and/or the column preparation.
Furthermore, comparison of the activity coefficients of the solvents at ID and obtained by CCIGC with those obtained by fitting the NRTL and UNIQUAC models revealed excellent correlation. These results demonstrated the increased reliability of the CCIGC technique, as well as its speed and accuracy, relative to similar methods that use packed columns containing supports impregnated by the polymer. Moreover, use of the proposed method completely eliminated side effects related to the support.
Acknowledgments
The authors gratefully acknowledge Mr. Kamal Chanane for performing all of the mathematical calculations.
Funding
This study was funded by the Deanship of Scientific Research, King Saud University (Research Group No. RGP-VPP-025).
Declaration of Competing Interest
The authors declare that they have no known competing financial interests or personal relationships that could have appeared to influence the work reported in this paper.
References
- Effect of curing time and sulfur content on the dielectric relaxation of styrene butadiene rubber. J. Appl. Polym. Sci.. 2003;88:1613-1621.
- [Google Scholar]
- Inverse gas chromatographic determination of solubility parameters of excipients. Int. J. Pharm.. 2005;304:11-17.
- [Google Scholar]
- Characterization of mesoporous aluminosilicate materials by means of inverse liquid chromatography. J. Chromatogr. A. 2020;1610:460544
- [Google Scholar]
- Miscibility enhancement on the poly (vinylchloride)/poly (methylmethacrylate) blend and characterization by inverse gas chromatography: The corrected polymer–polymer interaction parameters from the probes dependency. J. Appl. Polym. Sci.. 2012;124:1464-1474.
- [Google Scholar]
- Solubility of organic solvents in 1, 4-cis-polybutadiene. Fluid Phase Equilib.. 2012;334:10-14.
- [Google Scholar]
- Solubility and diffusivity of solvents and nonsolvents in polysulfone and polyetherimide. Ind. Eng. Chem. Res.. 2001;40:3058-3064.
- [Google Scholar]
- Styrene–butadiene rubber membranes for the pervaporative separation of benzene/cyclohexane mixtures. J. Appl. Polym. Sci.. 2012;123:1455-1467.
- [Google Scholar]
- Thermodynamics of polymer solubility in polar and nonpolar systems. Ind. Eng. Chem. Fundam.. 1964;3:1-8.
- [Google Scholar]
- Determination of infinite dilution diffusion and activity coefficients of solvents in polystyrene by inverse gas chromatography on a capillary column. J. Appl. Polym. Sci.. 1994;51:1923-1930.
- [Google Scholar]
- Boublík, T., Fried, V., Hála, E., 1984. The vapour pressures of pure substances.
- Polymer Handbook. New York: John & Wiley Sons. Inc.; 1999. p. :171-186.
- Phase equilibrium and diffusion of solvents in polybutadiene: A capillary-column inverse gas chromatography study. J. Polym. Sci., Part B: Polym. Phys.. 2002;40:1046-1055.
- [Google Scholar]
- γ-Irradiated PVA/Ag nanocomposite films: Materials for optical applications. J. Alloy. Compd.. 2012;538:212-219.
- [Google Scholar]
- Physicochemical Measurements by Gas Chromatography. NY: Willey; 1979.
- Data compilation tables of properties of pure compounds. Design Institute for Physical Property Data, American Institute of Chemical … 1985
- [Google Scholar]
- Use of inverse gas chromatography to study binary polymer− solvent systems near the glass transition temperature. Macromolecules. 2004;37:9201-9210.
- [Google Scholar]
- Polymer–solvent interaction parameters of SBS rubbers by inverse gas chromatography measurements. Fluid Phase Equilib.. 2011;308:107-113.
- [Google Scholar]
- Estimation of polymer solubility parameters by inverse gas chromatography. Macromolecules. 1982;15:622-624.
- [Google Scholar]
- Investigation of thermodynamic properties of hyperbranched poly (ester amide) by inverse gas chromatography. J. Polym. Sci., Part B: Polym. Phys.. 2008;46:2166-2172.
- [Google Scholar]
- Solubility and diffusivity of solvents and nonsolvents in poly (methyl methacrylate co butyl methacrylate) Fluid Phase Equilib.. 2005;237:68-76.
- [Google Scholar]
- Probing polymer-polymer interaction parameters in miscible blends by inverse gas chromatography: solvent effects. Macromolecules. 1994;27:1245-1248.
- [Google Scholar]
- Assessment of the thermodynamic properties of DL-p-mentha-1, 8-diene, 4-isopropyl-1-methylcyclohexene (DL-limonene) by inverse gas chromatography (IGC) J. Chromatogr. Sci.. 2018;56:671-678.
- [Google Scholar]
- Effect of degree of crosslinking on swelling and mechanical behaviour of conventionally vulcanised styrene-butadiene rubber membranes. Polym. Polym. Compos.. 1999;7:343-353.
- [Google Scholar]
- Solubility parameter and hydrocarbon sorption of low density polyethylene. Die Makromolekulare Chemie: Macromolecular Chemistry and Physics. 1971;143:181-187.
- [Google Scholar]
- Studies of diffusion in polymers by gas chromatography. Macromolecules. 1973;6:223-227.
- [Google Scholar]
- Systematic deviations from the principle of corresponding states. J. Chem. Phys.. 1965;42:3775-3780.
- [Google Scholar]
- Guillet, J., Al‐Saigh, Z.Y., 2006. Inverse gas chromatography in analysis of polymers. Encyclopedia of Analytical Chemistry: Applications, Theory and Instrumentation.
- Use of inverse gas chromatography to account for the pervaporation performance in the microemulsion breakdown. J. Chromatogr. A. 2005;1091:145-151.
- [Google Scholar]
- Three dimensional solubility parameter and solvent diffusion coefficient. Importance in surface coating formulation. Doctoral Dissertation 1967
- [Google Scholar]
- The interaction parameter of crosslinked networks and star polymers. Eur. Polym. J.. 2005;41:2793-2802.
- [Google Scholar]
- Anomalous solubility parameter and probe dependency of polymer–polymer interaction parameter in inverse gas chromatography. Eur. Polym. J.. 2006;42:1000-1007.
- [Google Scholar]
- Methods to determine solubility parameters of polymers at high temperature using inverse gas chromatography. J. Appl. Polym. Sci.. 2004;94:1547-1555.
- [Google Scholar]
- Use of inverse gas chromatography to quantify interactions in anhydride cured epoxy resins. Polym. Int.. 1994;35:135-143.
- [Google Scholar]
- Gas-liquid partition chromatography: the separation and micro-estimation of volatile fatty acids from formic acid to dodecanoic acid. Biochem. J. 1952;50:679-690.
- [Google Scholar]
- Dimensional stability of SBR-modified cementitious mixtures for use in 3D additive construction. Appl. Sci.. 2019;9:3386.
- [Google Scholar]
- The determination of solubility parameters of solvents and polymers by means of correlations with other physical quantities. J. Appl. Polym. Sci.. 1975;19:1163-1179.
- [Google Scholar]
- Physicochemical applications of gas chromatography. Wiley; 1978.
- Experimental consideration of the Hansen solubility parameters of as-produced multi-walled carbon nanotubes by inverse gas chromatography. PCCP. 2014;16:17466-17472.
- [Google Scholar]
- Temperature dependence of the interfacial bonding characteristics of silica/styrene butadiene rubber composites: a molecular dynamics simulation study. RSC Adv.. 2019;9:40062-40071.
- [Google Scholar]
- Evaluation of the polymer–solvent interaction parameter χ for the system cured styrene butadiene rubber and toluene. Eur. Polym. J.. 2007;43:2682-2689.
- [Google Scholar]
- Inverse gas chromatography applications: A review. Adv. Colloid Interface Sci.. 2014;212:21-44.
- [Google Scholar]
- Polymer solubility parameters of poly (propylene oxide) rubber from inverse gas chromatography measurements. Polym. J.. 1996;28:127-130.
- [Google Scholar]
- Use of inverse gas chromatography to account for the pervaporation performance in monitoring the oxidation of primary alcohols. J. Chromatogr. A. 2006;1135:78-84.
- [Google Scholar]
- Determination of alkali lignin solubility parameters by inverse gas chromatography and Hansen solubility parameters. BioResources. 2016;11:4353-4368.
- [Google Scholar]
- Thermodynamic interactions of three SBS (styrene–butadiene–styrene) triblock copolymers with different solvents, by means of intrinsic viscosity measurements. Eur. Polym. J.. 2010;46:2261-2268.
- [Google Scholar]
- Thermodynamic modeling and simulation of styrene− butadiene rubbers (SBR) solvent equilibrium staged processes. Ind. Eng. Chem. Res.. 2009;48:7713-7723.
- [Google Scholar]
- Solute diffusion in polymers. 2. Fourier estimation of capillary column inverse gas chromatography data. Macromolecules. 1988;21:1685-1698.
- [Google Scholar]
- Solute diffusion in polymers. 1. The use of capillary column inverse gas chromatography. Macromolecules. 1987;20:1564-1578.
- [Google Scholar]
- Molecular Thermodynamics of Fluid Phase Equilibria (3rd ed.). Englewood Cliffs: Prentice Hall PTR; 1999.
- Reid, R.C., Prausnitz, J.M., Poling, B.E., 1987. The properties of gases and liquids.
- Local compositions in thermodynamic excess functions for liquid mixtures. AIChE J.. 1968;14:135-144.
- [Google Scholar]
- Thermodynamic interactions of solvents with styrene–butadiene–styrene triblock copolymers. J. Appl. Polym. Sci.. 1992;45:2049-2056.
- [Google Scholar]
- Thermodynamics of high-polymer solutions. III. Swelling of cross-linked rubber. J. Polym. Sci.. 1949;4:555-571.
- [Google Scholar]
- Blends of PS with SBR devulcanized by ultrasound: Rheology and morphology. J. Elastomers Plast.. 2004;36:45-75.
- [Google Scholar]
- Hansen solubility parameters in the analysis of solvent–solvent interactions by inverse gas chromatography. J. Macromol. Sci., Part B. 2012;51:1256-1266.
- [Google Scholar]
- Evaluation of solubility parameters for nonvolatile branched hydrocarbons by inverse gas chromatography. J. Appl. Polym. Sci.. 2008;108:1761-1769.
- [Google Scholar]
- Application of inverse gas chromatography to the measurement of diffusion and phase equilibria in polyacrylate–solvent systems. J. Chromatogr. A. 1999;845:93-101.
- [Google Scholar]
- Effect of γ-radiation on the dynamic mechanical properties of styrene–butadiene rubbers. J. Appl. Polym. Sci.. 1966;10:491-509.
- [Google Scholar]
- Thermodynamic characterization of sodium alginate by inverse gas chromatography. J. Chem. Eng. Data. 2020;65:1795-1801.
- [Google Scholar]
- Application of Hansen solubility parameters for understanding and prediction of drug distribution in microspheres. Int. J. Pharm.. 2011;416:202-209.
- [Google Scholar]
- The use of the Flory-Huggins interaction parameter for the characterization of vacuum distillation residue fractions of mineral oils. Chromatographia. 1995;41:414-418.
- [Google Scholar]
- Inverse gas chromatography as a source of physiochemical data. J. Chromatogr. A. 2009;1216:1551-1566.
- [Google Scholar]
- Investigation of polymers by inverse gas chromatography. Macromolecules. 2015;48:6751-6767.
- [Google Scholar]
- Practical determination of the solubility parameters of 1-alkyl-3-methylimidazolium bromide ([CnC1im] Br, n= 5, 6, 7, 8) ionic liquids by inverse gas chromatography and the Hansen solubility parameter. Molecules. 2019;24:1346.
- [Google Scholar]


