

Translate this page into:
Carbon/nitrogen-doped TiO2: New synthesis route, characterization and application for phenol degradation
⁎Corresponding author at: Chemistry Department, Faculty of Science, Cairo University, Giza 12613, Egypt. Tel.: +974 4403 5672; fax: +974 4403 3889. abubakr_2@yahoo.com (Aboubakr M. Abdullah) bakr@qu.edu.qa (Aboubakr M. Abdullah)
-
Received: ,
Accepted: ,
This article was originally published by Elsevier and was migrated to Scientific Scholar after the change of Publisher.
Peer review under responsibility of King Saud University.
Abstract
Porous nanocrystalline carbon and nitrogen (CN)-doped TiO2 photocatalyst was prepared using carbon tetrachloride and polyaniline as precursors. The obtained powders were characterized by X-ray diffraction (XRD), X-ray photoelectron spectroscopy (XPS), scanning electron microscopy (SEM), Raman spectroscopy, Fourier transform infrared (FT-IR) spectroscopy, and gravimetric analysis. The purpose of this work was to explore the state and location of nitrogen and carbon atoms introduced inside the TiO2 lattice and to study the exploitation of the photocatalytic activity of the CN-doped TiO2 for application in phenol degradation under UV illumination. After 30 min from the illumination onset, 64% and 57% of the phenol were degraded when the CN-doped TiO2 and TiO2 catalysts were used respectively.
Keywords
Photocatalysts
Titanium dioxide
Nitrogen doping
Carbon doping
Phenol degradation

1 Introduction
TiO2 is one of the commonly used materials in many aspects of life. It is a cheap, harmless, chemically and thermally stable, environmental friendly and nontoxic material. Furthermore, it is considered to be an excellent and promising material in paints (Zhanga et al., 2012), photocatalysis for water splitting (production of hydrogen fuel using solar energy) (Fujishima and Honda, 1972), cosmetics and health care products, degradation of water pollutants, air purification, dye-sensitized solar cell (DSSC) electrodes, sensors and catalysts’ support.
Titanium dioxide photocatalytic applications are based on the fact that, in the presence of oxygen and ultraviolet (UV) radiations, it can generate highly reactive oxygen free radicals such as, HO2•, HO• and O2•− that can oxidize a large number of organic refractory compounds (Shawabkeh et al., 2010). Doping of TiO2 using metal or non-metal atoms is a promising way to enhance its photocatalytic activity. When an oxygen atom, in TiO2, is replaced by lighter elements e.g. boron, carbon or nitrogen, the valence band of TiO2 may be depopulated by three, two or one electron, respectively. At the same time, the introduction of intraband gap states will allow TiO2 to absorb light in the visible region. It is worthy to mention that the higher the atomic number of the dopant element, the lower is the energy of the corresponding 2p states due to the bigger nuclear effective charge. In fact, it is reported that doping TiO2 with carbon and nitrogen increases the photocatalytic activity and in turn increases the rate of organic compound degradation (Huang et al., 2008).
Phenolic compounds are considered as one of the most toxic industrial pollutants; they are produced as intermediates in many industries e.g. adhesives and antiseptics (Alnaizy and Akgerman, 2000). So, many works have been done to find an effective way to remove them from wastewater.
Some well-known methods for water treatment e.g. chemical precipitation, ion-exchange adsorption, filtration, and membrane systems are not efficient enough to destroy refractory organic pollutants. Besides, their implementations are limited because of the high cost and the sophisticated equipment they need (Panda et al., 2011). One of the most efficient ways that, recently, started to gain more attention is using heterogeneous semiconducting photocatalysts in an advanced oxidation process (Shu et al., 2010). Advanced oxidation process (AOP) gets rid of phenolic compounds by irradiating them with light in the presence of a suspension of semiconductor metal oxide particles e.g. titanium dioxide and zinc oxide in addition to adding an oxidizing agent e.g. H2O2 or ozone. This process involves the generation of reactive hydroxyl free radicals that are potent enough to oxidize many organic pollutants such as phenols. This method is considered to be excellent because of the low-cost, moderate temperature and pressure conditions and it mineralizes completely the pollutants to water, carbon dioxide and mineral acids in short times, (Gupta et al., 2006; Lachheb et al., 2002; Bhatkhande et al., 2002). To increase the efficiency of the AOP, in fact, previous works have been directed for using nitrogen-doped TiO2 for phenol degradation. For example, Sakthieval et al. used visible light and nitrogen-doped TiO2 to mineralize 4-chlorophenol. They noticed that doping TiO2 with nitrogen lowered the TiO2 band gap energy by 40–80 meV (Sakthivel et al., 2004). 4-Chloro-phenol degradation using TiO2 with and without Pt nanoparticles was studied also using Neppolian et al. (2007). The nitrogen-doped TiO2 that Kisch et al. has prepared was used to degrade formic acid and was reported to lower the band gap energy of TiO2 by 0.07–0.16 eV (Kisch et al., 2007). Venkatachalam et al. used sol gel method to prepare nitrogen-doped TiO2 and used it for degrading Bis-phenol A using visible light irradiation (Venkatachalam et al., 2006). Instead of the TiO2 nanoparticles, Dong et al. used nitrogen-doped TiO2 nanotubes for degradation of methyl orange using visible light. They found a significant increase in the photocatalytic behavior of doped nanotubes compared to the non-doped ones (Dong et al., 2009). Li et al., used activated carbon and nitrogen-doped TiO2 which has excellent visible photocatalytic activity to remove formaldehyde from air (Li et al., 2010).
The objective of this work was to prepare C/N-doped TiO2 and use it as a photocatalyst for the degradation of phenol-contaminated water. Although preparing and studying the photocatalytic behavior of C/N-doped TiO2 toward degradation of many organic compounds is not new but the starting materials that were used in this work are new. In addition the targeted organic compound was phenol which was not previously studied before using C/N-doped TiO2 using UV irradiation.
2 Experimental
2.1 Materials
Titanium dioxide (anatase 99%) was purchased from Nanostructured & Amorphous Materials, Inc. USA. Aniline, dimethyl sulfoxide, ammonium peroxydisulfate, and ammonia solution were purchased from Sigma Aldrich, Germany. For carbon tetrachloride, it was obtained from BDH Middle East LLC.
2.2 Preparation of C/N-doped TiO2
C/N-doped TiO2 material was prepared by the following method: 0.4 g of PANi was dissolved in 30 mL DMSO (dimethyl sulfoxide) and heated at 50 °C with stirring for 1 h, then carbon tetrachloride was added slowly and finally TiO2 nanoparticles powder was topped up. The resultant mixture was heated under stirring (250 rpm) at 80 °C for 4 h. Then, after filtration and washing with ethanol and water, the obtained blue solid mixture was placed in a drying oven for 10 h and then ground into a fine powder. The obtained powder was carbonized by heating under a stream of nitrogen with a flow rate of 50 mL min−1 at 550 °C for 5 h. The heating rate was controlled at 5 °C min−1. The preparation steps are summarized in Fig. 1.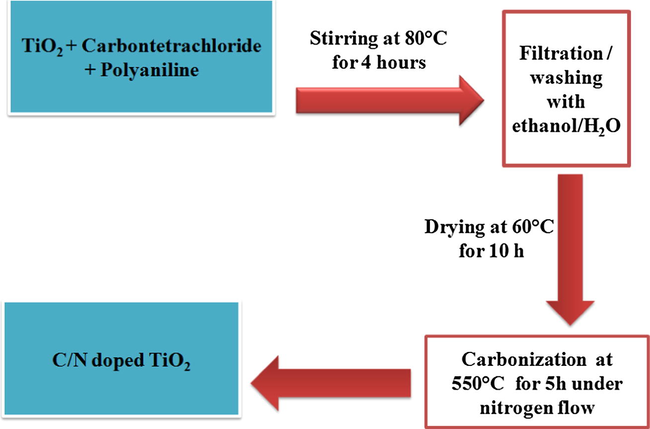
Scheme summarizes the procedure for the C/N-doped TiO2 preparation.
2.3 Preparation of base polyaniline
Acidified aniline solution was prepared by adding 1.82 mL of aniline to a 0.309 mL of hydrochloric acid diluted with 100 mL distilled water. Then, a diluted solution of ammonium peroxydisulfate (5.7045 g in 100 mL distilled water) was added to the acidified aniline one under continuous stirring at room temperature for 24 h. The precipitate was collected on a filter paper and dried under vacuum at 50 °C overnight. The prepared polyaniline was washed in an ammonia solution (0.4 mL in 100 mL distilled water) and stirred for 4 h. Finally, the mixture was filtered and dried under vacuum at 50 °C for 24 h (Ayyad and zaghlol, 2012).
2.4 Characterization
The X-ray powder diffraction (XRD) patterns were recorded using a Rigaku MiniFlex II Desktop X-ray Diffractometer with Cu Kα radiation (λ = 1.54178 Å).
Using Debye–Scherrer’s equation, the crystallite size of the TiO2 particles was calculated from the [1 0 1] diffraction peak as follows:
The transmission electron microscopy (TEM) study was carried out using a FEI TECNAI GF20 S-TWIN electron microscopy instrument. The samples for TEM were prepared by sonicating a dispersion of the C/N-doped TiO2 powder in isopropanol for 2 h, then the dispersion was dropped on a carbon copper grid.
Nova Nano scanning electron field emission microscope (SEM) was used to document micrographs for the morphology of the prepared materials using an accelerating voltage of 5.0 kV.
The Fourier transform infrared (FT-IR) spectrum of the prepared C/N-doped TiO2 was recorded in the region of 4000–500 cm−1 using an FT-IR Perkin Elmer/spectrum 100 spectrometer.
Furthermore, X-ray photoelectron spectroscopy (XPS) measurements were performed using a PHI Quantum 2000 XPS system with a monochromatic Al Kα source and a charge neutralizer. XPS signals were recorded using a Thermo Scientific K-Alpha XPS system (Thermo Fisher Scientific, UK) that is equipped with a micro-focused monochromatic Al Kα X-ray source (1486.6 eV).
Raman spectra were recorded using an InVia Raman microspectrometer working under macroconditions (f = 3 cm) with excitation line at 633 nm. The samples were measured directly (without any pre-treatment) and the laser power at the sample was maximum of ∼2 mW.
2.5 Photoreactivity experiments
Phenol solutions of 20 mg L−1 were prepared in deionized water with and without H2O2. For each test, 0.02 g of the prepared catalyst was added to 50 mL of each solution and mixed using a magnetic stirrer in the dark for 30 min until the adsorption equilibrium was reached. Then, the suspension was illuminated using a high pressure mercury lamp (300 W) emitting ultraviolet radiation (UV) with a maximum radiation peak of 365 nm. No pH adjustment of the phenol solution was performed. The distance between the liquid and radiation source was 4.5 cm. The time at which the ultraviolet lamp was turned on was considered as “time zero” i.e. the start of the experiment. Samples were taken at 30 min intervals from the reaction vessel and filtered to remove the suspended composite particles using nylon filter paper with a pore size of 0.4 μm. The concentration of the phenol was determined using the UV–vis spectrophotometer with a UV absorbance range of 190–400 nm, and the 269 nm absorbance corresponded to the maximum absorption of phenol.
3 Results and discussion
3.1 XRD patterns
X-ray diffractometry was used to characterize the phase composition and the particles’ size of the obtained product. Fig. 2 compares the XRD patterns of the C/N-doped and undoped TiO2. It reveals that there are several crystalline peaks at 2θ values of 25°(1 0 1), 38°(0 0 4) and 48°(2 0 0). Since these peaks are corresponding to the anatase phase, so it can be concluded that only anatase has existed in the prepared powders of C/N-doped TiO2 (Gajjela et al., 2010). The particle size was calculated and was found to be in the range 38–40 nm for the C/N-doped TiO2. These results were confirmed using TEM micrographs which will be presented later (Fig. 9).
XRD patterns of the resulting samples (a) Undoped TiO2 and (b) C/N-doped TiO2 (A: Anatase).
3.2 XPS spectra
XPS study was carried out to check the surface chemical compositions of C/N-doped TiO2 (see Fig. 3).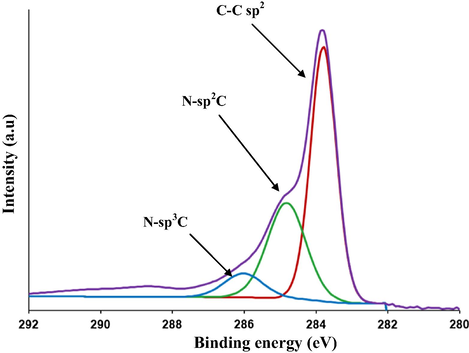
XPS (C1s) spectra of the prepared C/N-doped TiO2.
3.2.1 C1s
Deconvolution of C1s region showed a main peak at 284.6 eV corresponding to C-sp2. In addition, the peaks observed at 285.1 eV and 286.6 eV refer to the formation of N-sp2C and N-sp3C bonds, respectively. No peaks were found at around 289 eV (Ohno et al., 2004) which confirmed that carbonate species did not form in the prepared material. This reveals that the oxygen sites in the TiO2 lattice were substituted by carbon atoms and formed a C—Ti—O structure (Huang et al., 2008).
3.2.2 N1s
Fig. 4 shows the nitrogen region of the XPS measured spectrum for the C/N-doped TiO2. It reveals the presence of a large peak in the range of 397.3–403.3 eV. It is centered around 400.1 eV which can be attributed to the 1s electron binding energy of the N atom in the environment of O—Ti—N as reported by Chen and Burda, (2004); Kolesnik et al., (2013); Bellardita et al., (2009). The atomic content of nitrogen in C/N—TiO2 was found to be 0.4%.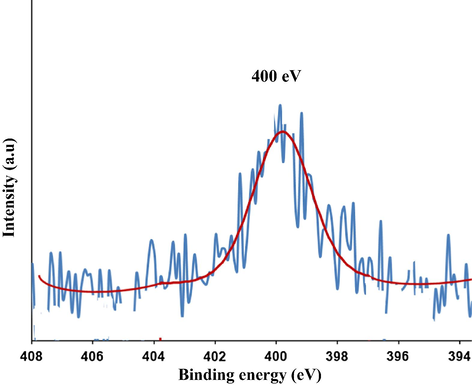
XPS (N1s) spectra of the prepared C/N-doped TiO2.
3.2.3 O1s
The 1s oxygen region in the XPS of the prepared C/N-doped TiO2 is shown in Fig. 5. The O1s peak consists of two components with binding energy of 530.3 and 531.5 eV. The first component corresponds to the oxygen bound to tetravalent Ti ions (oxygen atoms in nanocrystalline anatase, O—Ti—O) and the second one (broadening) can be attributed to surface hydroxyl groups, which is always present at the surface of nanocrystalline TiO2 (Ti-OH). This broadening at 531.5 eV confirms the presence of another type of oxygen due to the more covalent nature of N—TiO2 (Chi et al., 2007). This might be related to the presence of oxygen and nitrogen from the same lattice units in TiO2.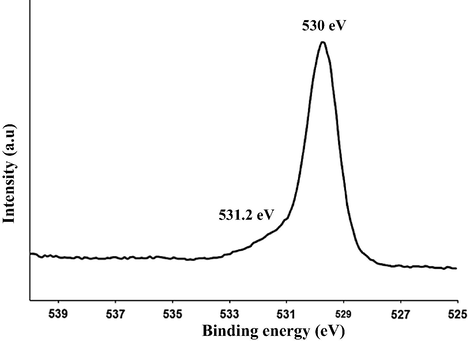
XPS (O1s) spectra of the prepared C/N-doped TiO2.
3.2.4 Ti2P
In the Ti2p spectra shown in Fig. 6, only the signals that correspond to Ti4+ were detected. The spectrum shows peaks at 459.2 and 465 eV which correspond to the spin orbit coupling of Ti2P3/2 and Ti2P1/2, respectively. The observed peaks positions, the binding energy separation between the 2p1/2 and 2p3/2 peaks of ∼5.8 eV and the broad peak (low intensity at 473.2 eV) are characteristics for TiO2. In the literature, the Ti2p XPS peak of un-doped TiO2 appears normally at 459.5 eV (Saha and Tomkins, 1992). So, the nitrogen incorporation shifted the XPS spectrum to a lower binding energy (459.2 instead of 459.5 eV).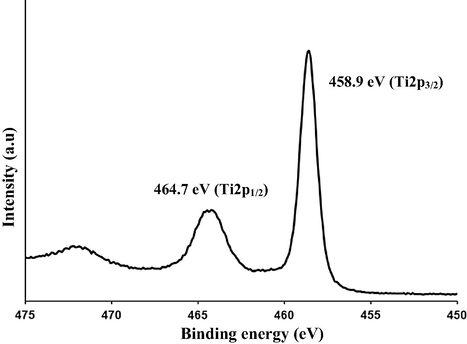
XPS (Ti2p) spectra of the prepared C/N-doped TiO2.
3.3 FT-IR
The surface chemical bonding state of the prepared material was characterized by FT-IR spectroscopy. Fig. 7 shows the FT-IR spectrum of the C/N-doped TiO2. The sample shows an absorption peak at about 3000 cm−1 which is assigned to molecularly chemisorbed water. The peaks at 1195 and 940 cm−1, are attributed to the C—N stretch (aliphatic amine) and ⚌C—H bend (alkenes), respectively (Vinu, 2008).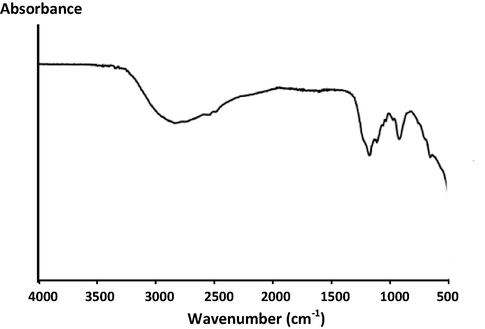
FT-IR spectrum of C/N-doped TiO2.
3.4 SEM
The morphology of the C/N-doped TiO2 powder was analyzed using SEM. Fig. 8 shows the SEM micrographs for the C/N-doped TiO2 powder. As can be seen C/N-doped TiO2 powder shows a porous structure consisting of ∼150 μm – clusters which are consisting of smaller particles with an average size of 300 nm.
SEM micrographs for C/N-doped TiO2 aggregates.
3.5 TEM
Fig. 9 shows the TEM images of the C/N-doped TiO2. It can be clearly seen that the C/N-doped TiO2 particles have uniform size of about 35–40 nm which agrees with the aforementioned XRD-based calculations. The observed particles indicate that the CN doped TiO2 is highly crystalline.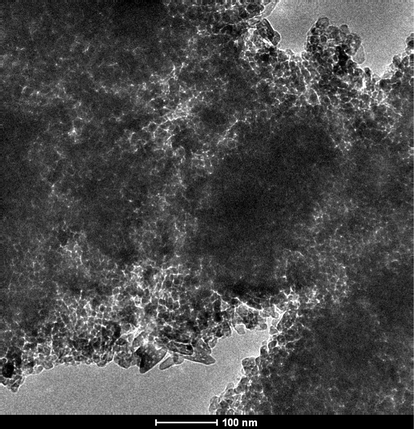
TEM image for the prepared C/N-doped TiO2.
3.6 Thermogravimetric analysis
The Thermal stability for the prepared material was tested using thermal gravimetric analysis as shown in Fig. 10. C/N-doped TiO2 powder shows negligible weight loss which confirms that the organic constituents that were used during the synthesis process were completely removed during the carbonization process.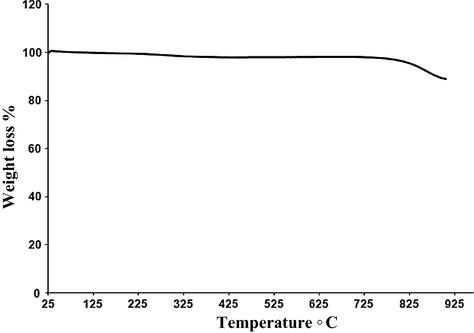
TGA thermogram of the prepared C/N-doped TiO2 after carbonization at 550 °C for 5 h.
3.7 Raman spectroscopy
Raman spectroscopy was used to investigate various phases of titanium dioxide. Fig. 11 shows the Raman spectra for the pure TiO2 and C/N-doped TiO2 in the range of (A) 100–3300, (B) 100–800 and (C) 100–300 cm−1. Raman peak at about 146 cm−1 was attributed to the main Eg anatase vibration mode. Moreover, vibration peaks at 190 cm−1 (Eg), 391 cm−1 (B1g), 512 cm−1 (A1g), and 634 cm−1 (Eg) are corresponding to anatase TiO2. The spectrum for the C/N-doped TiO2 sample proves that the anatase TiO2 is the dominant phase, which is consistent with the results of XRD patterns (Cong et al., 2007). It has been known that the Eg, B1g and the A1g peaks are originated from symmetric stretching, symmetric bending and antisymmetric bending vibrations of O—Ti—O in TiO2, respectively (Tian et al., 2012). Consequently, comparing the lowest frequency peak at 146 cm−1 for the C/N-doped TiO2 with the un-doped TiO2, it can be seen that the intensity of this peak is increased and its width is broadened and slightly shifted after nitrogen doping.
Raman spectra for the pure TiO2 and C/N-doped TiO2 in the range of (A) 100–3300 (B) 100–800 cm−1 and (C) 100–300 cm−1.
The D and G peaks appear at 1347 and 1585 cm−1 respectively. D peak corresponds to the presence of alternating ring stretch vibration in benzene ring (present in the polyaniline). G peak indicates the presence of the C⚌C sp2 stretch vibration in benzene ring (Schwan et al., 1996). The ratio of D band to the G band equals 0.904.
3.8 Photocatalytic reactivity
The concentration of phenol at various time intervals was followed to determine the kinetics of disappearance of phenol. In Fig. 12, the effect of UV irradiation time on the concentration of phenol in the presence of the C/N-doped and undoped TiO2 is presented. The results showed an enhanced removal activity compared to the commercial TiO2 after 60 min of irradiation time. A 63.7% of phenol was photodegraded by the CN doped TiO2. However, for pure TiO2 sample, only 57% of phenol was photodegraded. The phenol degradation rate increased rapidly in the first 90 min. After 150 min of irradiation time, the degradation percentage of phenol in the presence of C/N-doped TiO2 and undoped TiO2 is almost the same which is around ∼87%. This identical degradation percentage is attributed to the accumulation of the CO2 on the surface of the catalyst resulting in reducing its activity.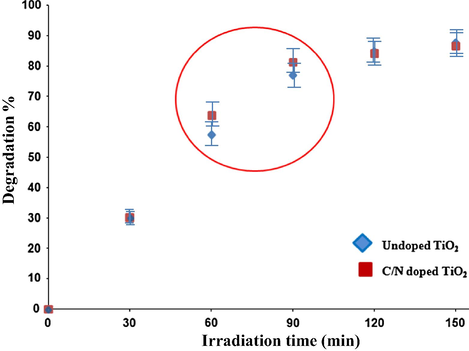
Effect of UV irradiation time on the concentration of phenol in the presence of the C/N-doped and undoped TiO2.
The oxidation reaction of phenolic compounds was initiated by •OH radicals. Hydroxyl group has an important influence on the chemical properties of TiO2. In the presence of O2, the •OH radicals are generated as shown in Fig. 13 (Alnaizy and Akgerman, 2000; Shawabkeh et al., 2010). Then the •OH radicals react with phenol to produce carbon dioxide and water. The proposed mechanism is represented in detail in Fig. 14. In fact, more studies are needed to prove the accuracy of the proposed mechanism.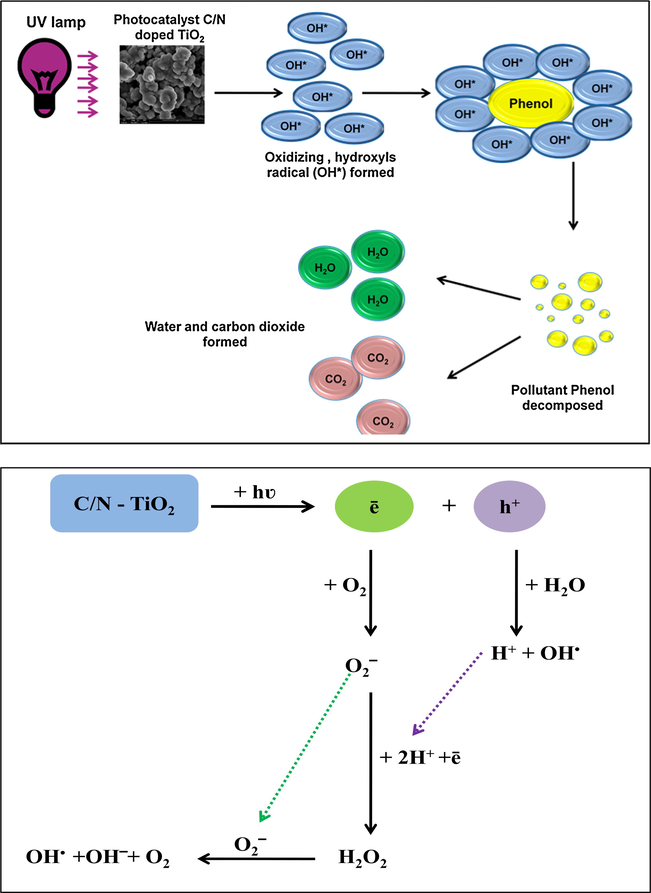
Mechanism of generation of hydroxide ions and hydroxyl free radicals using C/N-doped TiO2 under UV irradiation (Shawabkeh et al., 2010).
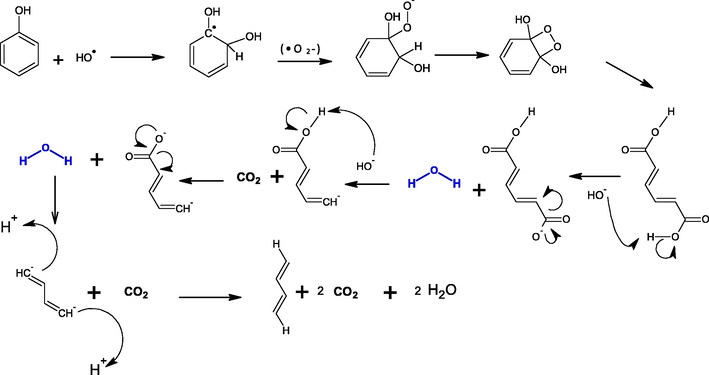
Proposed decomposition mechanism of phenol by •OH radicals to produce carbon dioxide and water.
4 Conclusions
Carbon/Nitrogen-doped TiO2 nanoparticles, with a particle size of ∼35–40 nm, were prepared by using carbon tetrachloride and polyaniline as the source for carbon and nitrogen, respectively. The resulting materials were characterized by XRD, TEM, FT-IR, SEM, TGA, Raman spectroscopy and XPS techniques. The characterization results revealed the presence of nitrogen in the TiO2 lattice. XPS analysis showed N-doping concentrations of 0.4 atomic% for the C/N-doped TiO2. Under UV irradiation, the resulting samples showed better removal efficiency for phenol than the commercial TiO2 photocatalyst after 60 min of irradiation time where the degradation percentage was 64% compared to 57%. After 90 min the degradation percentage became similar ∼87% which is due to the accumulation of the CO2 on the surface of the C/N-doped TiO2 catalyst which resulted in reducing its activity. The total amount of phenol that was removed was 87% at 150 min.
Acknowledgment
The authors gratefully thank the Center for Advanced Materials at Qatar University for supporting this research.
References
- Nanostructured crosslinked polyaniline with high surface area: synthesis, characterization and adsorption for organic dye. Chem. Eng. J.. 2012;204:75-86.
- [Google Scholar]
- Preparation of N-doped TiO2: characterization and photocatalytic performance under UV and visible light. Phys. Chem. Chem. Phys.. 2009;11:4084-4093.
- [Google Scholar]
- Photocatalytic degradation for environmental applications, a review. J. Chem.Tech. Biotechnol.. 2002;77:102-116.
- [Google Scholar]
- Photoelectron spectroscopy investigation of nitrogen-doped titania nanoparticles. J. Phys. Chem. B. 2004;108:15446-15449.
- [Google Scholar]
- Electrochemical photolysis of water at a semiconductor electrode. J. Phys. Chem. C.. 2007;111:6189-6193.
- [Google Scholar]
- Preparation, photocatalytic activity, and mechanism of nano-TiO2 co-doped with nitrogen and iron (III) J. Phys. Chem. C. 2007;111:10618-10623.
- [Google Scholar]
- Enhanced photocatalytic degradation properties of nitrogen-doped titania nanotube arrays. Trans. Nonferrous Met. Soc. China. 2009;19:1583-1587.
- [Google Scholar]
- Electrochemical photolysis of water at a semiconductor electrode. Nature. 1972;238:37-38.
- [Google Scholar]
- Synthesis of mesoporous titanium dioxide by soft template based approach: characterization and application in dye-sensitized solar cells. Energy Environ. Sci.. 2010;3:838-845.
- [Google Scholar]
- Photocatalytic degradation of a mixture of crystal violet (Basic Violet 3) and methyl red dye in aqueous suspensions using Ag+ doped TiO2. Dyes Pigm.. 2006;69:224-232.
- [Google Scholar]
- Effect of carbon doping on the mesoporous structure of nanocrystalline titanium dioxide and its solar-light-driven photocatalytic degradation of NOx. Langmuir. 2008;24:3510-3516.
- [Google Scholar]
- A low-band gap, nitrogen-modified titania visible-light photocatalyst. J. Phys. Chem. C. 2007;111:11445-11449.
- [Google Scholar]
- Preparation of nanocrystalline nitrogen-doped mesoporous titanium dioxide. Mendeleev Commun.. 2013;23:11-13.
- [Google Scholar]
- Photocatalytic degradation of various types of dyes (Alizarin S, Crocein Orange G, Methyl Red, Congo Red, Methylene Blue) in water by UV-irradiated titania. Appl. Catal. B. 2002;39:75-90.
- [Google Scholar]
- Development and performance study of visible-light composite adsorption material based on nitrogen-doped titania. Tongji Daxue Xuebao, Ziran Kexueban. 2010;38:1787-1791.
- [Google Scholar]
- Photocatalytic degradation of 4-Chlorophenol using TiO2 and Pt–TiO2 nanoparticles prepared by sol–gel method. J. Adv. Oxid. Technol.. 2007;10:369-374.
- [Google Scholar]
- Degradation of methylene blue on carbonate species-doped TiO2 photocatalysts under visible light. Chem. Lett.. 2004;33:750-751.
- [Google Scholar]
- Decolorization of methyl orange using Fenton-like mesoporous Fe(2)O(3)-SiO(2) composite. J. Hazard. Mater.. 2011;185:359-365.
- [Google Scholar]
- Titanium nitride oxidation chemistry, an X-Ray photoelectron spectroscopy study. J. Appl. Phys.. 1992;72:3072-3079.
- [Google Scholar]
- Visible light activity and photoelectrochemical properties of nitrogen-doped TiO2. J. Phys. Chem. B. 2004;108:19384-19387.
- [Google Scholar]
- Photocatalytic degradation of phenol using Fe–TiO2 by different illumination sources. Int. J. Chem.. 2010;2:10-18.
- [Google Scholar]
- Structural characterization and photocatalytic activity of NiO/AgNbO3. J. Alloys Compd.. 2010;496:633-637.
- [Google Scholar]
- Raman spectroscopy: a new approach to measure the percentage of anatase TiO2 exposed (0 0 1) Facets. J. Phys. Chem. C. 2012;116:7515-7519.
- [Google Scholar]
- Visible light active photocatalytic degradation of bisphenol-A using nitrogen doped TiO2. J. Nanosci. Nanotechnol.. 2006;6:2499-2507.
- [Google Scholar]
- Two-dimensional hexagonally-ordered mesoporous carbon nitrides with tunable pore diameter, surface area and nitrogen content. Adv. Funct. Mater.. 2008;18:816-827.
- [Google Scholar]


