

Translate this page into:
CeO2-CePO4 and Ag@CeO2-CePO4 nanocomposites from Penaeus semisulcatus for heavy metals sensing, UV shielding and cytotoxic applications
⁎Corresponding author. peter.che@voccollege.ac.in (Thomas Peter Amaladhas)
-
Received: ,
Accepted: ,
This article was originally published by Elsevier and was migrated to Scientific Scholar after the change of Publisher.
Abstract
CeO2-CePO4 and Ag@CeO2-CePO4 nanocomposites (NCs) were prepared using Penaeus semisulcatus and characterized by various analytical techniques. The NCs exhibited spherical morphology, with average particle sizes measuring 2.36 nm, 3.30 nm and 29.64 nm for the samples air dried, annealed at 550 °C and 800 °C respectively, and the Selected Area Electron Diffraction patterns from HR-TEM revealed their crystalline nature. In 3d X-ray Photoelectron Spectra (XPS) of NCs, the highest binding energies were observed at 916.46 eV (3d3/2) and 898.16 eV (3d5/2) with spin–orbit splitting of 18.3 eV. The X-Ray Diffraction (XRD) patterns of the NCs showed peaks typical of both CeO2 and CePO4 phases. The Fourier Transform-Infra Red (FT-IR) spectrum contained bands due to Ce-O stretching at 560 cm−1 and PO43- groups at 1008 and 711 cm−1, which was further substantiated by Raman spectrum, which had an intense peak at 468 cm−1 corresponding to F2g band of CeO2 and another peak at 976 cm−1 due to PO43- tetrahedron. In the Ultraviolet-Visible Diffuse Reflectance Spectra (UV-Vis DRS), the broad absorption peak at 352 nm and minor peaks around 300 nm confirmed the formation of CeO2-CePO4 NCs. The green synthesized NCs were excellent fluorescence sensors for Pb2+, Cd2+ and Hg2+ in a wide range of concentrations, from 5.0x10⁻⁹ M to 4.0x10⁻⁵ M. The concentration Vs. emission fitting plot had three distinctive linear ranges. At a low concentration range (5x10⁻⁹ to 3.5x10⁻⁷ M), the limit of detection for Pb2+, Cd2+ and Hg2+ was found to be 2.41x10⁻⁸, 2.56x10⁻⁸ and 3.11x10⁻⁸ M. The sensitive detection of a mixture of heavy metal ions in ppb levels by biocompatible NCs gained insight in treating aqueous industrial wastes. Further, NCs showed cytotoxicity and UV shielding properties.
Keywords
CeO2-CePO4 nanocomposites
Penaeus semisulcatus
Sensing of heavy metals
Sun protection factor
Cytotoxicity

1 Introduction
Nanoparticles (NPs) have brought about a revolution in technology by finding applications in diverse fields including medicine, military, aerospace, cosmetics, textile, electronics, catalysis, energy generation and storage. Metal nanoparticles find applications as nanomedicines, solar cells, supercapacitors, electroluminescent displays, catalysts, biosensors and electrochemical sensors (Singh et al., 2021). Metal oxide nanoparticles find utility in regenerative antioxidation, catalytic converters, antimicrobial coatings, ultraviolet filters in sunscreen, fluorescent probes, light emitting diodes and in vivo cell imaging (Nadeem et al., 2020).
Nanoparticles are typically produced through physical, chemical and biological approaches. Biosynthesis is referred to as ‘green synthesis’ as it is environmentally benign, less toxic and cost-effective. Biosynthetic routes generally utilize microorganisms and plant components as reducing (Devi et al., 2016) and capping agents (Priya and Peter, 2021), and they also serve as templates. Prokaryotic bacteria, yeast and fungi are some microorganisms that have been used in biosynthesis. Further, plant bio metabolites from plant leaves (Devi et al., 2022), roots, stem (Priya et al., 2016), seeds, etc. have been used for the syntheses of metal oxides, bimetallic and noble metals NPs (Subramanian et al., 2021). The unique optical, mechanical, surface, thermal, chemical, electrical, biological and physical characteristics of nanomaterials, synthesized by green methods make them superior to those synthesized by chemical methods (Fauzi et al., 2022).
Cerium oxide nanoparticles (CeO2 NPs), with fluorite crystalline structure, stand out as unique among the diverse array of metal oxide nanoparticles. Affordability, chemical stability, Ce3+/Ce4+ redox stability, biocompatibility, oxygen storage potential and non-hazardous nature are some fascinating properties of ceria nanoparticles which enhance their suitability for diverse applications (Sun et al., 2020). They find manifold applications in agriculture, fuel oxidation catalysis, supported catalysis (Sheeba et al.,), corrosion protection, enzyme mimicking, neuroprotection, radiotherapy, bioremediation, automotive exhaust treatment, semiconductors, hydrogen storage materials, pharmacological agents, bio scaffolding, drug delivery and sensing. CeO2 NPs have low surface area, a restricted range of visible light absorption and a propensity for high electron-hole recombination and are generally overcome by doping and formation of hetero junction (Singh et al., 2020).
Cerium phosphate nanoparticles (CePO4 NPs), which exhibit high UV absorptivity and low photocatalytic activity, have been proven to be efficient UV filters. They find applications in cosmetics, nuclear waste storage materials, automobile catalytic poisons, laser technology, fluorescence labels and as proton-conducting membranes in fuel cells (Peter et al., 2022). CePO4 nanotubes are efficient biosensors and have bioelectrochemical applications. CePO4 NPs have been generally synthesized through hydrothermal method, sol–gel route, co-precipitation, solvothermal, sonochemical and reverse microemulsion techniques (De and Serra, 2013). It exists in two crystal forms, viz., monoclinic and hexagonal. The monoclinic form formed at higher temperatures has a longer luminescent lifetime. Transformation of CePO4 from hexagonal to monoclinic phase can be induced by adjusting the initial PO43-/Ce3+ ratio. The luminescent properties of CePO4 can be improved by doping with metal ions and decorating with CeO2 nanomaterials (Vinothkumar et al., 2018). The method of preparation and calcination temperature influence their optical properties. The photoluminescence of CePO4 NPs is associated with surface defects and oxygen vacancies, which create energy levels bridging between the Ce 4f state and the O 2p valence band. These defects serve as emission centers and do not exhibit any quenching effect. Optical studies of CePO4 NPs reveal that they have direct band gap, allowing an electron to directly radiate a photon (Bouddouch et al., 2021).
CeO2-CePO4 nanocomposites (NCs) have been produced by hydrothermal, coprecipitation and chemical routes (Fijołek and Wolski, 2022) and they are remarkably pronounced for their reversible switching between Ce3+ and Ce4+ oxidation states in nano dimension. The reduction of Ce4+ to Ce3+ leads oxygen deficiencies (positively charged) within the CeO2 lattice. The electron transfer between CePO4 and CeO2 enhances their luminescence properties (Noor et al., 2021). Though biosynthesis of metal oxide and metal NPs has been well explored using plant resources, very little attention has been drawn towards the utility of sustainable and edible marine resources (Yosri et al., 2021). A thorough study of literature reveals that Ag and Au NPs have been biosynthesised from marine algae (Fawcett et al., 2017), seaweeds (Devi et al., 2022), sea cucumber (Holothuria scabra) (Sepahvand et al., 2020), jellyfish (Nemopilema nomurai), marine invertebrate (polychaete), seahorse (Hippocampus spp.), Se NPs from marine oyster (Abalone viscera) (Yosri et al., 2021); ZnO NPs from Penaeus semisulcatus (Ishwarya et al., 2019) and CeO2 NPs from marine oyster (Safat et al., 2021). There is only one report on the biosynthesis of CeO2-CePO4 NCs using leaf extract of Artocarpus heterophyllus (Noor et al., 2021).
Penaeus semisulcatus is abundant in bioactive constituents, encompassing essential proteins like haemocyanin, lectin, crustin, as well as a spectrum of amino acids, fatty acids, vitamins, and minerals (Preetham et al., 2020). Studies have indicated a notable presence of amino acids such as arginine, histidine, threonine, lysine, methionine, isoleucine, leucine, phenylalanine, and valine (El-Gendy et al., 2018). Additionally, the composition comprises saturated fatty acids like stearic and palmitic acid, the monounsaturated oleic acid and polyunsaturated fatty acids such as docosahexaenoic acid, cholesterol, eicosapentaenoic acid, omega-3 fatty acids, and total omega-6 fatty acids. Vitamin content encompasses A, B1, B2, B3, B6, B12, C, E and K. Furthermore, the extract contains minerals such as iron, phosphorus, potassium, magnesium, sodium, calcium, zinc, and copper (AlFaris et al., 2022).
After conducting an in-depth review of existing literature, it has been found that edible marine shrimp have not previously been utilized in the fabrication of CeO2-CePO4 NCs. This study marks a pioneering effort in presenting an environmentally friendly, swift and cost-effective single-step biosynthetic approach for the creation of CeO2-CePO4 NCs and silver doped CeO2-CePO4 NCs (Ag@CeO2-CePO4 NCs) utilizing an aqueous extract of P. semisulcatus, without externally introducing phosphate precursors. This methodology sets the stage for a novel approach in the biosynthesis of various types of bio-nanocomposites.
This study has three primary goals: (i) harnessing the potential of the edible marine organism P. semisulcatus for the bio-fabrication of CeO2-CePO4 NCs, (ii) utilizing these NCs for fluorescence sensing of heavy metals and (iii) investigating the UV shielding and cytotoxic properties of the NCs for potential applications in sunscreens.
2 Experimental section
2.1 Materials
(NH4)2Ce(NO3)6 and (Ce(NO3)3·6H2O) (99.9 %, AR Grade) were purchased from Sisco Research Laboratories. AgNO3 (≥99.5 %, AR Grade) was procured from Sigma-Aldrich. EDTA disodium salt, C10H14N2Na2O8·2H2O (AR grade, 99.0 %), CoCl2·6H2O, CuSO4·6H2O, NiCl2·6H2O (SRL, 99.0 %), CrCl3 anhydrous (99.9 %), FeCl3 anhydrous (99.9 %), HgCl2 (99.5 %), Cd(NO3)2·4H2O (98.0 %), Pb(NO3)2 (99.0 %) and (NH4)2Fe(SO4)2·6H2O (99.9 %) were acquired from Sigma Aldrich. The chemicals were utilized in their original form without any modifications.
2.2 Collection of P. semisulcatus and preparation of extract
Fresh and live P. semisulcatus were collected by trawl fishing from the Gulf of Mannar in Thoothukudi, Tamil Nadu, India. Shrimp shells and heads were removed and cleaned with copious amounts of water. Finally, the flesh part of the P. semisulcatus was dissected into tiny pieces and a 30 g portion of the flesh was weighed and then gently warmed to 40 °C in a water bath with 100 mL of bidistilled water for a duration of 10 min, followed by gradual cooling to ambient temperature. The resulting extract, obtained by filtering the supernatant through Whatman No. 41 filter paper, was utilized in the production of NCs.
2.3 Biosynthesis of CeO2-CePO4 NCs
To a solution of ceric ammonium nitrate (2.7412 g/100 mL, 0.05 M), an equal volume of the P. semisulcatus extract was slowly added dropwise (1:1 v/v) under magnetic stirring, followed by heating at 60 °C for 1 h. The yellow gel formed was further stirred in the magnetic stirrer for another 2 h at 1500 rpm. The protein-rich CeO2-CePO4 NCs was then centrifuged, extensively washed with water and air dried (labelled as CeNC@T1). Powdered CeNC@T1 was annealed at 550 °C for 3 h (labelled as CeNC@T2) and again annealed at 800 °C for 2 h (labelled as CeNC@T3) to obtain CeO2-CePO4 NCs.
2.4 Biosynthesis of Ag@CeO2-CePO4 NCs
Ag@CeO2-CePO4 NCs were synthesized adapting two methods. In the first method, AgNO3 (0.08494 g) was dissolved in the prepared yellow gel (section 2.3) and exposed to sunlight while stirring magnetically for another 2 h. In an alternate method, an equal volume of P. semisulcatus extract was added to a 0.005 M solution of AgNO3 and left in sunlight for 1 h. AgNPs thus prepared were added to the above yellow-coloured gel and magnetically agitated for another 2 h. The prepared gel was then centrifuged and washed with plenty of water and air dried. Finally, it was ground and further annealed at 800 °C for 2 h and labelled as Ag-CeNC@T3. The second method was followed owing to the more intense colour of AgNPs.
2.5 Biosynthesis of CePO4 NC
CePO4 NC was prepared by dissolving 2.1661 g of cerium nitrate hexahydrate (Ce(NO3)3·6H2O) in 100 mL of water (0.05 M) and 100 mL of the P. semisulcatus extract was added dropwise slowly (1:1 v/v) while stirring magnetically. The reaction mixture was further subjected to heating at 60 °C for 1 h. This resulted in the formation of a white gel which was further stirred for 2 h using a magnetic stirrer at 1500 rpm. The resultant CePO4 NC was further centrifuged, washed several times with water and subjected to air drying (CePO4NC@T1).
A schematic representation for the synthesis of different NCs mediated by P. semisulcatus extract is presented in Scheme 1.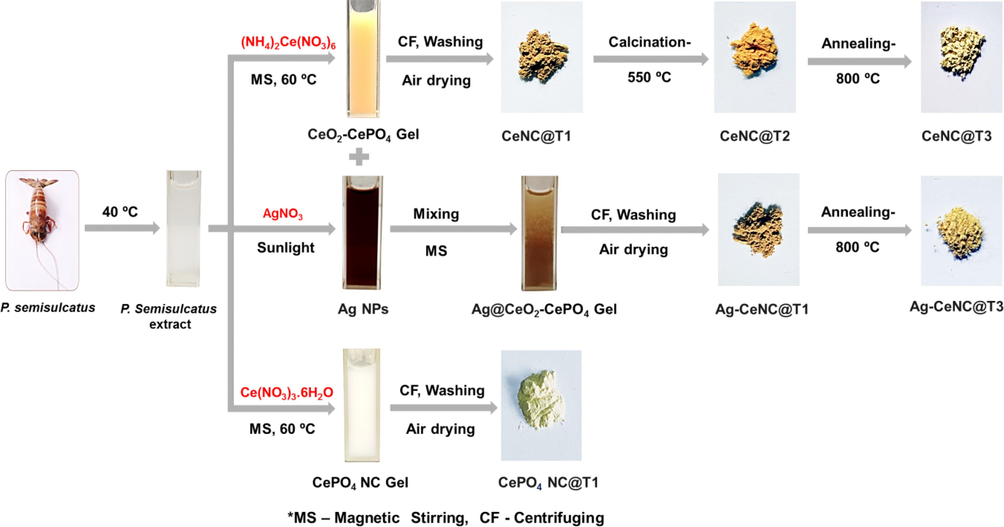
Schematic representation of P. semisulcatus extract mediated synthesis of NCs.
2.6 Characterization
UV–Visible Diffuse Reflectance Spectra (UV–Vis DRS) of synthesized NCs were captured using a UV–Visible spectrophotometer (JASCO, V-650 model) between 200 and 900 nm, and emission studies were carried out using a JASCO FP-8300 spectrofluorometer. A Shimadzu 8400S model instrument was used to record the Fourier Transform Infrared (FT-IR) spectra of dried shrimp extract and NCs in the range of 4000–400 cm−1 in KBr pellets. The crystallinity of the NCs was investigated using X-ray Diffraction (XRD) spectra obtained from an X'Pert Pro-PAnalytic Diffractometer with CuKα radiations (30 mA, λ = 1.5406 Å and 40 kV). Raman analysis was performed using a Horiba XploRA PLUS Raman microscope with laser wavelength 638 nm, and Energy Dispersive X-ray (EDX) analysis of NCs was done using Bruker Nano, GmbH, D-12489 instrument with an accelerating voltage of 30 kV. X-ray Photoelectron Spectroscopy (XPS) analysis was carried out to identify the chemical state of each element using PHI VersaProbe III instrument, which used a monochromatic Al-Kα X-ray source (hν = 1486.6 eV) with constant analyzer energy (26 eV) and binding energy was calibrated to 284.6 eV, which corresponds to the C-1s atom. High Resolution Transmission Electron Microscopy (HR-TEM) and Selected Area Electron Diffraction (SAED) measurements of the NCs were performed on JEOL 2100F and JEOL JEM 2100 PLUS instruments with an accelerating potential of 200 kV. HR-TEM images were acquired by dispersing the sample in an alcoholic medium that was cast onto copper grids and dried at ambient temperature.
2.7 Sensing of metal ions
To assess the potential of NCs as fluorescent sensors, different metal ions were examined at neutral pH under ambient conditions. For this, 10 mg of the NCs were dispersed in 30 mL bidistilled water (0.33 mg/mL) by continuously stirring with a magnetic stirrer throughout the experiment. 1 mL was taken from the dispersion setup and mixed with equal volume of target metal ions solution, to a total volume of 2 mL (0.05 M). The mixture was shaken for one minute, and the fluorescence spectra were then obtained with excitation at 220 nm. The fluorescence intensity of bio-derived NCs was enhanced by Pb2+, Hg2+ and Cd2+ and hence their potential to detect these metal ions was studied in detail in the concentration range of 5.0x10⁻⁹ M to 4.0x10⁻⁵ M. The Limit of Detection (LOD) was calculated using the formula: LOD = 3σ/ slope, where σ denotes the standard deviation of the blank (n = 10) (Gracia et al., 2022; Daphne et al., 2023; Gracia et al., 2023).
2.8 Evaluation of Sun protection factor (SPF) and cytotoxicity
SPF was detected using the method of Khan et al. (Khan, 2018) and the procedure is reproduced in S1 for quick reference. The in vitro screening of cytotoxicity of CeNC@T1 and CeNC@T2 was done by 3-(4,5-dimethylthiazol-2-yl)-2,5-diphenyltetrazolium bromide (MTT) assay (Gerlier and Thomasset, 1986) (S2). The cell viability was expressed using the formula:
3 Results and discussion
P. Semisulcatus has been reported to contain 36.9 % crude protein, 4.78 % lipid, 2.01 % carbohydrates and 56.43 % of water (El-Gendy et al., 2018) and minerals such as iron (0.51 %), phosphorus (0.16 %), potassium (0.43 %), magnesium (0.03 %), sodium (0.16 %), calcium (0.29 %), zinc (0.15 %), and copper (0.09 %) (AlFaris et al., 2022). The amino acids serine, threonine, tyrosine and histidine exist in phosphorylated form in P. semisulcatus. The phosphorus in the extract of P. semisulcatus has been estimated using Barton’s reagent (Ishwarya et al., 2016); (Potel et al., 2018).
On adding the aqueous extract of P. semisulcatus to cerium (IV) solution, the protein is adsorbed to the CeO2 gel formed (section 2.3) and reduces some of the Ce(IV) to Ce(III) which intrinsically facilitates oxygen vacancies. The phosphate ions in the shrimp extract stabilize part of Ce(III) as CePO4 (Fig. 1). The small size of CeO2 (section 3.7) is the result of simultaneous formation of CePO4 in the nanocomposite. The concentration of oxygen vacancies in ceria, reflected by the Ce3+/Ce4+ ratio, is influenced by various factors including nanoparticle size, morphology, dopants, surface area and the exposed high-energy facets of the ceria nanoparticles (Vinothkumar et al., 2018); (Noor et al., 2021).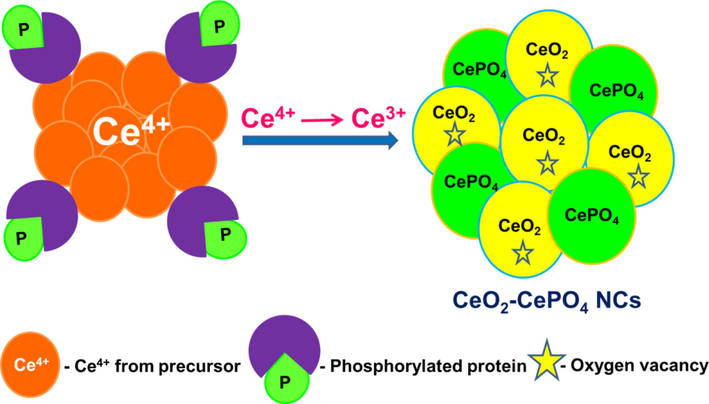
Possible mechanism for the one stretch synthesis of CeO2-CePO4 NCs.
3.1 X-ray diffraction analysis
XRD spectra of NCs delineated in Fig. 2. show typical peaks of CeO2 and CePO4 phases. The 2θ values of well-defined diffraction peaks along with crystallographic (hkl) planes are given in Table S1. The peaks reflect cubic fluorite structure of ceria (ICDD card no. 00–034-394) with fm̅3m space group (Vinothkumar et al., 2018). CePO4 is expected to be in monoclinic phase at 550 °C. However, all the distinct peaks associated with monoclinic phase of CeO2 are not observed in the diffraction pattern at this temperature owing to the convolution. Formation of CePO4 on the surface of CeO2 influences the particle size of nanoceria (Noor et al., 2021).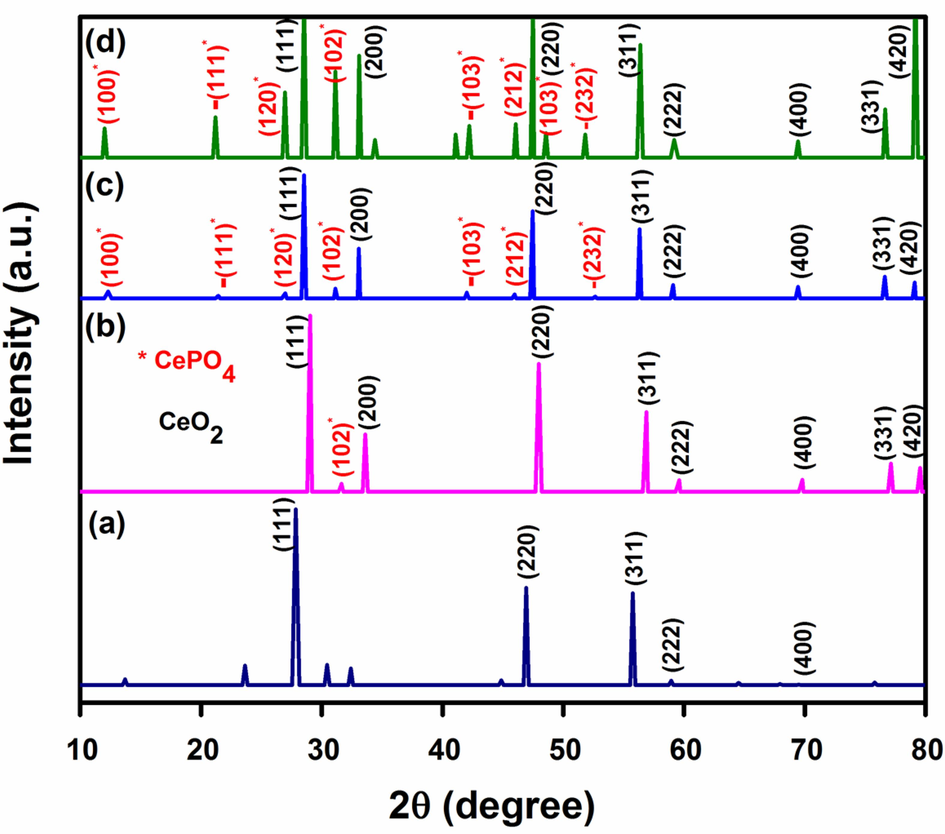
XRD patterns of (a) CeNC@T1, (b) CeNC@T2, (c) CeNC@T3 and (d) Ag-CeNC@T3.
In CeNC@T1, the prophenoloxidase peaks associated with the shrimp extract are located at 13.71 and 32.40 (Ishwarya et al., 2016), the peaks at 30.44 and 64.53 are due to lectin and the peak at 32.40 is attributed to peptide crustin (Sivakamavalli et al., 2020). Diffraction pattern of CeNC@T3 shows characteristic peaks corresponding to cubic CeO2 NPs and monoclinic CePO4 NPs and exhibits 66.56 % crystallinity. The peaks at 28.53, 33.06, 47.46, 56.33, 59.08, 69.42, 76.61 and 79.09 correspond to CeO2 phases (ICDD card no. 00–034-394) (Vinothkumar et al., 2018). Monoclinic phase of CePO4 is confirmed by diffraction peaks at 12.31, 21.44, 26.99, 42.02, 45.96 and 52.65 (JCPDS card no.32–0199) (Noor et al., 2021).
Ag-CeNC@T3 shows characteristic diffraction peaks corresponding to CeO2 at 28.55, 33.09, 47.50, 56.39, 59.19, 69.43, 76.33 and 79.17 which account for (1 1 1), (2 0 0), (2 2 0), (3 1 1), (2 2 2), (4 0 0), (3 3 1) and (4 2 0) planes respectively (ICDD card no. 00–034-394) (Vinothkumar et al., 2018). In Ag-CeNC@T3, peaks due to Ag+ ion are detected at 34.42 (Yang et al., 2016) and 41.09 (Shi et al., 2016). The peaks located at 12.03, 21.21, 26.95, 31.15, 42.22, 46.06, 48.56, 51.81 correspond to the (1 0 0), -(1 1 1), (1 2 0), (1 0 2), -(1 0 3), (2 1 2), (1 0 3) and -(2 3 2) planes of CePO4 NPs (JCPDS card no.32–0199) (Verma and Bamzai, 2014).
A study of literature reveals that phosphorus in the extract of P. semisulcatus can serve as the precursor for the CePO4 phase (Noor et al., 2021). The presence of CePO4 phase has been confirmed by the XRD patterns. Additionally, EDX analysis further supports this finding by indicating that CeNC@T3 contains 4.52 % phosphorus (Fig. S1). The crystallite size of the NCs is ascertained using Debye-Scherrer’s formula represented as D = kλ/β cos θ, where D, k, λ, β and θ represent the crystallite size, Scherrer constant (0.9), wavelength of X-ray beam, FWHM and the diffraction angle respectively. The average particle size of CeNC@T1, CeNC@T2, CeNC@T3 and Ag-CeNC@T3 has been found to be 4.78 nm, 6.51 nm, 44.29 nm and 32.73 nm respectively. With a marked increase in temperature from 550 °C to 800 °C, hexagonal phase of CePO4 transforms to monoclinic phase, which is accompanied by an increase in size of the nanoparticles.
3.2 UV–Vis DRS analysis
UV–Vis DRS spectral analysis of P. semisulcatus derived NCs was studied between 200 and 900 nm, and the results are compiled in Fig. 3. CeNC@T1, CeNC@T2 and CeNC@T3 show broad peaks centered at 352, 356 and 352 nm, humps around 256, 250 and 256 nm respectively, and a broad tail extending up to 800 nm. A closer examination of the CeNC@T3 spectrum reveals the presence of additional humps at 212 and 304 nm. The absorption spectra of CeNC@T2 and CeNC@T3 show an almost identical absorption edge in the visible region exhibiting a small shift in λmax. The difference observed in the slope of the absorption curve is attributed to the heightened degree of crystallinity in both the oxide and phosphate phases of cerium at elevated temperatures (Vinothkumar et al., 2018).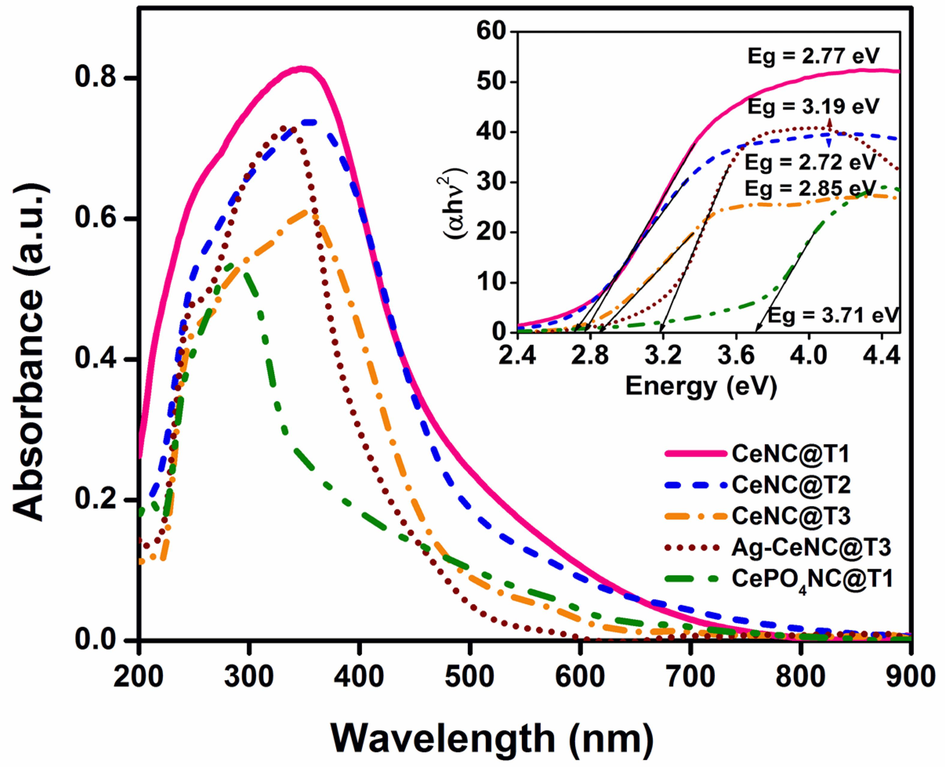
UV–Vis DRS spectra of NCs. Inset: Band gap energy calculation using Tauc plot.
In all these spectra, the broad peaks around 355 nm are typical of CeO2. Ce(IV) is a 4f0 system, where 4f-4f transition is not possible. The intense yellow colour of Ce(IV) compounds is due to charge transfer to metal (O2–(2p) to Ce4+(4f) in the 300–450 nm region (Choudhury et al., 2014). The peaks observed at 212, 256, 288 and 304 nm in CeNC@T3 are due to Ce(III) of CePO4 and originate from 2F5/2 (GS) to the 5d (ES) (200–320 nm range) (Vinothkumar et al., 2018; Dezfuli et al., 2014).
For comparison, CePO4 NC was prepared using Ce(III) precursor (section 2.5) and air-dried (CePO4NC@T1). It has a major peak at 286 nm and a small peak at 208 nm, revealing the presence of Ce3+. Most of the peaks due to Ce3+ are masked by LMCT in Ce4+ (Fang et al., 2003). The broad peak observed at 352 nm in CeNC@T3 is blue shifted at 336 nm in Ag-CeNC@T3 with a hump at 254 nm and cut-off wavelength of 600 nm. The hump around 300 nm due to Ce(III) is not observed in this spectrum.
The band gaps of synthesised CeNC@T1, T2, T3 and Ag-CeNC@T3 have been calculated by applying Tauc equation (Jubu et al., 2022). UV–Vis DRS spectra of the CeNC@T1, T2 & T3, Ag-CeNC@T3 and CePO4NC@T1 have distinct absorption bands around 354 nm and the optical band gaps have been calculated as 2.77, 2.72, 2.85. 3.19 and 3.71 eV respectively (Fig. 1 (inset)). Kubelka-Munk function has also been used to determine the optical band gap of the prepared nanocomposites (Noor et al., 2021). The optical band gaps of CeNC@T1, CeNC@T2, CeNC@T3, Ag-CeNC@T3 and CePO4NC@T1 using Kubelka-Munk function are 3.03, 2.95, 3.08, 3.34 and 3.82 eV. A band gap of 2.9–3.3 eV is observed for bulk CeO2 and band gap of 3.2–3.6 eV for both direct and indirect band transitions. CePO4 NPs have been reported to have a direct band gap of around 3.0 eV. The reduction in both direct and indirect band gaps in this study in comparison to the band gap values of pristine CeO2 and CePO4 nanoparticles is reported to be due to the synergy that exists between the two phases in the NCs. The same trend is observed in CeO2-InVO4 and CeO2-BiVO4 nanocomposites (Noor et al., 2021).
3.3 FT-IR spectral analysis
The FT-IR spectral data of P. semisulcatus extract, CeNC@T1, CeNC@T2, CeNC@T3 and Ag-CeNC@T3 are delineated in Fig. 4. The FT-IR spectrum of the extract (Fig. 4a) displays a broad peak centered at 3475 cm−1, which is attributed to –OH/NH groups from the protein. The peaks at 2972 and 2933 cm−1 indicate –CH stretching, while the band at 1637 cm−1 is attributed to the C=O of the peptide group. The peak at 1044 cm−1 corresponds to C-O stretch (Cozzolino and Murray, 2012). A specific feature of secondary amides is represented by the peak at 1456 cm−1 (Power and Cozzolino, 2020). The peak at 981 cm−1 confirms the presence of phosphorylated proteins (Jeyachandran et al., 2020), while the antisymmetric stretching of the C-O-C skeleton occurs at 1116 cm−1 and the band at 2338 cm−1, observed in all spectra, is indicative of trapped CO2 (Cheng et al., 2021).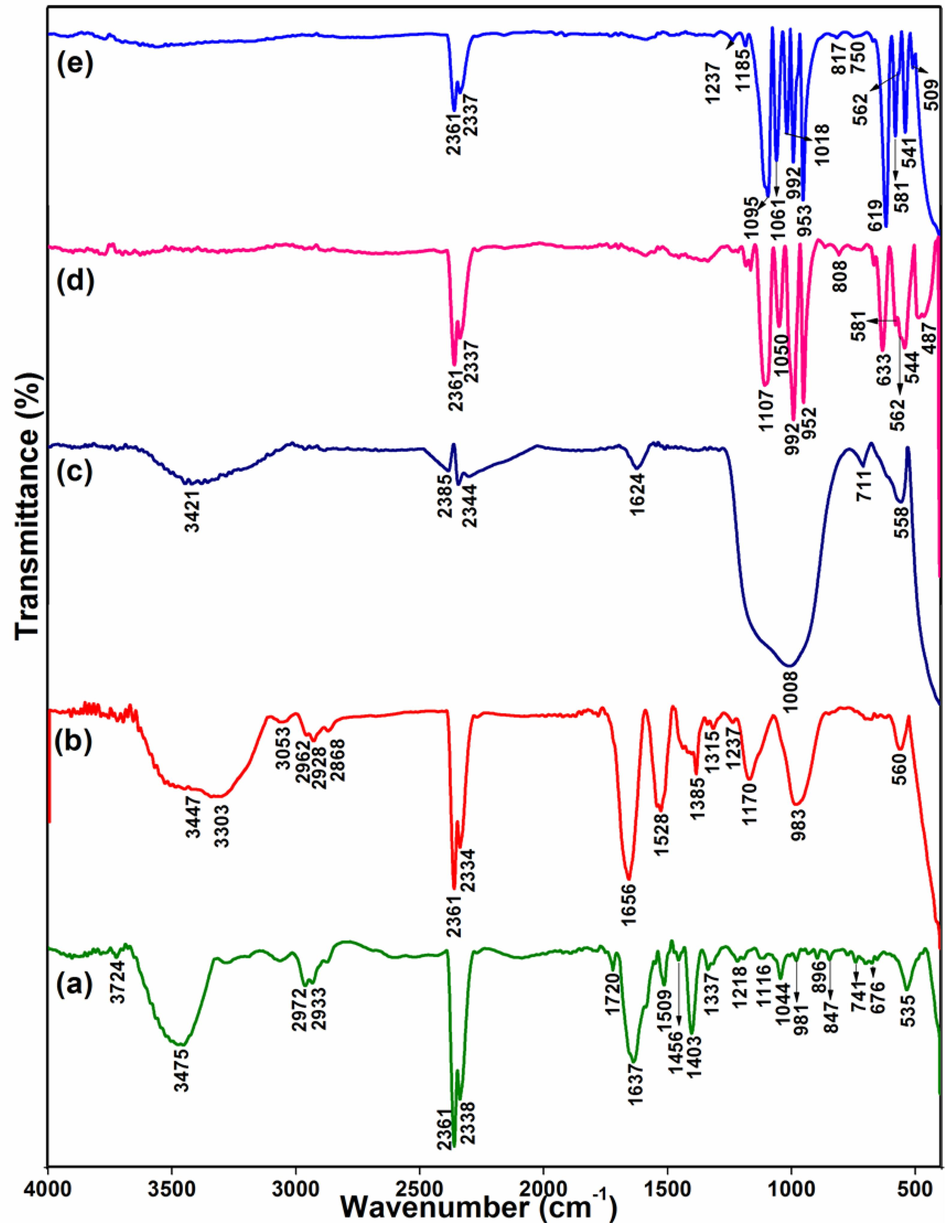
FT-IR spectra of (a) P. semisulcatus extract, (b) CeNC@T1, (c) CeNC@T2, (d) CeNC@T3 and (e) Ag-CeNC@T3.
In the FT-IR data of CeNC@T1, Ce-O stretching is at 560 cm−1 (Patil et al., 2016). The broad overlapping bands at 3447 cm−1 and 3303 cm−1 are due to –NH/OH of the protein or traces of H2O molecules. The peak at 1656 cm−1 is attributed to C=O of the peptide group. The peak located at 983 cm−1 confirms P-O of distorted PO43- tetrahedra. The FT-IR spectrum of CeNC@T2 shows a broad band centered around 3421 cm−1 and a peak at 1624 cm−1 corresponding to the stretching and bending modes of H2O. The presence of bands due to H2O molecules even after drying at 550 °C indicates that CePO4 is crystallized in hexagonal form and contains water of hydration, CePO4·nH2O (Lucas et al., 2004). The formation of CeO2 nanoparticles is corroborated by the Ce-O stretching observed at 558 cm−1 (Patil et al., 2016). The broad intense band at 1008 cm−1 and the peak observed at 711 cm−1 represent PO43- groups (Parimi et al., 2019).
FT-IR studies of CeNC@T3 show Ce-O stretching at 562 cm−1 and the peak due to PO43- (broad signal located at 1008 cm−1 in the case of CeNC@T2, is structured into many peaks. The peaks at 952, 992, 1050, 1107 cm−1 correspond to P-O stretching modes of PO43- and the signals at 544, 583, 633 cm−1 are due to bending vibrations of O-P-O and O=P-O, which confirm the presence of distorted tetrahedron of PO43- in monoclinic phase (Bouddouch et al., 2021; Cheng et al., 2021). The peaks associated with H2O molecules (3421 cm−1 and 1624 cm−1) observed for CeNC@T2 disappear in the spectrum of CeNC@T3 (dried at 800 °C) signifying the formation of monoclinic CePO4 from hexagonal CePO4·nH2O.
Almost similar peaks are identified in the FT-IR profile of Ag-CeNC@T3. Ce-O stretching is observed as a minor peak at 562 cm−1 which is masked by strong P-O bending vibrations. The P-O stretching modes of distorted tetrahedra are observed at 953 cm−1, 992 cm−1, 1061 cm−1 and 1095 cm−1. O-P-O bending and O-P bending corresponding to CePO4 nanoparticles are located at 541, 581 and 619 cm−1 (Bouddouch et al., 2021).
3.4 Raman spectral analysis
Raman spectrum of CeNC@T3 (annealed at 800 °C) was recorded from 3000 cm−1 to 450 cm−1 and the results are presented in Fig. 5. The inset represents a section of Raman spectrum in the range 1110 cm−1 to 389 cm−1. The most intense signal observed at 468 cm−1 is associated with the F2g band of CeO2 (Aslam et al., 2016). A slight shift from 465 cm−1 corresponding to single crystal ceria is related to the polycrystallinity of the nanocomposite (Schilling et al., 2017) or to the presence of defects, phonon confinement and strain effects. The broad nature of this peak indicates the smaller crystallite size of CeO2 NPs, the presence of defects and strain effects (Gouadec and Colomban, 2007).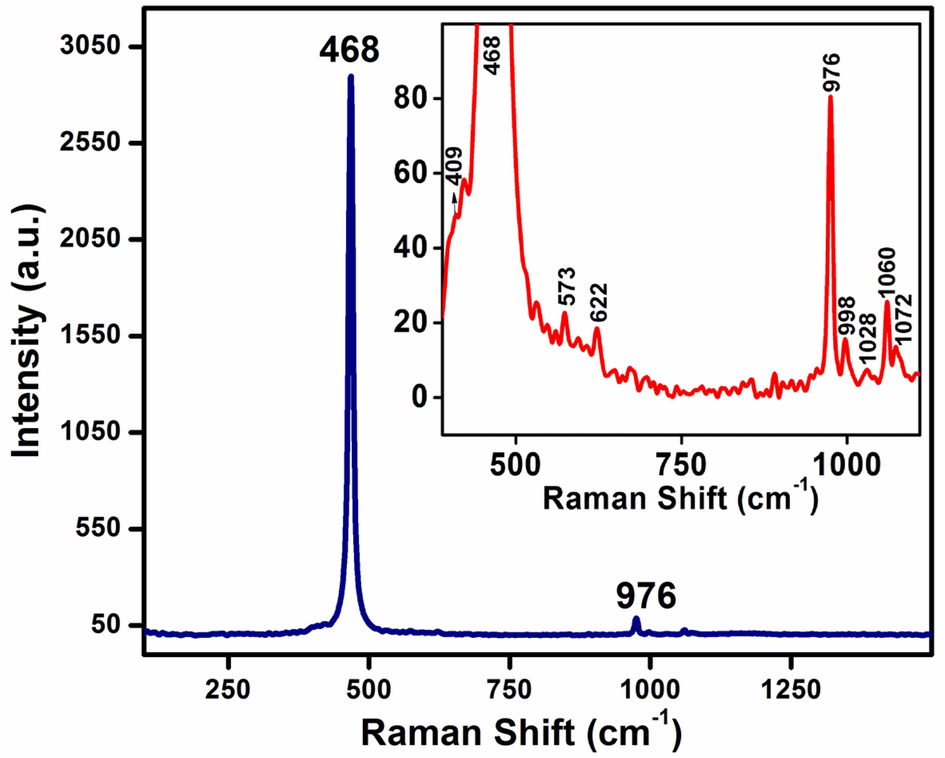
Raman spectrum of CeNC@T3. Inset: Expanded view from 1110 cm−1 to 389 cm−1.
Combined Eg + A1g stretching modes are observed as a small hump at 409 cm−1 (Schilling et al., 2017). The intense peak observed at 976 cm−1 ascertains PO43- tetrahedron present in the nanocomposite. The minor peaks at 998, 1028, 1060, 1072 cm−1 are also due to monoclinic CePO4 (Allen et al., 2021). The peak at 1072 cm−1 is associated with antisymmetric stretching of the P-O bond (Vinothkumar et al., 2018). The weak bands at 573 cm−1 and 622 cm−1 confirm the antisymmetric bending modes of PO43- group (Vinothkumar et al., 2018; Cheng et al., 2021). The bands of weak intensity resulting from the different phonon symmetry modes corresponding to second order shattering are also observed. Oxygen vacancies present in the cubic fluorite structure are further confirmed by the signal at 1060 cm−1 (Jayakumar et al., 2019). The ‘D band’ corresponding to the defects in nanocomposite is observed at 573 cm−1 (Calvache et al., 2019).
3.5 X-ray photoelectron spectral analysis
The chemical states of Ce and O and the Ce3+/Ce4+ ratio at the surface were assessed using XPS between 0 and 1000 eV. The deconvoluted 3d XPS spectrum of CeNC@T3 is given in Fig. 6b, which consists of 6 doublets (spin–orbit) (Vinothkumar et al., 2018). The peaks positioned at 882.27, 888.43, 898.16, 902.92, 911.39 and 916.46 eV are assigned to v, v′′, v′′′, u, u′′ and u′′′ of 3d5/2 and 3d3/2 states Ce4+ respectively. In addition, it shows four components at 880.75 (vo), 884.68 (v′), 900.67 (uo) and 907.03 eV (u′) associated with the main and satellite peaks of Ce3+ state of CePO4 (Beche et al., 2008; Konysheva and Francis, 2013). Ce(IV) present in cerium compounds is characterized by the satellite peak (u) associated with Ce 3d3/2. The highest binding energy peaks, u and v respectively are at 916.46 (3d3/2) and 898.16 eV (3d5/2) and the spin–orbit splitting is 18.3 eV (Matussin et al., 2023). The [Ce3+] and [Ce4+] in CeNC@T3 are 31.7 % and 68.31 %, respectively (Vinothkumar et al., 2018).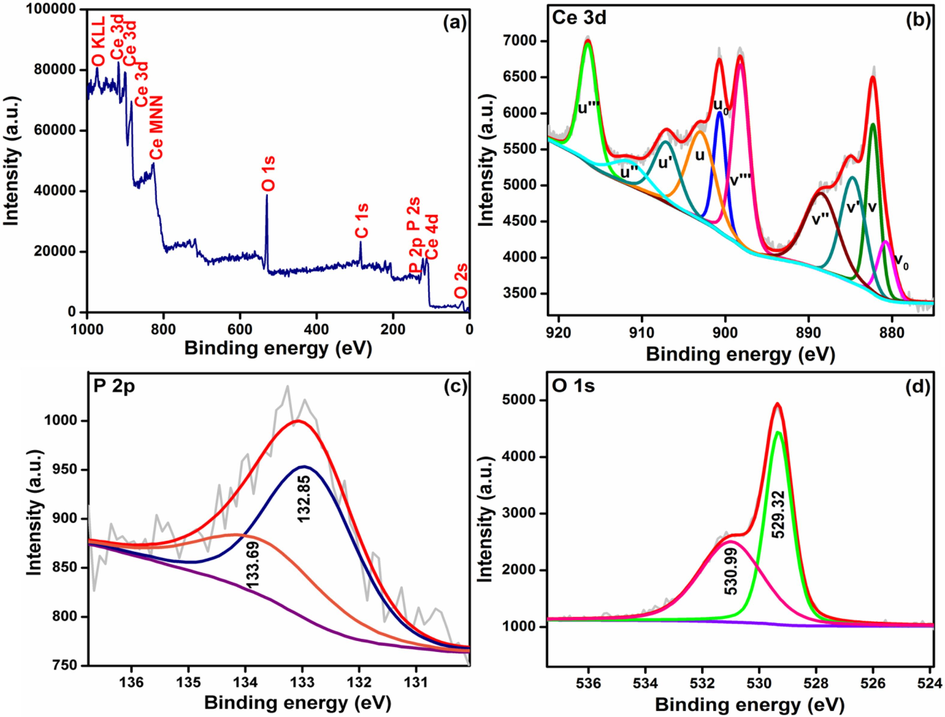
XPS of CeNC@T3 (a) Survey spectrum, Core level spectra of (b) Ce 3d, (c) P 2p and (d) O 1 s.
P 2p core level spectrum has an asymmetric peak centered at 133.1 eV which is deconvoluted further into two peaks identified at 132.85 eV (P 2p3/2) and 133.69 eV (P 2p1/2) (Fig. 5c), representing phosphorus in CePO4 (Vinothkumar et al., 2018; Fu et al., 2022). The O 1s core level spectrum of CeNC@T3 shown in Fig. 5d has two peaks at binding energies 529.32 and 530.99 eV. The presence of oxygen in Ce-O lattice is confirmed by the prominent peak at 529.32 eV. P-O bonding from PO43- octahedron corresponding to higher binding energy is located at 530.99 eV (Vinothkumar et al., 2018; Vinothkumar et al., 2018).
Chemical bonding nature of Ag-CeNC@T3 has also been analyzed applying XPS technique. The survey spectrum in Fig. 7a demonstrates that the sample comprises of Ce, O and Ag. The deconvoluted Ce 3d XPS spectrum of Ag-CeNC@T3 has peaks at 882.53, 886.22, 898.08, 900.63, 904.32, 907.95, 911.65 and 916.56 eV (Chen et al., 2022). The concentration of Ce3+ and Ce4+ species in Ag-CeNC@T3 are found to be 22.44 % and 77.56 %, respectively. One notable feature of this spectrum is that the peaks corresponding to Ce3+ ions are not located. This is in agreement with DRS data (section 3.1) in which LMCT peak of CeNC@T3 observed at 352 nm is shifted to 336 nm with narrowing of the peak and the band gap is increased to 3.19 eV from 2.85 eV. All these data suggest that on adding AgNPs to CeNC@T3, the defects associated with Ce3+ are reduced and some of the Ag0 are oxidized to Ag+ owing to the smaller work function of Ag compared to CeO2 (4.2 Vs 4.7 eV) (Matussin et al., 2023; Chen et al., 2022) and both species coexist on the surface of Ag-CeNC@T3. All these data suggest that surface oxygen vacancies of ceria are affected by silver loading and silver predominantly exists as Ag0 and oxidation to Ag+ occurs to a smaller extent (Chen et al., 2022; Qu et al., 2013).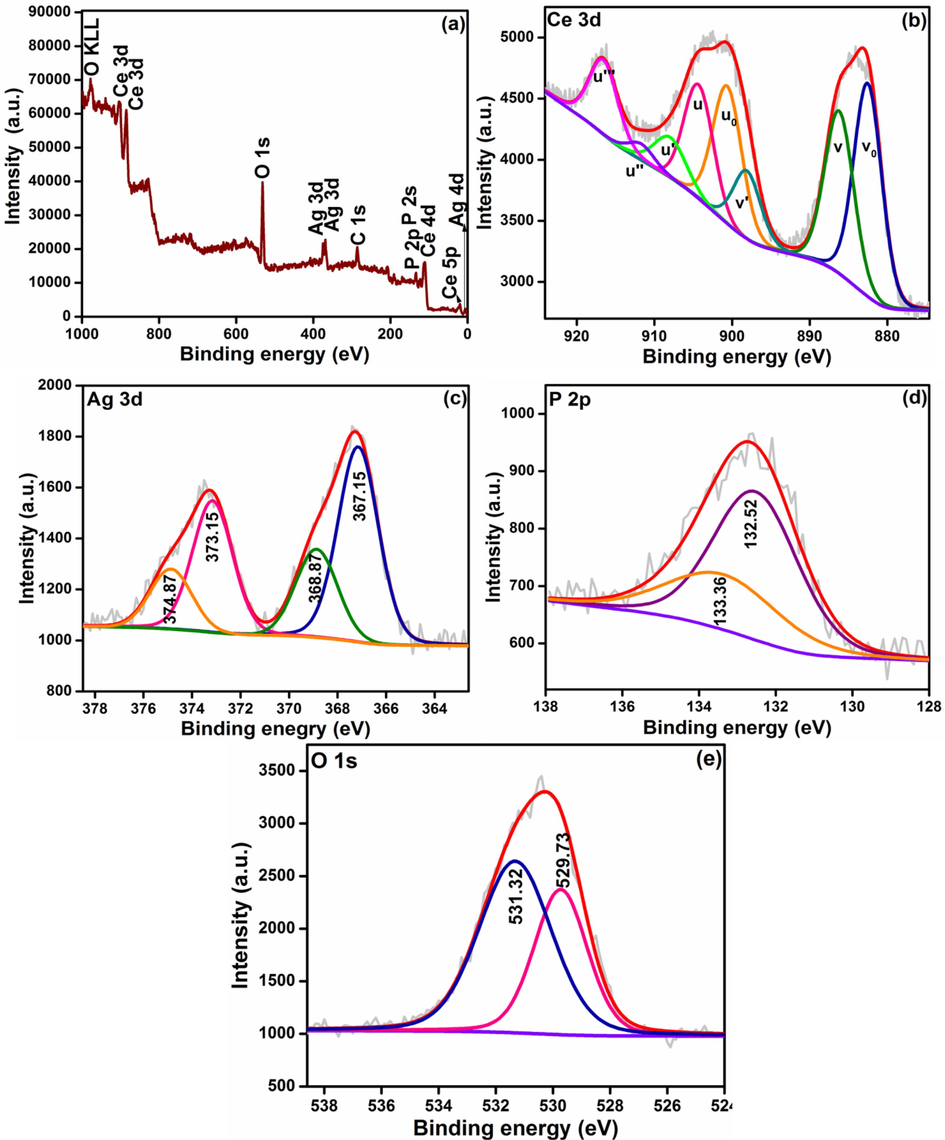
XPS of Ag-CeNC@T3 (a) Survey spectrum, Core level spectra of (b) Ce 3d, (c) Ag+/0, (d) P 2p and (e) O 1 s.
The deconvoluted 3d XPS spectrum of Ag has peaks at 367.15 eV due to Ag+ and the peaks at 368.87 eV, 373.15 eV and 374.87 eV correspond to Ag0. The peaks located at 368.87 and 374.87 eV correspond to Ag 3d5/2 and Ag 3d3/2 of metallic silver with spin–orbit coupling of 6 eV (Murugadoss et al., 2021). Further, in the case of Ag-CeNC@T3, the binding energy of Ag 3d5/2 shows a relative increase compared to that of pure metallic Ag (∼368.2 eV) signaling the loading of AgNPs to the surface of CeO2. This confirms that a new Fermi energy level is formed in Ag-CeNC@T3, and there is an interaction between Ag and CeO2 in the nanocomposite (Firet et al., 2019).
In addition, the P 2p peaks are shifted to lower energies 132.52 eV (132.85 eV) and 133.36 eV (133.69 eV), in comparison with CeNC@T3. The deconvoluted O 1s XPS spectrum of Ag-CeNC@T3 has two peaks. While comparing with CeNC@T3, a slight shift to higher energy is observed, 529.73 eV (529.32 eV), 531.32 eV (530.99 eV). The peak at 529.73 eV is due to O2 in the CeO2 lattice, whereas the peak observed at 531.32 eV may be correlated O/OH of oxygen adsorbed on the surface or P-O bonding from PO43- (Vinothkumar et al., 2018; Vinothkumar et al., 2018; Qu et al., 2013). No observable OH– peaks in the CeO2 nanoparticles adorned with Ag (Murugadoss et al., 2021).
3.6 EDX analysis
The EDX spectra of NCs is summarized in S3 and it features the signatures of cerium, oxygen, phosphorus and silver. In all NCs, a major peak is observed at 4.82 keV corresponding to cerium, and other minor peaks observed around 0.67, 0.87, 5.26, 5.63 and 6.01 keV are also attributed to cerium. In all the NCs, the presence of oxygen is confirmed from the prominent peak obtained at 0.52 keV. Similarly, a significant peak at 2.02 keV is attributed to the presence of phosphorus in all the four NCs (Vinothkumar et al., 2018). Additionally, in Ag-CeNC@T3, silver is confirmed by a salient peak observed at 2.96 keV along with minor peaks at 0.36 and 3.15 keV (Devi et al., 2022).
3.7 HR-TEM analysis
The surface morphologies of the synthesized nanocomposites were analyzed using HR-TEM and the representative images are presented in Figs. 8–10. The particles are found to be spherical and the SAED patterns reveal that the nanocomposites are highly crystalline. The average particle size of CeNC@T1, CeNC@T2 and CeNC@T3 are 2.36 nm, 3.30 nm and 29.64 nm correspondingly. The SAED pattern of CeNC@T2 has (1 1 1), (2 2 0), (3 1 1), (2 2 2), (4 2 0) and (3 3 1) planes of CeO2 and (1 0 2) planes corresponding to the monoclinic phase of CePO4. The crystalline nature of the nanocomposites is confirmed by the lattice fringes, and the SAED pattern, showing a ring-like pattern, further proves that the nanocomposites are crystalline, which corroborates with XRD data.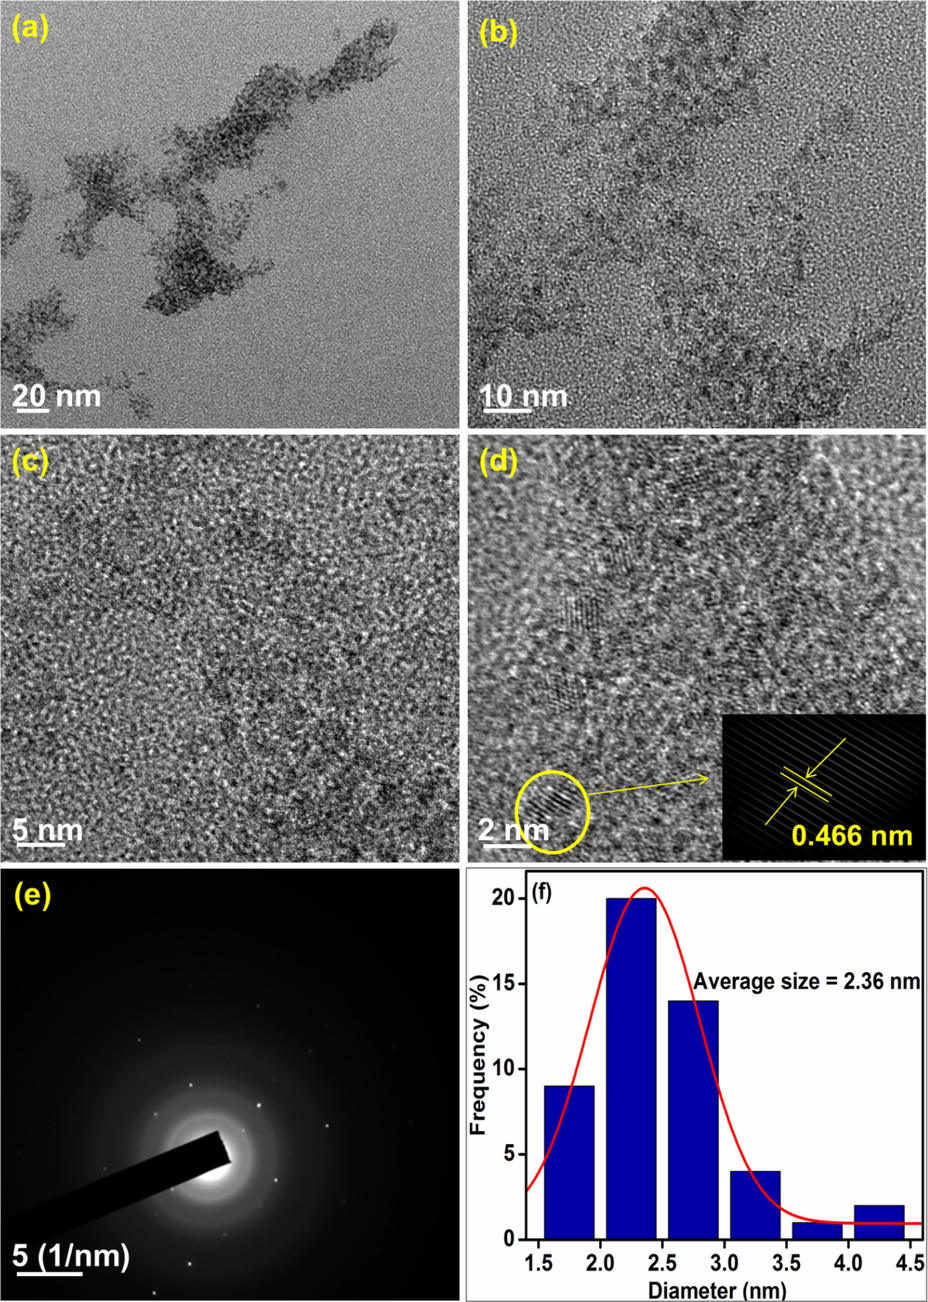
HR-TEM analysis: (a)-(d) images of CeNC@T1 at different magnifications, (e) SAED pattern and (f) Histogram representing particle size distribution.
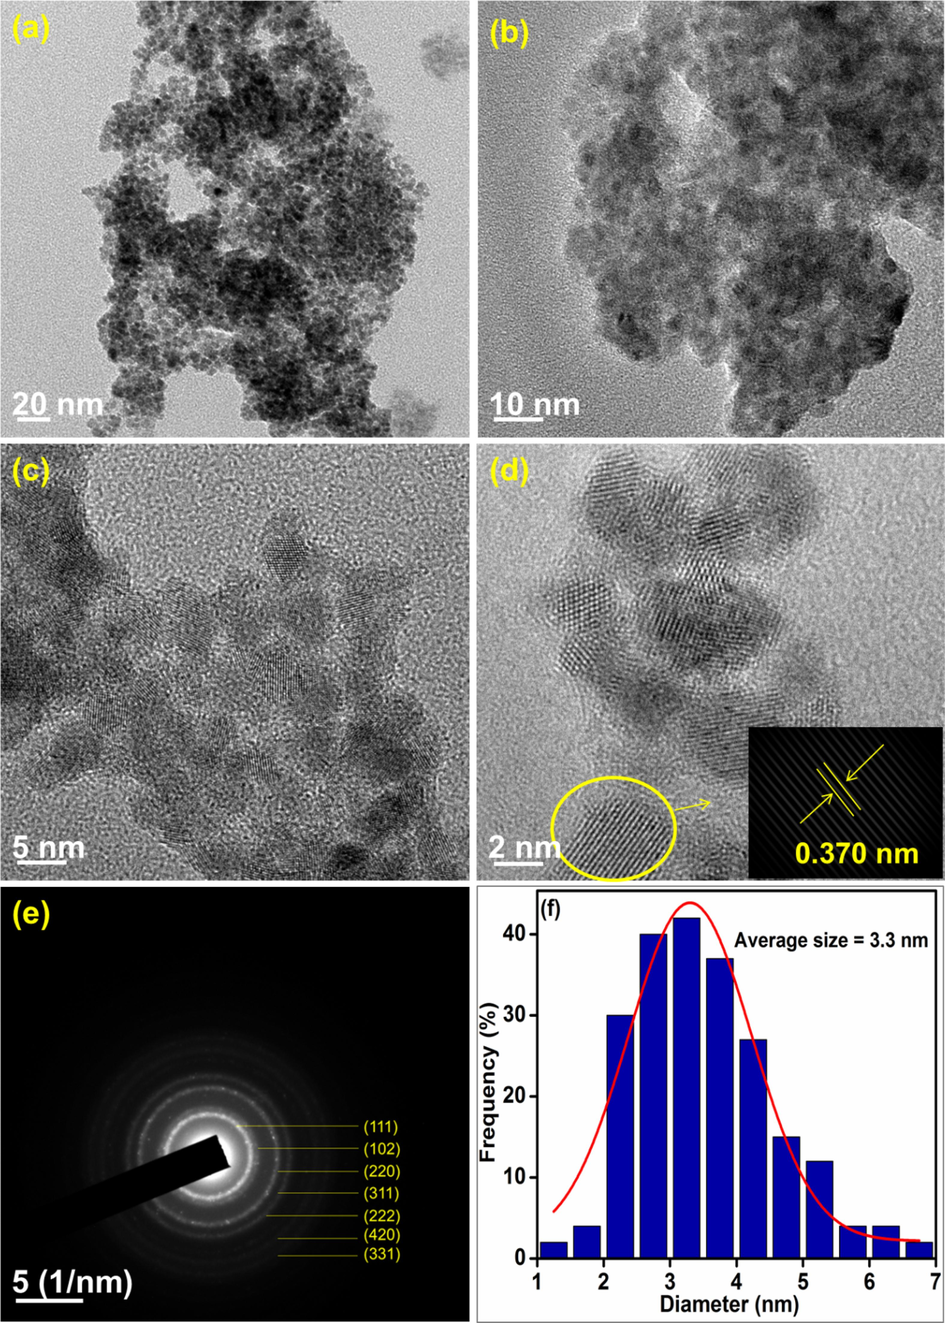
HR-TEM analysis: (a)-(d) images of CeNC@T2 at different magnifications, (e) SAED pattern and (f) Histogram representing particle size distribution.
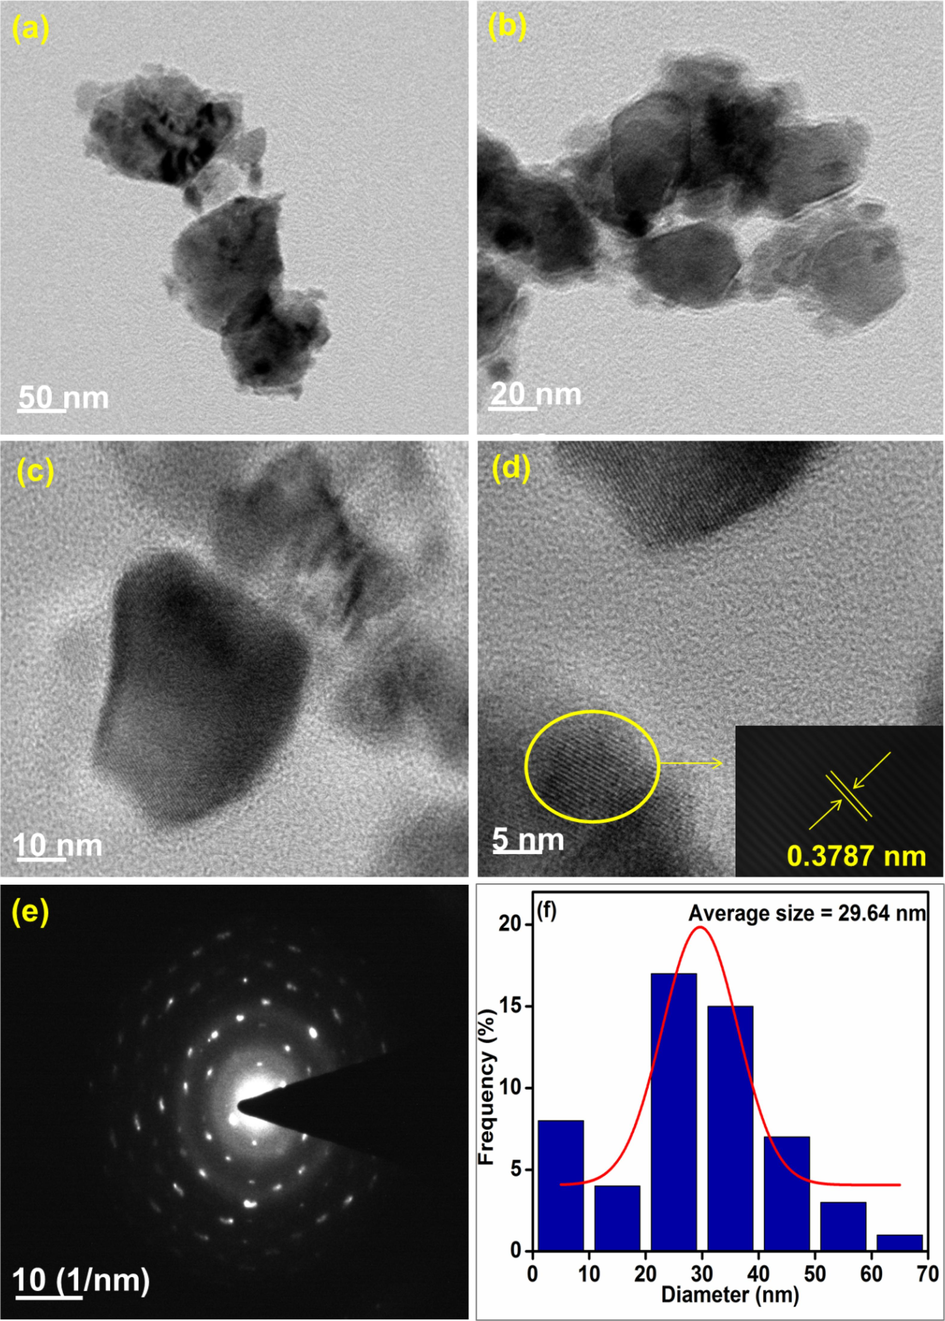
HR-TEM analysis: (a)-(d) images of CeNC@T3 at different magnifications, (e) SAED pattern and (f) Histogram representing particle size distribution.
3.8 Fluorescence study
The colour of fluorescence emission of CeNC@T3 and Ag-CeNC@T3 are found out applying Commission Internationale de l'Eclairage (CIE) chromaticity diagram. CeNC@T3 emitted almost a white light and Ag-CeNC@T3 emitted light close to the blue light region, which are shown in Fig. S2 a & b. The room-temperature fluorescence spectra of CeNC@T3, Ag-CeNC@T3 and CePO4NC@T1 were recorded as solid. The solid fluorescence spectra of NCs at different excitation wavelengths are given in Fig. 11.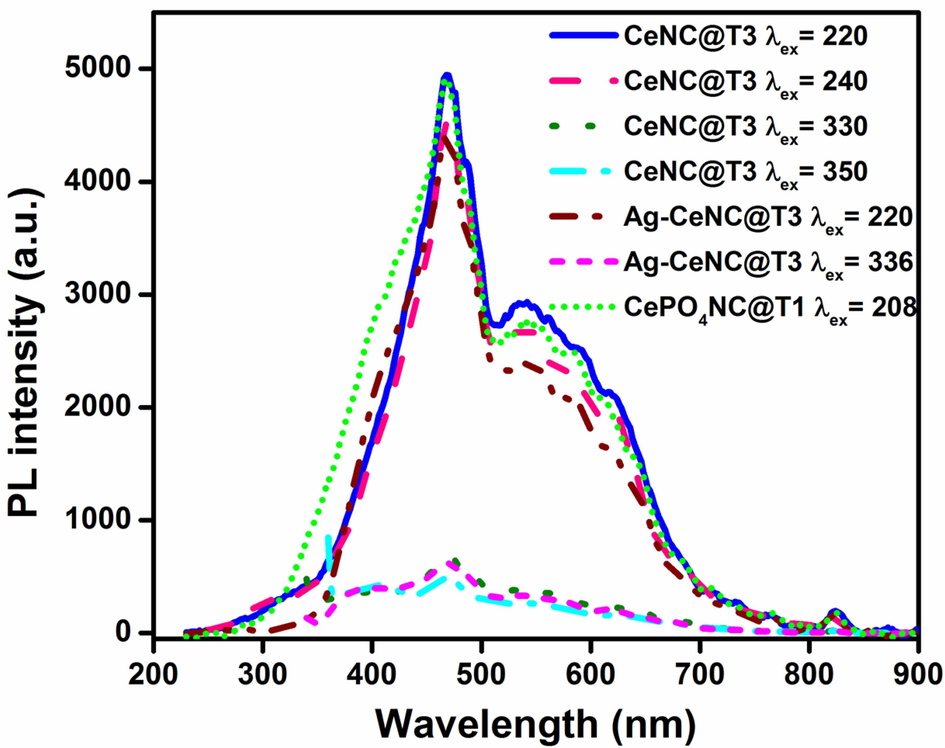
Fluorescence spectra of solid CeNC@T3, Ag-CeNC@T3 and CePO4NC@T1 at different excitation wavelengths.
CeO2 fluoresces in UV region due to emission from 4f energy levels (Krishnan et al., 2013) but owing to the defects attributed to Ce3+ it can emit light in visible region (Mochizuki and Fujishiro, 2009). The 220 nm and 240 nm excited emission spectrum of CeNC@T3 has peaks at 470, 486, 542, 616 and 824 nm and similar less intensity emission peaks are observed in 330 nm and 350 nm excitations. Ag-CeNC@T3 nanocomposite has major peaks at 396, 468, 486, 538 and 618 nm. The highest intensity emission signal observed around 470 nm in all the spectra is due to emission from 4f energy level. The less intense bands peaking at 542 and 616 nm could be attributed to emissions originating from oxygen defects. The emission bands spanning from 400 to 500 nm in the CeO2 samples are ascribed to transitions between various defect levels and the valence band (Aslam et al., 2016). The 5 excitation peaks corresponding to the 4f → 5d transition, induced by Ce3+ ions, and the peak at 300 nm is one of them (Qin and Niu, 2016). The emission spectrum of CePO4 nanocomposite formed using Ce3+ precursor (section 2.5) is compared with those of CeNC@T3 and Ag-CeNC@T3. CePO4NC@T1 (air dried) contains only CePO4 in hexagonal structure. The emission peaks are almost the same, suggesting that the emission is mainly due to CePO4.
4 Applications
4.1 Sensing of Pb2+, Cd2+ and Hg2+
As the CeO2-CePO4 NCs display an intense fluorescence emission, their application to sense various metal ions is explored. The presence of various metal ions, especially Pb2+, Cd2+ and Hg2+ leads to an augmentation in the emission intensity (Fig. S3 & S4). Hence the potential of aqueous dispersions of CeNC@T3 to sense these heavy metals in the wide range of concentrations (10-9 M to 10-5 M) is investigated.
On mixing Pb2+ ions to the aqueous dispersion of CeNC@T3, the emission intensity proportionally enhanced with [Pb2+] (Fig. S5). When altering the concentration of Pb2+ from 5.0x10⁻⁹ M to 4.0x10⁻⁵ M, the fitting plot exhibits three clearly defined linear ranges (Fig. 12). The corresponding linear fitting equations are Y1 = 6.4675X + 269.7334; Y2 = 0.8546X + 2863.75; Y3 = 0.04052X + 6574.321 with a correlation coefficient of 0.9934, 0.9978 and 0.9895 respectively, where X is the concentration of Pb2+ in nM. The LOD is found to be 2.41x10⁻⁸ M, 1.83x10⁻⁷ M, 3.85 x10⁻⁶ M in three regions respectively. The inset of Fig. 12 illustrates the magnified view of the low concentration range of Pb2+. This linear region is highly sensitive to the concentration of analytes. Hence it is worth developing CeNC@T3 as an inorganic fluorescent probe which can be easily prepared and is compatible with green chemistry for sensing heavy metals.![Plot of fluorescence intensity (F-F0) Vs [M2+], nM for CeNC@T3, Inset: Expanded view of 5 nM to 350 nM region.](/content/184/2024/17/1/img/10.1016_j.arabjc.2023.105382-fig13.png)
Plot of fluorescence intensity (F-F0) Vs [M2+], nM for CeNC@T3, Inset: Expanded view of 5 nM to 350 nM region.
Similarly, the Cd2+ and Hg2+ ions also increase the emission intensity to a greater extent (Fig. S6 & S7). In these cases also, there are three linear regions in which the emission intensity is directly proportional while increasing the concentration of these ions 10,000 folds between 5.0x10⁻⁹ M to 4.0x10⁻⁵ M (Fig. 12). The regression equations for Cd2+ are Y1 = 6.1004X + 323.5808; Y2 = 0.5861X + 2468.1944 and Y3 = 0.06173X + 5091.25 with a correlation coefficient of 0.9890, 0.9993 and 0.9915 respectively, where X is the concentration of Cd2+ (nM). The LOD is calculated to be 2.56x10⁻⁸ M, 2.66x10⁻⁷ M, 2.53x10⁻⁶ M. The regression equations for Hg2+ are: Y1 = 5.02132X + 324.3137; Y2 = 0.4211X + 1932.3333; Y3 = 0.06484X + 3889.4643 with a correlation coefficient of 0.9834, 0.9946 and 0.9917 respectively, where X is the concentration of Hg2+ (nM). The LOD is 3.11x10⁻⁸, 3.71x10⁻⁷, 2.41 x10⁻⁶ M.
The fluorescence intensity of Ag-CeNC@T3 is also greatly enhanced in the presence of Hg2+, Pb2+ and Cd2+ and the increase is much higher than CeNC@T3 (Fig. 13). On mixing the Hg2+ ions to an aqueous dispersion of Ag-CeNC@T3, the emission intensity is directly proportional to [Pb2+]. Three linear regions are observed on varying the concentration of Hg2+ from 5.0x10⁻⁹ M to 4.0x10⁻⁵ M. The corresponding regression equations are Y1 = 9.4062X + 1363.4360; Y2 = 0.8473X + 4118.3333; Y3 = 0.1366X + 7664.2857 with a correlation coefficient of 0.9823, 0.9883 and 0.9953 respectively, where X represents the concentration of Hg2+ (nM). The LOD is 10.13x10⁻⁸ M, 11.24x10⁻⁷ M, 6.97 x10⁻⁶ M.![Plot of fluorescence intensity (F-F0) Vs [M2+], nM for Ag-CeNC@T3, Inset: Expanded view of 5 nM to 350 nM region.](/content/184/2024/17/1/img/10.1016_j.arabjc.2023.105382-fig14.png)
Plot of fluorescence intensity (F-F0) Vs [M2+], nM for Ag-CeNC@T3, Inset: Expanded view of 5 nM to 350 nM region.
Pb2+ and Cd2+ ions also increase the emission intensity to a greater extent. In these cases also, there are three linear regions in which the emission intensity is directly proportional while increasing the concentration of these ions 10,000 folds between 5.0x10⁻⁹ M to 4.0x10⁻⁵ M. The regression equations for Pb2+ are Y1 = 8.9245X + 1293.9777; Y2 = 0.7873X + 4206.1111; Y3 = 0.1091X + 7683.9286 with a correlation coefficient of 0.9750, 0.9979 and 0.9990 respectively, where X is the concentration of Pb2+ (nM). The Limit of Detection in the three linear regions is found to be 10.68x10⁻⁸, 1.21x10⁻⁶, 8.73x10⁻⁶ M. The regression equations for Cd2+ are Y1 = 9.02267X + 1185.5860; Y2 = 0.4893X + 4543.333; Y3 = 0.05636X + 6455.7143 with a correlation coefficient of 0.9819, 0.9975 and 0.9807 respectively, where X is the concentration of Cd2+ (nM). The LOD is estimated as 10.56x10⁻⁸ M, 1.95x10⁻⁶ M, 1.69x10⁻⁵ M in the three different regions.
Various mechanisms have been reported in literature for the sensing of heavy metals by CePO4 based nanocomposites. The coordination of Pb2+ ions with phosphate group forming an insoluble complex is reported to be the reason for the quenching of fluorescence of cerium phosphate (Dezfuli et al., 2014); (Khandare et al., 2014); (Song et al., 2019). The presence of Hg(II) leads to enhanced fluorescence in biofunctionalized Ag nanoparticles. This is a result of fluorescence resonance energy transfer, facilitated by the aggregation of nanoparticles brought about by the complexation of Hg(II) with Ag nanoparticles (Sebastian et al., 2018). A similar pattern has been documented in the instance of Ru-loaded CeO2 NCs for electrochemical detection of Hg(II), attributed to an abundance of oxygen vacancies (Sun et al., 2020). In this case, it appears that the heavy metals are adsorbed over the oxygen vacancies created in the NCs, enhancing fluorescence. As the availability of vacancies decreases, the intensity of fluorescence also decreases, leading to different linear regions.
4.1.1 Turn-on–off sensor
In order to see the efficiency of the NC as “on - off” sensors, emission studies were carried out first with fixed concentration of lead ions ([Pb2+] = 5.0x10⁻⁶ M) and then mixing different concentrations of EDTA by keeping the total volume as constant. The intensity of emission decreased with increasing [EDTA] up to 99.88 %. The results are represented in Fig. S8. This indicates that EDTA quenches the emission of CeNC@T3 which is enhanced in presence of Pb2+ ions. To revive the fluorescence, emission studies were again carried out with solutions which were quenched with three different concentrations of EDTA in turn-off experiments by adding 5.0x10⁻⁴ M concentration of Pb2+ ions. With the addition of Pb2+, the emission is again revived. The results are produced in Fig. S9. To study the suitability of CeNC@T3 to sense real-world sample, an aqueous solution which is a mixture of three heavy metals viz., Pb2+, Cd2+ and Hg2+ was mixed with CeNC@T3 and the emission was measured. The emission intensity has increased but not as additive as that of all ions. The results are consolidated in Fig. S10.
4.2 Evaluation of SPF of CeNC@T1 and CeNC@T2
Commonly, sunscreens are protectants that either absorb or block the harmful UV rays from sunlight and show immunosuppressive effects. In summer, using sunscreen is an efficient way for skin protection, which lessens UV- induced ROS-mediated photoaging. SPF is defined as the ratio of the required UV energy to generate a Minimum Erythema Dose (MED) on protected skin to the UV energy essential to produce MED that is not protected. MED is the shortest span of time or amount of UV light exposure required to cause the most perceptible and minimal erythema on exposed skin. SPF number determines the efficacy of a sunscreen-based product. Sunscreens are more effective at preventing sunburns if their SPF value is higher.
The results of SPF at different concentrations of CeNC@T1 are given in Fig. 14. SPF values exhibit a marked increase with increasing concentration of NC. The possible mechanism for the good UV shielding property of NC can be due to their smaller size (2.36 nm), larger band gap (Eg = 3.03 eV) and photon energy consumption. The SPF of CeNC@T2 is also given in the figure for comparison. CeNC@T2 demonstrates less SPF in comparison to CeNC@T1, this may be due to their larger size and less band gap (Eg = 2.95 eV) compared to CeNC@T1 and photon energy consumption (Miri et al., 2020). High SPF values are observed even with low concentrations (100 µg/mL), making this system more significant than those reported in literature (Table 1).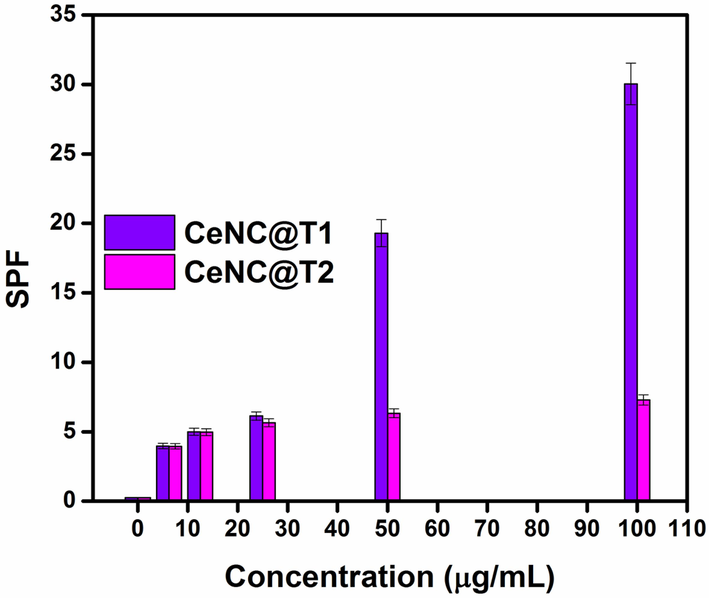
SPF of CeNC@T1 and CeNC@T2.
Nanomaterials (NMs)
Source
Dose of NMs
SPF value
Reference
5 % Ni doped CeO2 NPs
Salvadora persica
10,000 µg/mL
48.52
(Miri et al., 2020)
5 % Ni doped CeO2 NPs
Stevia rebaudiana
10,000 µg/mL
43.47
(Khatami et al., 2019)
CeO2 NPs
Ziziphus jujube
10,000 µg/mL
41.52
(Miri et al., 2020)
CeO2 NPs
Musa sapientum
10,000 µg/mL
38.76
(Miri et al., 2021)
CeNC@T1
Penaeus semisulcatus
100 µg/mL
30.04
This work
4.3 Evaluation of the cytotoxic effect of CeNC@T1 and CeNC@T2
The variation of percentage cell viability with different concentrations of CeNC@T1 and CeNC@T2 are shown in Fig. 15. It is found that a concentration of 6.25–25 µg/mL yields a viability rate of 99 %. At 50 and 100 µg/mL concentration, it is 98.62 % and 97.93 % for CeNC@T1 and 98.15 % and 97.70 % for CeNC@T2 respectively, as given in Figs. 16 & 17. According to the findings of cytotoxicity studies, L6 cell line is not significantly harmed by the marine shrimp produced CeNC@T1 and CeNC@T2 and shows no notable toxicity (Miri et al., 2021).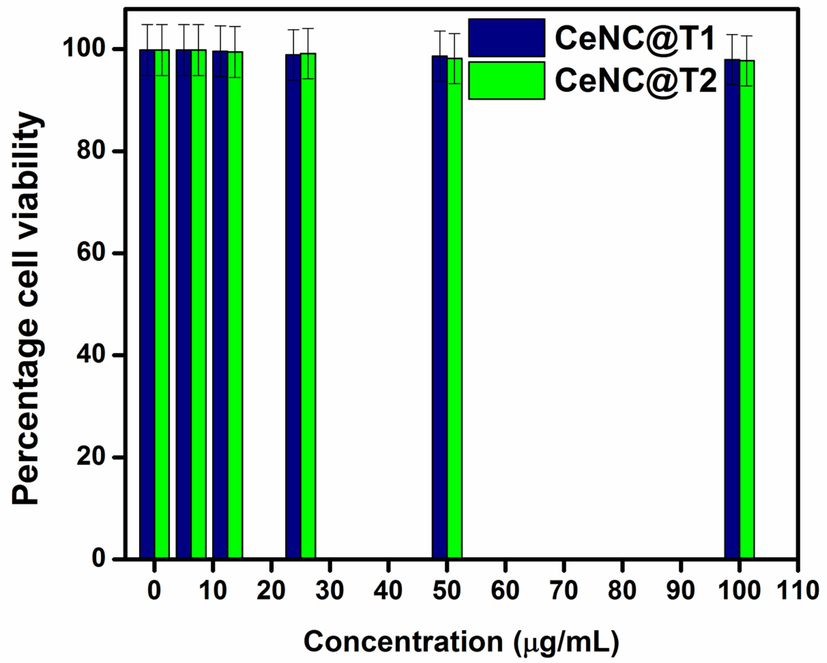
Cytotoxic findings for CeNC@T1 and CeNC@T2.
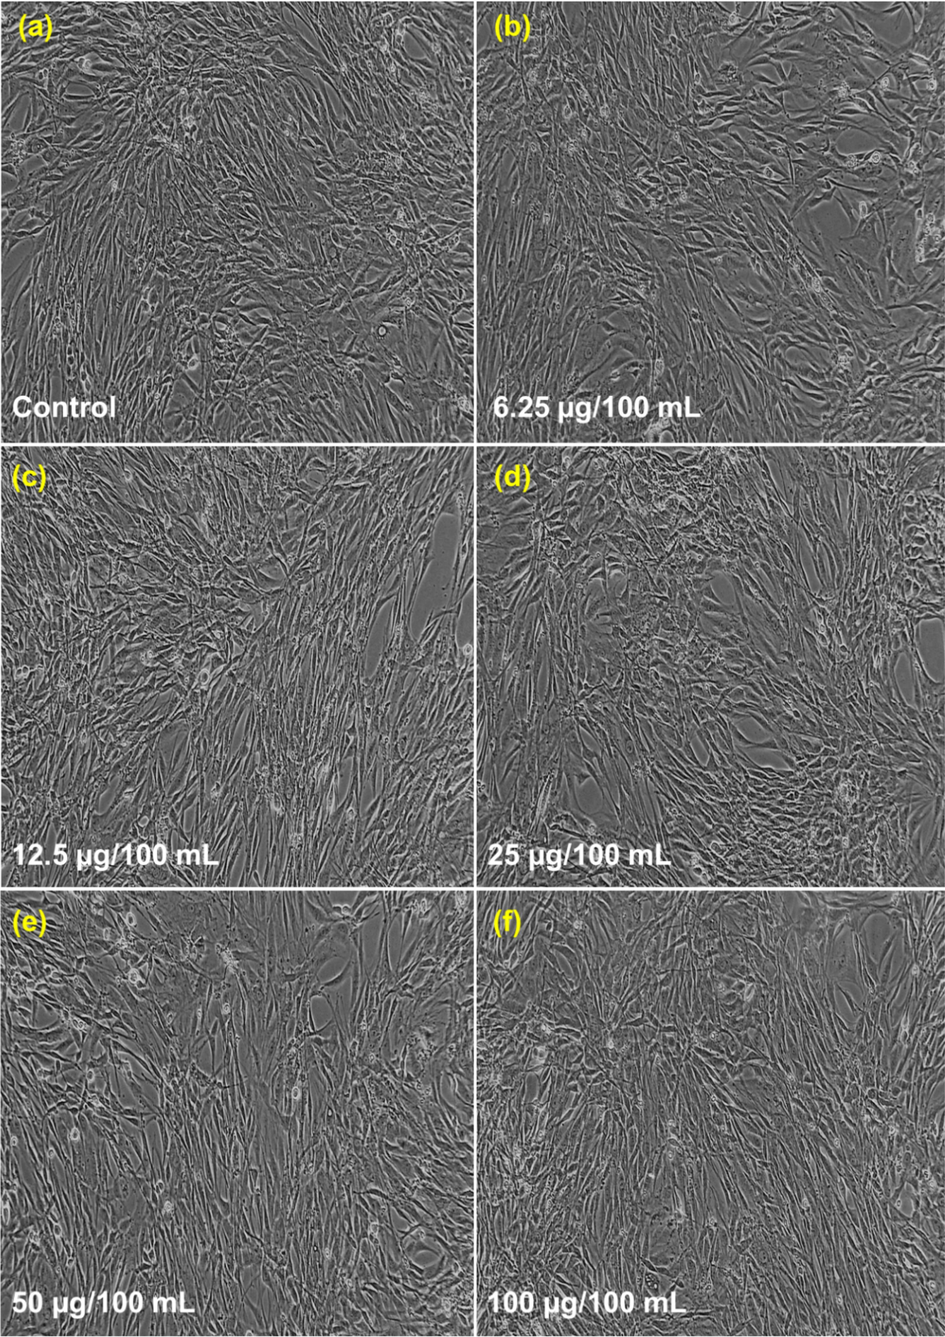
Cytotoxic results for CeNC@T1: (a) Control, (b)-(f) Different concentrations of CeNC@T1 (6.25–100 µg/mL) incubated with L6 cell line.
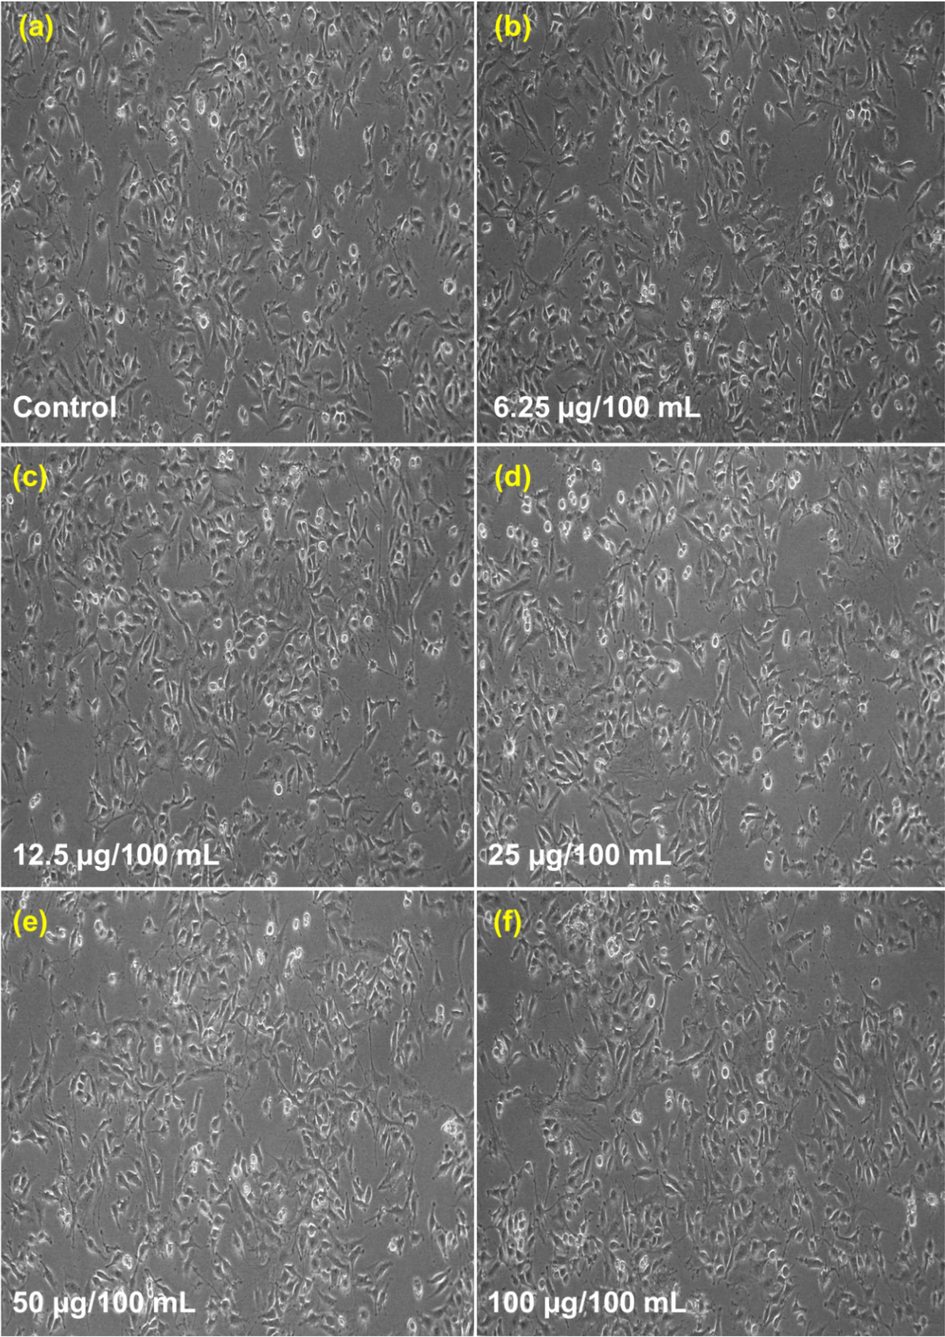
Cytotoxic results for CeNC@T2: (a) Control, (b)-(f) Different concentrations of CeNC@T2 (6.25–100 µg/mL) incubated with L6 cell line.
5 Conclusion
This article introduces an uncomplicated, innovative and eco-friendly method for synthesizing pure CeO2-CePO4 NCs and silver-doped CeO2-CePO4 NCs, utilizing the edible marine shrimp P. semisulcatus. This process paves the way for a fresh approach in the production of various types of bio-nanocomposites. CeO2 exhibits properties of a wide-band semiconductor and owing to the presence of Ce3+ ions stemming from oxygen vacancies, both direct and indirect band-to-band transitions can be observed in CeO2 nanoparticles. The direct bandgap of CePO4 nanoparticles measures approximately 3.0 eV. Thanks to these band gaps, these nanocomposites function as effective UV shields, and their low toxicity makes them suitable for sunscreen applications. Furthermore, their extended excited state lifetimes enable their efficient use as fluorescence sensors for heavy metal ions. The broad range of applications for these synthesized nanocomposites positions them as highly promising materials for future.
Acknowledgement
The authors express their sincere appreciation to the Researchers Supporting Project Number (RSP2023R398) King Saud University, Riyadh, Saudi Arabia. The authors acknowledge IIT Bombay, SAIF for HR-TEM analyses.
Declaration of Competing Interest
The authors declare that they have no known competing financial interests or personal relationships that could have appeared to influence the work reported in this paper.
References
- Evaluating the effects of different processing methods on the nutritional composition of shrimp and the antioxidant activity of shrimp powder. Saudi J. Biol. Sci.. 2022;29:640-649.
- [CrossRef] [Google Scholar]
- Tuning the structure of cerium phosphate nanorods. Cryst. Eng. Comm.. 2021;23:8215-8225.
- [CrossRef] [Google Scholar]
- The effect of sunlight induced surface defects on the photocatalytic activity of nanosized CeO2 for the degradation of phenol and its derivatives. Appl. Catal. b.. 2016;180:391-402.
- [CrossRef] [Google Scholar]
- Ce 3d XPS investigation of cerium oxides and mixed cerium oxide (CexTiyOz) Surf. Interface Anal.. 2008;40:264-267.
- [CrossRef] [Google Scholar]
- Photocatalytic and photoluminescence properties of CePO4 nanostructures prepared by coprecipitation method and thermal treatment. Optik. 2021;238:166683
- [CrossRef] [Google Scholar]
- Structural and optical properties of CeO2 nanoparticles synthesized by modified polymer complex method. J. Inorg. Organomet. Polym. Mater.. 2019;29:813-826.
- [CrossRef] [Google Scholar]
- Oxygen defect, electron transfer and photocatalytic activity of Ag/CeO2/SBA-15 hybrid catalysts. Catal. Today.. 2022;394:62-80.
- [CrossRef] [Google Scholar]
- Synthesis, optical and electrochemical performance of CePO4 micro-rods. Mater. Sci. Eng. b.. 2021;272:115319
- [CrossRef] [Google Scholar]
- Oxygen defects and formation of Ce3+ affecting the photocatalytic performance of CeO2 nanoparticles. RSC Adv.. 2014;4:4663-4671.
- [CrossRef] [Google Scholar]
- A review on the application of infrared technologies to determine and monitor composition and other quality characteristics in raw fish, fish products, and seafood. Appl. Spectrosc. Rev.. 2012;47:207-218.
- [CrossRef] [Google Scholar]
- Bio-derived fluorescent carbon dots for metal sensing and DNA binding applications. ChemistrySelect. 2023;8:e202204583.
- [CrossRef] [Google Scholar]
- Cerium phosphate nanoparticles with low photocatalytic activity for UV light absorption application in photoprotection. Dyes Pigm.. 2013;97:291-296.
- [CrossRef] [Google Scholar]
- Photobiological synthesis of noble metal nanoparticles using Hydrocotyle asiatica and application as catalyst for the photodegradation of cationic dyes. J. Nanostruct. Chem.. 2016;6:75-92.
- [CrossRef] [Google Scholar]
- Applications of Peristrophe paniculata derived plasmonic nanoparticles for DNA binding and photocatalytic degradation of cationic dyes. ChemistrySelect. 2022;7:e202202769.
- [CrossRef] [Google Scholar]
- Green synthesis of plasmonic nanoparticles using Sargassum ilicifolium and application in photocatalytic degradation of cationic dyes. Environ. Res.. 2022;208:112642
- [CrossRef] [Google Scholar]
- Facile sonochemical synthesis and morphology control of CePO4 nanostructures via an oriented attachment mechanism: application as luminescent probe for selective sensing of Pb2+ ion in aqueous solution. Mater. Sci. Eng. c.. 2014;42:774-781.
- [CrossRef] [Google Scholar]
- Evaluation of nutritional quality of green tiger prawn, Penaeus Semisulcatus from land fisheries (Alexandria) and market (India) Egypt. J. Hosp. Med.. 2018;70:924-934.
- [Google Scholar]
- Systematic synthesis and characterization of single-crystal lanthanide orthophosphate nanowires. J. Am. Chem. Soc.. 2003;125:16025-16034.
- [CrossRef] [Google Scholar]
- A critical review on relationship of CeO2-based photocatalyst towards mechanistic degradation of organic pollutant. Chemosphere. 2022;286:131651
- [CrossRef] [Google Scholar]
- A review of current research into the biogenic synthesis of metal and metal oxide nanoparticles via marine algae and seagrasses. J. Nanosci.. 2017;2017
- [CrossRef] [Google Scholar]
- Bifunctional CePO4/CeO2 nanocomposite as a promising heterogeneous catalyst for the enhancement of the ozonation recovery effect in the presence of chloride ions. Sci. Rep.. 2022;12:9043.
- [CrossRef] [Google Scholar]
- Operando EXAFS study reveals presence of oxygen in oxide-derived silver catalysts for electrochemical CO2 reduction. J. Mater. Chem. A.. 2019;7:2597-2607.
- [CrossRef] [Google Scholar]
- Engineered faceted cerium oxide nanoparticles for therapeutic miRNA delivery. Nanomaterials. 2022;12:4389.
- [CrossRef] [Google Scholar]
- Use of MTT colorimetric assay to measure cell activation. J. Immunol. Methods.. 1986;94:57-63.
- [CrossRef] [Google Scholar]
- Raman spectroscopy of nanostructures and nanosized materials. J. Raman Spectrosc.. 2007;38:598-603.
- [CrossRef] [Google Scholar]
- Valorisation of bio-derived fluorescent carbon dots for metal sensing. DNA Binding and Bioimaging. Chemosphere. 2022;298:134128
- [CrossRef] [Google Scholar]
- Nitrogen doped fluorescent carbon dots from Delonix regia for Fe (III) and cysteine sensing, DNA binding and bioimaging. Arab. J. Chem.. 2023;16:105109
- [CrossRef] [Google Scholar]
- Immune indices and identical functions of two prophenoloxidases from the haemolymph of green tiger shrimp Penaeus semisulcatus and its antibiofilm activity. Fish Shellfish Immunol.. 2016;51:220-228.
- [CrossRef] [Google Scholar]
- Facile synthesis of haemocyanin-capped zinc oxide nanoparticles: effect on growth performance, digestive-enzyme activity, and immune responses of Penaeus semisulcatus. Int. J. Biol. Macromol.. 2019;139:688-696.
- [CrossRef] [Google Scholar]
- A comprehensive investigation on the properties of nanostructured cerium oxide. Opt. Quant. Electron.. 2019;51:312.
- [CrossRef] [Google Scholar]
- Identification and characterization of bioactive pigment carotenoids from shrimps and their biofilm inhibition. J. Food Process. Preserv.. 2020;44:e14728.
- [CrossRef] [Google Scholar]
- Dispensability of the conventional Tauc’s plot for accurate bandgap determination from UV-vis optical diffuse reflectance data. Results Opt.. 2022;9:100273
- [CrossRef] [Google Scholar]
- Sun Protection Factor determination studies of some sunscreen formulations used in cosmetics for their selection. J. Drug Delivery Ther.. 2018;8:149-151.
- [Google Scholar]
- An aggregation-induced emission based “turn-on” fluorescent chemodosimeter for the selective detection of Pb2+ ions. RSC Adv.. 2014;4:47076-47080.
- [CrossRef] [Google Scholar]
- Nickel-doped cerium oxide nanoparticles: green synthesis using stevia and protective effect against harmful ultraviolet rays. Molecules. 2019;24:4424.
- [CrossRef] [Google Scholar]
- Identification of surface composition and chemical states in composites comprised of phases with fluorite and perovskite structures by X-ray photoelectron spectroscopy. Appl. Surf. Sci.. 2013;268:278-287.
- [CrossRef] [Google Scholar]
- One-pot synthesis of ultra-small cerium oxide nanodots exhibiting multi-colored fluorescence. J. Colloid Interface Sci.. 2013;389:16-22.
- [CrossRef] [Google Scholar]
- Rare earth phosphate powders RePO4.nH2O (Re= La, Ce or Y)-Part I. Synthesis and characterization. J. Solid State Chem.. 2004;177:1302-1311.
- [CrossRef] [Google Scholar]
- Effect of Pd-doping concentrations on the photocatalytic, photoelectrochemical, and photoantibacterial properties of CeO2. Catalysts. 2023;13:96.
- [CrossRef] [Google Scholar]
- Survey of cytotoxic and UV protection effects of biosynthesized cerium oxide nanoparticles. J. Biochem. Mol. Toxicol.. 2020;34:e22475.
- [CrossRef] [Google Scholar]
- Nickel-doped cerium oxide nanoparticles: biosynthesis, cytotoxicity and UV protection studies. RSC Adv.. 2020;10:3967-3977.
- [CrossRef] [Google Scholar]
- Cerium oxide nanoparticles: green synthesis using Banana peel, cytotoxic effect, UV protection and their photocatalytic activity. Bioprocess Biosys. Eng.. 2021;44:1891-1899.
- [CrossRef] [Google Scholar]
- The photoluminescence properties and reversible photoinduced spectral change of CeO2 bulk, film and nanocrystals. Phys. Stat. Sol.. 2009;246:2320-2328.
- [CrossRef] [Google Scholar]
- Silver decorated CeO2 nanoparticles for rapid photocatalytic degradation of textile rose bengal dye. Sci. Rep.. 2021;11:1080.
- [CrossRef] [Google Scholar]
- Green synthesis of cerium oxide nanoparticles (CeO2 NPs) and their antimicrobial applications: a review. Int. J. Nanomedicine.. 2020;15:5951-5961.
- [CrossRef] [Google Scholar]
- Physics of Ce3+↔Ce4+ electronic transition in phytosynthesized CeO2/CePO4 nanocomposites and its antibacterial activities. J. Phys. Chem. Solids.. 2021;148:109751
- [CrossRef] [Google Scholar]
- Synthesis of positively and negatively charged CeO2 nanoparticles: investigation of the role of surface charge on growth and development of Drosophila melanogaster. ACS Omega. 2019;4:104-113.
- [CrossRef] [Google Scholar]
- Bio-therapeutic potential and cytotoxicity assessment of pectin-mediated synthesized nanostructured cerium oxide. Appl. Biochem. Biotechnol.. 2016;180:638-654.
- [CrossRef] [Google Scholar]
- Investigation of intensity dependent nonlinear absorption in cerium phosphate nanorods. J. Phys. Conf. Ser.. 2022;2357:012013
- [CrossRef] [Google Scholar]
- Widespread bacterial protein histidine phosphorylation revealed by mass spectrometry-based proteomics. Nat. Methods.. 2018;15:187-190.
- [CrossRef] [Google Scholar]
- How fishy is your fish? Authentication, provenance and traceability in fish and seafood by means of vibrational spectroscopy. Appl. Sci.. 2020;10:4150.
- [CrossRef] [Google Scholar]
- Antibiofilm and immunological properties of lectin purified from shrimp Penaeus semisulcatus. Fish Shellfish Immunol.. 2020;106:776-782.
- [CrossRef] [Google Scholar]
- Biofunctionalized silver and gold nanoparticles as potential curative agents. Appl. Organomet. Chem.. 2021;35:e6044.
- [CrossRef] [Google Scholar]
- Antioxidant, antimicrobial and cytotoxic activities of silver and gold nanoparticles synthesized using Plumbago zeylanica bark. J. Nanostruct. Chem.. 2016;6:247-260.
- [CrossRef] [Google Scholar]
- Controlled hydrothermal synthesis, excellent optical and magnetic properties of CeO2 nanocubes. J Mater Sci: Mater Electron.. 2016;27:12233-12239.
- [CrossRef] [Google Scholar]
- Support effects on the structure and catalytic activity of mesoporous Ag/CeO2 catalysts for CO oxidation. Chem. Eng. J.. 2013;229:522-532.
- [CrossRef] [Google Scholar]
- Enhanced sunlight photocatalytic activity and biosafety of marine-driven synthesized cerium oxide nanoparticles. Sci. Rep.. 2021;11:14734.
- [CrossRef] [Google Scholar]
- Raman spectra of polycrystalline CeO2: a density functional theory study. Phys. Chem. c.. 2017;121:20834-20849.
- [CrossRef] [Google Scholar]
- Simple unmodified green silver nanoparticles as fluorescent sensor for Hg(II) ions. Mater. Res. Express.. 2018;5:085015
- [CrossRef] [Google Scholar]
- Novel marine-based gold nanocatalyst in solvent-free synthesis of polyhydroquinoline derivatives: green and sustainable protocol. Appl. Organomet. Chem.. 2020;34:e6000.
- [CrossRef] [Google Scholar]
- Sheeba, T.S., Sudharsan, M., Santhana, M.A., Suresh, D., Jose, A.A., Rajeswari, S., Amaladhas, T.P., and recyclable catalyst for Csp2‐Csp2 bond formation reactions. Applied Organometallic Chemistry 34, e5752. https://doi.org/10.1002/aoc.5752.
- Core-shell structured nanocomposites Ag@CeO2 as catalysts for hydrogenation of 4-nitrophenol and 2-nitroaniline. RSC Adv.. 2016;6:47966-47973.
- [CrossRef] [Google Scholar]
- Cerium oxide nanoparticles: properties, biosynthesis and biomedical application. RSC Adv.. 2020;10:27194-27214.
- [CrossRef] [Google Scholar]
- Potentialities of bioinspired metal and metal oxide nanoparticles in biomedical sciences. RSC Adv.. 2021;11:24722-24746.
- [CrossRef] [Google Scholar]
- Purification of WAP domain-containing antimicrobial peptides from green tiger shrimp Peaneaus semisulcatus. Microb. Pathog.. 2020;140:103920
- [CrossRef] [Google Scholar]
- Fluorescent cellulose nanocrystals for the detection of lead ions in complete aqueous solution. Cellulose. 2019;26:9553-9565.
- [CrossRef] [Google Scholar]
- Evaluation of antioxidant, anticancer and DNA binding potentials of noble metal nanoparticles synthesized using Aristolochia indica and Indigofera tinctoria. J. Cluster Sci.. 2021;32:917-927.
- [CrossRef] [Google Scholar]
- Ruthenium-loaded cerium dioxide nanocomposites with rich oxygen vacancies promoted the highly sensitive electrochemical detection of Hg (II) Sens. Actuators b: Chem.. 2020;320:128355
- [CrossRef] [Google Scholar]
- Preparation of cerium orthophosphate nanosphere by coprecipitation route and its structural, thermal, optical, and electrical characterization. Journal of Nanoparticles. 2014;2014:1-12.
- [CrossRef] [Google Scholar]
- Ionic radii and concentration dependency of RE3+ (Eu3+, Nd3+, Pr3+, and La3+)-doped cerium oxide nanoparticles for enhanced multienzyme-mimetic and hydroxyl radical scavenging activity. J. Phys. Chem. c.. 2018;123:541-553.
- [CrossRef] [Google Scholar]
- Cerium phosphate-cerium oxide heterogeneous composite nanozymes with enhanced peroxidase-like biomimetic activity for glucose and hydrogen peroxide sensing. Inorg. Chem.. 2018;58:349-358.
- [CrossRef] [Google Scholar]
- Structure dependent luminescence, peroxidase mimetic and hydrogen peroxide sensing of samarium doped cerium phosphate nanorods. J. Mater. Chem. b.. 2018;6:6559-6571.
- [CrossRef] [Google Scholar]
- Preparation and antibacterial activities of Ag/Ag+/Ag3+ nanoparticle composites made by pomegranate (Punica granatum) rind extract. Results Phys.. 2016;6:299-304.
- [CrossRef] [Google Scholar]
- Marine organisms: Pioneer natural sources of polysaccharides/proteins for green synthesis of nanoparticles and their potential applications. Int. J. Biol. Macromol.. 2021;193:1767-1798.
- [CrossRef] [Google Scholar]
Appendix A
Supplementary data
Supplementary data to this article can be found online at https://doi.org/10.1016/j.arabjc.2023.105382.
Appendix A
Supplementary data
The following are the Supplementary data to this article:Supplementary data 1
Supplementary data 1


