

Translate this page into:
Characterization and assessment of Saudi clays raw material at different area
*Corresponding author. Address: Materials and Corrosion Lab., Faculty of Science, Department of Chemistry, Taif University, Saudi Arabia. Tel.: +966 530623056 aelmaghraby60@hotmail.com (A. El-maghraby)
-
Received: ,
Accepted: ,
This article was originally published by Elsevier and was migrated to Scientific Scholar after the change of Publisher.
Available online 17 June 2010
Abstract
The general characteristics of three types of clays obtained from the different locations in Saudi Arabia have been investigated. These clays were compared with those of pure kaolin samples. Clays were analyzed by DTA, TGA, SEM, X-ray diffraction, chemical composition (XRF) and optical properties. Three clays are white clay (WC), red clay (RC) from Jeddah area and grey clay (GC) from Elmadina area. The comparison made with Spain clay as pure kaoline (KA). The clays contain kaolinite, illite, montmorillonite and quartz. Quartz is present in every class and varies between 45% and 20%. Montmorillonite is found mainly in the WC (50%) and are lacking only in sample RC and GC. Another important aspect with respect to the chemical composition of the clays is the low amounts of Na2O and K2O. The clay deposits (WC, RC, and GC) are suitable for use in industrial ceramics due to the low whiteness, high yellowness and high content of impurities as montmorillonite and iron. This is an important technological aspect that renders possible use of clay RC and GC in the fabrication of products with a cream tonality, especially in roofing tiles and rustic floor tiles. The results also, showed that the studied clays have adequate characteristics for ceramics wall, floor, roof tiles, tableware, earthenware and brick fabrication.
Keywords
Clays
Characterization
XRD
XRF
DTA
SEM
Color

1 Introduction
Kingdom of Saudi Arabia is one of the world’s largest consumers of clay ceramic. The westerns region of Saudi has an abundance amount of low quality clays. Saudi Arabia is geologically divided into four distinct and extensive terrains. These are the proterozoic arabian shield, comprising metamorphosed volcano sedimentary successions intruded by granite and gabbros; Arabian platform dipping gently eastward; the tertiary ‘harrats’ mainly overlying the shield; and the narrow Red Sea coastal plain of tertiary and quaternary sedimentary rocks and coral reefs (Chandrasekhar and Ramaswamy, 2002).
Argiclays is essentially composed of argillaceous crystalline hydrous aluminum silicates containing Na, K, and Ca in which Mg and Fe may be substituted for Al. The most common commercial clay minerals are kaolinite, montmorillonite, and illite. Natural clays such as clay stone or mudstone comprise several clay minerals with one or more impurities. The most common impurities are, free iron oxide minerals, amorphous silica and alumina, quartz grain, limestone, gypsum and other more soluble salts. These impurities affect largely clay characteristics and may affect adversely its use in specific applications.
A rock is considered as kaolin when the amount of kaolintic is more than 50 % (Chandrasekhar and Ramaswamy, 2002). The color clays deposits are becomes white to beige in the middle and top parts. The another clays are brown to red brown depended on top and middle parts (Felhi et al., 2008). Kaolinitic, a 1:1 layered mineral, consists of one tetrahedral silica sheet and one octahedral alumina sheet. This raw material is usually found as thin submicrometer platelets stacked together by strong hydrogen bonds along the pseudo-hexagonal basal faces which make up individual crystals in typical booklet structures (Ryan and Radford, 1987).
Several authors had determined that the natural colors of the kaolin are related to mineral impurities or chlorophyll elements, for example Fe3+ (Jepson, 1988; Chandrasekhar, 1996; Raghavan et al., 1997; Sei et al., 2004), which may be present as isomorphic substitutions in the kaolinite structure. Whiteness decreases drastically with mineral mixtures and/or chemical impurities in the kaolinite structure. The mineralogical composition has a major influence on uses of clays in different industry (Chandrasekhar and Ramaswamy, 2002; Gamiz et al., 2004).
The objective of the present work was to characterize the clays found in the western region of Saudi Arabia, in terms of chemical, mineral, thermal behavior, color and SEM viewpoint. This is the primary step in a project to investigate the utilization of these clays in different building materials.
2 Materials and methods
2.1 Materials
Three different clays locally named as red clays, grey clay and white clay, were used in this investigation. The white clay and the red clays collected from gamgom queries, the west region in Jaddah and the grey clay collected from Mahael query, in Shamer mountain, Elmadina. These clays will be referred to, respectively as RC (red clay), GC (grey) clay and WC (white clay). The comparison made with pure kaolin (KA).
2.2 Chemical analysis
The chemical composition was determined by X-ray fluorescence spectroscopy using Philips PW 2400 equipment. Bulk clay samples crushed to fine powder were mixed lithium tetra borate for chemical analysis. The ignition loss was measured by calcination at 1000 °C.
2.3 X-ray diffraction
X-ray diffraction (XRD) analysis was performed using an automated (Philips type: PW1840) diffractometer equipment with Cu Kα radiation source and at a step size angle of 0.02°, scan rate of 2° in 2θ unit, and a scan range from 10° to 70°.
2.4 Thermal analysis (DTA/TGA)
Differential thermal analysis (DTA) and thermographmetric (TGA) were run with a coupled (SETARAM TG/DTA 92) DTA-TGA instrument. The clay fractions (<2 μm) were heating rate of 10 °C/min at ambient atmosphere and temperature, up to 1000 °C.
2.5 Optical properties
The brightness and color values were determined using a Hunter Lab. spectrocolourimeter. Values were compared to a reference of Spain kaolinite (pure kaolin) sample.
2.6 Scanning electron microscopy
Morphology of the clay samples was determined by SEM. The bulk rock fragments were previously coated with gold. The clay samples were studied with a Philips® 30 Analytical Scanning Electron Microscope. Particle images were obtained with a secondary electron detector.
3 Results and discussion
3.1 X-ray diffraction (XRD)
Fig. 1, presents the XRD patterns of the four types of investigated clays. It could be noted that some clays have their major peaks associated with kaolinite (K). This is in agreement with most clay found in Saudi (Al-shenti, 2003). In addition, all clays exhibit minor contributions of quartz (Q), illite (I), hematite (H), albite (A) and montmorillonite (M).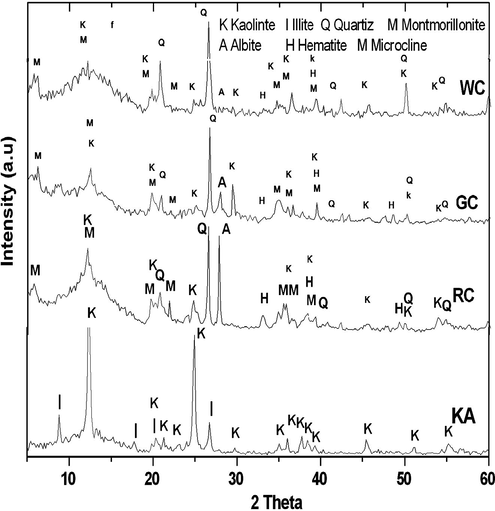
X-ray diffraction patterns of the clays (K = kaolinite; I = illite; M = montmorillonite; H = hematite; Q = quartz; and A = albite).
The relatively high intensity of the quartz peaks in the WC clay (Fig.1), indicates a significant presence of the free silica. This can be confirmed by the greater SiO2/Al2O3 ratio and smaller loss on ignition (LOI) for the WC clay as indicated as shown in Table 2.
Phase
Kaolin (KA)
White clay (WC)
Red clays (RC)
Grey clay (GC)
Kaolinite
84
–
40
40
Illite
16
–
–
–
Quartz
–
45
18
20
Montmorillonite
–
50
12
10
Albite
–
–
16
8
Hematite
–
5
14
9
Material
Kaolin (KA)
White clay (WC)
Red clays (RC)
Grey clay (GC)
SiO2
49.28
69.23
46.49
53.77
TiO2
0.06
0.61
1.79
0.93
Al2O3
35.69
11.79
22.49
15.84
Fe2O3
0.97
6.49
14.89
9.01
MnO
–
0.17
0.26
0.15
MgO
0.07
0.44
0.46
2.47
CaO
0.05
1.13
0.03
1.08
Na2O
0.28
0.16
0.22
0.68
K2O
0.42
0.27
0.21
1.82
P2O5
0.12
0.21
0.19
0.34
SO3
0.11
0.11
0.13
0.08
Cl
–
0.14
0.11
0.14
LOI
12.55
9.15
12.5
12.50
Total
99.6
99.9
99.77
99.81
XRD analyses showed that the clay classes for WC, GC, and RC are kaolinite and montmorillonite. However, considering the diffractograms and the intensity peaks (Fig. 1 and Table 1), it is observed that the KA is the richest clay in kaolinite whereas the WC, RC and GC are kaolinite-poor. The free quartz is present in every class WC, GC, RC and varies between 45% (WC) and 20% (GC) as in (Table 1). It is abundant in sample WC, RC and scarce in GC (Fig. 1). Clays that have little impurities are rich in quartz (see Table 1). The percentage of Illite in samples KA is 16%, respectively. Montmorillonite is found mainly in the WC (50%) (Fig. 1 and Table 1) and are lacking only in sample RC and GC. They are less ordered minerals as indicated by their broader peaks. Hematite’s occur at high amount in the RC sample (see Fig. 1 and Table 1) which reached to 14.89%.
3.2 Chemical composition
Table 1 shows the chemical composition of the studied clays in comparison with pure kaolin. It could be observed that all clays present SiO2 and Al2O3 as the most predominant oxides. These oxides are mainly associated with the kaolinite structure. A minor part of minerals are due to the presence of illite, albite and microcline.
The absence of correlation between SiO2 and K2O contents indicates that the excess SiO2 is due to the presence of quartz, as shown in XRD. The SiO2 content in the clay (WC) is also associated with quartz. This sample showed the high SiO2 content. The relatively lower Al2O3 content of all clays, as companied with pure kaolin, indicates the lower amount of kaolinite. The participation of kaolinite is more significant in clays KA, RC and GC.
Iron oxide, Fe2O3 is the main colorant in the clays, being responsible for the reddish color after firing (Abajo Manual sobre Fabricación de Baldosas MF, 2000). According to Table 1, RC and GC clays have a comparatively high amount of Fe2O3 14.89 and 9.01 wt%. The clay sample WC has the lowest amount of Fe2O3, i.e. 6.49 wt.% indicating a lighter color after firing. The proportion of Fe2O3 can be explained either by isomorphic substitution in the clay mineral structures, or by low iron oxide content which are not detected with XRD. This is an important technological aspect that renders possible the use of clay RC and GC in the fabrication of products with a cream and red tonality, especially for use in roofing tiles and rustic floor tiles. Another important aspect with respect to the chemical composition of the mounts of clays is the low amounts of Na2O and K2O except GC clay contain 1.82% K2O. The amounts K2O depend on illite content.
3.3 Differential thermal analysis
DTA can be applied to identify and to estimate various types of clays and calcareous minerals (Fig. 2a, b and Table 3). These minerals can be differentiated by determining the temperature at which the endothermic and exothermic peaks occur. DTA and TGA thermographs (Fig. 2a, b and Table 3) of (KA) clay, shows a significant peak at 77 °C due to removal of hydroscopic water from illite. The endothermic peak at 563 °C of (KA) clay is due to the dehydration effect, followed by exothermic peak at about 991 °C associated with the formation of α-Al2O3 or nucleation of mullite. In KA clay, the corresponding mass loss of the first and second endothermic peaks is 12.04% as shown in Fig. 2b. The thermograph of RC clay shows peaks at 109, 182 and 328 °C. This probably due to the removal of hydroscopic water and organic matter. The RC clay is included the endothermic peak at 546 °C due to expulsion of water from the lattice and destruction of lattice, leading to a weight loss of about 12.78% (Fig. 2b). The exothermic peak at 940 °C of the RC clay is probably associated with the formation of a spinel. DTA curve of WC clay, shows significant peaks at 112, 182 and 280 °C due to removal of hydroscopic water from montmorillonite. The endothermic peak at 526 °C for WC clay is due to the expulsion of water from the lattice and destruction of lattice, leading to a weight loss of about 9.32%, respectively. The exothermic peak at about 915 °C for WC clay is associated with the formation of a spinel. DTA curve of GC clay shows a significant peak at 110,184 and 239 °C is due to removal of hydroscopic water and organic matter from montmorillonit. The endothermic peak at 546, 784 and 831 °C for GC clay are due to destruction of lattice, followed by exothermic peak at about 991 °C associated with the formation of spinel. The mass loss due to the endothermic peaks of GC clay is 12.72% as shown in Fig. 2b. The dehydroxylations of the clay minerals, organic matter oxidation, and decomposition of carbonates, sulfides and hydroxides have been studied (Kingery et al., 1976; Fabbri, 1994). The formation of the corresponding oxides, Al2O3 and Fe2O3, increases the refractoriness of the clay as well as their loss on ignition. These peaks appeared in the range from 182 °C to 546 °C are associated with organic matter decomposition and this transformation is partially hidden by the kaolinite dehydroxylation.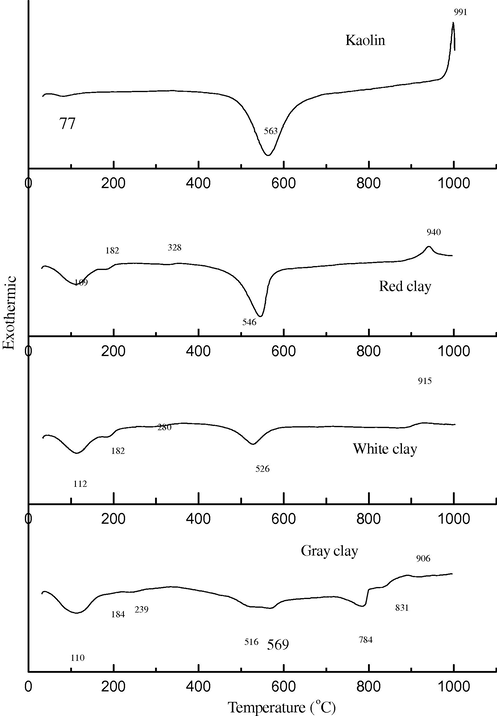
DTA of different clay raw materials (Kaolin = Spain KA; red clay = RC; white clay = WC; and gray clay = GC).
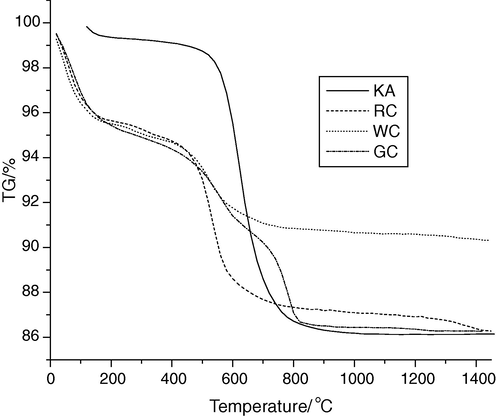
DTG of different clay raw materials (Kaolin = Spain KA; red clay = RC; white clay = WC; and gray clay = GC).
Clays
Peak temperature (°C)
(I)
(II)
(III)
(IV)
(V)
(VI)
KA
77
–
–
563
–
991
WC
112
182
280
526
–
915
RC
109
182
328
546
–
940
GC
110
184
239
516
784
991.03
The obtained results indicate that WC clay has the largest amount of quartz. Finally, the exothermic peaks at 991 °C (KA), 915 °C (WC) and 906 °C (GC) are characteristic for metakaolinite dissociation and formation of spinel(Carty and Senapati, 1998). As a complementary remark regarding the thermal analysis, it should be mentioned that the common characteristics for all clays are the presence of two ranges of endothermic peaks, which are related to the decomposition of Al and Fe hydroxides and the dehydroxylation of the kaolinite.
3.4 Optical properties
The data for the two optical properties “color values” and wave length are reported in Tables 4 and 5. The color values are compared to the standard sample of Spain clay. The term ‘L’ is a measure of lightness/darkness and varies from 100 for perfect white to 0 for absolute black. The red/green balance is indicated by “a” (the more positive the value ‘a’, the greater the redness and the more negative the more greenness). The yellow/blue shades are represented by ‘b’ (the positive value gives yellowness and the negative corresponds to blueness) (Chandrasekhar and Ramaswamy, 2002; Ryan and Radford, 1987).
Sample/value
L
a
b
Y
X
Z
x
y
Kaolin Spain (KA)
88.1
4.2
12.0
77.5
78.0
73.3
0.34
0.34
Clay white (WC)
58.9
14.5
18.1
34.6
38.7
22.5
0.40
0.36
Clay brick (GC)
57.0
13.3
20.4
32.5
36.1
18.4
0.42
0.37
Clay red (RC)
43.2
20.5
17.7
18.6
23.2
8.8
0.46
0.37
Sample
Wave Length (nm)
Purity of color
Kaolin Spain (KA)
577
0.12
Clay white (W C)
588
0.33
Clay brick (GC)
590
0.40
Clay red (RC)
593
0.51
The color values such as L, a and b values are given in Tables 4 and 5. Both clay samples have positive values for ‘a’ and ‘b’ indicating that they are red and yellow, respectively. The Spain clays (KA) samples have much higher ‘L’ values. The increased redness and yellowness can be attributed to some oxide impurities, such as iron and titanium minerals. Some authors demonstrated that the iron and titanium contents considerably decrease the whiteness of clay materials and increase the red values (Chandrasekhar and Ramaswamy, 2002). So, the WC and GC clays have lower ‘L’ value than KA clay. RC clay has low ‘L’ value and higher a value at 43.2. So, the RC clay is reddish. The wavelength of KA, WC and GC clay are 577 nm, 588 nm, 590 nm and the purity of color is near to white. But, the wavelength of RC clay is 593 nm and purity of color near to reddish (see Fig. 3).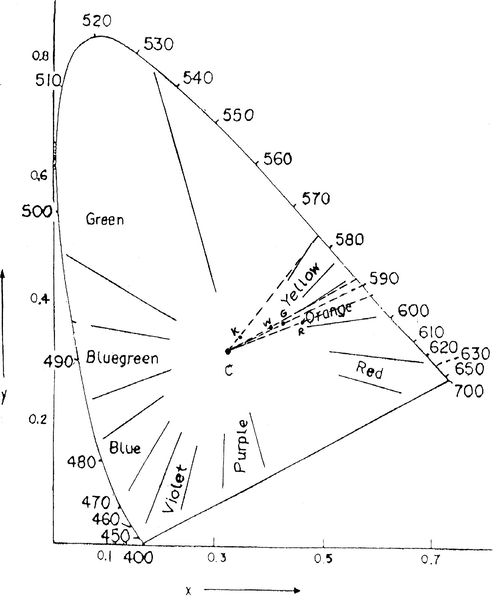
CIE diagram for different type of clay (k = Spain clay; W = white clay; G = Brick clay; and R = red clay).
3.5 Scanning electron microscopy
The SEM photomicrographs of WC, RC and GC indicate that kaolinite particles reveal irregular platelets which have ragged edges and form sub-rounded flakes (Figs. 4–6). Small-sized kaolinite platelets less than 2 μm associated with large particles i.e. large than 10 μm are appeared. SEM of KA clay indicates that the well crystallized clay sample contains stacked flasks of large particles which give a low specific area and little incorporation of impurities in the clay minerals. The Spain sample (KA), reveals hexagonal and elongated flakes of about 3 μm widths (Fig. 7). The thickness of the kaolinite sheet stacks is more than 4 μm and their length is about 6 μm (Fig. 7). The pseudo-hexagonal plates with angular edges suggest that kaolinite from the KA sample is also well crystallized (Felhi et al., 2008; Sei et al., 2004).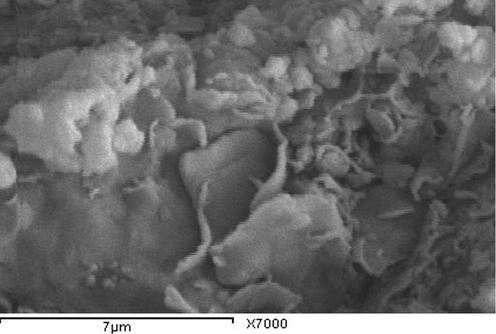
Scanning electron microscope photomicrographs of white clay (WA) deposits showing sub-rounded kaolinite (montmorillonite).
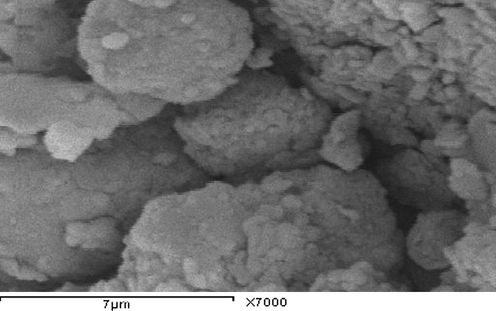
Scanning electron microscope photomicrographs of red clay(RC) deposits showing sub-rounded kaolinite.
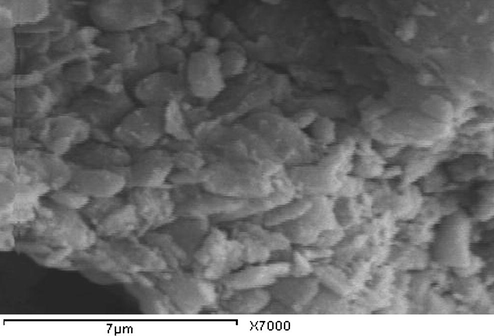
Scanning electron microscope photomicrographs of brick clay (GC) deposits showing sub-rounded kaolinite.
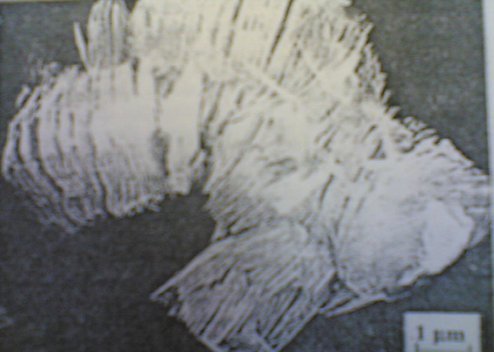
Scanning electron microscope photomicrographs of Spain clay deposits showing pseudo-hexagonal flakes of kaolinite Spain clay (KA).
The lowermost poorly crystalline kaolinite is constituted by small particles with broken edges, which is likely to increase the total surface charge and therefore absorption of impurities. The kaolinite may be poorly crystalline due to the presence of impurities. Several authors have found that impurity elements and also illite decrease the whiteness of kaolinites (Sthay and Ramaswamy, 2002; Schroeder et al. 2003; Divacaran and Sivasankara Pillai, 2004; Raghavan et al., 2004). Crystallinity and morphological properties can assist in identifying the possible utilization of kaolin.
The relative kaolinite content of these three samples by comparison to clay deposits in KA Spain, to (WC, RC, and GC) Saudi Arabia suggests that the industrial application of this deposit is possible. The clay deposit in KA Spain shows relatively good crystallinity, moderately high whiteness and low yellowness. This KA kaolin is suitable for use in industrial kaolin. It may be possible to be beneficiated for use as fillers in the paper and paint industries, where high brightness and low yellowness are required (Raghavan et al., 1997). The clay deposits (WC, RC, and GC) are suitable for industrial ceramics uses due to low whiteness, high yellowness and high content of impurities montmorillonite and iron. This poorly crystalline clay can be used in pottery and building materials as bricks. The fine grain size of this clay confers good binding properties. The fine particles favor the formation of stable suspensions (Sei et al., 2006) and can also immobilize molecules of pollutants (Yong, 2002). Iron oxides enhance surface area, which increases the capacity to immobilize inorganic and organic molecules (Sei et al., 2006).
4 Conclusion
The characteristics of three types of clays from western region deposit of the Saudi Arabia, led to the following conclusions:
-
The clays RC and GC are low in kaolinite level with quartz and montmorillonite as common accessory minerals. Clay GC composed of kaolinte, quartz and albite. While RC clay composed of kaolinite, iron (hematite) and montmorillonite. On the other hand, the WC clay composed of montmorillonite and quartz.
-
Due to the relatively low amount of Al2O3 and high amount of fluxes in the clays GC and WC, they can be used for ceramics and brick production. The RC clay contain higher amount of Al2O3 and low amount of K2O and Na2O but high amount of Fe2O3, it has a ceramic firing behavior.
-
The organic matter decomposition; this transformation is partially hidden by the kaolinite dehydroxylation.
-
The color values of WC and GC clays had low ‘L’ value than KA clay but the RC is low ‘L’ value and high in a value at 43.2. So, the RC clay is reddish. The wavelength of KA, WC and GC clay are 577, 588, 590 nm and the purity of color is near to white. But, the wavelength of RC clay is 593 nm and purity of color near to reddish.
-
The clay deposits in the Saudi quarry contain relatively pure, well crystallized kaolinite, whereas the lowermost clay deposits are poorly crystallized. There is more momtomolite at the worked section. In addition to illite, iron oxides and titanium oxides are also relatively more abundant at the quarry. The smaller size of particles and the poor crystallinity of kaolinite in the WC of the quarry favor incorporation of impurities, but the larger particles of well crystallized kaolinite in the quarry are characterized by lower impurity contents. Mineralogical and physico-chemical studies of three clay samples allow some preliminary remarks concerning their industrial applications. The clays deposits could be used for various clay brick and ceramics manufacture. These fine particle kaolinites may be suitable for environmental applications to immobilize soluble pollutants.
Acknowledgements
The financial support provided by Taif University is gratefully acknowledged. The authors are also thankful to El-Arabia Ceramic Company in Jeddah.
References
- Abajo Manual sobre Fabricación de Baldosas MF, 2000. Tejas y Ladrillos. In: Beralmar, S.A. (Ed.). Barcelona.
- Al-shenti, A.M.S., 2003. Geology of The Arabian Shield, Copy 2. Jeddah, p. 204.
- Influence of metakaolinitization temperature on the formation of zeolite 4 Å from kaolin. Clay Minerals. 1996;31:253-261.
- [Google Scholar]
- Influence of mineral impurities on the properties of kaolin and its thermally treated products. Applied Clay Science. 2002;21:133-142.
- [Google Scholar]
- Porcelain-raw materials, processing, phase evolution, and mechanical behavior. Journal of American Ceramic Society. 1998;8(1):3-20.
- [Google Scholar]
- Mechanism of kaolinite and titanium dioxide flocculation using chitosan-assistance by fulvic acids. Water Research. 2004;38:2135-2143.
- [Google Scholar]
- Quality assurance of ceramic clays – a deeper understanding. Tile Brick International. 1994;10(2):73-76.
- [Google Scholar]
- Mineralogical study of kaolinitic clays from Sidi EI Bader in the far north of Tunisia. Applied Clay Science. 2008;6:208-217.
- [Google Scholar]
- Relationships between chemico mineralogical composition and color properties in selected natural and calcined Spanish kaolin’s. Applied Clay Science. 2004;28:269-282.
- [Google Scholar]
- Structural iron in kaolinite and in associated ancillary minerals. In: Stucky J.W., ed. Iron in Soils and Clay Minerals. Dortrecht: D. Reidel; 1988. p. :467-536.
- [Google Scholar]
- Introduction to Ceramics. New York: John Wiley & Sons, Inc.; 1976.
- Value addition of paper coating grade kaolin by the removal of ultra fine coloring impurities. International Journal of Mineral Processing. 1997;50:307-316.
- [Google Scholar]
- Separation of titanoferrous impurities from kaolin by high shear pretreatment and froth flotation. Applied Clay Science. 2004;25:111-120.
- [Google Scholar]
- Ryan, W., Radford, C., 1987. White ware Production, Testing and Quality Control. Pergamon Press.
- Quantitative analysis of anatase in Georgia kaolin using Raman Spectroscopy. Applied Clay Science. 2003;23:299-308.
- [Google Scholar]
- Characterization of kaolinitic clays from the Ivory Coast (West Africa) Applied Clay Science. 2004;27:235-239.
- [Google Scholar]
- Mineralogical, crystallographic and morphological characteristics of natural kaolin from the Ivory Coast (West Africa) African Earth Science. 2006;46:245-252.
- [Google Scholar]
- Influence of mineral impurities on the proprieties of kaolin and its thermally treated products. Applied Clay Science. 2002;21:133-142.
- [Google Scholar]
- Aspects of kaolinite characterization and retention of Pb and Cd. Applied Clay Science. 2002;22:39-45.
- [Google Scholar]


