

Chitinase inhibits growth of human breast and colorectal cancer cells in vitro and Ehrlich ascites carcinoma cells in vivo
⁎Corresponding author at: Department of Biochemistry and Molecular Biology, Faculty of Science, University of Rajshahi, Rajshahi 6205, Bangladesh. rashelkabir@ru.ac.bd (Syed Rashel Kabir)
-
Received: ,
Accepted: ,
This article was originally published by Elsevier and was migrated to Scientific Scholar after the change of Publisher.
Peer review under responsibility of King Saud University.
Abstract
Trichosanthes dioica seed extract was loaded on a QA-cellulose column and the unbound fraction with the chitinase activity was run on SDS-PAGE. Multiple bands were observed and were separated by a Sephadex G-50 column. The combination of the 6 and 33 kDa masses supported the degradation of chitinase as purified earlier. Only the 33 kDa fraction contained sugar and showed chitinase activity. The chitinase was also isolated by using a chitin column. At 200 µg/ml protein concentration, the chitinase inhibited 49.1 %, 48.8 % and 38.12 % of Ehrlich ascites carcinoma, HCT-116 and MCF-7 cells growth, respectively, in a dose-dependent manner. Exactly, 46 % and 82 % EAC cell growth inhibition were observed after treating the EAC cells bearing Swiss albino mice with the chitinase at the doses of 1.0 and 2.0 mg/Kg/day respectively. EAC, HCT-116 and MCF-7 cells growth inhibitions were due to the induction of apoptosis. ROS was accumulated in HCT-116 and MCF-7 cells. After treatment of HCT-116 cells, the expression level of p53 and TNFα genes increased and PARP gene decreased. On the other hand, elevated expression was observed for PARP, MAPK, NFκB, FAS, FADD, and Caspase-8 genes in MCF-7 cells. The induction of apoptosis in HCT-116 was further confirmed by caspase protein expression. The chitinase causes ‘S’ cell cycle arrest in MCF-7 and HCT-116 cells. T. dioica seed chitinase inhibited EAC, HCT-116 and MCF-7 cells by inducing apoptosis in vitro and EAC in vivo in mice. These promising results indicated that T. dioica seed chitinase can be an anticancer agent.
Keywords
Apoptosis
Gene expression
ROS generation
HCT-116
MCF-7
Cell cycle arrest

1 Introduction
A group of hydrolytic enzymes synthesized by higher plants, insects and microbes (fungi, bacteria and viruses), is known as Chitinases (EC 3.2.1.14). Chitinase catalyzes the cleave of β-1,4-glycosidic bonds of chitin. Chitin is a long-chain polymer of N-acetylglucosamine and the second most abundant polysaccharide in nature. Chitosan, the deacetylated form of chitin, is also hydrolyzed by the enzyme (Grover, 2012). Chitinase can be classified in different ways. Consistent with the catalytic activity, chitinases were classified as endochitinases and exochitinases (Hamid et al., 2013). Hundreds of chitinase were purified from roots, stem, latex, leaves, fruits, grain, seeds and other parts of plants (Malik and Preety, 2019). Chitin is a primary component of cell walls in fungi. Most plant chitinase possesses antifungal activity by breaking down the glycosidic bonds of chitin (Malik and Preety, 2019). Besides the antifungal activity, some chitinase also possesses antiproliferative activity against different cancer cell lines (Abu-Tahon and Isaac, 2020; Viana et al., 2017). Recently a 39 kDa chitinase and a 57 ± 2 kDa lectin were purified from the seed of the Bangladeshi popular vegetable Trichosanthes dioica and designated as TDSC and TDSL, respectively (Islam et al., 2021; Kabir et al., 2016). TDSL was purified by affinity chromatography with the antitumor activity in vivo in mice (Islam et al., 2021). On the other hand, TDSC was purified by using a single chromatographic step and the amino acid analysis, N-terminal sequence of the chitinase and physicochemical characterization were done. The chitinase was a glycoprotein in nature and the enzyme activity was inhibited slightly in the presence of urea and EDTA. The chitinase inhibited Aspergillus niger and Trichoderma sp fungal growth significantly (Kabir et al., 2016). The anticancer effect of two chitinases isolated from bacteria was reported by Pan et al. (Pan et al., 2005). The author checked the anticancer effects only against MCF-7 cells using MTT assay and presented the effect using a transmitted electron microscope (TEM) and also used the human breast xenograft B(11)-2 in the SCID mice model. For evaluating the anticancer activity of the chitinase, we have tried to purify the enzyme using the established protocol (Kabir et al., 2016) but this time the chitinase was degraded. We have purified degraded chitinase with the complete enzymatic activity by gel filtration chromatography. The chitinase was also isolated separately by using affinity chromatography on the chitin column. Then the anticancer activities were checked against human breast cancer cells (MCF-7) and colorectal cancer cells (HCT-116) in vitro, and against Ehrlich ascites carcinoma (EAC) cells in vitro and in vivo in mice. In the present investigation, cytotoxic effects were checked by MTT assay, induction of apoptosis was proved using different fluorometric methods (e.g. Hoechst 33342 staining, ROS generation, caspase inhibitors), cell cycle arrest and alteration of several apoptosis-related genes expressions. Finally, EAC tumor-bearing mice were used for in vivo study. In addition to these results, for the first time we reported in this manuscript that a degraded chitinase showed anticancer activity in vitro and in vivo in mice.
2 Materials and methods
2.1 Chemicals and reagents
Chitin and QA-Cellulose were purchased from WAKO, Japan; Sephadex G-50, caspase inhibitors, Hoechst 33342 and propidium iodide from Sigma, USA; DMEM and Fetal bovine serum from Gibco, USA; SYBR green master mix from Applied Biosystems; Primer from TsingKe Biological Technology, China; Methylthiazolyldiphenyl-tetrazolium bromide (MTT), Tris-HCl and other chemicals from Karl Roth, Germany.
2.2 Isolation of chitinase
2.2.1 By affinity chromatography
Trichosanthes dioica seeds were homogenized in 10 mM Tris-HCl buffer saline at the pH 8.2 (TBS). Then the homogenate was centrifuged twice at 10,000 rpm for 20 min at 4 °C. The supernatant was collected and loaded on a acetylated chitin column (2.5 × 30 cm) that was previously equilibrated with TBS. The unbound proteins were removed by washing the column with 500 ml of TBS. Finally, the column was washed with the sodium acetate buffer saline at the pH of 4.0 and 3.5 to elute the chitinase. The pH was raised by the quick addition of 1 M of TBS and the eluted fraction (degraded chitinase) was dialyzed against 10 mM of Tris-HCl buffer. The homogeneity of the eluted fraction was checked by using SDS-PAGE in 15 % polyacrylamide gel. Bovine serum albumin (Mr. 67 kDa), Ovalbumin (Mr. 45 kDa), Carbonic anhydrase (Mr. 29 kDa), Trypsin inhibitor (Mr. 20 kDa) and Lysozyme (Mr. 14.6 kDa) were used as marker proteins.
2.2.2 By ion exchange and gel filtration chromatography
Trichosanthes dioica seeds were homogenized with a 10 mM Tris-HCl buffer at the pH of 8.2 (TB) and centrifuge as described above. Then the supernatant was washed against TB and loaded on a QA-cellulose column (2 × 20 cm). The unbound fraction was collected by washing the column with TB. After that, the eluted protein was concentrated by using a freeze dryer. The concentrated protein/peptides were then loaded on a Sephadex G-50 column (2 × 110 cm) previously equilibrated with TB. The fragments of the enzyme were eluted by TB and the purity was checked by SDS-PAGE as described above. The purity of the largest fragment (chitinase, 33 kDa fraction) was further checked in the presence and absence of 2-mercaptoethanol. Bovine serum albumin (66 kDa), carbonic anhydrase (31 kDa), lysozyme (14.4 kDa) and aprotinin (6.5 kDa) were used as standard marker proteins.
2.3 Chitinase activity, sugar and protein content
The sugar and protein content was determined by using the phenol–sulfuric acid method and Lowry method, respectively (Dubois et al., 1956; Lowery et al., 1951). The chitinase activity was checked by the DNS (3,5-dinitrosalicylic acid) method where 1 % colloidal chitin (w/v) was used as substrate.
2.4 Cytotoxicity study of the chitinase by MTT assay
Cytotoxicity of the fragments of chitinase was checked against MCF-7, HCT-116 and EAC cells by using MTT assay. MCF-7 and HCT-116 cells were collected from the Zhao XuDong laboratory, Kunming Institute of Zoology (KIZ) who recruited from American Type Culture Collection (ATCC). MCF-7 (1 × 10⁴ cells/well) and HCT-116 (2 × 10⁴ cells/well) cells in a 96 well cell culture plate were incubated in DMEM medium for 48 h in CO2 incubator at 37 °C. At the same time, EAC cells (5 × 10⁴ cells/well) were incubated in RPMI-1640 medium for 24 h in CO2 incubator at 37 °C. Then 33 kDa (chitinase) and 6 kDa fragments at the concentration of 50 to 200 µg/ml were used for treatment. Cell growth inhibition and IC50 values were calculated using Microsoft Excel software.
2.5 Experimental animals and ethical clearance
Swiss albino mice were produced at our university and were maintained in accordance with the guidelines and regulations of the Institution of Biological Sciences, University of Rajshahi, Bangladesh for the Care and Use of Laboratory Animals. In the current study, the use of a minimal number of animals and their suffering was minimized. All the in vivo experiments were performed according to protocols approved by the Institutional Animal, Medical Ethics, Bio-safety and Bio-security Committee (IAMEBBC) for Experimentations on Animals, Human, Microbes and Living Natural Sources (102(6)/320-IAMEBBC/IBSc) Institute of Biological Sciences (IBSc), University of Rajshahi, Bangladesh and confirmed to ARRIVE guideline. A total of 18 Swiss albino mice (males, 8 weeks old, around 25 g weight) were housed in cages (6 mice/cage) with free access to food and water. All animals were kept under a 12-h/12-h light/dark cycle (lights on at 6:00 a.m.). The mice were sacrificed in the current study using a two-step process as per the approved guideline. Firstly, the mice were rendered unconscious through inhaled anesthetic agent (Isoflurane) exposure. Subsequently, they were killed by cervical dislocation while the animals were fully unconscious. Isoflurane was administered by drop method in a container with a tightly fitted lid.
2.6 Determination of EAC cells growth inhibition in vivo in mice
1 × 10⁶ EAC cells in 0.1 ml of saline were injected intraperitoneally to 18 male Swiss albino mice and kept at room temperature for 24 h for tumor inoculation. Then the mice were randomly distributed into 3 groups and chitinase was injected at the dose of 1.0 and 2.0 mg/kg/day intraperitoneally for five consecutive days. The remaining group was used as a control. On the seventh day of the EAC inoculation, each of the mice was sacrificed to harvest a total number of EAC cells in saline. Viable EAC cells were first identified with trypan blue and then counted by a hemocytometer under light microscope. Finally, the percent of growth nhibition was calculated.
2.7 Cell morphological study by Hoechst 33342
Morphological changes in cells were studied after treatment with the chitinase by Hoechst 33342. 2 × 10⁴ HCT-116 and 1 × 10⁴ MCF-7 cells /well in DMEM medium were seeded in a 96 wells cell culture plate and incubated for 48 h after treatment with 100 µg/ml of chitinase. EAC cells were collected from mice and 5 × 10⁴ cells/well were incubated with the same concentration of the chitinase for 24 h. After that, cells were washed with phosphate buffer saline and incubated with Hoechst 33342 and kept in the dark for 20 min. Finally, morphological changes were observed by an inverted fluorescence microscope (Olympus IX71, Korea).
2.8 Observation of changes in the reactive oxygen species
HCT-116 and MCF-7 cells were cultured and treated with chitinase under the same condition as described above. Then incubated with the 2′,7′-dichlorofluorescein-diacetate (DCFH-DA) stain for 15 min in the dark. Finally, observed in a fluorescence microscope at the excitation wavelength of 485 nm and an emission wavelength of 530 nm.
2.9 Detection of caspase proteins expressions in HCT-116 cells using caspase inhibitors
To detect the involvement of caspase proteins, caspase-8 (z-IETD-fmk) and caspase-9 (z-LEHD-fmk) inhibitors were used. HCT-116 cells were seeded in a 96 wells cell culture plate as described above and 24 h later incubated with the caspases-8 and caspase-9 inhibitors for 2 h and treated with 100 µg/ml of chitinase for 48 h. Cells without chitinase and caspase inhibitors were used as control.
2.10 Real-time PCR and RT-PCR
Around 3.2 × 10⁵ HCT-116 cells/well and 1.6 × 10⁵ MCF-7 cells/well were seeded in a 6 wells culture plate. 24 h later, cells were treated with 100 µg/ml of chitinase for 48 h. Then RNA was isolated, cDNA was synthesized and PCR mix was prepared. The primer used for the gene NFkB, TNFα, FAS, 18 s, p53, PARP, FADD, Caspase-8, MAPK, BCL2 and BAX are given in Table 1. For amplification, SYBR green master mix and BIO-RAD (CFX 96) Real-Time thermal cycler was used and the condition was set to 50 °C for two minutes and 95 °C for 3 min followed by 40 cycles at 95 °C for 15 sec and 60 °C for 1 min. The double delta CT method was followed for the PCR data analysis, where 18 s gene expression was used to normalize the data. For RT-PCR, a GeneAtlas thermal cycler (Japan) was used. For the amplification of cDNA 2 × TsingKe master mix (China) was used according to the manufacturer guidelines. The steps followed were a 5 min PCR activation step at 94 °C, followed by 35 cycles of 94 °C/30 s, 60 °C/30 s, 72 °C/59 s and the final extension of 72 °C/5 min for each of the genes. PCR products were analyzed with 1.5 % agarose gel where 100 bp DNA ladder was used as markers.
| Gene | Primer | Product size (bp) | |
|---|---|---|---|
| NFkB | F | CCAGTATCCCGGTCCAGCTAT | 174 |
| R | CACGTCCAACTCACTCCAAGG | ||
| TNFα | F | ATTGCCGCAGAAAGTTCTACG | 207 |
| R | GTCCAGTTTCGTCTTCAGCTC | ||
| FAS | F | CCCAGTCCTTCACTTCTATGTTC | 121 |
| R | GTAGCACAGTTCAGTCTCGAC | ||
| 18 s | F | GTAACCCGTTGAACCCCATT | 151 |
| R | CCATCCAATCGGTAGTAGCG | ||
| p53 | F | GCCCAACAACACCAGCTCCT | 200 |
| R | CCTGGGCATCCTTGAGTTCC | ||
| PARP | F | GGCCTCGGTGGATGGAATG | 198 |
| R | GCAAACTAACCCGGATAGTCTCT | ||
| FADD | F | GCTGGCTCGTCAGCTCAAA | 132 |
| R | ACTGTTGCGTTCTCCTTCTCT | ||
| BCL2 | F | AGTTATCGGCTTCAGTGGTCT | 137 |
| R | CTGCCCGCTTCCTAGCTTG | ||
| BAX | F | CATATAACCCCGTCAACGCAG | 77 |
| R | GCAGCCGCCACAAACATAC | ||
| Caspase-8 | F | ACACAGTCGAGTAGACTCTCAAA | 181 |
| R | AGGAAGTGATGCTCGTTCAGA | ||
| MAPK | F | CGGTGTCAATGGTTTGGTGC | 151 |
| R | GACGATGTTGTCGTGGTCCA |
2.11 Analysis of the different phases of the cell cycle
HCT-116 and MCF-7 cells were cultured in a six-well cell culture plate and treated with the 100 µg/ml protein concentration of chitinase in the same condition as described above. After that, cells were prepared and cell cycle phases of HCT-116 and MCF-7 cells were analyzed. flow cytometer (Beckman coulter) was used.
2.12 Statistical analysis
The experimental results were expressed as the mean ± standard deviation (S.D.). One-way ANOVA was used for the calculation of data followed by Dunnett’s t-test using SPSS software version 16.
3 Result
3.1 Purification and characterization of chitinase
The chitinase bound strongly to the chitin column that was eluted only by using sodium acetate buffer saline at the pH of 3.5 (Fig. 1A). The chitinase run with the MW of about 33.0 kDa in SDS-PAGE (Fig. 1B). The degraded chitinase was a glycoprotein with 4.0 % of sugar and a lack of chitinase activity. The chitinase was also isolated by using ion-exchange chromatography. The crude extract was loaded on a QA-cellulose column and the unbound fraction was collected (Fig. 1C). The eluted fraction had chitinase activity and in a SDS-PAGE, the enzyme migrated with the 33.0, 6.0 and <4.0 kDa bands. 33.0 and 6.0 kDa fragments were separated by the gel filtration chromatography on a Sephadex G-50 column (Fig. 1D) in the intact form, whereas <4.0 kDa was further fragmented (Fig. 1E). 33.0 kDa fraction was a glycoprotein with 4.0 % of sugar and showed chitinase activity. In contrast, other fragments did not show chitinase activity and were not glycopeptides. The result was summarized in Table 2.
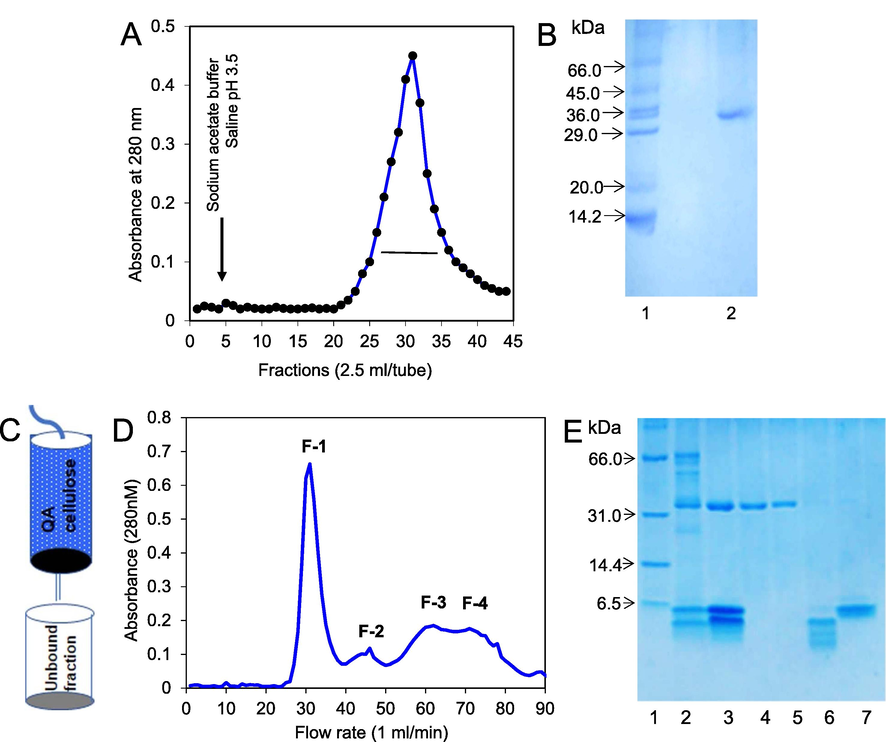
- Purification of chitinase fragments. (A) Clear T. dioica seed extract was loaded on a chitin column and chitinase was eluted by sodium acetate buffer saline pH 3.5 at the flow rate of 1 ml/min (B) 15 % polyacrylamide gel electrophoresis pattern of the eluted fraction. Lane-1: Marker proteins and Lane-2: purified 33 kDa chitinase fragment. (C) Clear homogenized Trichosanthes dioica seeds extract was loaded on a QA-cellulose column and the unbound fraction was collected. (D) Unbound fraction was loaded on a Sephadex G-50 column and the fractions were collected 2.5 ml/tube. (E) 15 % polyacrylamide gel electrophoresis pattern. Lane-1: Marker proteins, Lane-2: crude sample, Lane-3: unbound fraction (chitinase fragments) of QA-cellulose column, Lane-4: fraction-1 (33 kDa chitinase.) of Sephadex G-50 column without β-mercaptoethanol, Lane-5: fraction-1 (chitinase) with β-mercaptoethanol, Lane-6: fraction-3, Lane-7: fraction-2 (6 kDa chitinase fragment).
| Purification methods | Fraction | MW weight (kDa) |
Sugar Content | Chitinase activity |
|---|---|---|---|---|
| Affinity Chromatography | – | 33.0 | + | – |
| Gel filtration | F-1 | 33.0 | + | + |
| chromatography | F-2 | 6.0 | – | – |
| F-3 | <4.0 | – | – |
3.2 In vitro cell growth inhibition
At 200 µg/ml protein concentration, 49.1 %, 48.8 % and 38.12 % of EAC, HCT-116 and MCF-7 cells growth were inhibited by chitinase, respectively. When the concentration was reduced to half, the EAC cells growth decreased rapidly that was similar to MCF-7 cells and at the concentration of 50 µg/ml, the EAC cells growth inhibition decreased almost to zero. In contrast, about 20 % cell growth was observed for HCT-116 and MCF-7 cells, as shown in Fig. 2A. The IC50 values were 192, 200 and 302 µg/ml for HCT-116, EAC and MCF-7 cells. On the other hand, no inhibition was observed for the 6.0 kDa fragment.
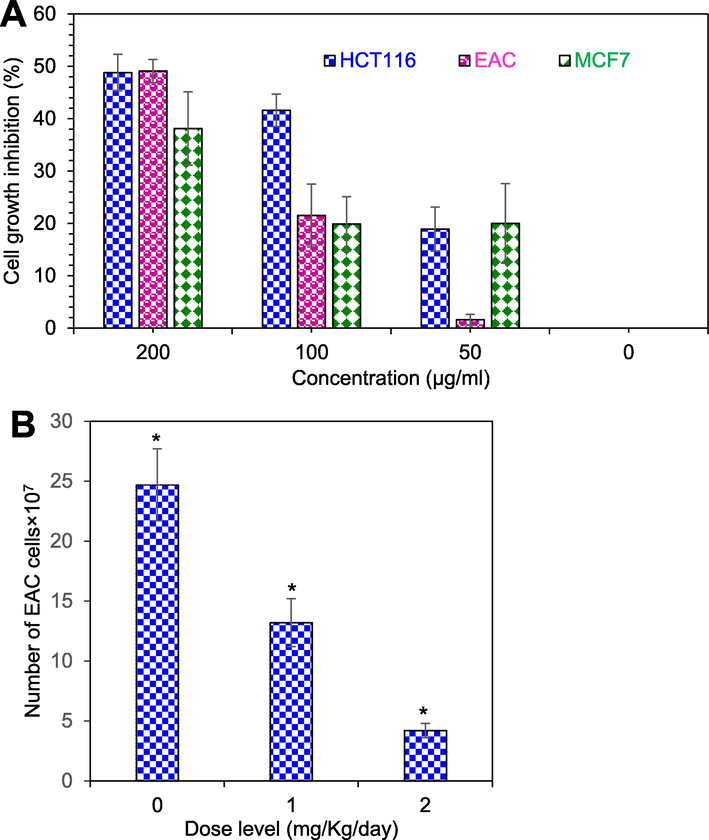
- Cell growth inhibition of chitinase. (A) Cytotoxicity study of chitinase against EAC, HCT-116 and MCF-7 cells in vitro. (B) Total number of viable EAC cells in chitinase treated and untreated experimental mice. Data are expressed as mean ± standard error of mean (n = 6). Level of significance *p < 0.05 when compared with that of the control group.
3.3 Cell growth inhibition in vivo in mice
At the doses of 1.0 mg/kg/day, 46 % EAC cells growth inhibition was observed. The growth inhibition incresed to 82 % at the dose of 2 mg/kg/day of chitinase, as shown in Fig. 2B.
3.4 Observation cell morphological changes
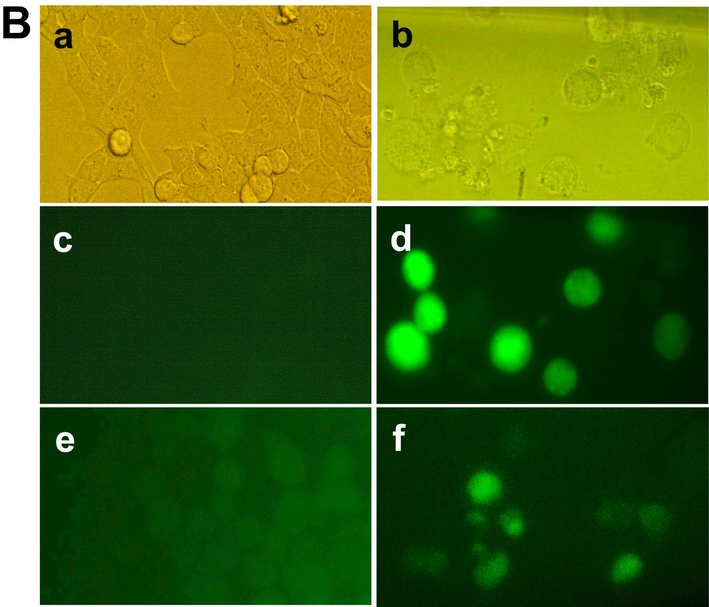
After treatment of HCT-116, MCF-7 and EAC cells with the chitinase, apoptotic features were observed with the comparison of untreated control cells, as shown in Fig. 3A. ROS generation was observed for HCT-116 and MCF-7 cells, as shown in Fig. 3B.
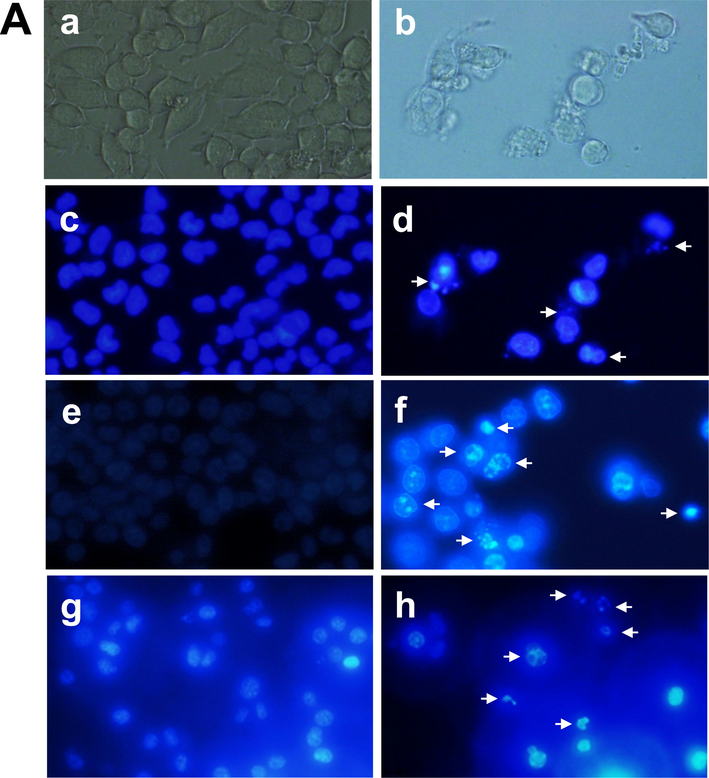
- Cell morphological change after staining with Hoechst 33342 dye and ROS generation after treatment with chitinase. (A) Optical microscopic view of the control MCF-7 cells (a) and treated MCF-7 cells (b); fluorometric image of the control MCF-7 cells (c) and treated MCF-7 cells (d); fluorometric image of the control HCT-116 cells (e) and treated HCT-116 cells (f); fluorometric image of the control EAC cells (g) and treated EAC cells (h), Arrow indicating apoptotic cells. (B) Optical microscopic view of the control and treated HCT-116 cells in (a) and (b) respectively; fluorometric images of control & treated HCT-116 cells and fluorometric images of control & treated MCF7 cells were represented by (c), (d), (e) and (f), respectively. Pictures were captured in 40x magnification.
- Cell morphological change after staining with Hoechst 33342 dye and ROS generation after treatment with chitinase. (A) Optical microscopic view of the control MCF-7 cells (a) and treated MCF-7 cells (b); fluorometric image of the control MCF-7 cells (c) and treated MCF-7 cells (d); fluorometric image of the control HCT-116 cells (e) and treated HCT-116 cells (f); fluorometric image of the control EAC cells (g) and treated EAC cells (h), Arrow indicating apoptotic cells. (B) Optical microscopic view of the control and treated HCT-116 cells in (a) and (b) respectively; fluorometric images of control & treated HCT-116 cells and fluorometric images of control & treated MCF7 cells were represented by (c), (d), (e) and (f), respectively. Pictures were captured in 40x magnification.
3.5 Detection of caspase proteins expressions in HCT-116 cells using caspase inhibitors
HCT-116 cells growth inhibition was checked in the presence of caspase-8 and caspase-9 inhibitors. In the presence of caspase-8, 41.6 % HCT-116 cells growth inhibition decreased to 20.4 % and no change was observed in the presence of caspase-9 inhibitor.
3.6 Apoptosis related gene expressions
Apoptosis-related p53, FAS, BAX, BCL2, TNFα, NFκB and PARP genes expression were checked for HCT-116. PARP, p53, FAS, BAX, BCL2, TNFα, FADD, Caspase-8, NFκB and MAPK gene expression were checked for MCF-7 cells. After treatment of HCT-116 cells with the chitinase, the expression level of p53 and TNFα was increased consequently with the decrease of PARP gene expression (Fig. 4A and B). Changes in expression were not found for other genes and the result was not shown. On the other hand, elevated expression was observed for PARP, MAPK, NFκB, FAS, FADD, and Caspase-8 genes in the MCF-7 cells (Fig. 4C and D). No change was observed for other genes and the result was not shown.
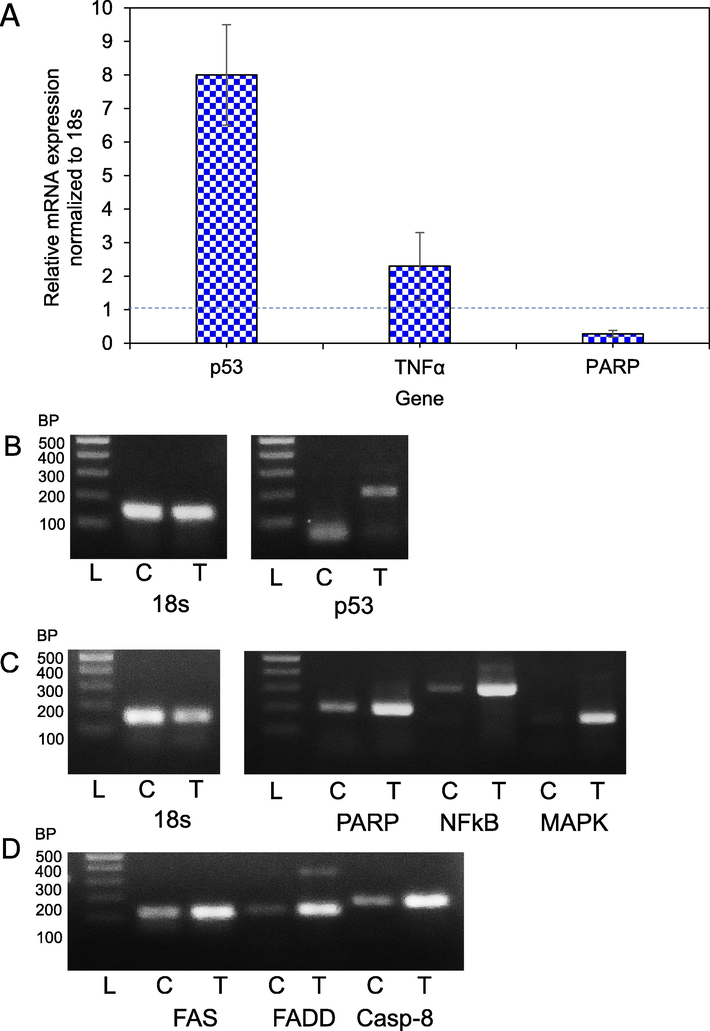
- Real-time PCR and RT-PCR. (A) Percentages of relative mRNA expression after treatment of HCT-116 cells with chitinase. (B) The Expression level of p53 gene of HCT-116 was verified by RT-PCR. (C) The expression level of PARP, NFκB and MAPK in MCF-7 cells (D) Expression level of FAS, FADD and Caspase-8 in MCF-7 cells. ‘L’ represents DNA ladder, ‘C’ expression with control and ‘T’ expression with chitinase treated RNA. Quality of control and treated RNA were checked by the 18 s gene.
3.7 Cell cycle analysis
In untreated HCT-116 cells, the G0/G1, S and G2/M cell cycle phases were 75.48, 9.41 and 11.03 %. After treatment with chitinase, G0/G1 phase decreased to 52.14 % at the same time S and G2/M phases increased to 28.13 % and 17.79 %, respectively (Fig. 5A & B). For MCF-7 the G0/G1, S and G2/M cell cycle phases were 63.54 %, 17.37 % and 17.04 %, respectively. After treatment with the chitinase, the Sub G1 phase was found 7.63 % and the G0/G1 was decreased to 50.38 %, with the increase of S and G2/M cell cycle phases to 22.4 % and 19.96 %, respectively (Fig. 5C & D). Increased ‘S’ cell cycle is observed for both types of cells after treatment with chitinase.
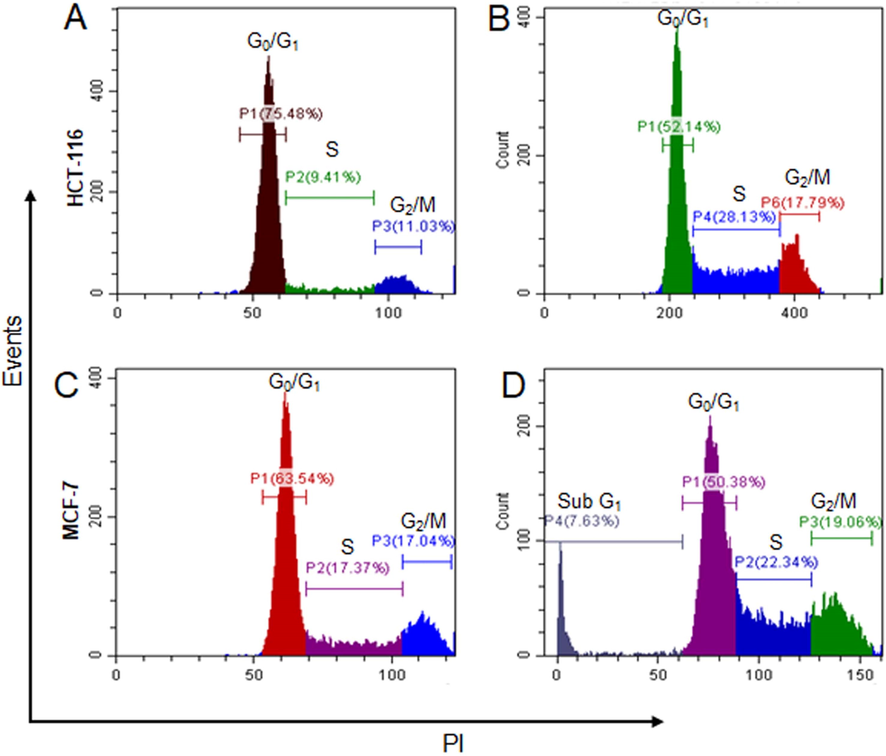
- Different phases of HCT-116 and MCF-7 cells before and after treatment with chitinase. (A) and (C) represented cell cycle phases of HCT-116 and MCF-7 cells before treatment with the chitinase, respectively. (B) and (D) represented cell cycle phases of HCT-116 and MCF-7 cells after treatment with the chitinase, respectively.
4 Discussion
For evaluating the anticancer properties, we have attempted to purify the chitinase (39 kDa) by using the established protocol (Kabir et al., 2016). But the chitinase was purified in degraded form with two clear bands (33.0 and 6.0 kDa). The chitinase activity and sugar content was observed only in 33 kDa fragment. The result indicated that the fragmentation process did not affect the structure of the active site of the enzyme. After that, we attempted to purify the chitinase with its full structural form using chitin affinity column. In this case 33.0 ± 1 kDa fragment was purified with 4 % neutral sugar and no chitinase activity. The fragmented chitinase was not eluted from the column up to pH 4.0. The possible reason may be the strong binding between the enzyme and chitin. In our previous study, 80 % chitinase activity was observed at the pH of 4.0. In the present study, the chitinase lost its activity completely at the pH of 3.5 and eluted from the column with the loss of a fragile fragment. The complete loss of activity indicated that the quick increase of pH was not able to recover the structural change of the enzyme.
Chitinase is a well-known enzyme that retains antifungal activity (Liu et al., 2020; Loc et al., 2020; Rajninec et al., 2020; Oliveira et al., 2020; Yano et al., 2020). Although many chitinases were purified and reported as antifungal agents (Malik and Preety, 2019) only very few were designated as anticancer agents (Pan et al., 2005). Cytotoxicity of the 6 and 33 kDa fragments was checked against MCF-7, HCT-116 and EAC cells. But only the 33 kDa fragment showed cytotoxicity against the three cells. The result showed that the chitinase is more toxic for HCT-116 and EAC cells than that of the MCF-7 cells. Chitinases from Calotropis procera latex showed cytotoxicity against HCT-116, OVCAR-8 and SF-295 tumor cell lines (Viana et al., 2017). A chitinase from Trichoderma viride inhibited the growth of HCT-116 and MCF-7 cell lines (Abu-Tahon and Isaac, 2020). Pan et al. (2005) reported two chitinases isolated from different bacteria, causing similar toxicity by structural damage in MCF-7 cells while no toxic effect was observed in normal mice spleen cells. They also reported the chitinase reduced the tumor size gradually in the human breast cancer xenograft B11-2 in SCID but did not mention the molecular mechanism of action. Although some chitinase showed antiproliferative activity against different cancer cells, for the first time we are reporting degraded chitinase retained its ability to inhibit the cancer cells growth. The molecular weights of the chitinases used for antiproliferative activity in other laboratories were different from the presently studied chitinase.
The enzyme was purified by gel filtration chromatography with chitinase activity and by chitin column without chitinase activity. In both cases, the enzyme showed cytotoxicity against the cancer cell lines and the results demonstrate the enzyme activity is not responsible for the antitumor activity. Antitumor activity of the chitinase obtained from the affinity column was checked against rapidly growing EAC cells in mice lacking H2 histocompatibility (Chen and Watkins, 1970). The chitinase showed higher antitumor activity against EAC cells-bearing mice.
Cell growth inhibition occurred in different mechanisms e.g., apoptosis, pyroptosis, autophagy, or necrosis. Death-inducing signals, ROS generation, caspase up-regulation etc. are the cellular processes that are related to apoptosis. In the present study, induction of apoptosis in MCF-7, HCT-116 and EAC cells by the chitinase was confirmed by Hoechst 33342 staining. Cytosolic ROS was increased after treatment of MCF-7 and HCT-116 cells which caused oxidative stress in the cells and promoted cell death.
During apoptosis, several gene expressions are altered. In the present study, expression levels of p53 and TNFα were increased with the decrease of PARP gene in HCT-116 cells. It was reported that TNFα caused DNA damage in HCT-116 cells (Alotaibi et al. 2021). PARP is widely known as a DNA repairing gene and the decrease in expression indicated the loss of the DNA repair mechanism of the cells (Sakai et al. 2012). Caspase can cleave PARP and thereby inactivate it (Los et al. 2002). Here we found the caspase-8 protein expression remarkably increased in HCT-116 cells after treatment with the chitinase. p53 is a well-known apoptotic gene that causes cell death in HCT-116 cells by the translocation of BAX to mitochondria (Lim & Park, 2009). Induction of apoptosis was reported by the upregulation of p53 and downregulation of PARP gene in HCT-116 cells (Kabir et al. 2021). The up-regulation of the p53 and TNFα gene, and the down-regulation of the PARP gene confirmed the apoptotic cell death in HCT-116.
After treatment of MCF-7 cells, PARP gene expression was increased significantly. Besides the repair of DNA, PARP also retains the ability to induce programmed cell death. PARP produced PAR, (Poly (ADP-ribose) that stimulates mitochondria to release apoptosis-inducing factor (AIF) (Yu et al., 2006) in a caspase-independent mechanism. NFκB also acts as a pro-apoptotic and anti-apoptotic regulatory factor (Kaltschmidt et al., 2000; Lin et al., 1999). After treatment with the chitinase fragment, expression of NFκB was increased significantly and might have entered the nucleus and caused the DNA breakdown (Kabir et al., 2020). MAPK, FAS, FADD and Caspase-8 are well known as apoptotic genes. Besides PARP and NFκB genes, the expression level of FAS, FADD and Caspase-8 was also increased. The results confirmed the induction of apoptosis in MCF-7 cells and the involvement of the FAS-mediated pathway. To control cell survival and apoptosis, mitogen-activated protein kinases (MAPK) play important roles (Xiao et al., 2013; Yu et al., 2011). It was reported that Chicoric acid-induced apoptosis in 3T3-L1 preadipocytes through the ROS generation which regulates MAPK signaling pathways where mitochondrial dysfunction occurred followed by the activation of caspase-3 (Xiao et al., 2013). In the present study, ROS generation may be activated the MAPK pathways that may be caused apoptosis in MCF-7 cells. The induction of apoptosis in HCT116 cells, MCF-7 cells were pictorially represented along with the EAC-related mice experiment in Fig. 6.
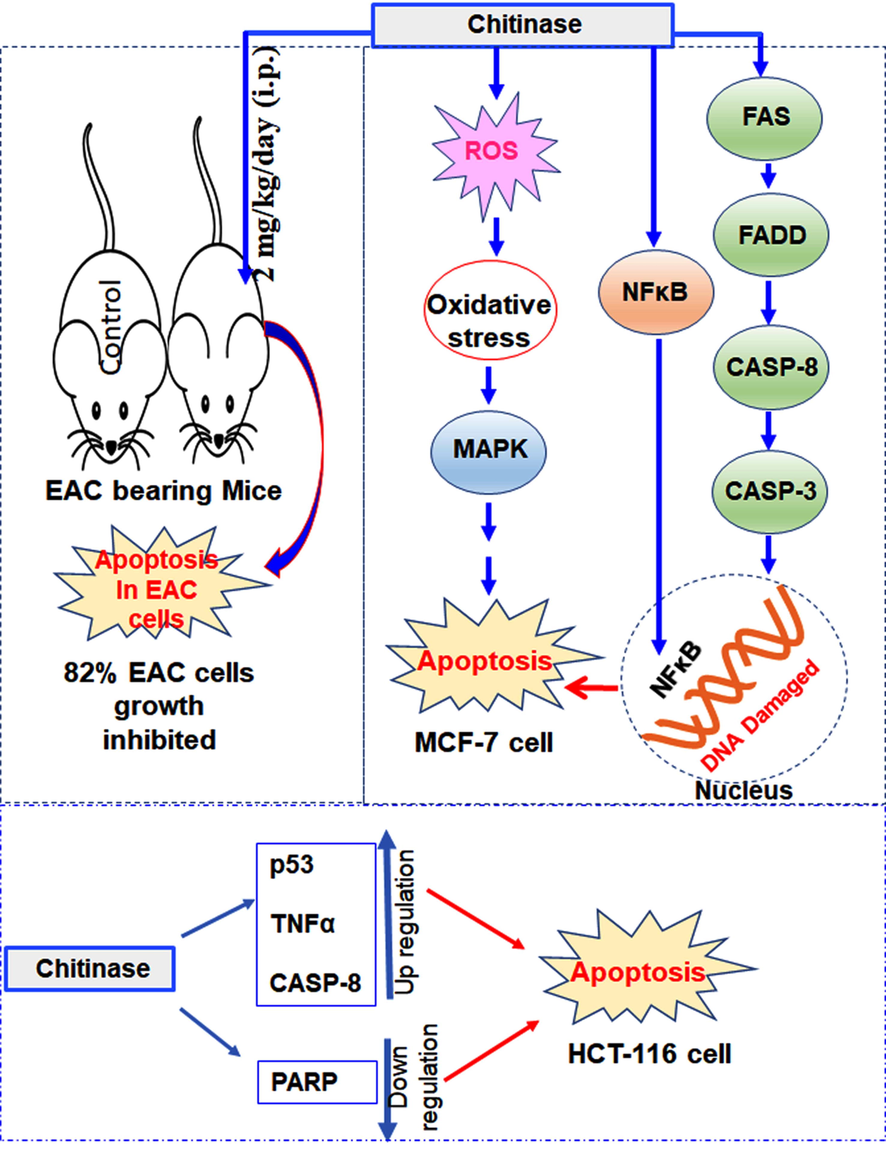
- Pictorial representation of the anticancer properties of the chitinase against EAC, MCF-7 and HCT-116 cells.
The cell cycle is a biological process that is regulated by many proteins and a series of events take place in the cell. Cancer is the result of the variations of the regulation in the cell. Many antitumor agents are used to stop the cell cycle at G0/G1, S, or G2/M phases that cause cancer cell death. In our earlier experiments, we have found that several lectins arrested G0/G1 and G2/M phases of cell cycle and induced apoptotic cell death in different cell lines (Islam et al., 2019; Kabir et al., 2021, 2013). In the present study, the chitinase arrested the S phase of the HCT-116 and MCF-7 cells. S cell cycle arrest was also observed in EAC cells after treatment with Asparagus racemosus lectin (Kabir et al., 2021).
In conclusion, T. dioica seed chitinase enzyme contained fragile parts that degraded easily and did not affect the chitinase activity. The chitinase showed strong cytotoxicity against HCT-116 and MCF-7 cells in vitro by inducing apoptosis through the alteration of several apoptosis-related genes. In the in vivo experiments, the fragmented chitinase remarkably inhibited the EAC cells growth in mice. Further studies would be helpful to designate chitinase as an promising anticancer agent.
Acknowledgement
MCF-7 and HCT-116 cells were kindly provided by Dr. Zhao XuDong, Kunming Institute of Zoology, CAS, China. The research work was supported by the Faculty of Science, University of Rajshahi, Bangladesh (Grant ID No. 1225/5/52/RU/Science-25/2019-2020).
Consent to participate
All authors agree mutually with the participation and publication of this work and declare that this is original research.
Author contribution
M.R. Karim helped the first author for mice-related works, M.T. Alam helped the first author for cell cycle-related works. The rest of all works were done by S. R. Kabir with the manuscript writing and fund collection.
Declaration of Competing Interest
The authors declare that they have no known competing financial interests or personal relationships that could have appeared to influence the work reported in this paper.
References
- Anticancer and antifungal efficiencies of purified chitinase produced from Trichoderma viride under submerged fermentation. J. Gen. Appl. Microbiol.. 2020;66:32-40.
- [CrossRef] [Google Scholar]
- Tumour necrosis factor-α (TNF-α) enhances dietary carcinogen-induced DNA damage in colorectal cancer epithelial cells through activation of JNK signaling pathway. Toxicology. 2021;457:152806
- [CrossRef] [Google Scholar]
- Evidence against the presence of H2 histocompatibility antigens in Ehrlich ascites tumour cells. Nature. 1970;225:734-735.
- [CrossRef] [Google Scholar]
- Colorimetric Method for Determination of Sugars and Related Substances. Anal. Chem.. 1956;28:350-356.
- [CrossRef] [Google Scholar]
- Plant Chitinases: Genetic Diversity and Physiological Roles. CRC. Crit. Rev. Plant Sci.. 2012;31:57-73.
- [CrossRef] [Google Scholar]
- Islam, S.S., Karim, M.R., Asaduzzaman, A.K.M., Alam, A.H.M.K., Mahmud, Z.H., Kabir, S.R., 2021. Trichosanthes dioica seed lectin inhibits Ehrlich ascites carcinoma cells growth in vivo in mice by inducing G 0/G 1 cell cycle arrest, pp. 1–10. https://doi.org/10.1111/jfbc.13714.
- International Journal of Biological Macromolecules Kaempferia rotunda tuberous rhizome lectin induces apoptosis and growth inhibition of colon cancer cells in vitro. Int. J. Biol. Macromol.. 2019;141:775-782.
- [CrossRef] [Google Scholar]
- Pea lectin inhibits growth of Ehrlich ascites carcinoma cells by inducing apoptosis and G2/M cell cycle arrest in vivo in mice. Phytomedicine. 2013;20:1288-1296.
- [CrossRef] [Google Scholar]
- Purification and characterization of a novel chitinase from Trichosanthes dioica seed with antifungal activity. Int. J. Biol. Macromol.. 2016;84:62-68.
- [CrossRef] [Google Scholar]
- Biogenic silver/silver chloride nanoparticles inhibit human glioblastoma stem cells growth in vitro and Ehrlich ascites carcinoma cell growth in vivo. J. Cell Mol. Med.. 2020;24:13223-13234.
- [CrossRef] [Google Scholar]
- Asparagus racemosus and Geodorum densiflorum lectins induce apoptosis in cancer cells by altering proteins and genes expression. Int. J. Biol. Macromol.. 2021;191:646-656.
- [CrossRef] [Google Scholar]
- The pro- or anti-apoptotic function of NF-κB is determined by the nature of the apoptotic stimulus. Eur. J. Biochem.. 2000;267:3828-3835.
- [CrossRef] [Google Scholar]
- Induction of p53 contributes to apoptosis of HCT-116 human colon cancercells induced by the dietary compound fisetin. Am. J. Physiol. Gastrointest. Liver Physio.. 2009;l296:G1060-G1068.
- [CrossRef] [Google Scholar]
- NF-κ-B functions as both a proapoptotic and antiapoptotic regulatory factor within a single cell type. Cell Death Differ.. 1999;6:570-582.
- [CrossRef] [Google Scholar]
- Characterization of a Novel Chitinase from Sweet Potato and Its Fungicidal Effect against Ceratocystis fimbriata. J. Agric. Food Chem.. 2020;68:7591-7600.
- [CrossRef] [Google Scholar]
- Characterisation and antifungal activity of extracellular chitinase from a biocontrol fungus, Trichoderma asperellum PQ34. Mycology. 2020;11:38-48.
- [CrossRef] [Google Scholar]
- Activation and Caspase-mediated Inhibition of PARP: A Molecular Switch between Fibroblast Necrosis and Apoptosis in Death Receptor Signaling. Mol. Biol. Cell. 2002;13:978-988.
- [CrossRef] [Google Scholar]
- Protein measurement with the folin phenol reagent. J. Biol. Chem.. 1951;193:265-275.
- [Google Scholar]
- Purification and properties of plant chitinases: A review. J. Food Biochem.. 2019;43:1-11.
- [CrossRef] [Google Scholar]
- Structural and functional features of a class VI chitinase from cashew (Anacardium occidentale L.) with antifungal properties. Phytochemistry. 2020;180
- [CrossRef] [Google Scholar]
- Chitinase induces lysis of MCF-7 cells in culture and of human breast cancer xenograft B11–2 in SCID mice. Anticancer Res.. 2005;25:3167-3172.
- [Google Scholar]
- Biochemical and antifungal characteristics of recombinant class I chitinase from Drosera rotundifolia. Int. J. Biol. Macromol.. 2020;161:854-863.
- [CrossRef] [Google Scholar]
- PARP and CSB modulate the processing of transcription-mediated DNA strand breaks. Genes Genet. Syst.. 2012;87:265-272.
- [CrossRef] [Google Scholar]
- Cytotoxicity against tumor cell lines and anti-inflammatory properties of chitinases from Calotropis procera latex. Naunyn. Schmiedebergs. Arch. Pharmacol.. 2017;390:1005-1013.
- [CrossRef] [Google Scholar]
- Chicoric acid induces apoptosis in 3T3-L1 preadipocytes through ROS-mediated PI3K/Akt and MAPK signaling pathways. J. Agric. Food Chem.. 2013;61:1509-1520.
- [CrossRef] [Google Scholar]
- Yano, S., Kanno, H., Tsuhako, H., Ogasawara, S., Suyotha, W., Konno, H., Makabe, K., Uechi, K., Taira, T., 2020. Cloning, expression, and characterization of a GH 19-type chitinase with antifungal activity from Lysobacter sp. MK9-1. J. Biosci. Bioeng. (in press) https://doi.org/10.1016/j.jbiosc.2020.11.005.
- Apoptosis-inducing factor mediates poly(ADP-ribose) (PAR) polymer-induced cell death. Proc. Natl. Acad. Sci. U.S.A.. 2006;103:18314-18319.
- [CrossRef] [Google Scholar]
- Mycotoxin zearalenone induces AIF-and ROS-mediated cell death through p53-and MAPK-dependent signaling pathways in RAW264.7 macrophages. Toxicol. Vitr.. 2011;25:1654-1663.
- [CrossRef] [Google Scholar]


