

Translate this page into:
Comparative untargeted metabolomics analysis of serum metabolic alterations in patients infected with hepatitis B virus genotypes B and C
⁎Corresponding authors at: Institute of Hepatology, Affiliated Hospital of Jiaxing University, Jiaxing 314001, PR China (D. Wei.), Department of Infectious Diseases, Affiliated Hospital of Jiaxing University, Jiaxing314001, PR China (F. Fu). x0451140125@126.com (Fanchun Fu), weidahai3166@hotmail.com (Dahai Wei)
-
Received: ,
Accepted: ,
This article was originally published by Elsevier and was migrated to Scientific Scholar after the change of Publisher.
Abstract
The clinicopathological characteristics and outcomes of patients infected with hepatitis B virus (HBV) differ between genotypes B and C. However, the potential metabolic mechanisms and differences in certain biological pathways associated with different HBV genotypes remain unclear to date. To obtain a better understanding of the effects of liver diseases caused by HBV genotypes B and C on host metabolism, an untargeted metabolomics analysis was performed to assess the differences among the serum metabolic profiles of healthy controls and patients infected with genotypes B or C. Here, a total of 54 serum samples were obtained from healthy controls and patients with chronic HBV infections caused by genotypes B and C, and the samples were subjected to metabolomics analysis. The serum metabolite profiles were analyzed using an ultrahigh-performance liquid chromatography-quadrupole-time-of-flight/mass spectrometry (UHPLC-Q-TOF/MS)-based untargeted metabolomics approach for identifying the differentially expressed metabolites that were upregulated or downregulated by at least 1.5-foldin the serum samples of patients infected with HBV genotypes B and C. A total of 63 metabolites were found to be differentially expressed between the serum samples of healthy controls and patients infected with HBV genotype B, while 57 metabolites were differentially expressed between the serum samples of healthy controls and patients infected with HBV genotype C. The majority of these metabolites were involved in regulating the bile acid (BA) metabolism pathways. The results also indicated that 8 differentially expressed metabolites can serve as potential metabolic biomarkers for distinguishing between individuals infected with the HBV genotype B and C. Altogether, the untargeted metabolomics analysis revealed that infection with HBV genotypes B and C is associated with different metabolic profiles, and the study provided fundamental information for further detailed investigations of the mechanism underlying metabolic dysregulation in HBV infections.
Keywords
Untargeted metabolomics
Serum metabolites
HBV genotypes B and C
Bile acid metabolism pathway

1 Introduction
Hepatitis B virus (HBV) is a noncytopathic DNA virus that belongs to the Orthohepadnavirus genus under the Hepadnaviridae family. The 3200 bp long relaxed circular partially double-stranded DNA genome comprises four major overlapping open reading frames denoted as S (surface antigen), C (core), X (HBx protein), and P (polymerase) (Iannacone and Guidotti, 2022,Seto et al., 2018, Tong and Revill, 2016). The burden of HBV-induced liver disease has been effectively reduced by extensive vaccination programs and antiviral therapies against HBV; however, there are no curative treatment options for eradicating the virus from the host (Palak et al., 2023, Seto et al., 2018, Liu et al., 2019). According to the World Health Organization (WHO), almost one-third of the global population has been exposed to HBV at some stage in their lives. Chronic HBV infections are prevalent in an estimated 296 million individuals worldwide, and HBV causes approximately 820,000 deaths annually (Iannacone and Guidotti, 2022, Geneva: World Health Organization, 2022). As HBV DNA integrates into the genome of hepatocytes, HBV infections cause inflammation and necrosis of liver tissues by activating host immunity, which targets and destroys infected liver cells. This leads to persistent infections and even serious liver disease, including hepatic failure, liver decompensation, liver fibrosis and cirrhosis, and hepatocellular carcinoma (HCC) in infected individuals (Di Stefano et al., 2023, Tang et al., 2018, Kuipery et al., 2020). Epidemiological studies have clearly demonstrated that several viral factors, including the viral genotype and serotype, levels of HBV DNA, and mutations specific to certain phenotypes, are associated with the development of HBV-related liver diseases and cause disparities in clinical manifestations (Iannacone and Guidotti, 2022, Tong and Revill, 2016, Yuen et al., 2018). One of the major viral factors is the genotype, which is associated with distinct clinical manifestations of HBV and affects the natural course of HBV endemicity, transmission modes,and progression of liver diseases (An et al., 2018, Lin and Kao, 2017).
Based on an intergenotypic sequence divergence of 8% or more across the entire genome, HBV can be grouped into 10 known genotypes (A to J) and numerous subgenotypes with distinct ethnic and geographical distributions globally (Di Stefano et al., 2023, Lin and Kao, 2017, Tian and Jia, 2016). Genotypes B and C are most prevalent in East Asian countries, including China, with genotype B being more common in the southern regions and genotype C being more prevalent in northern Asia where vertical transmission is the predominant mode of transmission (Bello et al., 2023, Lin and Kao, 2017, Tian and Jia, 2016). Different HBV genotypes have been found to be associated with genome mutations, clinical phenotypes, prognosis, vaccination probability, response to antiviral treatment, and disease progression (Lin and Kao, 2017, Tian and Jia, 2016, Wai et al., 2004, Kao et al., 2003). For instance, some studies have reported that compared to genotype B, genotype C is more frequent in patients with a higher frequency of specific mutations, higher viral load, more active disease, prolonged HBeAg phase, and an elevated risk of hepatic cirrhosis and HCC (Choiet al., 2023, Liet al., 2023, Chan et al., 2008). A study on 1106 patients from Hong Kong demonstrated that patients infected with HBV genotype C had a significantly higher frequency of advanced fibrosis at presentation (25% vs. 19%, P = 0.015) and an insignificantly lower incidence of fibrosis (42% vs. 55%, P = 0.0001) compared than individuals infected with HBV genotype B (Chan et al., 2009). Another study on 193 patients with resectable HBV-related HCC revealed that patients infected with HBV genotype B had a lower rate of hepatic cirrhosis (33% vs. 51%, P = 0.01), but a higher frequency of solitary tumors (86% vs. 94%, P = 0.048) than patients infected with HBV genotype C (Lin et al., 2007). Notably, genotype B was more common in younger patients with HCC who were<50 years old than in age-matched asymptomatic HBV carriers. However, HBV genotype C was found to be associated with patients with hepatic cirrhosis and older patients with HCC who were aged older than 50 years, compared to age-matched asymptomatic HBV carriers (Liet al., 2023, Kao et al., 2000). The study reported that the incidence of HBV genotype B was considerably higher in younger patients with HCC, with 90% of inpatients aged under 35 years, who were mostly noncirrhotic (Kao et al., 2000). These findings strongly demonstrate that there are significant differences in the clinical manifestations of patients infected with HBV genotypes B and C. Although the effect of genotypes B and C on the progression and clinical outcomes of HBV-related liver disease has been known for decades, the virologic and metabolic mechanisms underlying the characteristics of the immune response in patients infected with the two different genotypes remain to be elucidated.
The liver is the most important organ for the metabolism of xenobiotics, carbohydrates, and lipids (Tong and Revill, 2016, Zeisel et al., 2021). In general, HBV infections induce marked alterations in the metabolism of related substances, which can in turn modify the synthesis of metabolites in the host by causing changes in the host metabolic profile, optimizing the conditions for viral replication, and increasing the long-term survival of HBV (Zeisel et al., 2021, Yang, 2018). Notably, these alterations may lead to epigenetic modifications in the cellular regulatory networks of host metabolites that are associated with establishing the infection and subsequent pathogenesis of HBV-related liver diseases (Kim et al., 2021, Lamontagne et al., 2016). Accumulating evidence indicates that HBV genotype C infects patients with a higher population of T helper 2 (Th2) cytokine-producing T cells and a lower level of Th1 cytokine-producing T cells than genotype B, which suggests that infection with HBV genotype C decreases the ratio of Th1/Th2 cytokines compared to infections with genotype B (Yuen et al., 2007, Han et al., 2011). Therefore, the levels of Th1 and Th2 cytokine-producing T cells are downregulated and upregulated, respectively, in patients infected with HBV genotype C, and these patients are more likely to develop HCC. In our recent study on the quantitative serum proteomics analysis of patients infected with HBV genotypes B and C, we observed that the proteins that were dysregulated in the serum of patients infected with HBV genotype B were mostly involved in various biological processes, including the complement and coagulation cascades, NF-κB signaling pathway, focal adhesion, PI3K-Akt signaling pathway, ECM-receptor interaction, and cellular adhesion, while the proteins that were dysregulated in the serum of patients infected with genotype C were primarily associated with the regulation of Staphylococcus aureus infections and the complement and coagulation cascades (Chen et al., 2021). The findings implied the existence of specific molecular and metabolic differences in the molecular pathogenesis of patients infected with HBV genotypes B and C. However, the precise metabolic mechanisms associated with these differences remain to be elucidated.
Comparative metabolomics with ultrahigh-performance liquid chromatography-quadrupole-time-of-flight/mass spectrometry (UHPLC-Q-TOF/MS) is an unsupervised or discovery-based approach to capture chemical exposures without having preexisting knowledge about the identities of metabolites in a biospecimen and is extensively employed for investigating the metabolic characteristics of host responses during viral infections (Jaberet al., 2022, Melo et al., 2017, Zhou et al., 2021,Voge et al., 2016). This approach is capable of measuring and comparing multiple classes of metabolites that are altered in response to manipulation of a biological system, and aids in determining the alterations in host metabolism and physiology, and identifying possible diagnostic biomarkers and intervention strategies against viral infections (Newgard, 2017,Kumari et al., 2021). Therefore, UHPLC-Q-TOF/MS-based serum metabolomics strategies can be applied for screening and identifying disease-specific metabolic biomarkers for the early recognition, detection, and hence appropriate and timely treatment of viral diseases. This strategy also enables us to explore the host factors that mediate alterations in metabolic pathways, allowing us to further understand the molecular pathogenesis of viral infections (Voge et al., 2016,Usman et al., 2022, Kumar et al., 2020). However, the application of serum metabolomics approaches for determining the differences between the serum metabolic profiles of patients infected with HBV genotypes B and C has not been reported to date. To gain a better understanding of the metabolic differences in the underlying mechanisms of host resistance to HBV genotypes B and C, we performed a comparative untargeted metabolomics analysis of serum samples collected from patients infected with HBV genotypes B and C. Therefore, this study aimed to explore the metabolic differences between patients infected with the two different HBV genotypes, and the results could provide novel insights into the hepatic pathophysiology underlying these differences.
2 Materials and methods
2.1 Patients and sample collection
Healthy controls and consecutive patients with chronic hepatitis B (CHB) infections who were identified as seropositive for HBV infection were recruited from the Department of Infectious Diseases of the Affiliated Hospital of Jiaxing University in East China between January 2018 and June 2020. A total of 18 serum samples from healthy controls (Group A) and 36 serum samples from patients infected with HBV genotype B (Group B) or C (Group C) were selected for the study. A commercial HBV genotyping kit (Shanghai Fosun Pharmaceutical Co. Ltd., China) was used to determine HBV genotypes by real-time fluorescence quantitative PCR, according to the manufacturer’s instructions and as previously described (Wei et al., 2015, Wei et al., 2016). Patients with the following demographic and clinical characteristics were excluded from the study: antiviral treatment in the past 2 years; coinfection with other viruses, such as HIV or HCV; occurrence of liver-related diseases, including decompensated liver disease, cirrhosis, or HCC; and autoimmune or immunologically mediated disease. The anonymized personal data related to the clinical characteristics of the patients, including the biochemical data, are provided in Table 1. The use of samples in this study was reviewed and approved by the Institutional Ethics Committee of Affiliated Hospital of Jiaxing University (approval number: LS2019-327). Written informed consent was obtained from all the participants prior to enrollment. Notes: ALT, Alanine transferase; AST, aspartate transferase; ALP, alkaline phosphatase; GGT, γ-Glutamyl transferase; PLT, Platelet; TB, total bilirubin; TBA, Total Bile Acids; ALB, albumin;APRI, aspartate aminotransferase -to- platelet ratio index; PT, prothrombin time; APTT, activated partial thromboplasting time; FIB, fibrinogen; HBeAg, hepatitis B e antigen. Data are means ± SD; P < 0.05 for comparisons between HBV-B and healthy controls*, and between HBV-C and HBV-B§.
Characteristic
Health Controls (n = 18)
HBV-B group (n = 18)
HBV-C group (n = 18)
Gender (female/male)
12/6
12/6
12/6
Age (yrs.)
40.11 ± 9.02
41.69 ± 9.38
42.83 ± 10.21
ALT (U/L)
30.21 ± 6.39
285.25 ± 201.98*
514.22 ± 459.37§
AST (U/L)
23.69 ± 11.25
159.36 ± 147.35*
332.63 ± 298.67§
ALP (U/L)
88.09 ± 28.39
95.69 ± 27.36
112.02 ± 33.25
GGT (U/L)
39.89 ± 11.59
79.51 ± 42.94*
118.20 ± 98.56§
PLT (109 L-1)
129.56 ± 15.11
151.52 ± 40.08
154.33 ± 57.56
TB (umol/L)
7.88 ± 0.89
28.05 ± 30.56*
44.32 ± 51.28§
TBA (umol/L)
9.55 ± 12.30
48.66 ± 32.23*
44.7.85 ± 35.64
ALB(g/L)
39.68 ± 3.78
44.25 ± 4.95
40.28 ± 4.39
APRI
0.46 ± 0.12
3.12 ± 3.04*
6.66 ± 5.95§
PT (s)
12.58 ± 1.02
15.39 ± 1.92*
14.85 ± 1.73
APTT (s)
34.47 ± 4.25
40.45 ± 4.25
39.69 ± 4.55
FIB (g/L)
2.61 ± 0.36
2.74 ± 0.65
2.89 ± 0.71
HBeAg
NA
188.63 ± 282.96
488.23 ± 521.78§
HBV viral load (log10)
NA
6.14 ± 1.47
6.71 ± 1.58
2.2 Sample preparation
Human serum samples were collected and pretreated from each patient according to standard operating procedures for HBV serological tests, after which the samples were divided into aliquots and stored frozen at −80 °C for subsequent experiments. Metabolite extraction was performed as previously described (Melo et al., 2017, Kumariet al., 2019, Zhang et al., 2023). Briefly, 400 μL of an ice-cold extraction solvent containing methanol/acetonitrile/water (2:2:1, v/v/v) was transferred to EP tubes, mixed thoroughly with 100 μL of the serum sample using a vortex shaker, and subsequently incubated on ice for 15 min. After centrifugation at 14,000 × g for 20 min at 4 °C, the supernatant was pipetted into a new tube and dried in a vacuum centrifuge. Each of the lyophilized samples was redissolved in 100 μL of solvent mixture (water:acetonitrile = 1:1, v/v), vortexed for 2 min, and then centrifuged at 14,000 × g for 20 min at 4 °C. The supernatant from each sample was transferred to LC vials for subsequent UHPLC-Q-TOF/MS analysis.
2.3 UHPLC-Q-TOF/MS analysis
For untargeted metabolomics analysis with UPLC-Q-TOF MS/MS, the extracted samples were injected into an AB SCIEX Triple TOF 6600 System (AB SCIEX, Framingham, MA, United States) integrated with hydrophilic interaction liquid chromatography system with electrospray ionization (ESI; performed by Shanghai Applied Protein Technology Co., Ltd., China).The sample was separated on an ACQUITY UPLC BEH Amide column (2.1 × 100 mm, 1.7 μm particle size (Waters, Manchester, UK) using a linear gradient of 25 mM ammonium acetate and 25 mM ammonium hydroxide in water (buffer A) and acetonitrile (buffer B) for both positive (POS) and negative (NEG) ionization modes at 25 °C. Elution was initiated with 85% buffer B for 1 min, which was linearly reduced to 65% buffer B over 10 min, further reduced to 40% over 0.1 min, maintained for 5 min, and finally increased to 85% for a 5-min re-equilibration. The injection volume aliquot was set at 2 µL, and the delivery flow rate was 0.4 ml/min. The operating conditions of the ESI source were as follows: source temperature (TEM), 600 °C; ion source gas (Gas) one, 60, and Gas two, 60 psi: curtain gas (CUR), 30 psi; ion spray voltage floating (ISVF), ± 5500 V; MS over a m/z range, 25–1000 Da; and product ion scanning, 0.05 s/spectra. Information dependent acquisition (IDA) was accomplished in high sensitivity mode for detecting and identifying MS/MS spectra. The etting parameters were set as follows: declustering potential (DP) was 60 V (+) and −60 V (-); collision energy (CE) was 35 V ± 15 eV; isotopes within 4 Da were excluded, and a total of 10 candidate ions were monitored per cycle.
2.4 Analysis of metabolomic data
The original MS data acquired from UPLC-Q-TOF MS/MS were converted into MzXML files using ProteoWizard MS convert software, and subsequently processed with the freely available XCMS online software (https://xcmsonline.scripps.edu/landing_page.php?pgcontent = mainPage) for extracting the peak intensities, peak matching, and correcting the retention time, using default parameters. The obtained datasets were further processed using SIMCA-p software V14.1 (Umetrics, Umea, Sweden) for multivariate statistical analysis to screen the differential metabolites. The fitness and prediction ability of the principal component analysis (PCA) and orthogonal partial least-squares discrimination analysis (OPLS-DA) models was calculated by multiple correlation coefficient (R2) and cross-validated R2 (Q2). Based on OPLS-DA, the variable importance for projection (VIP) score was recognized as an important variable for determining their relative contributions to the classification. The potential metabolites were selected based on VIP value > 1 and P value < 0.05, which was determined to be statistically significant.
2.5 Bioinformatics and statistical analyses
The potential metabolites were subjected to a BLAST search against the online Kyoto Encyclopedia of Genes and Genomes (KEGG) and Gene Ontology (GO) databases to determine the effect of the differentially expressed metabolites. Hierarchical clustering analysis (HCA) was carried out using Cluster software V 3.0 and Java Treeview software. Heatmaps were prepared for data visualization in addition to dendrograms. All statistical analyses were conducted using SPSS software V 22.0 (SPSS Inc., Chicago, IL, USA). The results of quantitative data are represented as the mean ± SD, and analyzed using a two-tailed Student’s t tests for multiple comparisons. Only differences with two-tailed P values<0.05 were considered to indicate statistical significance.
2.6 Targeted metabolomics analysis of bile acids (BAs)
To verify the results of untargeted metabolomics analysis, the metabolic profiles and levels of BAs were determined by targeted metabolomics analysis,as previously described with modifications (Wei et al., 2022). The serum BAs were assayed using a Waters ACQUITY UPLC I-Class-MS/MS system equipped with a Waters ACQUITY UPLC BEH C18 analytical column (1.7 μm, 2.1 mm × 100 mm) (ACQUITYUPLCXevo TQ-S, Waters Corp., Milford, MA, USA). The mobile phase was 0.1% formic acid in water (phase A) and methanol (phase B). The samples were placed in an autosampler at 8 °C with an injection volume of 2 μL, a flow rate of 300 μL/min, and a column temperature of 45 °C. The working parameters of the 5500 QTRAP for MS analyses were as follows: source temperature, 550 °C; ion source gas 1, 55; ion source gas 2, 55; CUR, 40; and ISVF, 4500 V. The multiple reaction monitoring (MRM) method was selected for quantifying data acquisition by MS.
3 Results
3.1 Clinical characteristics of the study participants
A total of 54 serum samples were collected from healthy controls and patients with chronic HBV infections caused by genotypes B and C, and subjected to metabolomics analysis. A total of 18 samples were obtained in each group. The demographic characteristics of the study participants are provided in Table 1. Evidently, the age distribution, sex ratio, and the levels of alkaline phosphatase (ALP), total BA (TBA), and fibrinogen (FIB) were similar across the three groups. However, compared to patients in the HBV-B group, the patients in the HBV-C group had significantly higher mean serum levels of alanine transferase (ALT) (285.25 ± 201.98 vs. 514.22 ± 459.37), aspartate transferase (AST) (159.36 ± 147.35 vs. 332.63 ± 298.67), γ-glutamyl transferase (GGT) (79.51 ± 42.94 vs. 118.20 ± 98.56), total bilirubin (TB) (28.05 ± 30.56 vs. 44.32 ± 51.28), AST- platelet (PLT) ratio index (APRI) (3.12 ± 3.04 vs. 6.66 ± 5.95), and HBeAg (188.63 ± 282.96 vs. 488.23 ± 521.78).
3.2 Global serum metabolic profiling
A total of 22,691 features were obtained from the serum samples, including 11,454 and 11,237 features in the POS mode and NEG modes, respectively, by matching the substance database with data obtained by UPLC-Q-TOF MS/MS analysis. Of these features, 28 of the 199 defined features in the POS metabolite mode and 35 of the 241 defined features in the NEG metabolite mode were found to be significantly different based on the VIP values (>1) and P values (<0.05) (Fig. 1A). After combining the POS and NEG ion models, the 380 identified metabolites were further categorized according to their chemical taxonomy based on the annotations in the Human Metabolome Database. Broadly, 37.63% of these compounds were categorized as undefined metabolites, 17.63% were lipids and lipid-like molecules, 17.11% were organic acids and derivatives, and the other four main categories included organoheterocyclic compounds (7.63%), organic oxygen compounds (7.11%), benzenoids (5.26%), and nucleosides, nucleotides, and analogs (4.21%) (Fig. 1B).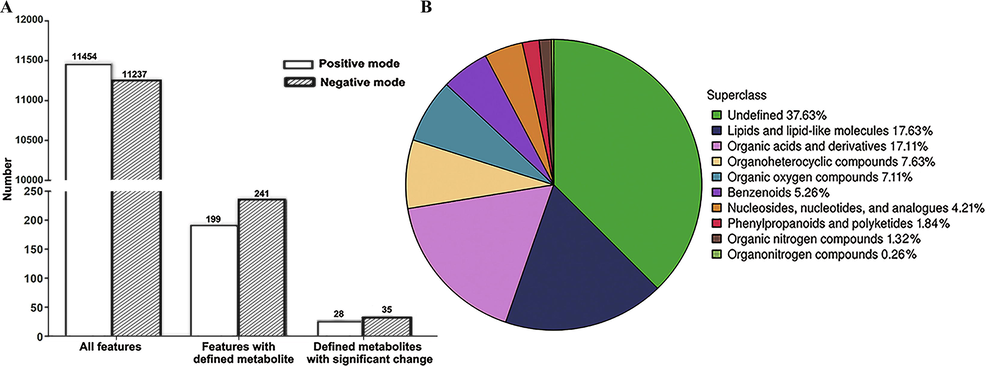
Features of the metabolome dataset of serum metabolites in patients infected with HBV genotypes B and C. (A) Number of features identified by metabolomic analysis. (B) Chemical taxonomy of the differentially expressed metabolites.
The metabolomic data were subsequently subjected to multivariate statistical analyses by PCA, PLS-DA, and OPLS-DA. All the QC samples clustered closely together in the PCA plot, which indicated good stability and reproducibility in the analytical system (Supplementary Fig. 1, Fig. 2A and Supplementary Fig. 2A). To optimize the separation between the groups, the PLS-DA and OPLS-DA modes were used for further analysis of the metabolite profiles of the two sample sets after removing the QC samples. As depicted in Fig. 2B, Fig. 2C, Supplementary Fig. 2B and Supplementary Fig. 2C, the scores of PLS-DA and OPLS-DA indicated an aggregation within groups and separation between groups, including HBV-Band healthy controls (Groups B vs. A) and HBV-C and healthy controls (Groups C vs. A), in both modes, but was more evident in OPLS-DA. The results of the 200 permutation tests revealed that the proportion of the Y variable increased, while the R2 and Q2 values of the random model decreased gradually with a gradual reduction in permutation retention, indicating that there was no overfitting in the original model (Fig. 2D, Fig. 2E, Supplementary Fig. 2D and Supplementary Fig. 2E). These findings revealed that the models met the acceptable requirements and can be used for subsequent classification of the metabolites that were differentially expressed between groups, suggesting that the model had high reliability and predictive power.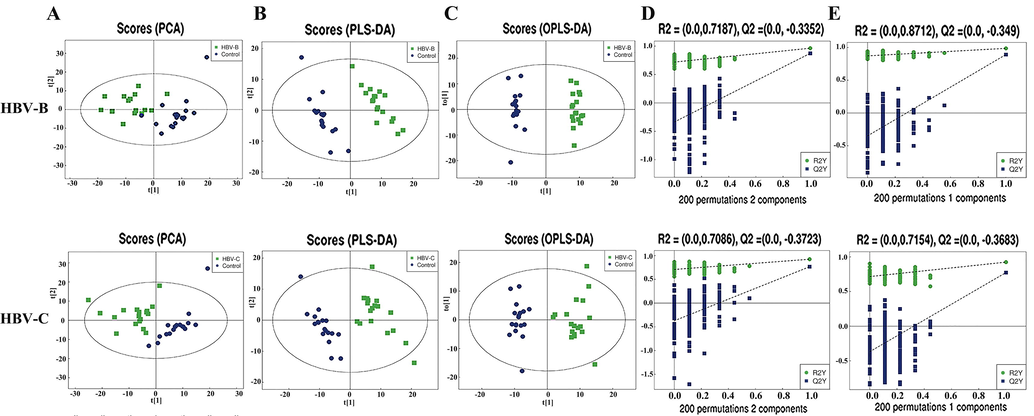
Multivariate statistical analyses of the serum samples of patients infected with HBV genotypes B and C in POS mode. (A) PCA, (B) PLS-DA, and (C) OPLS-DA scores of the overall sample. (D) PLS-DA and (E) OPLS-DA were performed for the permutation test (200 times).
3.3 Screening of key differentially expressed serum metabolites
To screen and identify the differentially expressed serum metabolites, the relative abundance values of the metabolites in each of the HBV groups were compared to those in the healthy control group. Based on hierarchical clustering analysis, 63 qualitative metabolites, including 28 and 35 in the POS and NEG modes, respectively, were determined to be differentially expressed in the sera of patients in the HBV-B group compared to that in the sera of the healthy controls (Groups B vs. A) under the conditions of VIP value > 1 and P value < 0.05 (Fig. 3A, Supplementary Fig. 3A, Supplementary Table 1 and Supplementary Table 3). When the ratios of these differentially expressed serum metabolites were plotted on a heatmap, 37 (16 and 21 in POS and NEG modes, respectively) and 26 metabolites (12 and 14 in POS and NEG modes, respectively) were found to be upregulated and downregulated, respectively, between the serum samples of the HBV-B group and those of the healthy controls. Additionally, these two sets of metabolites were found to be separated into distinct clusters (Fig. 3B and Supplementary Fig. 3B).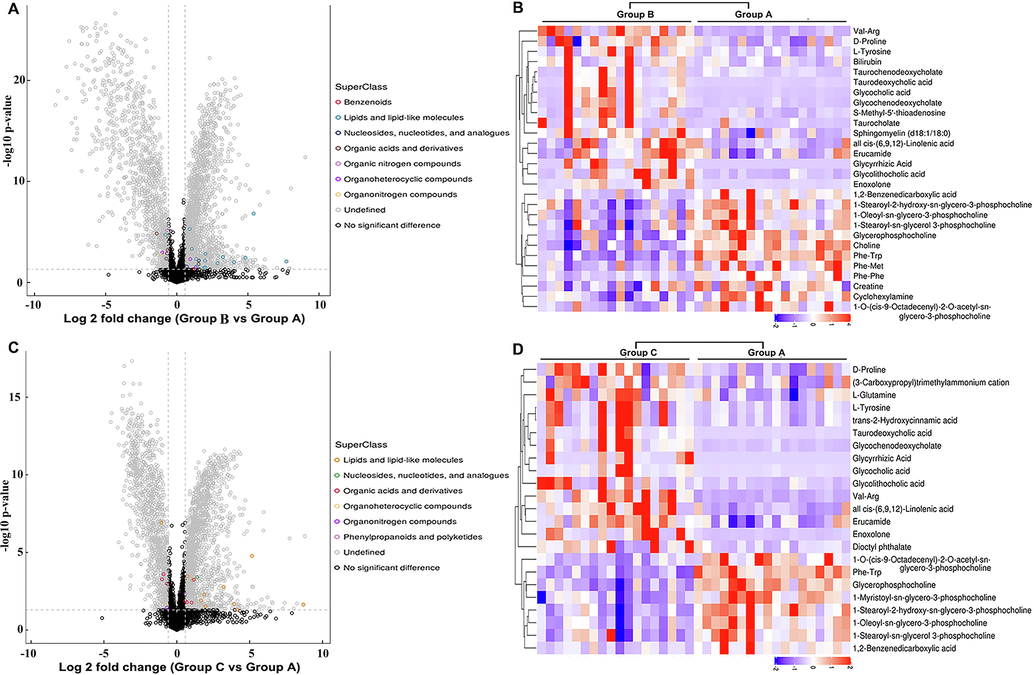
Bioinformatics analysis of the differentially expressed metabolites in POS mode. (A) Volcano plot representing the differences in protein abundance in the serum samples of healthy controls and patients infected with HBV genotype B (Groups B vs. A). (B) Hierarchical clustering of the 28 dysregulated metabolites between the serum samples of healthy controls and patients infected with HBV genotype B (Groups B vs. A). (C) Volcano plot representing the differences in protein abundance between the serum samples of healthy controls and patients infected with HBV genotype C (Groups C vs. A). (D) Hierarchical clustering of the 23 metabolites dysregulated between the serum samples of healthy controls and patients infected with HBV genotype C (Groups C vs. A).
We subsequently performed a similar comparative analysis of the serum samples of the HBV-C group and healthy controls (Groups C vs. A) based on the abovementioned criteria. A total of 34 upregulated metabolites (15 and 19 in the POS and NEG modes, respectively) and 23 downregulated metabolites (8 and 15 in the POS and NEG modes, respectively) were found to be differentially expressed between the sera of patients in the HBV-C group and healthy controls, and the metabolites formed clearly distinct clusters (Fig. 3C, Fig. 3D,Supplementary Fig. 3C, Supplementary Fig. 3D, Supplementary Table 2 and Supplementary Table 4). The metabolites that were typically differentially expressed are depicted in Table 2. However, the expression of the common dysregulated metabolites altered variably between the two groups infected with different genotypes of HBV. These findings suggested that the metabolic processes and backgrounds are highly differentially regulated between individuals infected with HBV genotype B and individuals infected with HBV genotype C. This further indicated that patients infected with HBV genotypes B and C have differential metabolic profiles.
Metabolite ID
Adducted form
Metabolite name
Fold change HBV-B/Healthy controls
Fold change HBV-C/Healthy controls
Fold change HBV-C/HBV-B
Mode
M466T520
(M + H)+
Glycocholic acid
28.37
17.60
0.62
Positive
M517T283
(M + NH4)+
Taurodeoxycholic acid
5.51
7.35
1.33
Positive
M450T438
(M + H)+
Glycochenodeoxycholate
9.47
9.29
0.98
Positive
M471T136
(M + H)+
Enoxolone
8.41
8.23
0.98
Positive
M274T708
(M + H)+
Val-Arg
4.45
5.92
1.33
Positive
M416T405
(M + H-H2O)+
Glycolithocholic acid
4.04
3.67
0.91
Positive
M500T341
(M + H)+
Taurochenodeoxycholate
4.03
4.25
1.05
Positive
M498T416
(M + H-H2O)+
Taurocholate
3.82
2.47
0.65
Positive
M498T178_3
(M−H)-
Taurochenodeoxycholate
48.60
69.39
1.43
Negative
M514T361
(M−H)-
Taurocholate
47
52.82
1.12
Negative
M464T460_2
(M−H)-
Glycocholic acid
29.86
20.87
0.70
Negative
M448T375
(M−H)-
Glycochenodeoxycholate
14.15
10.89
0.77
Negative
M515T123
(M−H)-
Adynerin
11.68
8.64
0.74
Negative
M163T147
(M−H)-
Benzenebutanoic acid
10.07
9.25
0.92
Negative
M143T78_2
(M−H)-
Caprylic acid
7.06
6.03
0.85
Negative
M482T74
(M−H)-
Taurolithocholic acid
5.89
8.72
1.48
Negative
M193T726
(M−H)-
D-galacturonic acid
4.63
3.86
0.83
Negative
M583T74
(M−H)-
Bilirubin
4.34
2.21
0.51
Negative
M469T78
(M−H)-
11-Keto-beta-boswellic acid
3.78
4.06
1.07
Negative
M178T357
(M−H)-
Hippuric acid
0.61
0.28
0.46
Negative
M179T107
(M−H)-
Theophylline
0.28
0.39
1.39
Negative
M409T450
(M−H)-
1-Palmitoyl Lysophosphatidic Acid
0.17
0.15
0.88
Negative
3.4 Correlation and KEGG pathway analysis of the key differentially expressed metabolites
The serum metabolite profiles were further investigated by systematic analysis of the differentially expressed metabolites by correlation analysis and clustering heatmap based on Pearson correlation analysis for determining the most strongly correlated and uncorrelated metabolite pairs. The absolute values of the correlation coefficients are indicated by different color intensities. As expected, the majority of these differentially expressed metabolites were positively correlated with each other (Fig. 4A, Fig. 4B, Supplementary Fig. 4A, Supplementary Fig. 4B, Supplementary Fig. 5A and Supplementary Fig. 5B). In particular, glycochenodeoxycholate (GCDC), glycocholic acid (GCA), and taurodeoxycholic acid (TDCA) were the most significantly correlated metabolites (Fig. 4C, Fig. 4D,Supplementary Fig. 4C, Supplementary Fig. 4D,Supplementary Fig. 5A and Supplementary Fig. 5B). For instance, in the HBV-B group, TDCA was positively correlated with GCDC (R = 0.9148, P < 0.01) and GCA (R = 0.9140, P < 0.01), and GCDC was also positively correlated with GCA (R = 0.9558, P < 0.01) in the POS mode. A similar correlation was observed in the HBV-C group. These three metabolites were primarily associated with the metabolism of BA, indicating their effects on hepatic and intestinal functions.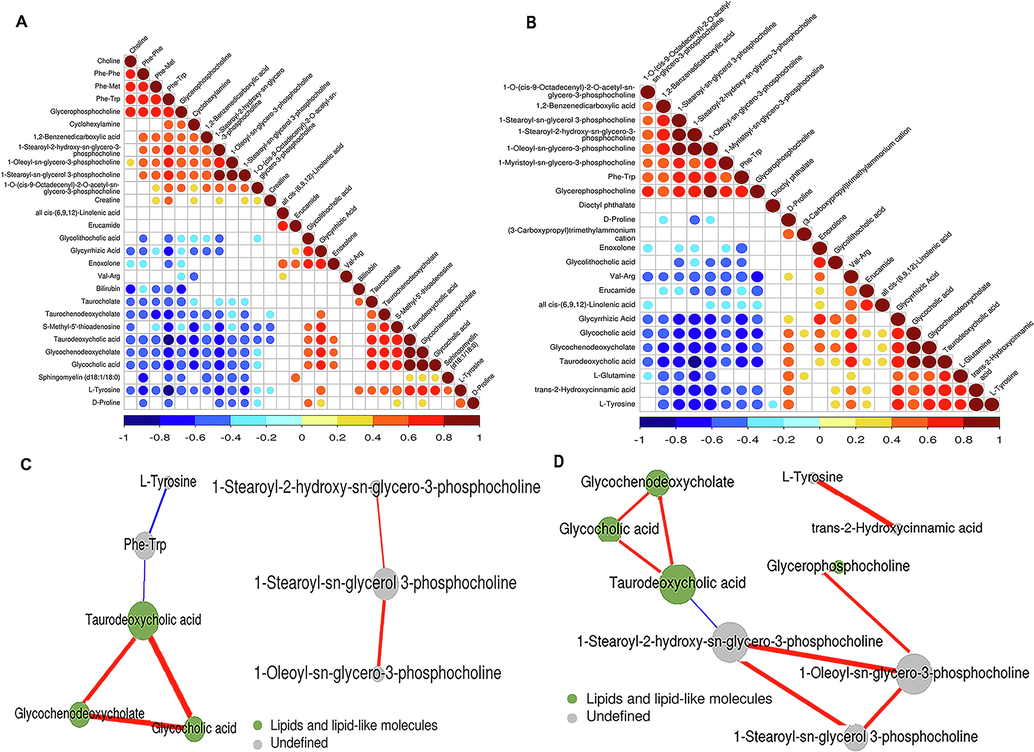
Correlation analysis of the differentially expressed metabolites in POS mode. (A) Heatmap of the results of correlation analysis of the 28 metabolites dysregulated between the serum samples of healthy controls and patients infected with HBV genotype B. (B) Heatmap depicting the results of correlation analysis of the 23 metabolites dysregulated between the serum samples of healthy controls and patients infected with HBV genotype C. (C) Predicted network of the metabolites that were differentially expressed between the serum samples of healthy controls and patients infected with HBV genotype B. (D) Predicted network of the metabolites that were differentially expressed between the serum samples of healthy controls and patients infected with HBV genotype C.
To further investigate the metabolic pathways that are differentially regulated following infection with HBV genotypes B and C, we conducted KEGG pathway-based enrichment analysis of the dysregulated metabolites. The results demonstrated that specific metabolic pathways contributed to the metabolic differences between individuals infected with HBV genotypes B and C, although some common metabolic pathways were also identified. KEGG pathway enrichment analysis demonstrated that the dysregulated metabolites in the sera of patients in the HBV-B group were mostly related to the regulation of bile secretion, cholesterol metabolism, primary BA biosynthesis, and biosynthesis of unsaturated fatty acids, while the dysregulated metabolites in the sera of patients in the HBV-C group were primarily enriched in the biosynthesis of unsaturated fatty acids, cholesterol metabolism, primary BA biosynthesis, protein digestion and absorption, bile secretion, and ABC transporters (Fig. 5A, Fig. 5B, Fig. 6A and Fig. 6B). Interestingly, all the aforementioned pathways were differentially regulated in patients infected with different HBV genotypes, and the majority of these dysregulated metabolic pathways have been reported to be tightly associated with BA metabolism pathways, including bile secretion, cholesterol metabolism, and primary BA biosynthesis. Therefore, the results of metabolic pathway analysis demonstrated that BA metabolism pathways may contribute to modulating the development of HBV-related liver diseases by regulating differentially expressed metabolites following infection with HBV genotypes B and C.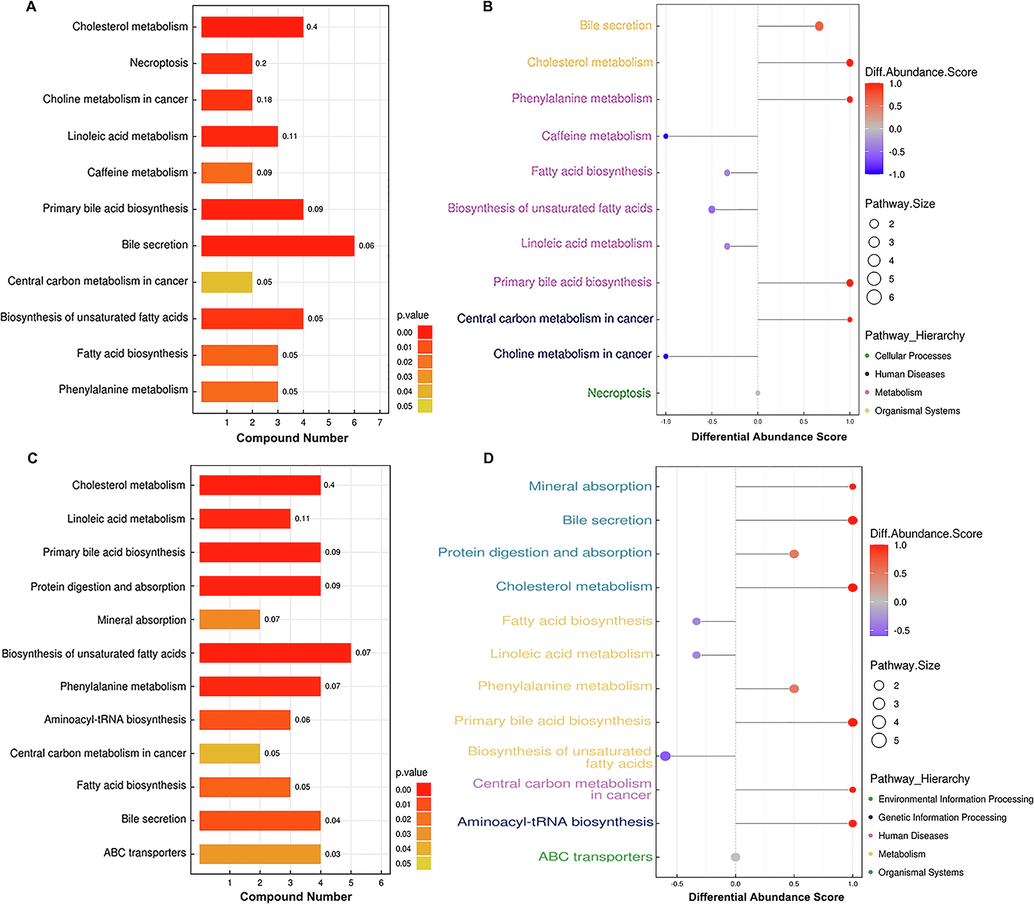
KEGG annotation of the dysregulated metabolites. (A) KEGG pathway enrichment of the differentially expressed metabolites and (B) differential abundance score map of the metabolic pathways dysregulated between healthy individuals and the HBV-B group.(C) KEGG pathway enrichment of the differentially expressed metabolites and (D) differential abundance score map of the metabolic pathways dysregulated between healthy controls and the HBV-C group.
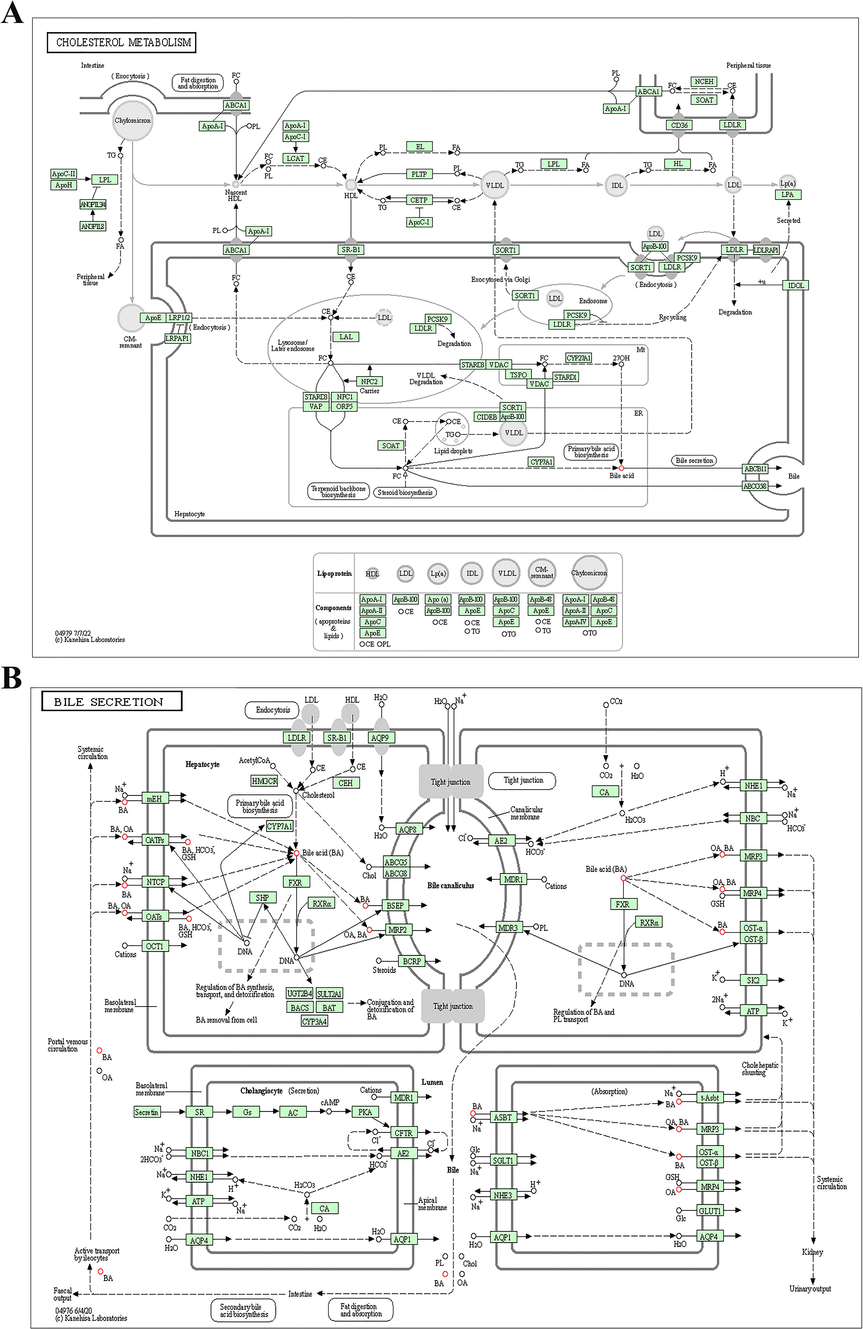
The key signaling pathways identified by analysis of the serum samples of patients infected with HBV genotypes B and C. KEGG pathway-based enrichment analysis revealed that the dysregulated metabolites were associated with (A) cholesterol metabolism and (B) bile secretion.
3.5 Targeted metabolomics analysis of BAs
The results of untargeted metabolomics analysis showed that the majority of the enriched dysregulated metabolic pathways were BA metabolism pathways. We therefore performed targeted metabolomics studies for quantifying the concentrations of various BA subspecies in the serum for obtaining complete insight into the alterations in BA metabolism. The targeted metabolomics study aimed to verify the aforementioned conjecture that the differential expression of metabolites was attributed to infection by the different HBV genotypes, B and C. A total of 24 different subspecies of BAs were identified and precisely quantified in all the serum samples (Supplementary Table 5, Fig. 7A and Fig. 7B). The BA subspecies were consistent in the serum of the HBV-B and HBV-C groups, of which glycochenodeoxycholic acid (GCDCA), glycoursodeoxycholic acid (GUDCA), taurochenodeoxycholic acid (TCDCA), taurocholic acid (TCA), and GCA were the most abundant (Fig. 7C). The concentrations of each BA varied between the HBV-B and HBV-C groups, with GCDCA and TCDCA being the most abundant in the HBV-B and HBV-C, respectively (Fig. 7C and Fig. 8). Notably, the levels of GUDCA, taurolithocholic acid (TLCA), ursodeoxycholic acid (UDCA), and TCA were significantly upregulated by 2.01-fold, 1.55-fold, 1.44-fold, and 1.36-fold, respectively, in the HBV-C group, compared to their serum levels in the HBV-B group (n = 16 patients; P < 0.01 for all metabolites), while the serum levels of apocholic acid (ApoCA) did not differ significantly between the HBV-B and HBV-C groups (Fig. 8). The total concentration of the BAs in the HBV-C group was significantly higher than that in the HBV-B group, and this finding was consistent with the results obtained by untargeted metabolomics analysis. These data indicate that patients infected with HBV genotypes B and C have different metabolic profiles owing to differences in BA metabolism.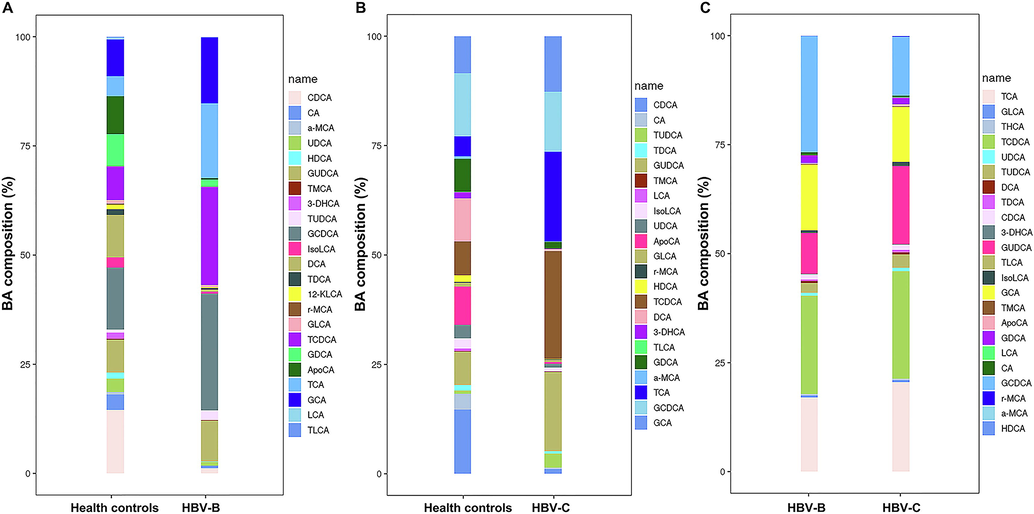
Analysis of the differentially expressed metabolites by targeted metabolomics analysis of the differential BA levels between the serum samples of (A) healthy controls and patients infected with HBV genotype B, (B) healthy controls and patients infected with HBV genotype C, and (C) patients infected with HBV genotype B and individuals infected with HBV genotype C.
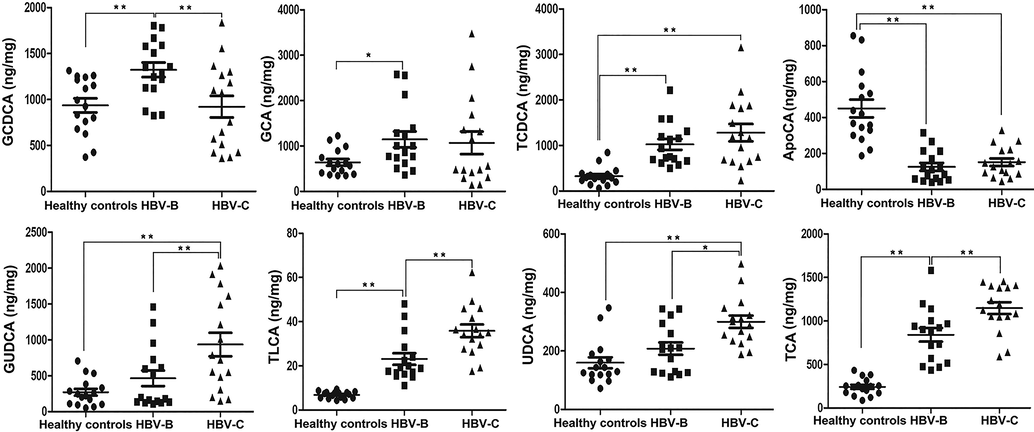
Validation of the selected differentially expressed metabolites in the serum samples from patients infected with HBV genotypes B and C by targeted metabolomics analysis of BAs in the validation cohort. The data are expressed as the mean ± standard error of the mean (SEM);n = 15, *P < 0.05, **P < 0.01.
4 Discussion
Although the rate of HBV infection has recently declined on a yearly basis, HBV infections continue to exert a heavy burden on individuals and society owing to their widespread prevalence and high incidence of morbidity and mortality from HBV-induced liver diseases (Iannacone and Guidotti, 2022,Seto et al., 2018, Huang et al., 2022). The genotypes of HBV are likely to be responsible for the differences in HBV endemicity, transmission modes, natural history, disease progression, and treatment outcomes, and therefore play a key role in liver function and metabolic alterations during the progression of HBV-induced hepatic diseases (Iannacone and Guidotti, 2022,Seto et al., 2018). The present study employed a conventional UPLC-Q-TOF MS/MS-based untargeted metabolomics approach for investigating the serum metabolomics profiles of infected patients to gain novel insights into the differential pathophysiology of HBV infections caused by genotypes B and C. This study is the first to analyze the global serum metabolic profiles of healthy controls and patients with chronic HBV infections caused by genotypes B and C determine the mechanism underlying the differences in the clinicopathological characteristics and outcomes of individuals infected with HBV genotypes B and C. The results confirm the findings of earlier studies, which reported that the genotype of HBV closely associates with the clinical manifestation and that infection with HBV genotype C can cause more severe outcomes of HBV-induced liver disease compared to genotype B. In addition, the study provides novel information regarding the metabolic differences between infections caused by HBV genotypes B and C for obtaining deeper insights into the development of HBV-induced systemic metabolic reprogramming.
The present study employed an untargeted metabolomics approach for analyzing the serum samples of three groups, namely, healthy control individuals, patients with HBV-B, and patients with HBV-C, to quantify the metabolic differences in the global serum metabolome of patients infected with different HBV genotypes. Comprehensive analysis of the dysregulated metabolites revealed significantly large metabolic changes among the healthy control, HBV-B, and HBV-C groups. The 440 metabolites identified in this study, with VIP score > 1 and P < 0.05, were common in all 54 serum samples, which indicated the stability of the experimental method and the reliability of the research results. Based on the criteria for identification of dysregulated metabolites, namely, fold change ≥± 1.5 and P < 0.05, a total of 63 metabolites (28 and 35 in POS and NEG modes, respectively) were found to be differentially expressed between the healthy controls and HBV-B group, and 57 metabolites (23 and 34 in the POS and NEG modes, respectively) were found to be dysregulated between the healthy controls and HBV-C group. Analysis of the key metabolic pathways by KEGG and MetaboAnalyst revealed that a total of 11 pathways were differentially expressed between the healthy controls and HBV-B group, while 12 pathways were dysregulated between the healthy controls and HBV-C group. Although these pathways correlated with the aforementioned dysregulated metabolites are important players in the course of infection with HBV genotypes B and C, the majority of these dysregulated metabolites were associated with relevant BA metabolism pathways, including bile secretion, cholesterol metabolism, and primary BA biosynthesis. The results demonstrated that BA metabolism pathways may contribute to the regulation of clinical characteristics and progression of HBV-related diseases caused by disorders in BA metabolism pathways during the process of infection with HBV genotypes B and C.
BAs are key signaling molecules that function as metabolic regulators of lipids and participate in glucose and energy metabolism. They belong to a family of anphipathic cholesterol metabolites that are critical for antibacterial defense, hepatic lipid and glucose metabolism, and maintenance of energy and metabolic homeostasis (Evangelakos et al., 2021, Chiang, 2013). BAs are synthesized in hepatocytes via a complex process comprising multiple factors and multiple catalytic steps that involve mitochondrial, peroxisomal, and cytosolic enzymes. BA synthesis occurs via two different well-characterized metabolic pathways, namely, the classical or neutral pathway, which is initiated by cholesterol 7α-hydroxylase (CYP7A1), followed by several enzymatic conversions, and the alternative or acidic pathway, which is triggered by sterol 27-hydroxylase (CYP27A1) to form 27-hydroxycholesterol (Evangelakos et al., 2021, Chiang, 2013,Režen et al., 2022, Perino and Schoonjans, 2022). In the context of viral infections, the activation of BA metabolism pathways initiates innate antiviral immunity and inflammation by inducing the transcription of the BA transporter gene and genes encoding the rate-limiting biosynthesis enzymes, including CYP7A1 and CYP27A1. Additionally, BA metabolism pathways are critical determinants of viral replication, antiretroviral treatment, and the development of virus-induced liver diseases (Hu et al., 2019, Appelman et al., 2021). Therefore, the results of the present study confirmed that the clinical difference in HBV infections caused by genotypes B and C strongly depends on the systemic BA homeostasis of the host, which explains the involvement of the BA signaling pathways following infection with HBV genotypes B and C.
Furthermore, targeted metabolism analysis of BAs was performed for verifying the aforementioned conjecture that infection with HBV genotypes B and C can regulate the distribution of overall metabolic dysregulation, and BA metabolism was the primary pathway targeted during HBV infections. Notably, the levels of total BAs in the serum samples of the HBV-B and HBV-C groups were significantly increased compared to those of the control group, which was consistent with the results of untargeted metabolism analysis. The findings also revealed that 8 metabolites, including GCDCA, GCA, TCDCA, ApoCA, GUDCA, TLCA, UDCA, and TCA, were dysregulated in the 3 groups, namely, the healthy control, HBV-B, and HBV-C groups. Of these differentially expressed metabolites, the level of GCDCA was significantly upregulated in the serum samples of individuals in the HBV-B group compared to that of the healthy controls and individuals in the HBV-C group. GCDCA is a BA that also functions as a biosurfactant to solubilize lipids for absorption, and itself undergoes absorption. GCDCA is the primary biliary acid that is directly derived from cholesterol in the liver and conjugates with taurine or glycine, which play crucial roles in several diseases and signaling pathways (Gao et al., 2019, Shi et al., 2020, Shao et al., 2021). It has been reported that GCDCA can enhance the invasive ability of HCC cells by activating autophagy and increasing the level of BAs via the AMPK/mTOR pathway (Gao et al., 2019). Additionally, GCDCA promotes chemoresistance in HCC cells by inducing CSC-like characteristics and the EMT phenotype, and by activating the STAT3 signaling pathway, which serves as a potential target in HCC chemotherapy (Shi et al., 2020). Therefore, abnormal levels of GCDCA pose a potential risk factor for HCC in individuals with HBV infection. The levels of GUDCA, TLCA, UDCA, and TCA were significantly higher in the serum samples of the HBV-C group than in those of the HBV-B group, and the changes in the levels of GUDCA were more significant than those of TLCA, UDCA, and TCA. The changes in the serum levels of BAs suggest some characteristic modifications in BA-related pathways between individuals infected with HBV genotype C and those infected with HBV genotype B. GUDCA is a glycine-conjugated form of UDCA, and is the main metabolite derived from the oral administration of UDCA. GUDCA is considered to have multiple biological effects, including the reduction of circulating total cholesterol and suppression of foam cell formation, in addition to having antiapoptotic, anti-inflammatory, and antioxidant effects (Shi et al., 2020, Shao et al., 2021, Huang et al., 2021). Several ex vivo studies have indicated that GUDCA prevents the bilirubin-induced production of lactate dehydrogenase (LDH) and reduction of glutathione (GSH), and reduces oxygen consumption by inducing extracellular adenosine triphosphate (ATP) release (Huang et al., 2022, Fernandes et al., 2007). Another ex vivo study showed that GUDCA prevents the bilirubin-induced production of interleukin (IL)-6, IL-1β, and tumor necrosis factor (TNF)-α (Huang et al., 2022, Brito et al., 2008). These functions could partly explain the higher levels of GUDCA in patients infected with HBV genotype C compared to those infected with genotype B. Consistent with the results of KEGG pathway analysis, previous studies have demonstrated that BA metabolism pathways are involved in hepatic cholesterol metabolism disorders and constitute one of the most important pathogenic factors for hepatic inflammation during chronic HBV infections in humans. The present study revealed that several metabolites, including GCDCA, GCA, TCDCA, ApoCA, GUDCA, TLCA, UDCA, and TCA, which are associated with these functions, were dysregulated. BA metabolism pathways may contribute to the regulation of HBV-related liver diseases by modulating the serum levels of several metabolites. Therefore, the levels of these differentially expressed metabolites might act as potential biomarkers for distinguishing between patients infected with HBV genotypes B and C. Additionally, these serum metabolite markers may also serve as potential therapeutic targets for HBV infections caused by genotypes B and C, and may aid in the prevention and control of HBV and related diseases. However, the underlying mechanism by which these metabolites regulate BA metabolism pathways remains to be elucidated, and further studies are necessary in this regard.
Altogether, the serum metabolite profiles of healthy controls and patients infected with HBV genotypes B and C were analyzed in this study. The findings revealed that BA metabolism pathways could aid in the treatment of diseases caused by HBV genotypes B and C by regulating potential metabolite biomarkers and possible therapeutic targets. However, the present study has several limitations which are described hereafter. The study only employed UPLC-Q-TOF MS/MS for analyzing a relatively small sample of patients infected with HBV genotypes B and C, and the levels of only the differentially expressed metabolites were analyzed. It is therefore necessary to validate the results obtained herein and investigate the key dysregulated metabolites by biochemical studies with large sample sizes.
5 Conclusion
Here, an UPLC-Q-TOF MS/MS-based untargeted metabolomics approach was employed for assessing the metabolic differences among the serum proteome profiles of healthy controls, patients infected with HBV genotype B, and individuals infected with HBV genotype C. Sixty-three metabolites were found to be differentially expressed between the serum samples of healthy controls and patients infected with HBV genotype B, while 57 metabolites were differentially expressed between the serum samples of healthy controls and patients infected with HBV genotype C. KEGG pathway enrichment analysis indicated that the differentially expressed metabolites in the serum of patients in the HBV-B group were mostly involved in the regulation of bile secretion, cholesterol metabolism and primary BA biosynthesis, while those in the serum of patients in the HBV-C group primarily participated in the biosynthesis of unsaturated fatty acids, cholesterol metabolism, primary BA biosynthesis, protein digestion and absorption and bile secretion. As expected, the results revealed that the individuals infected with HBV genotypes B and C had distinct serum metabolic fingerprints, suggesting that the two genotypes of HBV have different effects on cellular metabolism. The results were further verified by targeted metabolomics analyses, in which the differences in the BA metabolism pathways of patients infected with genotypes B and C were investigated. Although quantitative metabolomics analysis mostly provided descriptive results, altogether, the results reveal new insights into the metabolic differences between patients infected with HBV genotypes B and C. The study also suggests that the dysregulated metabolites associated with BA metabolism pathways, including GCDCA, GCA, TCDCA, ApoCA, GUDCA, TLCA, UDCA, and TCA, could serve as potential biomarkers for distinguishing between patients infected with HBV genotype B and C.
6 Funding support statement
This work was supported by Jiaxing Key Laboratory of Virus-related Infectious Disease, Zhejiang Provincial Medical Scientific Research Foundation of China under Grant No. 2021KY1108, Zhejiang Provincial Natural Science Foundation of China under Grant No. LY20C010004, 2023 Jiaxing Key Discipiline of Medcine-Lemology (Supporting Subject, Grant No. 2023-ZC-009).
7 Ethics approval statement
The projects involving human serum samples were reviewed and approved by the ethics committee of the Affiliated Hospital of Jiaxing University (LS2019-327). The informed consents were received from all patients/participants in this study.
Author contribution
Dahai Wei and FanchunFu made substantial contributions to conceive and design of the experiments. Min Deng and MingkaiTong performed most of the experiments. Min Deng collected the samples and analyzed the data. Dahai Wei drafted the manuscripts. All authors reviewed and approved the final manuscript.
Declaration of Competing Interest
The authors declare that they have no known competingfinancial interests or personal relationships that could haveappeared to influence the work reported in this paper.
References
- Host and viral genetic variation in HBV-related hepatocellular carcinoma. Front. Genet.. 2018;9:261.
- [Google Scholar]
- Molecular regulation of the hepatic bile acid uptake transporter and HBV entry receptor NTCP. Biochim. Biophys. Acta Mol. Cell Biol. Lipids. 2021;1866(8):158960
- [Google Scholar]
- A recent prevalence of Hepatitis B Virus (HBV) genotypes and subtypes in Asia: A systematic review and meta-analysis. Healthcare (Basel). 2023;11(7):1011.
- [Google Scholar]
- Bilirubin injury to neurons: contribution of oxidative stress and rescue by glycoursodeoxycholic acid. Neurotoxicology. 2008;29(2):259-269.
- [Google Scholar]
- High viral load and hepatitis B virus subgenotypece are associated with increased risk of hepatocellular carcinoma. J. Clin. Oncol.. 2008;26(2):177-182.
- [Google Scholar]
- Hepatitis B virus genotype C is associated with more severe liver fibrosis than genotype B. Clin. Gastroenterol. Hepatol.. 2009;7(12):1361-1366.
- [Google Scholar]
- Comparative analysis of serum proteins between Hepatitis B Virus genotypes B and C infection by DIA-based quantitative proteomics. Infect Drug Resist.. 2021;14:4701-4715.
- [Google Scholar]
- rt269L-Type hepatitis B virus (HBV) in genotype C infection leads to improved mitochondrial dynamics via the PERK-eIF2α-ATF4 axis in an HBx protein-dependent manner. Cell Mol. Biol. Lett.. 2023;28(1):26.
- [Google Scholar]
- Molecular and genetic characterization of Hepatitis B Virus (HBV) among Saudi chronically HBV-infected individuals. Viruses. 2023;15(2):458.
- [Google Scholar]
- Role of bile acids in inflammatory liver diseases. Semin. Immunopathol.. 2021;43(4):577-590.
- [Google Scholar]
- Glycoursodeoxycholic acid and interleukin-10 modulate the reactivity of rat cortical astrocytes to unconjugated bilirubin. J. Neuropathol. Exp. Neurol.. 2007;66(9):789-798.
- [Google Scholar]
- Glycochenodeoxycholate promotes hepatocellular carcinoma invasion and migration by AMPK/mTOR dependent autophagy activation. Cancer Lett.. 2019;454:215-223.
- [Google Scholar]
- Geneva: World Health Organization., 2022. Hepatitis, B: key facts. 24 June, 2022. (https://www.who.int/en/news-room/fact-sheets/detail/hepatitis-b).
- Factors predicting occurrence and prognosis of hepatitis-B-virus-related hepatocellular carcinoma. World J. Gastroenterol.. 2011;17(38):4258-4270.
- [Google Scholar]
- Virus-induced accumulation of intracellular bile acids activates the TGR5-β-arrestin-SRC axis to enable innate antiviral immunity. Cell Res.. 2019;29(3):193-205.
- [Google Scholar]
- Glycoursodeoxycholic acid ameliorates atherosclerosis and alters gut microbiota in Apolipoprotein E-deficient mice. J. Am. Heart Assoc.. 2021;10(7):e019820.
- [Google Scholar]
- ARFIP2 regulates EMT and autophagy in hepatocellular carcinoma in part through the PI3K/Akt signalling pathway. J. Hepatocell. Carcinoma. 2022;9:1323-1339.
- [Google Scholar]
- From dried bear bile to molecular investigation: A systematic review of the effect of bile acids on cell apoptosis, oxidative stress and inflammation in the brain, across pre-clinical models of neurological, neurodegenerative and neuropsychiatric disorders. Brain Behav. Immun.. 2022;99:132-146.
- [Google Scholar]
- Immunobiology and pathogenesis of hepatitis B virus infection. Nat. Rev. Immunol.. 2022;22(1):19-32.
- [Google Scholar]
- The metabolomics approach revealed a distinctive metabolomics pattern associated with hyperthyroidism treatment. Front. Endocrinol. (Lausanne). 2022;13:1050201.
- [Google Scholar]
- Hepatitis B genotypes correlate with clinical outcomes in patients with chronic hepatitis B. Gastroenterology. 2000;118(3):554-559.
- [Google Scholar]
- Basal core promoter mutations of hepatitis B virus increase the risk of hepatocellular carcinoma in hepatitis B carriers. Gastroenterology. 2003;124(2):327-334.
- [Google Scholar]
- HBV-Induced Increased N6 Methyladenosine Modification of PTEN RNA Affects Innate Immunity and Contributes to HCC. Hepatology. 2021;73(2):533-547.
- [Google Scholar]
- Single cell metabolomics: A future tool to unmask cellular heterogeneity and virus-host interaction in context of emerging viral diseases. Front. Microbiol.. 2020;11:1152.
- [Google Scholar]
- Metabolomics approach to understand the Hepatitis C Virus induced hepatocellular carcinoma using LC-ESI-MS/MS. Arab. J. Chem.. 2021;14:102907
- [Google Scholar]
- Transcriptome-wide analysis of Hepatitis B Virus-mediated changes to normal hepatocyte gene expression. PLoS Pathog.. 2016;12(2):e1005438.
- [Google Scholar]
- Clinical isolates of hepatitis B virus genotype C have higher in vitro transmission efficiency than genotype B isolates. J. Med. Virol.. 2023;95(6):e28879.
- [Google Scholar]
- Clinicopathological differences between hepatitis B viral genotype B- and C-related resectable hepatocellular carcinoma. J. Viral. Hepat.. 2007;14(1):64-69.
- [Google Scholar]
- Natural history of acute and chronic hepatitis B: The role of HBV genotypes and mutants. Best Pract. Res. Clin. Gastroenterol.. 2017;31(3):249-255.
- [Google Scholar]
- Countdown to 2030: eliminating hepatitis B disease, China. Bull. World Health Organ.. 2019;97(3):230-238.
- [Google Scholar]
- Metabolomics and metabolic diseases: Where do we stand? Cell Metab.. 2017;25(1):43-56.
- [Google Scholar]
- Palak,P.K., Parikh N.H., Mahalakshmi, B., Ranch, K.M., Sai,Boddu, S.H., Babu, R.J., Tiwari,A.K., 2023. Developments in small molecule antiviral drugs against hepatitis B and C viruses: FDA approved therapies and new drugs in clinical trials. Arabian Journal of Chemistry, 16 (8), 105013
- Maternal bile acid profile and subtype analysis of intrahepatic cholestasis of pregnancy. Orphanet. J. Rare Dis.. 2021;16(1):259.
- [Google Scholar]
- Glycochenodeoxycholic acid induces stemness and chemoresistance via the STAT3 signaling pathway in hepatocellular carcinoma cells. Aging (Albany NY). 2020;12(15):15546-15555.
- [Google Scholar]
- Hepatitis B virus genotypes: epidemiological and clinical relevance in Asia. Hepatol. Int.. 2016;10(6):854-860.
- [Google Scholar]
- Overview of hepatitis B viral replication and genetic variability. J. Hepatol.. 2016;64(1 Suppl):S4-S16.
- [Google Scholar]
- Evaluation of the chronic intoxication of fluoride on human serum metabolome using untargeted metabolomics. Arab. J. Chem.. 2022;15(7):103928
- [Google Scholar]
- Metabolomics-based discovery of small molecule biomarkers in serum associated with dengue virus infections and disease outcomes. PLoS Negl. Trop. Dis.. 2016;10(2):e0004449.
- [Google Scholar]
- Targeted metabolomics analysis of bile acids and cell biology studies reveal the critical role of glycodeoxycholic acid in buffalo follicular atresia. J. Steroid Biochem. Mol. Biol.. 2022;221:106115
- [Google Scholar]
- A new trend of genotype distribution of hepatitis B virus infection in southeast China (Fujian), 2006–2013. Epidemiol. Infect.. 2015;143(13):2822-2826.
- [Google Scholar]
- Proteome differences between Hepatitis B Virus Genotype-B- and Genotype-C-induced hepatocellular carcinoma revealed by iTRAQ-based quantitative proteomics. J. Proteome Res.. 2016;15(2):487-498.
- [Google Scholar]
- Post-translational modification control of HBV biological processes. Front. Microbiol.. 2018;9:2661.
- [Google Scholar]
- Yuen, M.F., Chen, D.S., Dusheiko, G.M., Janssen, H.L.A., Lau, D.T.Y., Locarnini, S.A., Peters, M.G., La,i C.L.. 2018. Hepatitis B virus infection. Nat Rev Dis Primers. 4, 18035.
- Difference in T helper responses during hepatitis flares in hepatitis B e antigen (HBeAg)-positive patients with genotypes B and C: implication for early HBeAg seroconversion. J. Viral Hepat.. 2007;14(4):269-275.
- [Google Scholar]
- Host epigenetic alterations and Hepatitis B Virus-associated hepatocellular carcinoma. J. Clin. Med.. 2021;10(8):1715.
- [Google Scholar]
- Based on 1H NMR and LC-MS metabolomics reveals biomarkers with neuroprotective effects in multi-parts ginseng powder. Arab. J. Chem.. 2023;16(7):104840
- [Google Scholar]
- Hepatitis B virus rigs the cellular metabolome to avoid innate immune recognition. Nat. Commun.. 2021;12(1):98.
- [Google Scholar]
Appendix A
Supplementary material
Supplementary data to this article can be found online at https://doi.org/10.1016/j.arabjc.2023.105155.
Appendix A
Supplementary material
The following are the Supplementary data to this article:Supplementary data 1
Supplementary data 1
Supplementary data 2
Supplementary data 2


