

Translate this page into:
Comparison analysis of bioactive constituents and heavy metals among original plants of Kuding tea from the genus Ilex
⁎Corresponding authors at: Jiangxi Provincial Key Laboratory of Natural Active Pharmaceutical Constituents, College of Chemical and Biological Engineering, Yichun University, Xuefu Road No. 576, Yuanzhou District, Yichun 336000, China. yanglingguangxdjqz@163.com (Lingguang Yang), happy62889@126.com (Peipei Yin)
-
Received: ,
Accepted: ,
This article was originally published by Elsevier and was migrated to Scientific Scholar after the change of Publisher.
Abstract
Kuding tea (KT) is the general name of a set of bitter-tasting herbal tea made from varied original plant species. However, limited information was reported about the difference of bioactive constituents, heavy metals, and bioactivities among those original species. In the present study, comparison analyses among heavy metals, polysaccharides, phenolics, flavonoids, and saponins constituents, as well as the antioxidant and antidiabetic activities were performed through colorimetry, UPLC-QTOF-MS, enzymatic assay and molecular docking techniques on the six KT original plants mainly from the genus Ilex. Results showed that Cd contents in the four KT original plants other than Ilex pubescens (IP) and Ilex cornuta (IC) and heavy metal contents including Pb, Cu, As and Hg in the all six plants were lower than standard limit values. Furthermore, contents of carbohydrate in polysaccharides (470.06 and 548.51 mg GLE/g), total phenolics (33.84 and 48.85 mg GAE/g), flavonoids (30.86 and 109.97 mg RE/g), phenolic acids (49.68 and 61.48 mg CAE/g), flavonols (18.47 and 19.19 mg RE/g), flavanols (0.18 and 0.14 mg CE/g), saponins (90.81 and 97.33 mg GSE /g) in IP and Ligustrum japonicum (LJ), as well as their antioxidant activity levels (IC50 607.41–780.44, and 547.06–754.00 mg/L) were all significantly higher than those in other four KT original plants. Moreover, a total of 6 and 9 compounds were tentatively characterized from IP and LJ, respectively, and molecular docking and molecular dynamics simulation were further used to analysis the interaction between α-glucosidase and bioactive compounds in IP. At last, principal component, hierarchical cluster, and correlation analysis indicated that carbohydrate content of polysaccharides, total phenols, flavonoids and phenolic acids were the main influencing factors to antioxidant abilities. Overall, according to our systematic analysis, IP possessed the highest antioxidant and antidiabetic potentials, thus might be a better KT original plants from the genus Ilex for further development and utilization.
Keywords
Kuding tea
Heavy metals
Phenolics
Polysaccharide
Antioxidant
Antidiabetic

- KT
-
kuding tea
- IL
-
Ilex latifolia Thunb
- ID
-
Ilex dabieshasnensis K. Yao et M. P. Deng
- IP
-
Ilex pubescens Hook. et Arn.
- IC
-
Ilex cornuta var. fortune
- LJ
-
Ligustrum japonicum Thunb.
- DPPH
-
1,1-diphenyl-2-picrylhydrazyl
- ABTS
-
2,20-Azinobis-(3-ethylbenzthiazoline-6-sulfonate)
- pNPG
-
p-nitrophenol-β-D-glucuronide
- HPLC
-
high performance liquid chromatography
- UPLC-QTOF-MS/MS
-
ultra-performance liquid chromatography/quadrupole time-of-flight-tandem mass spectrometry
- ICP-MS
-
inductively coupled plasma-mass spectrometry
- BSA
-
bovine serum albumin
- r/min
-
revolutions per minute
- FRAP
-
Ferric reducing antioxidant power
- AUC
-
area under the curve
- PDB
-
protein database bank
- SD
-
standard deviation
- ANOVA
-
one way analysis of variance
- RT
-
retention time
- CQA
-
chlorogenic acid
- 3
-
4-di-CQA, Isochlorogenic acid B
- 3
-
5-di-CQA, Isochlorogenic acid A
- 4
-
5-di-CQA, Isochlorogenic acid C
- 3,4,5-tri-CQA
-
3,4,5-Tricaffeoylquinic acid
- PCA
-
perform principal component
- HCA
-
hierarchical cluster analysis
Abbreviations
Data availability
Data will be made available on request.
1 Introduction
Tea beverage is the second most consumed drink worldwide only after water (Novotny and Baer 2013). While tea is traditionally made of the leaves of Camellia sinensis, a number of herbal parts of other plants are also used to be brewed with boiling water, consisting of a category named as Non-camellia tea (Long et al., 2014). Non-Camellia tea has a long consumption history all over the world, and is prevalent for the unique flavor and potential healthy benefit. Among those non-camellia tea, Kuding tea (also named as Ku-ding-cha) is one of the most famous and commonly consumed categories in China.
Kuding tea (KT) is the general name of a set of bitter-tasting herbal tea, whose original plants consisted of about 12 species, and widely distributed in China and Southeastern Asian countries (He et al., 2003, Zheng et al., 2009). Among those original plants, most species belong to the genus Ilex or the genus Ligustrum. In the markets, KT from the genus Ilex such as Ilex latifolia Thunb and Ilex kudingcha C.J. Tseng are assigned as “Large-Leaves-Kuding Tea”, while those from the genus Ligustrum such as Ligustrum robustum (Roxb.) Blum are commonly called “Small-Leaves-Kuding Tea” according to the size and shape of the products (Wupper et al., 2020).
Genus Ilex is widely distributed across most non-tropical regions, comprising more than 600 species (Gan et al., 2018). Among which, a number of species were made into Non-camellia tea distributing all over the world. Other than KT, the well-known Yerba Mate is made of Ilex paraguariensis A. St.-Hil (Konieczynski et al., 2017), Yaupon Holly is made of Ilex vomitoria (Palumbo et al., 2009), and Guayusa is made of Ilex guayusa Loes (Pardau et al., 2017). These traditional drinks originate from the genus Ilex, attracting attention due to their diverse health benefits, which highlight the rationality behind “Large-Leaves-Kuding Tea”.
Although many constituents including phenolic acids and triterpenoids have been identified in KT, and their bioactivities such as antioxidant (Liu et al., 2009), anti-obesity (Wu et al., 2020a), anti-inflammatory (Kakumu et al., 2022), anti-cancer (Zhu et al., 2014), modulating gut microbiota (Wan et al., 2019), and lowering lipid levels (Feng et al., 2015) have been characterized. To date, most studies focused on the isolation and characterization of bioactive compounds from certain original plant or product of KT. And several studies have compared the differences among various original species, but these have been limited by the small number of species examined or the absence of systematic comparisons (Zhu et al., 2009, Li et al., 2012). Contents of total phenolics and flavonoids, antioxidant activities determined by DPPH and ABTS method, and antidiabetic activities determined by α-glucosidase inhibition are often used for the comparison among plant species (Sytar et al., 2018).
Identification of non-camellia tea by morphological features is difficult, particularly dried and processed commercial products made by plants from related species such as KT, which further highlighted the importance for the comparison of their phytochemical profiles and bioactivities. Overall, the present study aimed to systematically conduct comparison of heavy metals and bioactive constituents among various original species of KT from the genus Ilex. These results would provide guiding information for both KT manufacturers and consumers.
2 Materials and methods
2.1 Plant materials and chemicals
Fresh leaf samples of six original plants of KT (Ilex latifolia Thunb., Ilex dabieshanensis K. Yao & M. B. Deng, Ilex pubescens Hook. et Arn., Ilex cornuta Lindl. & Paxton, Ilex cornuta var. fortune and Ligustrum japonicum Thunb.) were collected as shown in Table 1. Briefly, three shrubs of each original species with similar growing ages and conditions were selected as biological repetitions. Fresh leaves were averagely collected from the top, middle, and bottom region from each plant from the four directions. All the leaves were washed with distilled water, air-dried to constant weight, ground and passed through a 50-mesh sieve, and stored at −20 °C in a ziplock bag for further use.
Local commodity name
Collecting location
Collecting time
Original plant
Abbreviations
Large-Leaf-Kuding-Tea
Nanjing, Jiangsu
2022.9.5
Ilex latifolia Thunb.
IL
Nanjing, Jiangsu
2022.9.5
Ilex dabieshasnensis K. Yao et M. P. Deng
ID
Chenzhou, Hunan
2022.8.23
Ilex pubescens Hook. et Arn.
IP
Yongzhou, Hunan
2022.8.27
Ilex cornuta Lindl.& Paxton
IC
Tianjin
2022.8.24
Ilex cornuta var. fortune
ICV
Small-Leaf-Kuding-Tea
Tianjin
2022.8.24
Ligustrum japonicum Thunb.
LJ
Vanillin, caffeic acid, acarbose, and DPPH (1,1-diphenyl-2-picrylhydrazyl) were purchased from Aladdin (Shangha,i China). Gallic acid, Folin-Ciocalteu, ginsenoside Re, rutin, ABTS [2,20-Azinobis-(3-ethylbenzthiazoline-6-sulfonate)], α-glucosidase and pNPG (p-nitrophenol-β-D-glucuronide) were purchased from Shanghai Yuanye (Shanghai, China). Acetonitrile and methanol used for HPLC (high performance liquid chromatography) and UPLC-QTOF-MS/MS (ultra-performance liquid chromatography/quadrupole time-of-flight-tandem mass spectrometry) were chromatographic grade and purchased from Sigma–Aldrich Chemical (St. Louis, MO, USA). All other reagents were of analytical reagent grade.
2.2 Identification and quantification of heavy metals
Heavy metal elements analysis was conducted on an inductively coupled plasma-mass spectrometry (ICP-MS) (Thermo-X7, Thermo Fisher Scientific, USA). Briefly, 200 mg ground powder from different KT original plants were hydrolyzed with 8 mL nitric acid and 2 mL hydrogen peroxide (30 %, v/v) in a polytetrafluorethylene digestion vessel overnight, respectively. Then the mixtures were digested with heating plate (Labtech, EH45A plus, USA) until the solutions were transparent and colorless. After cooling to room temperature, the digested solution was diluted to the desired concentrations with the total volume of 10 mL. A portion of the diluted solution was used for determination of 65Cu, 75As, 111Cd and 208Pb directly. Mercaptoethanol was added to the other part of diluted solution for the analysis of 202Hg. The total concentrations of heavy metals in digested samples and blanks were determined by ICP-MS.
2.3 Measurement of polysaccharide composition
2.3.1 Preparation of crude polysaccharides
Polysaccharides from six original species of KT were prepared according to the previous method (Liu et al., 2023) with some modifications. Briefly, for each sample, 625 mL ethanol solutions (95 %, v/v) were added to 25 g ground powders to remove the phenols, pigments and other small molecular weight impurity. After filtration, the supernatants were discarded and the residues were extracted two more times, and the remaining residues were collected for subsequent lyophilization. The lyophilized residues were extracted thrice with a 25-fold volume of hot water (80 °C) for 50 min and the supernatants of three times were pooled. The combined supernatants were concentrated to a tenth of its original volume by rotary evaporation. After cooling to room temperature, the extracts were mixed with a 4-fold volume of ethanol solution (95 %, v/v) respectively, and stood overnight to precipitate the polysaccharides. The precipitants were re-dissolved with distilled water and deproteinized thrice using Sevage method. After precipitated again with ethanol solution (95 %, v/v), the polysaccharides were washed twice with ethanol, acetone and ether, respectively, to remove polyphenols and other small molecules. Finally, vacuum freeze-drying was used to get six crude polysaccharides samples.
2.3.2 Determination of carbohydrates, proteins and uronic acid contents
The contents of carbohydrates in six crude polysaccharides samples were determined by phenol–sulfuric acid method (Fan et al., 2014) with some modifications. In brief, 180 μL of appropriately diluted solution of crude polysaccharides were mixed with 90 μL phenol (6 %, v/v) and 450 μL sulfuric acid. After incubated at 90 °C for 15 min, the absorbance measurement was read at 490 nm with a microplate reader (Tecan infinite 200, Swiss). The results were expressed as glucose equivalents from the calibration curve of glucose standard solutions (10–200 mg/L) and expressed as mg of glucose equivalents per gram of polysaccharides.
The contents of proteins were measured using Bradford method with bovine serum albumin as the standard (Wei and Zhang 2023). Briefly, 40 μL of appropriately diluted solution of crude polysaccharides and bovine serum albumin (10–100 mg/L) were reacted with 200 μL Coomassie brilliant blue solution for 2 min at room temperature. Subsequently, the absorbance measurement was read at 595 nm by using the microplate reader. All determinations were conducted in triplicate and the results were expressed as equivalent of mg bovine serum albumin (BSA) per gram of a sample.
Uronic acid content was analyzed by m-hydroxydiphenyl method using glucuronic acid as the standard (Kumar and Kumar 2017) with some modifications. 200 μL crude polysaccharide solution or glucuronic acid (10–60 mg/L) were mixed with 1 mL of 12.5 mmol/L sodium tetraborate dissolved in sulfuric acid. After a 5-min incubation in boiling water and cooling down to room temperature, 20 μL m-hydroxydiphenyl was added to the mixtures. Subsequently, the absorbance measurement was read at 524 nm with the microplate reader. The results were expressed as equivalent of mg glucuronic acid per gram of a sample.
2.4 Measurement of phenolic and saponin composition
2.4.1 Preparation of phenolic and saponins extracts
3 mL ethanol solution (50 %, v/v) was added to 1 g ground powder of samples of KT. The mixture was extracted at 40 °C for 30 min using ultrasonic extraction. After cooling to room temperature, the extract was centrifuged at 8000 r/min (revolutions per minute) for 10 min and the residue was re-extracted twice as described above. The supernatants were pooled and diluted to a final volume of 60 mL to obtain six extract solutions, which were then analyzed for their phenolic and saponin constituents. Then, the supernatant was filtered through a 0.22-μm membrane before UPLC-QTOF-MS/MS analysis
2.4.2 Determination of total phenolics, flavonoids, phenolic acids, flavonols, flavanols and saponins
The contents of total phenolics and flavonoids were performed according to our previous study (Yin et al., 2019).
Total phenolic acids was determined based on the method of Mihailović et al., (2016) with minor modifications. In brief, 50 μL standard (caffeic acid 0–750 mg/L), samples or blank was mixed with the same volumes of Arnow reagent (10 % w/v of sodium nitrite and 10 % w/v sodium molybdate), 50 μL HCl (0.5 M), 50 μL NaOH (1 M) and 50 μL distilled water in the designated well of a 96-well microplate. The absorbances were measured immediately at 490 nm.
The content of total flavonols was assessed as reported by Oyedeji-Amusa and Ashafa (2019) with some modifications. Briefly, 40 μL standard (rutin 10–100 mg/L), samples or blank was mixed with 40 μL AlCl3 (20 g/L) and 120 μL sodium acetate (50 g/L). After incubation for 2.5 h at 20 ℃, the absorbance was read at 440 nm by using the 96-well plate reader.
The content of flavanols was estimated as described by Ramos-Escudero et al., (2012). In short, 40 μL of appropriately diluted sample solutions or standard (catechin 1–25 mg/L) were mixed with 200 μL 4-(dimethylamino) cinnamaldehyde and stirred strongly for 10 min. Finally, the mixtures were read at 640 nm with a 96-well plate reader.
The Vanillin-Sulfuric acid color method was used to determine the content of saponins (Kamyab et al., 2020). In brief, 160 μL standard (ginsenoside Re), appropriately diluted solution of the KT extract or blank was mixed with 200 μL of the prepared vanillin solution in the corresponding tube, and then the tubes were incubated for 10 min at 60 ℃ after addition of 1 mL sulfuric acid (77 % v/v). The tubes were then cooled with ice water and stood at room temperature for 15 min. The absorbances were measured immediately at 535 nm. Results were expressed as ginsenoside Re equivalents from the calibration curve of ginsenoside Re standard solution (0–1000 mg/L).
2.5 Determination of antioxidant activities
2.5.1 DPPH• scavenging activity
DPPH▪ (1,1-diphenyl-2-picryl hydrazyl) free radical scavenging activities of KT samples were determined as our previous study (Yin et al., 2019). In brief, 10 μL of sample solution were mixed with 40 μL DPPH▪ solutions and 190 μL methanol in the corresponding wells. After incubated at room temperature for 30 min, the microplate reader was used to determine the absorbance at 517 nm. Trolox (10–400 mg/L) was used as the standard.
2.5.2 ABTS▪+ radical scavenging activity
ABTS radical cation (ABTS▪+) scavenging capacities of KT samples were analyzed based on our previous study (Yin et al., 2019). After ABTS▪+ working solution was prepared (absorbance at 734 nm was 0.70 ± 0.02), 200 μL of ABTS▪+ working solution was mixed with 5 μL of sample, Trolox or blank (distilled water) in the corresponding wells. The absorbance was read at 734 nm after incubation at 30 ℃ for 5 min.
2.5.3 Ferric reducing antioxidant power (FRAP)
The reducing power was determined according to the methods of our previous study (Yin et al., 2019). In short, 0.4 mL of samples were mixed with 1 mL of phosphate buffer and 1 mL of potassium ferricyanide (1 %, w/v). After incubated at 50 ℃ for 20 min, 0.5 mL of trichloroacetic acid was added. Subsequently, 1 mL of the mixture was mixed with 1 mL of distilled water and 0.2 mL of ferric chloride (0.1 %, w/v) and the absorbance was measured at 700 nm with an ultraviolet spectrophotometer (Shimadzu, Kyoto, Japan).
2.6 Determination of α-glucosidase inhibitory activity
The α-glucosidase inhibitory activity was determined using pNPG as the substrate according to our previous study (Yin et al., 2018). The basic principle is that pNPG is a compound that can be hydrolyzed by α-glucosidase into glucose and p-nitrophenol, with the concentration of p-nitrophenol could be determined by colorimetry at 405 nm. Briefly, 10 μL α-glucosidase, 100 μL different concentrations of a sample, phosphate buffer (negative control) or acarbose (positive control) and 60 μL phosphate buffer were mixed in the corresponding well. After incubated at 37 ℃ for 10 min, 30 μL pNPG (2 mM) was added quickly to activate the reaction and monitored at 405 nm every 15 min for 2 h with a 96-well microplate reader. The α-glucosidase inhibitory activity was calculated as follows: inhibitory activity(%) = (An-Ai)/An × 100, in which An is the net area under the curve (AUC) of negative control, and Ai is AUC of inhibitor, including samples and acarbose.
2.7 UPLC-QTOF-MS/MS analyses
The UPLC-QTOF-MS/MS analysis of KT was carried out on an Agilent 1290 infinity UPLC system coupled with an Agilent 6545 quadrupole time-of-flight mass spectrometer (Agilent Technologies, Santa Clara, USA). A Agilent Poroshell 120 EC-C18 column (50 mm × 2.1 mm, 1.9 μm) was used for separation, and the column temperature was set at 40 °C. The mobile phase was consisted of water with 0.4 % formic acid (v:v) (A) and acetonitrile (B) under the following gradient program: 0–1 min, 10 % B; 1–5 min, 10–20 % B; 5–15 min, 20–30 % B; 15–30 min, 30–48 % B; 30–40 min, 48–90 % B; and 40–45 min, 90–10 % for IP, and 0–5 min, 20 % B; 5–15 min, 20–30 % B; 15–30 min, 30–48 % B; 30–40 min, 48–90 % B; and 40–45 min, 90–20 % B for LJ. The flow rate was set at 0.3 mL/min with an injection volume of 2 μL.
Mass spectra were recorded in the range of m/z 100–1700 and MS experiments were performed both in positive and negative ionization mode under the following conditions: drying gas (N2) temperature, 320 °C; drying gas (N2) flow rate, 8.0 L/min; sheath gas (N2) temperature, 350 °C; sheath gas (N2) flow rate, 11 L/min; nebulizer gas pressure, 35 psi; fragmentor voltage, 175 V; capillary voltage, 3500 V; and collision energy, 40 eV. Data acquisition was performed on Agilent MassHunter Workstation (Agilent Technologies, Santa Clara, CA, USA). Peak identification was performed by comparing the mass spectra and fragmentation ions with data from reported literatures.
2.8 Molecular docking and binding affinity calculation
Structure of Saccharomyces cerevisiae α-glucosidase (PDB code: 3a4a) was downloaded from Protein Data Bank (Berman et al., 2000). Water and organics in α-glucosidase molecule were first removed using PyMOL (Seeliger and de Groot 2010), and the hydrogen atoms were then added and the docking grid box was constructed at the active site of α-glucosidase using AutoDockTools (Trott and Olson 2010). Meanwhile, the 2D structures of chlorogenic acid (CQA), 3,5-di-CQA, 3,4,5-tri-CQA, and ilexsaponin A1 were downloaded from PubChem (Kim et al., 2021) and converted into 3D structures using Chem3D (version 21.0.0.28) through minimizing the structural energy. Chlorogenic acid, 3,5-di-CQA, 3,4,5-tri-CQA, and ilexsaponin A1 were used as ligands and α-glucosidase were used as receptors for molecular docking, which was performed with AutoDockTools (Version 1.5.6) and AutoDock Vina (Version 4.2), and the interactions were analyzed through PyMOL (version 2.4.1) and Discovery Studio Visualizer (version 4.5), and the combined structure with the lowest docking energy in the output results was presented.
2.9 Molecular dynamics simulation
The docking results with the lowest free binding energy from the previous AutoDock Vina was subjected to a 50 ns molecular dynamics simulation via GROMACS 2023.2. Coordinate and topology files of the ligands and proteins were prepared separately to provide the input files for the subsequent simulation. Then, the 3,4,5-tri-CQA-α-glucosidase and ilexsaponin A1-α-glucosidase complex was encircled within a dodecahedron box, and counter ions were employed to neutralize the system charge. After minimizing the energy, the system was subjected to a 50 ns MD simulation at 303.15 K. Finally, the result was subjected to analysis using GROMACS 2023.2, and the interactions between the proteins and ligands were compared based on their root-mean-square deviation (RMSD), root-mean-square fluctuation (RMSF), gyration radius (Rg), solvent accessible surface area (SASA), hydrogen bonds, binding free energy values, and free energy landscape (FEL).
2.10 Statistical analysis
Data were presented as mean ± standard deviation (SD) of three biological repetitions. The statistical significance was evaluated by one way analysis of variance (ANOVA) followed by the Duncan’s multiple-range tests using SPSS for Windows (Version 22.0, SPSS Inc., Chicago, IL, USA). P values (<0.05, 0.01) were set to be significant and highly significant. The correlations were analyzed using SPSS for Windows (Version 22.0, SPSS Inc., Chicago, IL, USA) and were calculated using the correlation coefficient statistical option in the Pearson test.
3 Results and discussion
3.1 Heavy metal contents among varied original plants of KT
The presence of heavy metals in the tea beverage product could cause potential health risks. It is known that the concentrations of heavy metals among varied plants could be different due to plant intrinsic factors, as well as the extrinsic factor such as geographical areas, environmental conditions, use of fertilizers, harvest time and other conditions (Gomes et al., 2019). Thus, heavy metal contents of KT original plants were first investigated for the health risk assessment.
The regression equations, ranges of linearity, and detection limits were presented in Supplementary table 1 with R2 all higher than 0.9995, and the concentrations of heavy metal were shown in Table 2. Results showed that Cu was the most abundant heavy metal determined in the KT original plants at a concentration ranging from 6.175 ± 0.328 (ID) to 10.677 ± 0.148 (ICV) mg/kg and with a mean value of 7.728 mg/kg. On the contrary, Hg possessed the lowest content among the samples with an average value of 0.037 mg/kg, ranging from 0.007 ± 0.001 (IC) to 0.054 ± 0.003 (LJ) mg/kg. Among the six original plants of KT, ID had the highest concentration of As (1.275 ± 0.043 mg/kg) and Pb (1.66 ± 0.058 mg/kg), while its concentration of Cu was the lowest (6.175 ± 0.328 mg/kg). Meanwhile, the concentration of Cd in IP was the highest (5.476 ± 0.305 mg/kg), while IP had the lowest As concentration (0.386 ± 0.033 mg/kg). For LJ, it had the maximum concentration of Hg, and the minimum concentrations of Cd (0.043 ± 0.001 mg/kg) and Pb (0.364 ± 0.010 mg/kg). In addition, all the heavy metal contents in IL were neither the highest nor the lowest.
Sample
Metals /(mg•kg−1)
65Cu
75As
111Cd
202Hg
208Pb
IL
6.242 ± 0.440d
1.054 ± 0.057b
0.120 ± 0.007de
0.041 ± 0.003bc
0.694 ± 0.019d
ID
6.175 ± 0.328d
1.275 ± 0.043a
0.490 ± 0.019c
0.044 ± 0.003b
1.660 ± 0.058a
IP
7.177 ± 0.504c
0.386 ± 0.033d
5.476 ± 0.305a
0.039 ± 0.003cd
0.809 ± 0.035c
IC
6.209 ± 0.135d
0.577 ± 0.014c
1.622 ± 0.048b
0.007 ± 0.001e
1.349 ± 0.059b
ICV
10.677 ± 0.148a
0.595 ± 0.001c
0.320 ± 0.002cd
0.035 ± 0.001d
0.741 ± 0.230cd
LJ
9.886 ± 0.240b
0.431 ± 0.008d
0.043 ± 0.001e
0.054 ± 0.003a
0.364 ± 0.010e
average
7.728
0.720
1.345
0.037
0.936
limit values of standards
30
2.0
1.0
0.3
2.0
Comparing with the heavy metal contents of yerba mate tea made of Ilex paraguariensis, the six KT original plants contained a lower concentration of Cu, and higher concentrations of Cd and Pb (Schmite et al., 2019). Moreover, in accordance with the Chinese National Food Safety Standard National Health and Family Planning Commission of the People’s Republic of China (NHFPCPRC) and China Food and Drug Administration (CFDA), (2022) and the Ministry of Agriculture’s Tea Heavy Metals limit Standards Ministry of Agriculture of the People’s Republic of China (MAPRC), 2003; Ministry of Agriculture of the People’s Republic of China (MAPRC), (2012), the levels of Pb, Cu, As and Hg in the six KT original plants (Pb, Cu, Cd, As and Hg at 2.0, 30, 1.0, 2.0 and 0.3 mg/kg, respectively) were found to be well below the stipulated safety thresholds. As for Cd, its concentrations in IP and IC, as well as the average values were above the stipulated values, indicating that Cd might be the main heavy metal threat for KT original plants. Pardinho et al., (2020) also reported the high risk of Cd existence in the leaves and stalks of Ilex Paraguariensis, supporting our results in the present study. Cd was reported to be one of the most toxic elements for plants, which activate the accumulation of low molecular weight phenolics functioned as bio-antioxidants (Grembecka and Szefer 2013, Goncharuk and Zagoskina 2023). Therefore, IP and IC with higher Cd contents might contain higher levels of phenolics and flavonoids.
3.2 Polysaccharide composition among varied original plants
The crude polysaccharides of six KT original plants were extracted with water, precipitated with ethanol, and purified by the Sevage method (Liu et al., 2023). The crude polysaccharides of IL, ID, IP, IC, ICV and LJ were obtained at overall yields of 1.02 %, 1.02 %, 4.95 %, 1.33 %, 1.14 % and 3.98 %, respectively (data not shown), which were similar with those reported by Fan et al., (2014) and Qin et al., (2021), wherein polysaccharide contents on a dry weight basis of IL leaves and Liupao tea were 6.3 % and 1.83 %, respectively.
Moreover, the contents of carbohydrates, proteins and uronic acids in crude polysaccharides of the six KT original plants were determined (Table 3 and Supplementary Fig. 1). The carbohydrates contents in the six crude polysaccharides ranged from 95.85 ± 3.80 (ID) to 548.51 ± 9.90 (LJ) mg GLE/g, following the rank order as LJ>IC ≈ IP>IL ≈ ICV>ID. Fan et al., (2014) determined the content of carbohydrates in crude polysaccharides from IL was 613 ± 13 mg GLE /g, which was higher than ours (251.72 ± 9 mg GLE /g). Major reason might be the different extraction and purification process. As for protein contents in six crude polysaccharide samples, they were ranged from 24.76 ± 2.05 (ID) to 188.96 ± 4.29 (IP) mg BSAE /g and all exhibited significant differences among each other (P<0.05), with an order as: IP>LJ>IC>ICV>IL>ID. The second lowest of protein content was IL (52.50 ± 4.00 mg/g), which was similar with that of the previous study (Fan et al., 2014). In addition, it was reported that the physiological and biological activities of polysaccharides from Vitex negundo and Polyporus umbellatus were significantly related to the uronic acid moieties (Kumar and Kumar 2017). In this study, all the crude polysaccharides of six original plants contained relatively low content of uronic acids, and the uronic acids contents of six crude polysaccharide samples exhibited an order as: IP>LJ>IC>IL>ICV>ID. nd, no detected. a,b,c,d,e,f In each line, different letters indicate significant differences between two groups (P<0.05). The values of carbohydrate, protein and uronic acid were expressed as mg glucose equivalent (GLE)/g, bovine serum albumin equivalents (BSAE)/g and glucuronic acid equivalents (GLAE)/g, respectively. Results of antioxidant activities were expressed as IC50 value, the concentrations of samples at which the DPPH▪, ABTS▪+ radicals were scavenged by 50%, and the absorbance was 0.5 for reducing power obtained by extrapolation from linear regression analysis, respectively (Xiao et al., 2014).
IL
ID
IP
IC
ICV
LJ
VC
Carbohydrate (mg GLE/g)
251.72 ± 9.15d
137.35 ± 3.50f
470.06 ± 8.19b
368.07 ± 2.27c
225.78 ± 11.34e
548.51 ± 9.90a
Protein (mg BSAE/g)
52.5 ± 3.99e
24.76 ± 2.05f
147.69 ± 4.13b
100.23 ± 5.37c
82.29 ± 2.3d
170.70 ± 6.59a
Uronic acid (mg GLAE/g)
58.45 ± 0.53d
19.92 ± 0.3f
103.86 ± 0.71a
91.73 ± 1.24c
49.7 ± 0.83e
94.47 ± 0.81b
DPPH (mg/L)
nd
nd
684.29 ± 46.26b
2119.41 ± 131.47c
2272.51 ± 162.50c
572.72 ± 32.10b
70.50 ± 1.17a
ABTS (mg/L)
1408.87 ± 83.67d
2282.99 ± 85.25e
680.22 ± 29.45c
1467.87 ± 71.76d
2488.51 ± 27.31f
515.00 ± 2.85b
87.68 ± 0.57a
Reducing power (mg/L)
818.87 ± 5.80d
1450.11 ± 4.51g
657.22 ± 4.89c
1010.50 ± 0.816f
1036.83 ± 1.50f
572.90 ± 5.19b
60.12 ± 0.33a
3.3 Antioxidant activity of crude polysaccharide among varied original plants
Three antioxidant assays, DPPH, ABTS and ferric reducing antioxidant power (FRAP), were employed to fully evaluate the antioxidant capacities of the six crude polysaccharides. Mechanisms of the antioxidant assays could vary based on whether it involves direct scavenging of free radicals, quenching the reactive oxygen species (ROS), electron transfer reactions, and changes in fluorescent signals. Radicals could be scavenging by transferring either a hydrogen atom or an electron to convert the radicals to a stable species, and electron transfer is faster than hydrogen atom transfer (Schaich et al., 2015). Briefly, ABTS▪+ scavenging is based on the single electron transfer mainly and also hydrogen atom transfer, while DPPH▪ scavenging depends on hydrogen atom transfer (Schaich et al., 2015, Wu et al., 2020b). Reducing power is an antioxidant method based on a single electron transfer. As for method such as oxygen radical absorb capacity (ORAC) assay, quenching occurs through the direct interaction between antioxidants and reactive oxygen species (ROS), the antioxidants neutralize or scavenge free radicals, thus preventing them from causing oxidative damage to cells and tissues.
As shown in Table 3 and Fig. 1A-C, ascorbic acid was used as positive control and showed the strongest antioxidant activity than the six crude polysaccharides in all the three antioxidant assays. DPPH▪ and ABST▪+ scavenging ability of six polysaccharides samples increased in a dose-dependent manner at 500–1250 mg/L, and it increased slowly and ultimately reached the maximum free radicals scavenging abilities at 1250–2500 mg/L (Fig. 1A and B). The DPPH and ABTS antioxidant activities of LJ (572.72 ± 32.10 and 515.00 ± 2.85 mg/L) and IP (684.29 ± 46.26 and 680.22 ± 29.45 mg/L) were significantly stronger than those of other four samples at all concentrations, suggesting that their polysaccharides were better antioxidants (Table 3 and Fig. 1A and B). The order of IC50 value for DPPH was LJ<IP<IC ≈ ICV<IL ≈ ID, while that of ABTS was LJ<IP<IL ≈ IC<ID<ICV. As for reducing power (Fig. 1C), the absorbances of six polysaccharides were all highly dose-dependent (R2 > 0.987), and the reducing power order was LJ>IP>IL>ICV ≈ IC>ID, with LJ (572.90 ± 5.19) and IP (657.22 ± 4.89) still possessing the lowest IC50 values (Table 3 and Fig. 1C). All these results indicated that LJ and IP were relatively better antioxidant polysaccharides sources.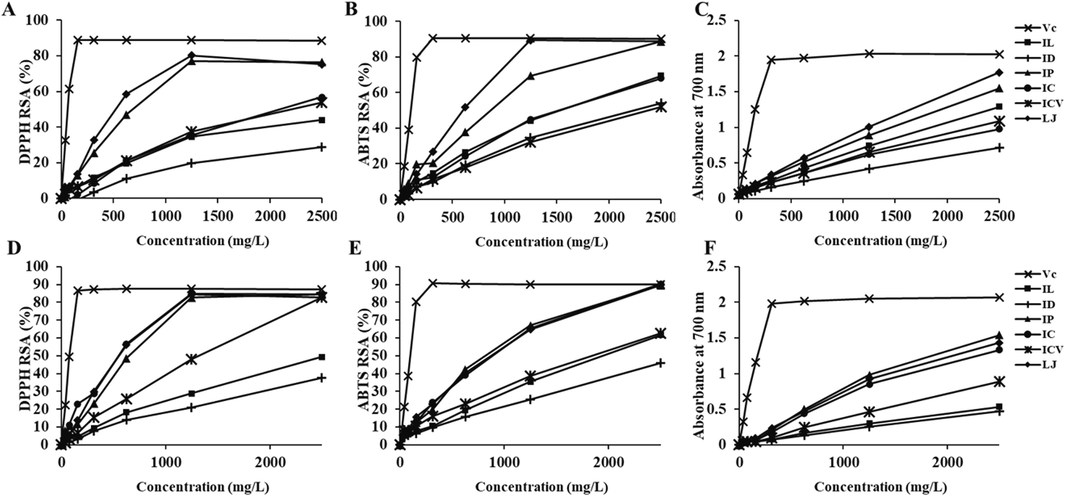
Antioxidant capacities of crude polysaccharides, phenolics and saponins in six KT original plants. Antioxidant capacities were determined by DPPH▪ (A and D), ABTS▪+ (B and E) scavenging, and reducing power (C and F) assays. RSA, radical scavenging activity.
3.4 Phenolics and saponins constituents among various original plants
KT and other non-camellia tea were reported to contain kinds of bioactive compounds, including polyphenols, flavonoids, terpenoids, polysaccharides, saponins, with polyphenols and flavonoids were dominant compounds (Ren et al., 2019, Yu et al., 2023). In addition, flavonoids are usually categorized into flavonols flavanols, flavones, isoflavones, flavanones and anthocyanidins, possessing varied bioactivities (Volikakis and Efstathiou 2005). Furthermore, tea saponins are commonly triterpenoids with similar structures (Yu et al., 2023). In this part of the study, therefore, contents of total phenolics, total flavonoids, total phenolic acids, total flavonols, total flavanols and total saponins of the six original KT plants and their antioxidant activities were comprehensively investigated.
Overall, total phenolics, flavonoids, phenolic acids, flavonols and flavanols of LJ and IP were significantly higher than those of the other four original KT plants, while those of IL were the lowest (Table 4 and Supplementary Fig. 2). Contents of total phenolics and phenolic acids exhibited a same order, namely, LJ>IP>IC>ICV>IL ≈ ID. As for total flavonoids, there were no significant differences between IC and ICV, or between IL and ID. In addition, no significant difference was observed between total flavonols of IP and LJ, which were both significantly higher than those of all others. Contents of total flavanols were much lower than other compositions, while IP and LJ still possess the highest contents. It had been reported that total phenolics of three KT original species from different regions ranged from 60 to 150 mg gallic acid equivalents (GAE)/g DW, with an average value of 100 mg GAE/g DW (Zhu et al., 2009), which were much higher, while total flavonoids were significantly lower than those in our study. The reason might be the variations in the determination method. Apart from phenolics constituents, saponins were also considered to be the major constituent in Large-Leaves-Kuding Tea (Wupper et al., 2020). Notably, the distribution pattern of total saponins in six KT original plants were different from those of phenolics. To be specific, total saponins in IP, IC, ICV and LJ were the highest and there was no significant difference among them, followed by ID and IL (Table 4). Overall, the above results indicated that LJ and IP exhibited the highest levels of phenolics and saponins. nd, no detected. a,b,c,d,e,f In each line, different letters indicate significant differences between two groups (P<0.05). The values of total phenolics, total flavonoids, total phenolic acids, total flavonols, total flavanols and total saponins were expressed as mg gallic acid equivalents (GAE)/g, rutin equivalents (RE)/g, caffeic acid equivalents (CAE)/g, rutin equivalents (RE)/g, catechin equivalents (CE)/g and ginsenoside equivalents (GSE)/g, respectively. Results of antioxidant activities were expressed as IC50 value, the concentrations of samples at which the DPPH▪, ABTS▪+ radicals were scavenged by 50%, and the absorbance was 0.5 for reducing power obtained by extrapolation from linear regression analysis, respectively (Xiao et al., 2014).
IL
ID
IP
IC
ICV
LJ
VC
Total phenolics (mg GAE/g)
8.11 ± 0.09e
9.9 ± 1.23e
33.84 ± 1.11b
26.39 ± 0.14c
18.43 ± 0.83d
48.85 ± 2.86a
Total flavonoids (mg RE/g)
28.7 ± 1.06d
30.86 ± 0.82d
73.69 ± 3.11b
54.49 ± 1.29c
56.5 ± 0.52c
109.97 ± 0.69a
Total phenolic acids (mg CAE/g)
30.49 ± 0.89e
29.52 ± 0.31e
49.68 ± 0.73b
41.08 ± 0.53c
34.58 ± 0.18d
61.48 ± 0.77a
Total flavonols (mg RE/g)
6.41 ± 0.04e
8.83 ± 0.80d
18.47 ± 1.1a
12.63 ± 0.72c
16.53 ± 0.63b
19.19 ± 0.94a
Total flavanols (mg CE/g)
0.04 ± 0.00e
0.08 ± 0.00d
0.18 ± 0.00a
0.04 ± 0.00e
0.09 ± 0.00c
0.14 ± 0.00b
Total saponins (mg GSE/g)
67.19 ± 0.59c
79.61 ± 6.26b
90.81 ± 3.25a
89.97 ± 1.48a
90.1 ± 1.97a
97.33 ± 0.73a
DPPH (mg/L)
nd
nd
607.41 ± 38.26b
478.49 ± 20.58b
1124.18 ± 57.77c
547.06 ± 8.85b
70.50 ± 1.17a
ABTS (mg/L)
2090.41 ± 75.50c
nd
702.96 ± 25.52b
704.58 ± 21.05b
1907.16 ± 98.71c
693.34 ± 19.22b
87.68 ± 0.57a
Reducing power (mg/L)
2341.50 ± 4.02d
2360.00 ± 21.40d
780.44 ± 0.98b
881.14 ± 73.76b
1480.50 ± 184.66c
754.00 ± 7.95b
60.12 ± 0.33a
3.5 Antioxidant activities of phenolics and saponins among various original plants
DPPH, ABTS and reducing power were employed to detect the antioxidant capacities of all the phenolic constituents among the six KT original plants. Unlike results of polysaccharides, DPPH▪, ABTS▪+ scavenging abilities and reducing power of phenolics and saponins of IC, LJ and IP were the highest, and those of ID was the lowest (Fig. 1D-F). The IC50 values of phenolics and saponins in six KT original plants were also calculated (Table 4), which were in accordance with the finding of other authors (Liu et al., 2009). In addition, IC50 values for DPPH exhibited a little difference in the order from those of ABTS and reducing power: IC ≈ LJ ≈ IP<ICV<IL ≈ ID (DPPH); LJ ≈ IP ≈ IC<ICV<IL ≈ ID (ABTS and reducing power). In general, the antioxidant activities of phenolics and saponins in IP and LJ were significantly higher than those of the other samples, similar to the results of antioxidant activities of polysaccharides. Durgun et al., (2020) found that scavenging abilities of sulphonamide derivatives ranged from 1.9 ± 0.09 to 18.7 ± 1.5 % for DPPH▪, from 7.3 ± 0.6 to 78.4 ± 7.7 % for ABTS▪+, indicating that phenolics and saponins in KT original plants possessed high antioxidant abilities.
3.6 Polysaccharides and phenolics and saponins in the KT original plants exhibited different inhibitory effect against α-glucosidase
α-Glucosidase inhibitor could lower the blood sugar level by effectively interrupting the breakdown of linear or branched oligosaccharides into glucose (Priscilla et al., 2014), and consequently control diabetes by diminishing the absorption of glucose (Kim et al., 2011). Therefore, α-glucosidase is widely used as the model for screening potential anti-diabetes inhibitor. Inhibitory effects of polysaccharides, phenolics and saponins of the six KT original plants on α-glucosidase were thus determined, and found that they exhibited diverse inhibitory activity against α-glucosidase and the inhibitory activities of phenolics and saponins were relatively stronger than those of polysaccharides (Fig. 2). As shown in Fig. 2A, the inhibitory effect of polysaccharides in IP (IC50 242.94 ± 23.98 mg/L) and ID (IC50 521.42 ± 172.34 mg/L) were significantly stronger than those in other four KT original plants (IC50 5967.75–6449.27 mg/L). As for phenolics and saponins (Fig. 2B), the α-glucosidase inhibitory activity of LJ (IC50 1521.69 ± 66.85 mg/L) was the weakest, followed by ICV, ID, IP, IC and IL (IC50 84.23–227.23 mg/L). Among which, no significant difference was observed for the α-glucosidase inhibitory activity of ICV, ID and IP, and among ID, IP, IC and IL. Overall, polysaccharides, phenolics and saponins of those KT original plants exhibited α-glucosidase inhibitory activities comparable to those of the Benzenesulfonamide derivatives 1–11, whose IC50 values ranged from 98.46 to 1054.80 μM (Taslimi et al., 2020). In addition, polysaccharides, phenolics and saponins of IP demonstrated the maximum potential for anti-diabetes agent exploration due to their highest α-glucosidase inhibitory activities.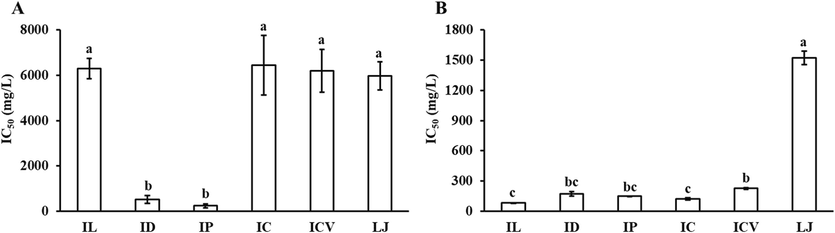
Inhibitions of polysaccharides (A) and phenolics and saponins (B) in the six KT original plants against α-glucosidase. Different letters mean significant difference (P<0.05).
3.7 Phenolic and terpenoid compounds identification with UPLC-QTOF-MS/MS
Table 5 and Supplementary Fig. 3 exhibited the phenolic and terpenoid compounds identified from IP (compounds 1–8) and LJ (compounds 9–17) through UPLC-QTOF-MS/MS analysis, along with their retention time (RT), m/z, formula and MS/MS fragments listed in the table. As shown in Table 5, five phenolic and three terpenoid compounds in IP, and six terpenoid compounds and three flavonoids in LJ were identified, respectively. Note: Compounds 1–6 were identified from IP and compounds 7–15 were identified from LJ through UPLC-QTOF-MS/MS analysis.
No.
tR/min
Measured [M−H]-
Mass (Da)
Proposed Compound
Formula
MS/MS (m/z)
1
1.353
353.0886
354.0951
Chlorogenic acid (CQA)
C16H18O9
191.0554;179.0342;173.046;171.0297;161.022;135.044;127.0395
2
2.006
515.1186
516.1268
Isochlorogenic acid B (3,4-di-CQA)
C25H24H12
353.0870;335.0767;191.0557;179.0344;173.0453;161.0243;155.0342;134.0368;112.9854
3
2.238
515.1191
516.1268
Isochlorogenic acid A (3,5-di-CQA)
C25H24H12
335.0742;191.0560;179.0343;173.0445;161.0244;135.0447;112.9856
4
2.659
515.1199
516.1268
Isochlorogenic acid C (4,5-di-CQA)
C25H24H12
353.0872;335.0766;191.0557;179.0345;173.0452;161.0242;135.0445;112.9855
5
9.188
677.1495
678.162
3,4,5-Tricaffeoylquinic acid (3,4,5-tri-CQA)
C34H30O15
335.0750;179.0342;173.0441;135.0443
6
19.002
663.3754
664.3823
Ilexsaponin A1 isomer
C36H56O11
543.3297;501.3210;483.3144;457.3276;113.0223
7
19.614
663.3769
664.3823
Ilexsaponin A1 isomer
C36H56O11
543.3307;501.3206;483.3106
8
19.888
663.3770
664.3823
Ilexsaponin A1 isomer
C36H56O11
543.3319;501.3223;483.3110
9
5.303
389.0897
390.1089
Oleoside
C16H22O11
345.0996;209.0381;183.0607
10
10.876
569.1746
570.1517
Oleuropeinic acid
C25H30O15
389.0899;209.0452;151.0402
11
12.922
447.0659
448.0934
Luteolin-7-O-glucoside
C21H20O11
285.0397
12
13.992
553.179
554.1558
Ligustrosidic acid
C25H30O14
347.1143;209.0447
13
15.677
431.0736
432.0983
Apigenin-7-O-glucoside
C21H20O10
268.0256
14
16.417
577.1468
578.1563
Apigenin-7-O-rutinoside
C27H30O14
269.0329
15
17.929
539.1417
540.177
Oleuropein
C25H32O13
403.1009;377.1018
16
22.431
519.1183
520.1508
6́-O-trans-Cinnamoyl-8-epikingisidic acid
C25H28O12
227.047;189.0496;183.0603
17
29.752
519.1172
520.1508
6́-O-cis-Cinnamoyl 8-epikingisidic acid
C25H28O12
475.127;209.0372;189.05
3.7.1 Phenolic compounds
Compound 1 (tR=1.353) had [M−H]– at m/z 353.0886 with the predicted molecular formula C16H18O9, and common fragments such as m/z 191.0566, 179.0561, and 173.0453, which proved that compound 1 was chlorogenic acid (CQA) (Cao et al., 2017, Zhou et al., 2018). Compounds 2 (tR=2.006 min), 3 (tR=2.238 min) and 4 (tR=2.659 min) displayed the [M−H]– ions at m/z 515.1195, 515.1195, and 515.1191 (C25H24O12), respectively, and they were positively identified as isochlorogenic acid B (3,4-di-CQA), isochlorogenic acid A (3,5-di-CQA), and isochlorogenic acid C (4,5-di-CQA), respectively, based on comparisons with the references (Cao et al., 2017, Zhou et al., 2018). Compound 5 (tR=9.188) was identified as 3,4,5- tricaffeoylquinic acid as it had a [M−H]- at 678.162, and fragmented at 335.0760 (M−H−caffeoyl−H2O), 179.0346 (caffeic acid-H), 173.0489 (quinic acid-H-H2O) and 135.0443 (caffeic acid-H-CO2) (Liu et al., 2017).
3.7.2 Terpenoids
Compound 6 (tR=19.002 min), 7 (tR=19.614 min), and 8 (tR=19.888 min) had the adduct ions of m/z [M−H]– for 663.3754, 663.3769 and 663.3770 (C36H55O11), and generated m/z 501 and 483 by progressively losing a glucosyl moiety (162 Da) and one H2O (18 Da) molecule. It was positively identified as ilexsaponin A1 isomers, based on comparisons to reference materials (Cao et al., 2017). Compound 9 (tR=5.303 min) exhibited a [M−H]− at 389.0897 with the molecular formula C16H21O11 and was identified as oleoside as its MS/MS profile corresponded with that reported by Li et al., (2017). Compound 10 (tR=10.876 min) showed an exact ion [M−H]– at m/z 569.1746 (C25H29O15) and fragmentation ions at m/z 389.0899, 209.0452 and 151.0402, among which, m/z 151 could be assigned to the phenolic moiety. The MS and MS/MS patterns were consistent with those of oleuropeinic acid (Rubio-Senent et al., 2013). Compound 12 (tR=13.992 min) yielded the [M−H]− molecular ion at m/z 553.179, and tentatively identified as ligustrosidic acid (Guo et al., 2011, Song et al., 2014). Compounds 15 (tR=17.929 min) with the [M−H]− molecular ion at m/z 539.1417 was identified as oleuropein by comparison with the MS/MS data of a previous study (Peralbo-Molina et al., 2012). Moreover, by comparison to reference, Compounds 16 (tR=22.431 min) and 17 (tR=29.752 min) were tentatively identified as 6ˊ-O-trans-cinnamoyl-8-epikingisidic acid and 6́-O-cis-cinnamoyl 8-epikingisidic acid, respectively (Li et al., 2017).
3.7.3 Flavonoids
Luteolin-7-O-glucoside (Compound 11, tR=12.922 min) was detected at m/z 447.0934, with a base peak at m/z 285.0397 in its MS2 spectrum (Li et al., 2017). Compound 13 (tR=15.677 min) exhibited a precursor [M−H]– ion at m/z 431.0736 with MS2 fragments at m/z 2680.256, indicating the existence of apigenin aglycone. This compound was thus tentatively identified as apigenin-7-O-glucoside (cosmosiin) (Hvattum and Ekeberg 2003). Compounds 14 (tR=16.417 min) presented precursor ions at m/z 577.1468, and strong signals for the aglycones were observed in the MS2 spectra m/z 269 produced through the loss of a rutinosyl moiety (308 Da). By comparing molecular formula and fragmentation pattern, Compound 12 could be tentatively identified as apigenin-7-O-rutinoside (Cuyckens et al., 2001).
3.8 Molecular docking
To further explore the α-glucosidase inhibition mechanism of phenolic and saponin constituents of IP, chlorogenic acid, 3,5-di-CQA, 3,4,5-tri-CQA, and ilexsaponin A1 were conjugated with saccharomyces cerevisiae α-glucosidase by molecular simulation through AutoDock Vina. As shown in Table 6, the docking binding energies of CQA, 3,5-di-CQA, 3,4,5-tri-CQA, and ilexsaponin A1 with α-glucosidase were all < -7.1, indicating that all four compounds possess good binding affinity with α-glucosidase as the receptor protein. Among which, the free binding energy of α-glucosidase with 3,4,5-tri-CQA was the lowest (−10.1 kcal/mol), indicating a spontaneous and stable binding.
Targets
PDB ID
Center coordinates
Compounds
Binding energy(kcal/mol)
α-glucosidase
3A4A
22.432, −5.549, 18.308
chlorogenic acid (CQA)
−8.8
3,5-di-CQA
−9.8
3,4,5-tri-CQA
−10.1
ilexsaponin A1
−7.1
Results of molecular docking exhibited that all four compounds displayed substantial binding within the active site of α-glucosidase, where it interacted with α-D-glucopyranose through hydrogen bonds formed with Asp69, His112, Arg213, Asp215, Glu277, His351, Asp352, and Arg442 (Yamamoto et al., 2010) (Fig. 3). Furthermore, the combination of CQA, 3,5-di-CQA, 3,4,5-tri-CQA, and ilexsaponin A1 with α-glucosidase were accomplished through hydrogen, carbon hydrogen, alkyl, Pi-alkyl, Pi-anion, Pi-cation, Pi-Pi T-shaped, and Pi-Sigma bonds, indicating a stable interaction (Fig. 3). CQA bound with the active site of α-glucosidase mainly through hydrogen bonds formed with its amino acid residues Gln279, His280, Thr310, Agr315, Asp352, Pi-anion bond with Asp307, and Agr315 with Pi-alkyl bond (Fig. 3A). As for 3,5-di-CQA and 3,4,5-tri-CQA, higher binding affinity and formation of more bonds were observed with addition of quinic acid moiety in the ligand (Table 6). To be specific, 3,5-di-CQA and 3,4,5-tri-CQA embedded into the active site groove of α-glucosidase and bound through hydrogen bonds formed with Lys156, Asp215, Glu277, His280, Asp352, Gln353, and Lys156, Asp215, Ser241, Asp242, Gln279, Gln353 in respective (Fig. 3B, and C). Ilexsaponin A1 also inserted into the crevice of α-glucosidase, bound with Asp242, Arg315, Asp352 through hydrogen bonds, and bound with Lys156, Tyr158, His280, Phe303, Agr442 through alkyl, Pi-alkyl, and Pi-Sigma bonds (Fig. 3D). Xu et al., (2015) also reported the inhibition of caffeoylquinic Acid derivatives from Ilex kudingcha on the α-glucosidase, further validate the molecular docking result of the present study.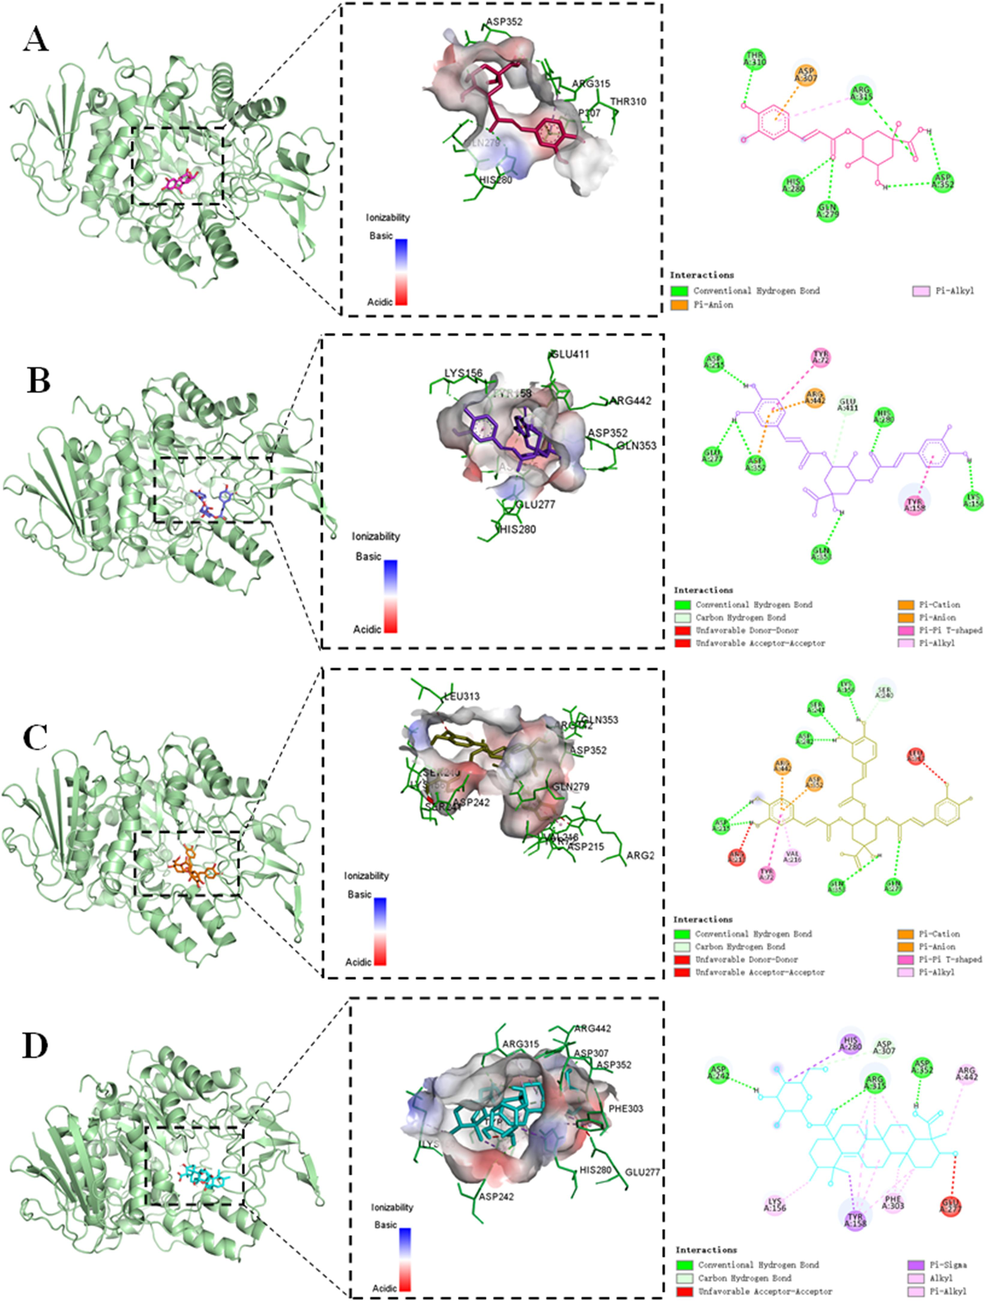
Docking details of saccharomyces cerevisiae α-glucosidase interaction with chlorogenic acid (A), isochlorogenic acid A (B), 3,4,5-Tricaffeoylquinic acid (C), and ilexsaponin A1 (D).
3.9 Molecular dynamics simulation
In the present research, all atoms MD simulations were subsequently performed on the protein–ligand complexes of 3,4,5-tri-CQA and ilexsaponin A1 with α-glucosidase complexes over 50 ns at 303.15 K (30 °C). The root-mean-square deviation (RMSD), root-mean-square fluctuation (RMSF), gyration radius (Rg), solvent accessible surface area (SASA), hydrogen bonds, binding free energy values, and free energy landscape (FEL) were evaluated for deviations in the proteins’ Cα atoms from their backbone and the fluctuations associated with the amino acid residues of the protein during the simulation.
As exhibited in Fig. 4I-A, the RMSD of α-glucosidase maintained a stable equilibrium after 3 ns with slight fluctuation ranging from 0.15 to 0.25 nm, indicating the high stability. As for 3,4,5-tri-CQA, however, it exhibited a strong fluctuation during the first 10 ns, and turned to be steady after 35 ns, indicating the flexibility of the ligand’s carbon skeleton (Fig. 4I-A). Furthermore, the diagram of RMSF showed that all Cα atoms of a-glucosidase docked complexes docked with 3,4,5-tri-CQA was shown in Fig. 4I-B. As the RMSF values of most amino acid residues were lower than 0.3, the protein exhibited a stable secondary conformation (Kovacic et al., 2015). The Rg analysis showed that the Rg trajectory of the α-glucosidase-3,4,5-tri-CQA complex achieved a steady equilibrium at about 10 ns onwards, which signified that 3,4,5-tri-CQA was well accommodated in the active site of α-glucosidase (Fig. 4I-C). As shown in Fig. 4I-D, hydrogen bonds were formed between 3,4,5-tri-CQA and α-glucosidase from the beginning of the simulation process, and the number of hydrogen bonds appeared mainly from 5 to 10, proving our previous docking results. According to the results in Fig. 4I-F and E, the interaction between 3,4,5-tri-CQA and amino acid residues Asp215, Tyr158, Ser241, Lys156, Phe303 in the α-glucosidase contributed to the binding free energy values at −66 ± 6.23 kcal/mol. The free energy landscape was also applied to characterize the changes of the binding free energy values during the simulation. In this simulation, the dominated conformation occurred when RMSD ranged from 0.10 to 0.12 nm and Rg ranged from 2.420 to 2.425 nm (Fig. 4I-G).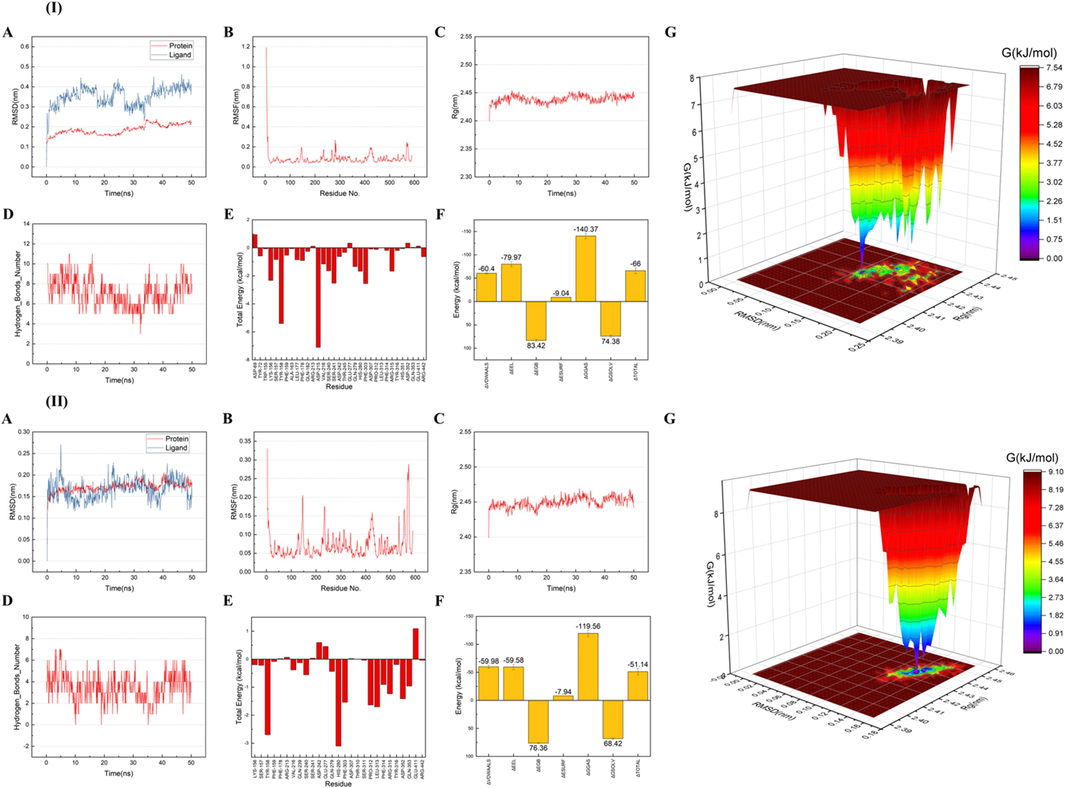
The results of molecular dynamics simulation for the binding of 3,4,5-tri-CQA (I) and ilexsaponin A1 (II) with α-glucosidase for 50 ns. Root-mean-square deviation (RMSD) plots (A). Root-mean-square fluctuation (RMSF) plots (B). Radius of gyration (Rg) results (C). Change in the number of hydrogen bonds (D). Contribution of the residues to the total binding free energy (E). Binding free energy values (kcal/mol) calculated by MM/GBSA method (F). The free energy landscape (G).
For the α-glucosidase-ilexsaponin A1 complex, the RMSD of both the protein and the ligand achieved a steady equilibrium after 5 ns (Fig. 4II-A). The RMSF plots showed that the RMSF values of all residues were lower than 0.35 nm, ensuring the stability of the system (Fig. 4II-B). Results of Rg further revealed that the Rg value of α-glucosidase slightly increased after the binding of ilexsaponin A1, suggesting that the structure of α-glucosidase was slightly loosened following the binding (Fig. 4II-C). As exhibited in Fig. 4II-D, the number of hydrogen bonds between ilexsaponin A1 and α-glucosidase appeared mainly from 1 to 6, matching the finding of molecular docking. Moreover, the interaction between ilexsaponin A1 and amino acid residues His280, Tyr158, Leu313 in the α-glucosidase contributed to the binding free energy values at −51.14 ± 5.72 kcal/mol (Fig. 4II-E and F). The combination of RMSD ranged from 0.11 to 0.15 nm and Rg ranged from 2.430 to 2.445 nm led to the dominated stable conformation, as shown in Fig. 4II-G.
3.10 Principal component and hierarchical cluster analysis
We next move to perform principal component (PCA) and hierarchical cluster analysis (HCA) on the overall contents of heavy metals and the bioactive constituents of KT original plants. In general, PCA provided a good summary of the aforementioned data as PC1 and PC2 accounted for 79.30 % of total variance and clearly discriminated the six KT original plants based on their specific parameters in the score plot (Fig. 5A).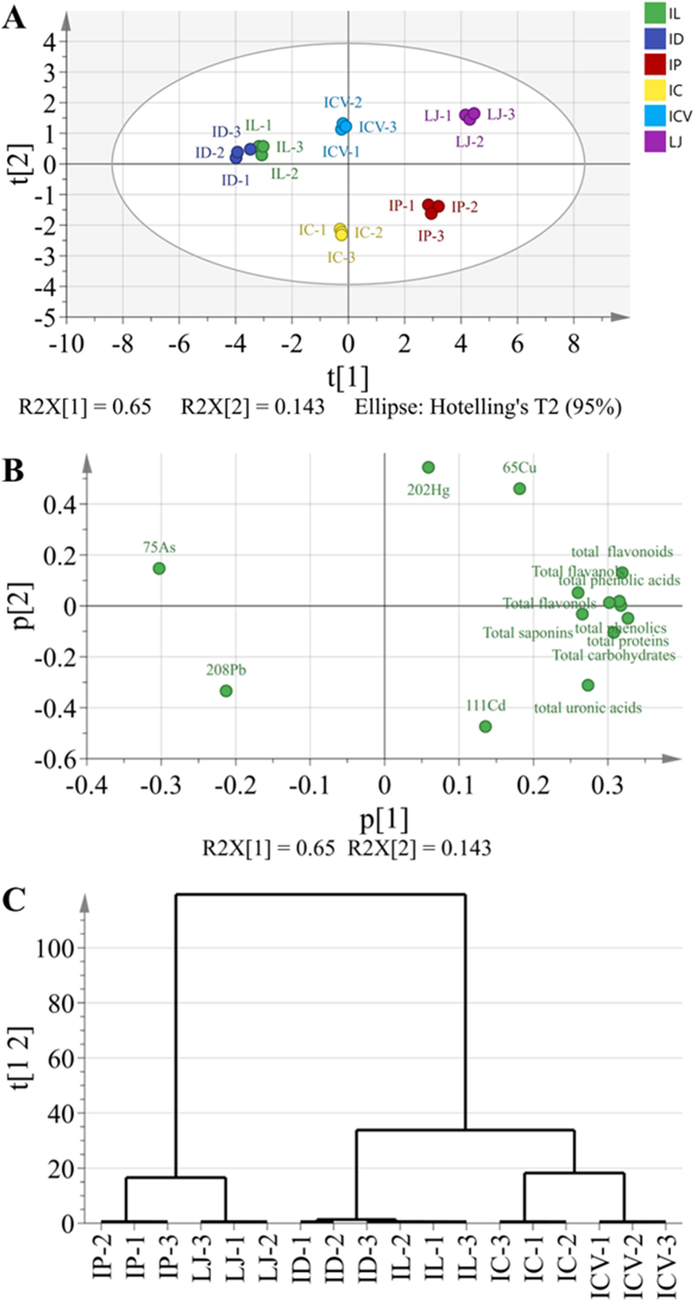
Principal component and hierarchical cluster analyses of different KT original plants. The PCA score scatter plot (A), loading scatter plot (B), and hierarchical cluster analysis (C) are based on the contents of heavy metals and bioactive constituents.
PC1, which explained 65.00 % of the variance, separated most of the heave metals, while a similar distribution can be observed for the bioactive constituents (Fig. 5B). Moreover, six KT original plants were finely divided into three groups by PC1, i.e., ID and IL, IC and ICV, and IP and LJ (Fig. 5A). The HCA results were shown in Fig. 5C, revealing a similar classification mode. Overall, all bioactive constituents were in quadrants I and IV, further indicating the higher contents of them in IP and LJ, which were also in these two quadrants (Fig. 5A and B).
3.11 Correlation analysis
Tables 7 and 8 exhibited the correlation degree among polysaccharides, phenolics and saponins, and antioxidant and α-glucosidase inhibition capacities. As shown in Table 7, there was significantly positive correlation among antioxidant activities determined through three assays (0.819 < R2 < 0.964, P<0.05), indicating that these three antioxidant assays (DPPH, ABTS and reducing power) could provide comparable values for estimating the antioxidant capacity. While carbohydrates content was not significantly correlated with content of uronic acids, it was positively correlated with DPPH and ABTS values, implying carbohydrates were the important contributor to antioxidant capacity of polysaccharides. Moreover, no correlation was found between inhibitory activity of α-glucosidase and carbohydrates, implying that the α-glucosidase inhibition ability of crude polysaccharides was contributed by other substances. While researches reported that the biological activities of polysaccharides from Vitex negundo and Polyporus umbellatus were significantly related to the uronic acid moieties (Kumar and Kumar 2017), contents of uronic acid moieties in polysaccharides from KT original plants were relative low, and exhibited no significant correlation with antioxidant or antidiabetic activities, which could be explained by the difference among plant species.
Carbohydrate
Uronic acid
DPPH
ABTS
Reducing power
α-glucosidase
Carbohydrate
1
Uronic acid
0.786
1
DPPH
0.932**
0.760
1
ABTS
0.865*
0.714
0.965**
1
Reducing power
0.702
0.707
0.860*
0.819*
1
α-glucosidase
−0.303
0.172
−0.020
0.036
0.390
1
Correlation analysis among total phenols, flavonoids, phenolic acids, flavonols, flavanols, saponins and antioxidant and α-glucosidase inhibition activities were displayed in Table 8. Similarly, the three antioxidant assays were highly significantly correlated with each other (0.944 < R2 < 0.986, P<0.01) (Table 8; data on the right side of the vertical dash line). Total phenols were significantly correlated with total flavonoids (R2 = 0.980, P<0.01), and they were both significantly associated with total phenolic acids, flavonols and saponins (0.844 < R2 < 0.992, P<0.05), while there were no significant association between total phenols and flavanols, or total flavonoids and flavanols (R2 = 0.695, 0.716, P>0.05). In addition, there was no correlation among total phenolic acids, total flavonols, total flavanols and total saponins, except total flavonols were significantly correlated with total flavanols and total saponins (Table 8; data above the horizontal dash line).
Total phenols
Total flavonoids
Total phenolic acids
Total flavonols
Total flavanols
Total saponins
DPPH
ABTS
Reducing power
α-glucosidase
Total phenols
1
Total flavonoids
0.980**
1
Total phenolic acids
0.992**
0.972**
1
Total flavonols
0.846*
0.871*
0.811
1
Total flavanols
0.695
0.716
0.713
0.848*
1
Total saponins
0.845*
0.844*
0.773
0.901*
0.625
1
DPPH
0.893*
0.821*
0.855*
0.715
0.404
0.809
1
ABTS
0.877*
0.784
0.861*
0.757
0.576
0.744
0.944**
1
Reducing power
0.924**
0.859*
0.890*
0.808
0.543
0.85
0.986**
0.972**
1
α-glucosidase
0.781
0.841*
0.795
0.513
0.427
0.565
0.546
0.412
0.533
1
As shown in Table 8 (data on the left side of the vertical dash line and below the horizontal dash line), total phenols, flavonoids and phenolic acids were all significantly positively correlated with DPPH, ABTS and reducing power (0.821 < R2 < 0.924, P<0.05), except that total flavonoids were not clearly correlated with ABTS. Furthermore, there was no significant correlation among total flavonols, flavanols, saponins and antioxidant capacities, implying that these three compounds might not be the necessary contributor to antioxidant capacity in KT phenolic extracts. As for α-glucosidase inhibition activity, only total flavonoids exhibited significant correlation with it.
Nevertheless, there are some limitations in our study need to be addressed. First of all, although the result of the present study revealed the low heavy metal content in most KT original plants, long-term studies in humans are essential on the safety and efficacy of the detected bioactive compounds for further substantiating health claims. In addition, the present manuscript only discussed the contents of heavy metal and bioactive constituents in fresh leaves of KT original plants, while those in the commercial KT products could be different due to varied processing methods. Therefore, investigations on the processing methods would further provide valuable information. Besides, investigations on KT original plants from different regions and cultivation conditions should also be investigated in the future for a more precise comparison. Last but not least, the health benefits of fresh leaves or processed products of KT original plants should be further validated through cell and animal models.
4 Conclusion
The present study conducted a systematic comparison analysis on the various compositions, including heavy metals, polysaccharides, phenolics, and saponins through colorimetry as well as UPLC-QTOF-MS/MS among six KT original plants; their antioxidant activities by DPPH, ABTS and FRAP, and antidiabetic activity by inhibitory effect against α-glucosidase were also determined. Overall, all KT original plants contained negligible heavy metals, whilst Cd might be a main heavy metal threat (5.476 ± 0.305 in IP, and 1.622 ± 0.048 in IC). Meanwhile, KT original plants possessed diverse levels of polysaccharides, phenolics and saponins, as well as antioxidant and antidiabetic capacities. Among which, IP and LJ, with the strongest antioxidant activity levels (IC50 607.41–780.44, and 547.06–754.00 mg/L), contained the highest levels of carbohydrates in polysaccharides (470.06 and 548.51 mg GLE/g), total phenolics (33.84 and 48.85 mg GAE/g), flavonoids (30.86 and 109.97 mg RE/g), phenolic acids (49.68 and 61.48 mg CAE/g), flavonols (18.47 and 19.19 mg RE/g), flavanols (0.18 and 0.14 mg CE/g), and saponins (90.81 and 97.33 mg GSE /g). UPLC-QTOF-MS/MS analysis tentatively identified 17 compounds, which belongs to phenolic acids, terpenoids, or flavonoids, in IP and LJ. Moreover, antidiabetic activity of IP (IC50 242.94 ± 23.98 mg/L) was the highest, attributed by the high interaction affinity to α-glucosidase of caffeoylquinic acid derivatives and saponins in IP. Correlation analysis indicated that total phenols, flavonoids and phenolic acids were the main influencing factor to antioxidant ability. In general, our study concluded that IP might be the better original resources for KT production, with higher levels of bioactive constituents as well as strong antioxidant and antidiabetic activities.
CRediT authorship contribution statement
Hui Liu: Writing – original draft, Investigation. Xiao Hu: Investigation. Mingyi Hu: Investigation. Xinxin Liu: Investigation. Jiangping Huang: Investigation. Zhixuan Ying: Investigation. Shuiqing Chen: Investigation. Lingguang Yang: Writing – review & editing, Supervision, Conceptualization. Peipei Yin: Writing – review & editing, Supervision.
Acknowledgements
This work was supported by National Natural Science Foundation of China (32301055), Natural Science Foundation of Jiangxi Province (20224BAB215006), Science and Technology Research Project of Education Department of Jiangxi Province (GJJ211644 and GJJ2201743) and College Students' Innovative Entrepreneurial Training Plan Program (X202410417004, X202310417007). We thank to Dr Ting Zhou from Nanjing Zhongshan Botanical Garden for providing plant materials in the present study, and also thank to the Professor Guomin Liu from Kuting Tea Research Institute, Hainan University for his useful advices.
Declaration of competing interest
The authors declare that they have no known competing financial interests or personal relationships that could have appeared to influence the work reported in this paper.
References
- Simultaneous qualitative and quantitative analyses of triterpenoids in Ilex pubescens by ultra-high-performance liquid chromatography coupled with quadrupole time-of-flight mass spectrometry. Phytochem. Analysis. 2017;29:168-179.
- [CrossRef] [Google Scholar]
- Structure characterization of flavonoid O-diglycosides by positive and negative nano-electrospray ionization ion trap mass spectrometry. J. Mass Spectrom.. 2001;36:1203-1210.
- [Google Scholar]
- Synthesis, characterisation, biological evaluation andin silicostudies of sulphonamide Schiff bases. Journal of enzyme inhibition and medicinal chemistry. J. Enzym. Inhib. Med. Ch.. 2020;35:950-962.
- [CrossRef] [Google Scholar]
- Characterization, antioxidant and hepatoprotective activities of polysaccharides from Ilex latifolia Thunb. Carbohydr. Polym.. 2014;101:990-997.
- [CrossRef] [Google Scholar]
- Crude triterpenoid saponins from Ilex latifolia (Da Ye Dong Qing) ameliorate lipid accumulation by inhibiting SREBP expression via activation of AMPK in a non-alcoholic fatty liver disease model. Chin. Med.. 2015;10:23.
- [CrossRef] [Google Scholar]
- Health benefits of bioactive compounds from the genus Ilex, a source of traditional caffeinated beverages. Nutrients. 2018;10:1682.
- [CrossRef] [Google Scholar]
- Evaluation of metal content in tea samples commercialized in sachets using multivariate data analysis techniques. Microchem. J.. 2019;151:10428.
- [CrossRef] [Google Scholar]
- Heavy metals, Their phytotoxicity, and the role of phenolic antioxidants in plant stress responses with focus on cadmium: review. Molecules. 2023;28:3921.
- [CrossRef] [Google Scholar]
- Comparative assessment of essential and heavy metals in fruits from different geographical origins. Environ. Monit. Assess.. 2013;185:9139-9160.
- [CrossRef] [Google Scholar]
- Seasonal variations in metabolite profiling of the fruits of Ligustrum lucidum Ait. Rapid Communications in Mass Spectrometry Rcm.. 2011;25:1701-1714.
- [CrossRef] [Google Scholar]
- Antioxidative glycosides from the leaves of Ligustrum robustum. J. Nat. Prod.. 2003;66:851-854.
- [CrossRef] [Google Scholar]
- Study of the collision-induced radical cleavage of flavonoid glycosides using negative electrospray ionization tandem quadrupole mass spectrometry. J. Mass Spectrom.. 2003;38:43-49.
- [CrossRef] [Google Scholar]
- New benzoic acid and caffeoyl derivatives with anti-inflammatory activities isolated from leaves of Ilex kaushue. Nat. Prod. Res.. 2022;36:3013-3021.
- [CrossRef] [Google Scholar]
- Anti-fouling effects of saponin-containing crude extracts from tropical Indo-Pacific sea cucumbers. Marine Drugs.. 2020;18:181.
- [CrossRef] [Google Scholar]
- PubChem in 2021: new data content and improved web interfaces. Nucleic Acids Res.. 2021;49:D1388-D1395.
- [CrossRef] [Google Scholar]
- The inhibitory effects of ethanol extracts from sorghum, foxtail millet and proso millet on α-glucosidase and α-amylase activities. Food Chem.. 2011;124:1647-1651.
- [CrossRef] [Google Scholar]
- Comparison of infusions from black and green teas (Camellia sinensis L. Kuntze) and Erva-mate (Ilex paraguariensis A. St.-Hil.) based on the content of essential elements, secondary metabolites, and antioxidant activity. Food Anal. Method.. 2017;10:3063-3070.
- [CrossRef] [Google Scholar]
- Structural features determining thermal adaptation of esterases. Protein Eng. Des. Sel.. 2015;29:65-76.
- [CrossRef] [Google Scholar]
- Estimation of uronic acids using diverse approaches and monosaccharide composition of alkali soluble polysaccharide from Vitex negundo Linn. Carbohyd. Polym.. 2017;165:205-212.
- [CrossRef] [Google Scholar]
- Quantitative analysis of five kudinosides in the large-leaved Kudingcha and related species from the genus Ilex by UPLC-ELSD. Phytochem Anal.. 2012;23:677-683.
- [CrossRef] [Google Scholar]
- Application of UHPLC-ESI-Q-TOF-MS to identify multiple constituents in processed products of the herbal medicine Ligustri Lucidi Fructus. Molecules. 2017;22:689.
- [CrossRef] [Google Scholar]
- Tea polysaccharides from Taiping Houkui may serve as a potential candidate for regulation of lipid metabolism: Roles of gut microbiota and metabolite in vitro. Journal of Functional Foods.. 2023;102:105469
- [CrossRef] [Google Scholar]
- Rapid screening of potential phosphodiesterase inhibitors from the roots of Ilex pubescensHook. et Arn. using a combination of ultrafiltration and LC–MS. Evid-Based Compl. Alt.. 2017;2017:1-8.
- [CrossRef] [Google Scholar]
- Determination of polyphenolic content and antioxidant activity of kudingcha made from Ilex kudingcha C.J. Tseng. Food Chem.. 2009;112:35-41.
- [CrossRef] [Google Scholar]
- Commercialized non-Camellia tea: traditional function and molecular identification. Acta. Pharm. Sin. b.. 2014;4:227-237.
- [CrossRef] [Google Scholar]
- Chemical profile, antioxidant activity and stability in stimulated gastrointestinal tract model system of three Verbascum species. Ind. Crop. Prod.. 2016;89:141-151.
- [CrossRef] [Google Scholar]
- Ministry of Agriculture of the People’s Republic of China (MAPRC). The Limit of Chromium, Cadmium, Mercury, Arsenic and Fluoride in Tea; NY 659-2003; MAPRC: Beijing, China, 2003. (In Chinese).
- Ministry of Agriculture of the People’s Republic of China (MAPRC). Green Food: Tea; NY/T 288-2012; MAPRC: Beijing, China, 2012. (In Chinese).
- National Health and Family Planning Commission of the People’s Republic of China (NHFPCPRC) and China Food and Drug Administration (CFDA). National Standard for Food Safety: Limit of Contaminants inFood; GB2762-2022; NHFPCPRC and CFDA: Beijing, China, 2022. (In Chinese).
- Tea. In: Caballero B., ed. Encyclopedia of Human Nutrition ((Third Edition).). Waltham: Academic Press; 2013. p. :260-263.
- [CrossRef] [Google Scholar]
- Medicinal properties of whole fruit extracts of Nauclea latifolia Smith.: Antimicrobial, antioxidant and hypoglycemic assessments. S. Afr. J. Bot.. 2019;121:105-113.
- [CrossRef] [Google Scholar]
- Ilex Vomitoria Ait. (Yaupon): A Native North American Source of a Caffeinated and Antioxidant-Rich Tea. Econ. Bot.. 2009;63:130-137.
- [CrossRef] [Google Scholar]
- Antioxidant and anti-inflammatory properties of Ilex guayusa tea preparations: a comparison to Camellia sinensis teas. Food. Funct.. 2017;8:4601-4610.
- [CrossRef] [Google Scholar]
- Ilex Paraguariensis exposition to As and Cd in a closed soilless system. Chemosphere.. 2020;258:127284
- [CrossRef] [Google Scholar]
- Peralbo-Molina, á., Priego-Capote F., de Castro M.D. Luque, 2012. Tentative identification of phenolic compounds in olive pomace extracts using liquid chromatography-tandem mass spectrometry with a quadrupole-quadrupole-time-of-flight mass detector. J. Agric. Food. Chem. 60, 11542-11550. doi: 10.1021/jf302896m.
- Naringenin inhibits α-glucosidase activity: A promising strategy for the regulation of postprandial hyperglycemia in high fat diet fed streptozotocin induced diabetic rats. Chem-Biol. Interact.. 2014;210:77-85.
- [CrossRef] [Google Scholar]
- Purification, characterization, and bioactivity of Liupao tea polysaccharides before and after fermentation. Food Chem.. 2021;353:129419
- [CrossRef] [Google Scholar]
- Purple corn (Zea maysL.) phenolic compounds profile and its assessment as an agent against oxidative stress in isolated mouse organs. J. Med. Food.. 2012;15:206-215.
- [CrossRef] [Google Scholar]
- Non-Camellia Tea in China: traditional usage, phytochemistry, and pharmacology. Chin. Herb. Med.. 2019;11:119-131.
- [CrossRef] [Google Scholar]
- Isolation and Identification of Phenolic Glucosides from Thermally Treated Olive Oil Byproducts. J. Agric. Food Chem.. 2013;61:1235-1248.
- [CrossRef] [Google Scholar]
- Reprint of “Hurdles and pitfalls in measuring antioxidant efficacy: A critical evaluation of ABTS, DPPH, and ORAC assays”. J. Funct. Foods.. 2015;18:782-796.
- [CrossRef] [Google Scholar]
- In vitro bioaccessibility of Al, Cu, Cd, and Pb following simulated gastro-intestinal digestion and total content of these metals in different Brazilian brands of yerba mate tea. Food. Chem.. 2019;281:285-293.
- [CrossRef] [Google Scholar]
- Ligand docking and binding site analysis with PyMOL and Autodock/Vina. J. Comput. Aided. Mol. Des.. 2010;24:417-422.
- [CrossRef] [Google Scholar]
- Identification and fragmentation pattern analysis of iridoid glycosides from fructus ligustri lucidi by UPLC/ESI-QTOF-MS. Journal of Liquid Chromatography and Related Technologies.. 2014;37:1763-1770.
- [CrossRef] [Google Scholar]
- Comparative analysis of bioactive phenolic compounds composition from 26 medicinal plants. Saudi. J. Biol. Sci.. 2018;25:631-641.
- [CrossRef] [Google Scholar]
- Benzenesulfonamide derivatives as potent acetylcholinesterase, α-glycosidase, and glutathione S-transferase inhibitors: biological evaluation and molecular docking studies. J. Biomol. Struct. Dyn.. 2020;39:5449-5460.
- [CrossRef] [Google Scholar]
- AutoDock Vina: improving the speed and accuracy of docking with a new scoring function, efficient optimization, and multithreading. J. Comput. Chem.. 2010;31:455-461.
- [CrossRef] [Google Scholar]
- Fast screening of total flavonols in wines, tea-infusions and tomato juice by flow injection/adsorptive stripping voltammetry. Anal. Chim. Acta.. 2005;551:124-131.
- [CrossRef] [Google Scholar]
- Modulation of gut microbiota by Ilex kudingcha improves dextran sulfate sodium-induced colitis. Food. Res. Int.. 2019;126:108595
- [CrossRef] [Google Scholar]
- Ultrasound-assisted polysaccharide extraction from Cercis chinensis and properites, antioxidant activity of polysaccharide. Ultrasoni. Sonochem.. 2023;96:106422
- [CrossRef] [Google Scholar]
- Evaluation of antioxidant active ingredients of spikenard essential oil by ultra-fast gas chromatography electronic nose and radical scavenging mechanism. Ind. Crop. Prod.. 2020;151:112489
- [CrossRef] [Google Scholar]
- Preventive effect of small-leaved Kuding tea (Ligustrum robustum) on high-diet-induced obesity in C57BL/6J mice. Food. Sci. Nutr.. 2020;8:4512-4522.
- [CrossRef] [Google Scholar]
- Chemical composition, bioactivity and safety aspects of kuding tea-from beverage to herbal extract. Nutrients.. 2020;12:2796.
- [CrossRef] [Google Scholar]
- Xiao, Y., G. Xing, X. Rui, et al., 2014. Enhancement of the antioxidant capacity of chickpeas by solid state fermentation with Cordyceps militaris SN-18. Journal of Functional Foods. 10, 210-222. https://doi.org/10.1016/j.jff.2014.06.008.
- Inhibitory activities of caffeoylquinic acid Derivatives from Ilex kudingcha C.J. Tseng on α-glucosidase from saccharomyces cerevisiae. J. Agric. Food Chem.. 2015;63:3694-3703.
- [CrossRef] [Google Scholar]
- Crystal structures of isomaltase from Saccharomyces cerevisiae and in complex with its competitive inhibitor maltose. FEBS J.. 2010;20:4205-4214.
- [CrossRef] [Google Scholar]
- Identification and inhibitory activities of ellagic acid- and kaempferol-derivatives from Mongolian oak cups against α-glucosidase, α-amylase and protein glycation linked to type II diabetes and its complications and their influence on HepG2 cells’ viability. Arab. J. Chem.. 2018;11:1247-1259.
- [CrossRef] [Google Scholar]
- Bioactive components and antioxidant activities of oak cup crude extract and its four partially purified fractions by HPD-100 macroporous resin chromatography. Arab. J. Chem.. 2019;12:249-261.
- [CrossRef] [Google Scholar]
- Extraction optimization of tea saponins from Camellia oleifera seed meal with deep eutectic solvents: Composition identification and properties evaluation. Food Chem.. 2023;427:136681
- [CrossRef] [Google Scholar]
- RAPD Analysis of Germplasm Resources of Kudingcha Species in Oleaceae. Agr. Sci. China.. 2009;8:784-792.
- [CrossRef] [Google Scholar]
- Simultaneous qualitative and quantitative evaluation of Ilex kudingcha C. J. tseng by using UPLC and UHPLC-qTOF-MS/MS. J. Pharmaceut. Biomed.. 2018;155:15-26.
- [CrossRef] [Google Scholar]
- Comparison of major phenolic constituents and in vitro antioxidant activity of diverse Kudingcha genotypes from Ilex kudingcha, Ilex cornuta, and Ligustrum robustum. J Agric Food Chem.. 2009;57:6082-6089.
- [CrossRef] [Google Scholar]
- In vitro and in vivo anti-cancer activities of Kuding tea (Ilex kudingcha C.J. Tseng) against oral cancer. Exp. Ther. Med.. 2014;7:709-715.
- [CrossRef] [Google Scholar]
Appendix A
Supplementary data
Supplementary data to this article can be found online at https://doi.org/10.1016/j.arabjc.2024.105914.
Appendix A
Supplementary data
The following are the Supplementary data to this article:Supplementary Data 1
Supplementary Data 1


