

Translate this page into:
Competition effect between AsO2− and NH4+ in oxidation system
⁎Corresponding author at: Kejia Ave. 156, Ganzhou Jiangxi, Jiangxi Key Laboratory of Mining & Metallurgy Environmental Pollution Control, Jiangxi University of Science & Technology, 341000, PR China. cyn70yellow@gmail.com (Yunnen Chen)
-
Received: ,
Accepted: ,
This article was originally published by Elsevier and was migrated to Scientific Scholar after the change of Publisher.
Abstract
The environmental effects of characteristic pollutants arsenite (AsO2−) and ammonium (NH4+) produced in the process of tungsten smelting cannot be ignored. Through the ozonation experiment of AsO2− and NH4+, it is confirmed that AsO2− with lower redox potential (-0.560 V) is more readily oxidized than NH4+ (-0.283 V), leading to the coexistent AsO2− inhibiting the ozonation of NH4+. In order to improve the oxidation efficiency of NH4+, prepared CeO2-MnO2 composite metal oxide catalysts before and after reaction were characterized by SEM, EDS, FT-IR technics, and investigated for the catalytic ozonation of wastewater containing AsO2− and NH4+. When the initial AsO2− concentration is maintained at 2 mg/L and the NH4+ concentration increases from 25 to 150 mg/L, the conversion of AsO2− to AsO43− remains above 97%, while the NH4+ removal rate decreases from 94.38% to 47.01%, in which confirms the competitive effect of AsO2− oxidation prior to NH4+. Moreover, the test of catalyst dosage reconfirms the result of AsO2− oxidation superior to NH4+, and the optimum catalyst dosage is 1.5 g/L. After the test of tert-butyl alcohol (TBA), the possible oxidation mechanism is proposed that AsO2− is oxidized primarily by O3, whereas the oxidation of NH4+ is mainly ascribed to the hydroxyl radical (·OH) obtained from catalytic decomposition of O3 by CeO2-MnO2 composite metal oxide catalysts.
Keywords
AsO2−
NH4+
CeO2-MnO2
Competition effect
Catalytic ozonation

1 Introduction
As an important rare metal, tungsten is widely used in electronic optical materials, special alloys, new functional materials and other fields (Jing et al., 2017; Plattes et al., 2007; Saepurahman et al., 2010). Arsenic, as a companion element of tungsten, often appears in wastewater as sodium arsenate impurity in the process of secondary ammonium paratungstate (APT) production due to alkali impregnation and decomposition. In the subsequent washing of the exchange column after desorbing tungstate from the resin with a desorbent (NH3·H2O + NH4Cl mixed solution), a large amount of wastewater containing-ammonium (NH4+) is generated, which has a serious impact on the surrounding environment (Jing et al., 2018; Shen et al., 2018). Since AsO2− is more toxic and mobile than arsenate (AsO43−), and traditional treatments such as coagulation/flocculation (Wan et al., 2011), ion exchange (An et al., 2005) and oxidation-filtration (Chen and Xiong, 2016) are less efficient for AsO2− than AsO43−, it is necessary to first oxidize AsO2− to AsO43− (Chen and Xiong, 2016; Nickson et al., 1998).
In contrast, among many methods for degrading low concentration NH4+ from water such as ion exchange (Malekian et al., 2011; Zheng et al., 2012) and biological denitrification method (He et al., 2020; Sri Shalini and Joseph, 2018), catalytic ozonation process (COP) (Chen et al., 2018; Ichikawa et al., 2014) occupies a certain advantages to some extent. As reported, Cheng et al. (Cheng et al., 2019) purchased iron-manganese (Fe-Mn) oxides filter media from a pilot-scale groundwater used as catalysts to simultaneously degrade the wastewater containing iron, manganese, AsO2− and NH4+, achieving a good efficiency in application. Meanwhile, various catalysts in the last few decades, including TiO2@Fe3O4, ZnO, and Pd/TiO2, have been studied for the removal of different pollutants during COP (Ahmadi et al., 2017; Majid, 2018; Rao et al., 2009; Taguchi and Okuhara, 2000; Xun et al., 2017). But, to the best of our knowledge, there are few reports on the simultaneously catalytic ozonation degradation of AsO2− and NH4+ in water utilizing CeO2-MnO2 composite metal oxide catalysts. And, interesting, in the same oxidation system, whether there is competition oxidation between AsO2− and NH4+ in the wastewater? Who is the first to be oxidation? Does their coexistence affect each other's oxidation efficiency? At present, these issues have not answer and we believe they are worth researching.
Accordingly, aiming for the removal of NH4+ and conversion rate of AsO2− to AsO43−, the competition effect between AsO2− and NH4+ in the same ozonation system was studied. The effect of variously initial NH4+ concentration / catalyst dosage (initial AsO2− concentration 2 mg/L) on the catalytic ozonation of NH4+ over the CeO2-MnO2 composite metal oxides catalysts was researched. Based on the experimental results, the possible oxidation mechanism of AsO2− and NH4+ was also discussed. It should be noted that this work would not discuss the reusability of the prepared catalyst since it had been confirmed in another work of our research group, which is also being published now, and all experiment conditions used on the CeO2-MnO2 composite metal oxide catalysts are optimum.
2 Experiment
2.1 Materials
Analytical grade chemicals of MnCl2, CeCl3·7H2O, NH4Cl, and Na2CO3, et al. from Shantou Xiqiao Science Co., Ltd., Guangdong, China were used without further treatment. The NaAsO2 was purchased from Iron & Steel Research Institute of China. All solvents were deionized water.
2.2 Catalysts preparation and characterization
In this study, CeO2-MnO2 composite metal oxide catalysts were prepared according to co-precipitation method (Zeng et al., 2020). Typically, mixed solution of MnCl2 and CeCl3·7H2O with the molar ratio of 1:2 was prepared through dissolving their solid chemicals by deionized water. The precipitation solution of 15 wt% Na2CO3 was successively added dropwise into the metal salt solution over a six-link constant temperature agitator until the pH value of the solution was about 10.50, stirred for 2 h and then aged for 24 h at 25℃. The precipitate was separated by suction filtration and washed several times with deionized water and ethanol. Then the precipitate was dried in oven at 90℃ for 24 h, crushed and calcined in muffle furnace at 400℃ for 3 h to obtain the catalyst of CeO2-MnO2.
The micrographs of the precipitate before and after reaction were measured with a Scanning Electron Microscope (SEM, MLA650F, FEI, Hillsboro, USA). Acceleration voltage of 15 kV was utilized.
The composition of chemical elements was recorded using Energy Dispersive X-ray Spectroscopy on a QUANTAX instrument (EDS, QUANTAX, Bruker, Germany).
Fourier Translation Infrared spectrum (FT-IR) was determined on a NEXUS-670 FT-IR spectrometer (FT-IR, NEXUS-670, Thermo Nicolet, USA) from 400 to 4000 cm−1. The dried samples and KBr chemicals were mixed and pressed into a tablet. The patterns were taken with a resolution of 4 cm−1.
2.3 Ozonation of AsO2− and NH4+ in wastewater
Three kinds of simulated wastewater (all of them are 100 ml) were treated by ozonation (without catalyst): AsO2− solution with concentration of 2 mg/L, NH4+ solution with concentration of 50 mg/L, mixture solution of 2 mg/L AsO2− and 50 mg/L NH4+ (Li et al., 2017; Yao and Chen, 2007; Zhong et al., 2014). The effects of ozonation time on the oxidation of AsO2− and NH4+ were investigated.
2.4 Catalytic ozonation of AsO2− and NH4+ in wastewater
The catalytic ozonation of simulated wastewater containing 2 mg/L AsO2− and 50 mg/L NH4Cl was carried out. Effect of initial concentration of NH4+ on catalytic ozonation of AsO2− and NH4+ at the initial concentration of AsO2− 2 mg/L was studied.
The experimental setup is shown in Fig. 1. O3 was generated from ozone generator (FL-815ET, FeiLi, Shengzhen, China). Moreover, the ozonation system in schematic illustration that was including an air pump with control valve, valves, KI solution, tubing, airflow meter and exhaust gas absorption bottles was applied for performing the experiments. The corresponding ozone concentration in reactor was obtained by adjusted the flow rate of feed air. What's more, the residual ozone concentration was determined by iodometric approach with potassium iodide solution (Flamm, 1977). KI solution was utilized for absorbing the residual ozone in the off-gas. In this research, when the decomposition rate of ozone in reactor was calculated, a mass balance of ozone in system was applied according to Eq. (1) (Ahmadi et al., 2017). Furthermore, the consumption rate of ozone (wt%) was computed as a ratio of decomposed ozone to total fed ozone, as illustrated in Eq. (2) (Majid, 2018).
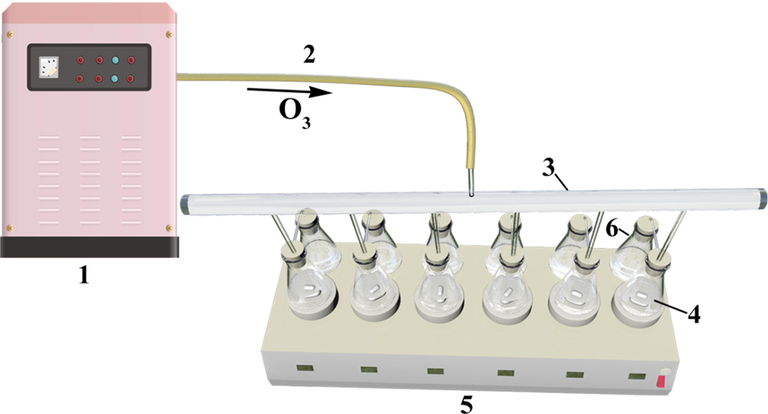
Schematic diagram of reaction for catalytic ozonation of AsO2− and NH4+. (1-Ozonator, 2-Silicone tube, 3-Six-hole water distributor, 4-Conical flask, 5-Six thermostatic stirrer, 6-Ozone absorption bottle (KI liquid)).
2.5 Analysis
The concentrations of AsO2−, total arsenic, ammonium (NH4+), nitrate (NO3–), nitrite (NO2–) in solution were determined after reaction. After catalytic ozonation process, solution samples (supernatant sealed in bottle) were transferred into a High Performance Liquid Chromatography (iChrom 5100, YiLit, China) equipped with a conductivity detector for measuring the concentrations of nitrate (NO3–) and nitrite (NO2–). It is worth to mention that the used samples all were quenched quickly with 0.2 M Na2S2O3 to eliminate further side reactions prior to next operation. Meanwhile, the content of experiment samples containing Nitrate (NO3–) and Nitrite (NO2–) were also further confirmed by ultraviolet spectrophotometer (SP-756PC, Shanghai Spectrum Instrument Co. Ltd., Shanghai, China) according to Ultraviolet (UV) spectrophotometry (HJ/T 346-2007) (Liu et al., 2019) and spectrophotometer (722 N, INESA, Shanghai, China) based on spectrophotometry (GB 7493-87) (Ichikawa et al., 2014), respectively. On the one hand, the concentration of AsO2− was detected by using an inductively coupled plasma-atomic emission spectrometry (ICP-AES) instrument (ICPS-7000, Shimadzu, Japan) according to some previous references (Chen and Xiong, 2016; Nie et al., 2015; Zhou et al., 2018). On the other hand, Hydride Generation-Atomic Fluorescence Spectrometry (HG-AFS) was utilized to confirmed the concentration of AsO2− on account of Water Quality - Determination of Mercury, Arsenic, Selenium, Bismuth and Antimony - Atomic Fluorescence Spectrometry (HJ694-2014) (Yao et al., 2020). Furthermore, the concentration of total arsenic as initial AsO2− concentration was measured by spectrophotometer (722 N, INESA, Shanghai, China) based on Water quality - Determination of total arsenic - Silver diethyldithiocarbamate spectrophotometric method (GB7485-87) (Merry and Zarcinas, 1980). The concentration of NH4+ in solution was determined by visible spectrophotometer (722 N, INESA, China) with a wavelength of 420 nm using Nessler’s reagent spectrophotometry method (HJ 535-2009) (Liu et al., 2019).
After catalytic ozonation / ozonation reaction in water containing AsO2− or/and NH4+, the conversion rate of AsO2− was calculated with Eq. (3). According to the principle of nitrogen balance, the percentages of NH4+ (PNH4+), NO– (PNO3−), NO2– (PNO2−), gaseous nitrogen (Pgaseous nitrogen) were calculated by using Eqs. (4)–(8).
3 Results and discussion
3.1 Comparison of redox potential
It is well known that the redox potential represents the macroscopic redox capacity of a substance. The higher the redox potential, the stronger the oxidation strength is and the easier it is to be reduced. On the contrary, the lower the redox potential, the stronger the reduction strength is and the easier it is to be oxidized.
From Table 1 can be seen that the redox potential of AsO2−-AsO43− (-0.560 V) lower than that of NH4+–NO2−, NH4+–NO3−, NH4+–N2, indicating that AsO2− is most easily oxidized.
Reduced state
Oxidation state
Redox potential (V)
References
AsO2−
AsO43−
−0.560
(Chen and Chai, 2008)
NH4+
N2
−0.092
(Eisenmann et al., 1995)
NH4+
NO3–
−0.283
(Eisenmann et al., 1995)
NH4+
NO2–
−0.095
(Eisenmann et al., 1995)
3.2 Effect of ozonation time on the oxidation of AsO2− and NH4+
The effects of ozonation time on the oxidation of AsO2− and NH4+ in the solution containing AsO2−, solution containing NH4+, solution containing both AsO2− and NH4+, respectively were investigated, as shown in Fig. 2 (a), (b), (c). It can be seen from Fig. 2 (a) that the efficiency of AsO2− oxidation to AsO43− can reach 78.22% after ozonation for 10 min. When the ozonation time is extended to 20 min, the oxidation efficiency of AsO2− is as high as 96.93%. In Fig. 2 (b), the ozonation reaction of NH4+ reaches equilibrium at about 30 min, and the removal rate of NH4+ is 18.41%.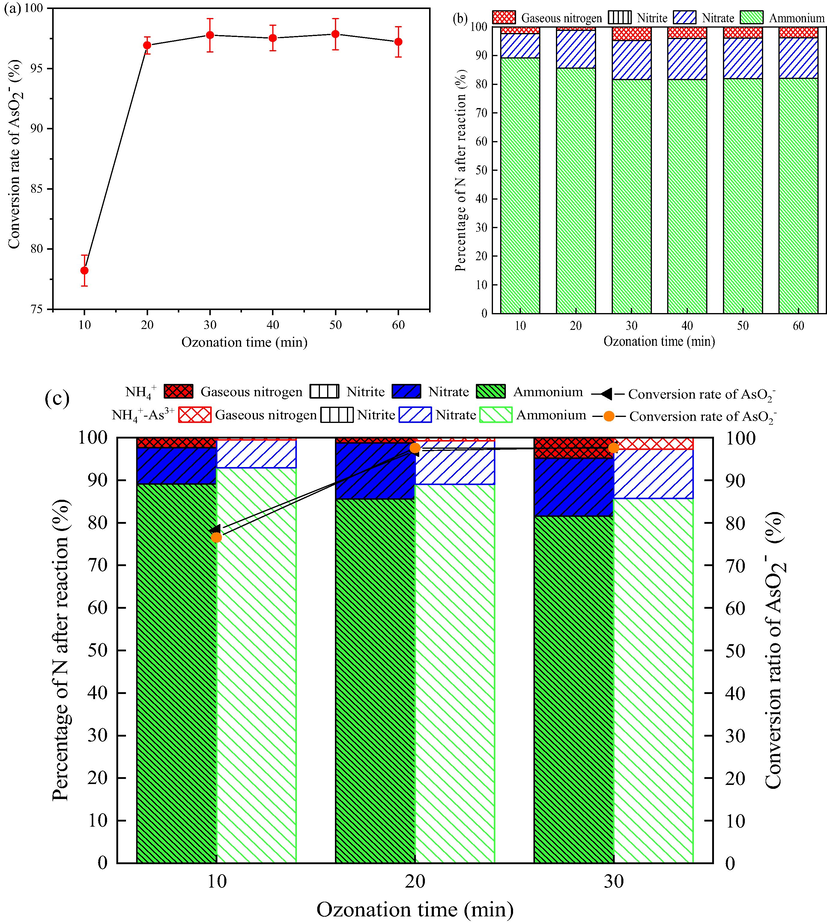
Effect of ozonation time on oxidation of AsO2− and NH4+. (a) the treatment of a solution containing AsO2−; (b) the treatment of a solution containing NH4+; (c) the treatment of a solution containing AsO2− and NH4+. (Initial concentration of AsO2− and NH4+ 2 mg/L and 50 mg/L, respectively, pH 9, flow rate of ozone 12 mg/min, stirring speed 600 r/min).
As shown in Fig. 2 (c), the ozonation efficiency of AsO2− remains stable under the coexistence of NH4+, indicating that the presence of NH4+ does not affect the ozonation of AsO2−. On the contrary, the coexistence of AsO2− in the solution reduced the removal rate of NH4+, that is, the presence of AsO2− inhibited the ozonation of NH4+.
Fig. 2 (a), (b), (c) indicates that AsO2− is more easily oxidized by ozone than NH4+ in the ozonation system, which is consistent with the result of the redox potential (Table 1). Fig. 2 also shows that ozone has a greater oxidation effect on AsO2− and a smaller oxidation effect on NH4+.
As for the products of NH4+ ozonation, the components of NH4+ solution are similar to mixed solution of NH4+ and AsO2−. That is, the removal rate of NH4+ is low and the content of nitrites (NO2–) is almost negligible value, but also the gaseous nitrogen is not high except for the nitrates (NO3–) relatively high. Besides, hydroxyl ions (OH–) that are performed with high concentrations in alkaline solution play a critical role in conversion of O3 molecules into ·OH referring to Eqs. (10) and (11) (Chen et al., 2018; LI You-ming et al., 2016).
The degradation process of NH4+-N in reactive system via ozone oxidation is carried out by O3 (Eq. (12)) or ·OH (Eq.(13)) (Lee, 2003). Furthermore, ·OH oxidizes molecular ammonia (NH3) in ozonation reaction system to the intermediate product nitrite, which is oxidized rapidly to nitrate (Eqs. (14) and (15)) (Khuntia et al., 2013a, 2013b). It reveals that the reason why nitrite nitrogen in reactive solution could hardly be measured.
Based on the low efficiency of NH4+ ozonation, the catalytic ozonation technology was used to improve the oxidation efficiency of NH4+.
3.3 Effect of initial NH4+ concentration on catalytic ozonation of AsO2− and NH4+
Pollutant concentration is an important parameter in the process of catalytic ozonation. Fig. 3 shows the effect of initial concentration of NH4+ on catalytic ozonation of AsO2− and NH4+ at the initial concentration of AsO2− 2 mg/L.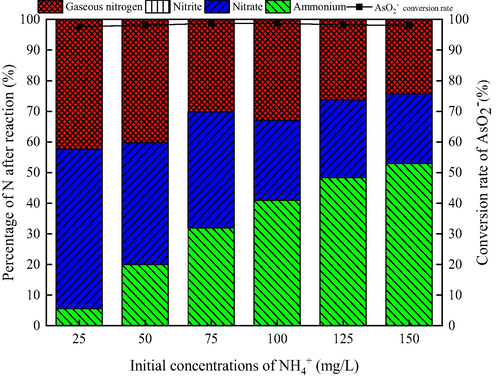
Effect of the initial NH4+ concentration on oxidation of AsO2− and NH4+. (AsO2− concentration 2 mg/L, pH 9, flow rate of ozone 12 mg/min, stirring speed 600 r/min, catalyst dosage 1.50 g/L, ozonation time 30 min).
As can be seen from Fig. 3, when the initial concentration of NH4+ increases from 25 mg/L to 150 mg/L, the conversion rate of AsO2− to AsO43− remains above 97%, while the NH4+ removal rate decreases from 94.38% to 47.01%. The results show that the oxidation of AsO2− is hardly affected by the initial concentration of NH4+, which confirms once again the competitive effect of AsO2− oxidation prior to NH4+.
The comparison of Fig. 2 (c) and Fig. 3 shows that when the initial concentration of NH4+ is 50 mg/L, the efficiency of ozonation and catalytic ozonation of NH4+ are about 20% and 80%, respectively. The catalytic ozonation greatly improves the removal rate of NH4+, indicating the major role of ·OH obtained from the catalytic decomposition of O3 by CeO2-MnO2 composite metal oxide catalysts in the oxidation of NH4+.
As for the products of NH4+ catalytic ozonation, when the initial NH4+ concentration increases, the content of NO3– and gaseous nitrogen gradually decreases, NO2– is almost zero. Ultimately, we choose the initial concentration of NH4+ 50 mg/L as the following experiment concentration.
3.4 Effect of catalyst dosage on catalytic ozonation of AsO2− and NH4+
In the heterogeneous catalytic ozonation system, the catalyst can promote the decomposition of ozone to produce ·OH. Therefore, it is necessary to study the dosage of the catalyst in the catalytic ozone oxidation of NH4+ and AsO2− to AsO43−. As shown in Fig. 4, the effect of the catalyst dosage has a great influence on the catalytic ozonation of AsO2− and NH4+ at the initial concentration of AsO2− 2 mg/L and NH4+ 50 mg/L.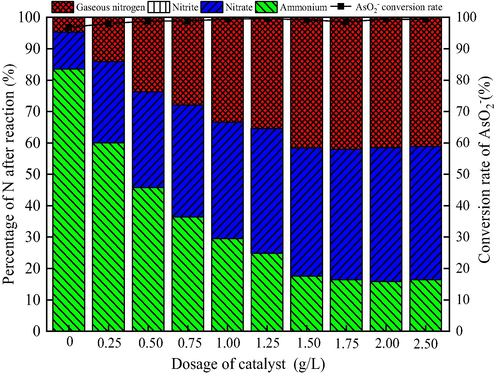
Effect of dosage of catalyst on catalytic ozonation of AsO2− and NH4+. (AsO2− concentration 2 mg/L, NH4+ concentration 50 mg/L, pH 9, flow rate of ozone 12 mg/min, stirring speed 600 r/min , ozonation time 30 min).
It can be seen from Fig. 4 that the ratio of remaining NH4+ in the solution after the reaction gradually decreases with the increase of the catalyst dosage and then becomes stable. Ozone oxidation alone, that is, when the catalyst dosage is 0 g/L, the removal rate of NH4+ is only 16.51%, and the proportion of gaseous nitrogen is only 4.68%. The efficiency of AsO2− being oxidized to AsO43− is 96.82%. When the catalyst dosage is 1.50 g/L, the proportions of residual NH4+, NO3–, and gaseous nitrogen after the reaction are 17.57%, 40.79%, 41.64%, respectively, and the proportion of NO2– in the solution is negligible, less than 0.05%. Meanwhile, the AsO2− is oxidized to AsO43− with 99.18% efficiency. Thus, the dosage of the catalyst has not a significant effect on the efficiency of AsO2− being oxidized to AsO43−, but the dosage of the catalyst has a remarkable effect on the conversion rate of NH4+. When the catalyst is insufficient, it cannot fully catalyze ozone to produce ·OH, resulting in poorly catalytic ozone oxidation of NH4+. Increasing the dosage of catalyst has sped up the decomposition of ozone and produces more ·OH, thereby increasing the conversion rate of NH4+ (Majid, 2018). This may be another an example that the oxidation of AsO2− is primarily ascribed to ozone effect, while the oxidation of NH4+ is depended on the ·OH produced from the catalytic ozonation of ozone. Continuing to increase the dosage of the catalyst, the NH4+ conversion rate does not increase significantly. Taking into account the cost of preparing the catalyst, the catalyst dosage in the subsequent tests is 1.50 g/L.
3.5 Comparison of characterized results before and after reaction
The morphologies of as-prepared CeO2-MnO2 composite metal oxide catalysts before and after reaction were evaluated by SEM. As observed in Fig. 5, both of image from before reaction and image from after reaction are mainly spherical particles and flocs, which are interwoven with each other, and some flocs are mixed and wrapped on the outer surface of the spherical particles. Thus, there are few significant changes in morphology of as-prepared CeO2-MnO2 composite metal oxide catalysts after reaction, which may be one of the reasons why the as-prepared catalyst can be recycled several times (at least 5 times) without inactivation.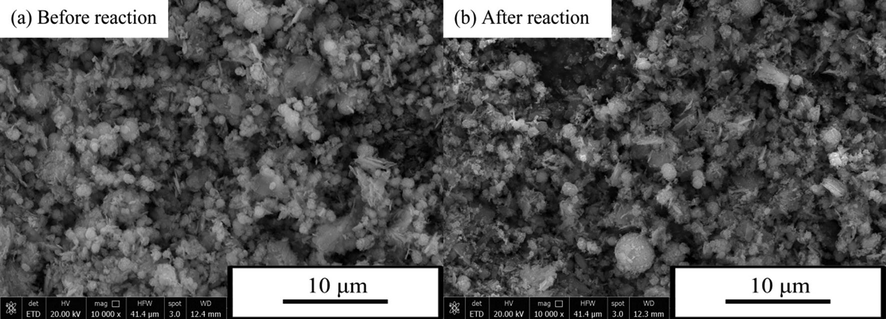
SEM images of as-prepared catalysts before reaction (a) and after reaction (b).
To identify the components of as-prepared Ce/MnOx composite metal oxide catalysts’ surface elements before and after reaction, EDS energy spectrums was performed in Fig. 6. As given in Fig. 6, EDS patterns for the as-prepared catalysts ((a) Before reaction, (b) After reaction), respectively, are obtained, and display that corresponding elements of their compounds have a remarkable discrepancy in the patterns of Fig. 6(a) and Fig. 6(b). It indicates that the reaction of catalytic ozone oxidation have been successfully carried out (Yang et al., 2017). In Fig. 6(a), four strong and different characterization peaks are obtained, corresponding to the Atomic percentage (%) of O-74.23, Na-8.99, Mn-10.86, Ce-5.92, respectively. In contrast, six kinds characterization peaks are observed in Fig. 6(b), including the Atomic percentage (%) of N-7.06, O-70.58, Na-0.28, Mn-12.85, As-0.27, Ce-8.97, respectively. Therefore, the results of FT-IR patterns are consistent with the experiment result.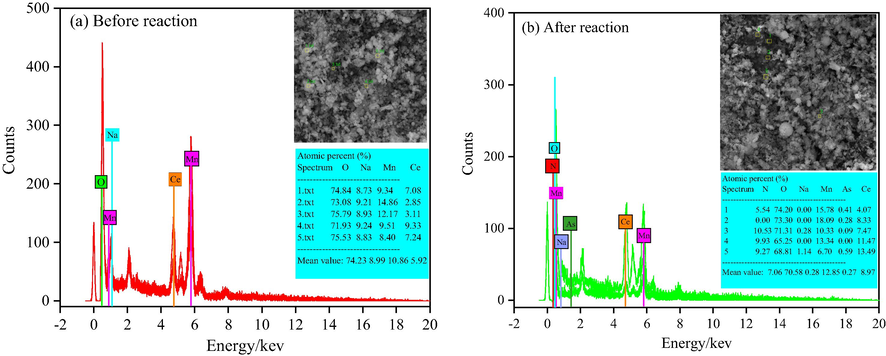
EDS patterns of as-prepared catalysts before (a) and after (b) reaction.
Fourier Transform Infrared spectroscopy (FT-IR), as an effective alternative and favorable supplement to XRD, is usually used to identify mainly functional groups of samples, resulting from the sensitivity of technic to amorphous and short-range components (Todorova et al., 2011). FT-IR spectra of the as-prepared catalysts ((a) Before reaction, (b) After reaction) are presented in Fig. 7. As shown in Fig. 7, the broad and strong bands at 3448 cm−1are ascribed to hydroxyl (–OH), and the bands both 3856 and 3737 cm−1 are attributed to the stretching vibrations of OH groups and physically adsorbed waters (Hussain et al., 2001; Ren et al., 2018). Additionally, as detected in Fig. 7(a), three bands with medium intensity at 635, 577 and 507 cm−1 are assigned to the Ce-Mn, Mn-O and Ce-O groups, respectively, based on Hussain et al. (Hussain et al., 2001; Julien et al., 2004; Todorova et al., 2011). In contrast, the corresponding three positions in Fig. 7(a) are merged into a relatively broad band at 522 cm−1 in Fig. 7(b), indicating that As-O group may successfully participate in oxidation reaction and finally retain in composite catalyst surface and lead to the disappearance of above other groups (Li et al., 2015). In addition, as illustrated in Fig. 7, intensity for catalyst structure are observed to be declined at 1609, 1363, 1022, and 854 cm−1,respectively. This phenomenon may be ascribed to the oxidation of O3 and catalytic oxidation of hydroxyl radical (·OH) (Dupont et al., 2007; Pehlivan et al., 2013).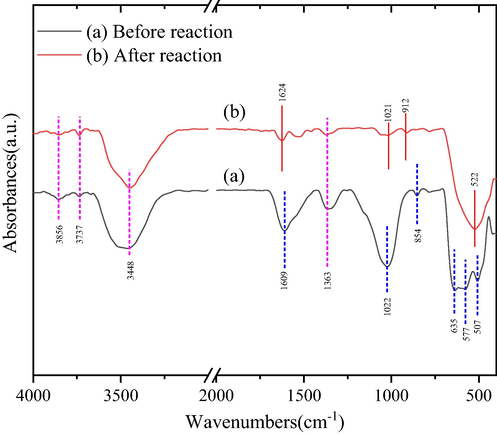
FT-IR spectra of as-prepared catalysts before reaction (a) and after reaction (b).
3.6 Discussion on the possible oxidation mechanism
In this research, to confirm if the presence of ·OH involved in COP for the oxidation/degradation of AsO2− and NH4+, the test concerning specific scavenger of hydroxyl radical (·OH) used for the COP, i.e. tert-butyl alcohol (TBA), were conducted (Majid, 2018). As illustrated in Fig. 8, even though the removal rate of NH4+ and the selectivity to gaseous nitrogen are suppressed significantly under the presence of 50 mg/L TBA, the conversion rate of AsO2− is almost not affected. When the initial concentration of TBA increases from 0 mg/L to 50 mg/L, the conversion rate of AsO2− to AsO43− remains above 97%, while the removal rate of NH4+ is declined from 79.08% to 51.73%, and the selectivity to gaseous nitrogen is decreased from 39.25% to 26.87%. The decrease could be elucidated by the fact that the TBA molecules compete with ammonium molecules to obtain ·OH (Chakma et al., 2017). Additionally, this result further confirms that the oxidation of AsO2− is superior to NH4+, and ascribed to the oxidation of ozone. The above result states that ·OH plays very important roles in the removal of NH4+-N during COP.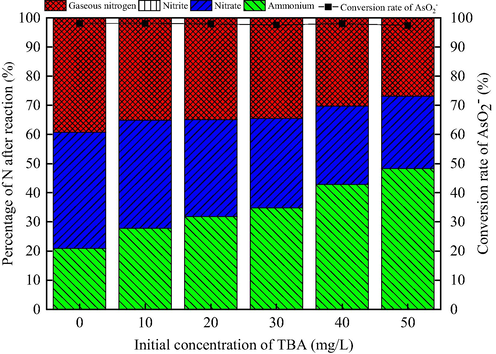
Effect of concentration of TBA on catalytic ozonation of AsO2- and NH4+. (AsO2− concentration 2 mg/L, NH4+ concentration 50 mg/L, pH 9, flow rate of ozone 12 mg/min, stirring speed 600 r/min , ozonation time 30 min, catalyst dosage 1.50 g/L).
Based on the lower redox potential of AsO2− than that of NH4+, the shorter ozonation time of AsO2− than that of NH4+, the higher removal rate of NH4+ over catalytic ozonation than ozonation, and higher stablity for catalytic ozonation efficiency of AsO2− in different NH4+ concentration, possible mechanisms for competitive effect of AsO2− and NH4+ from water are proposed, as shown in Fig. 9. Competitive oxidation system would be mainly composed by two different oxidation pathways, including I (ozonation of AsO2−) and II (catalytic ozonation of NH4+). In step I that AsO2− was mainly oxidized by O3 generated from ozonator, while the oxidation of NH4+ (step II) was primarily by ·OH obtained from the catalytic decomposition of O3 by CeO2-MnO2 composite metal oxide catalysts (Chen et al., 2018; Khuntia et al., 2013a, 2013b).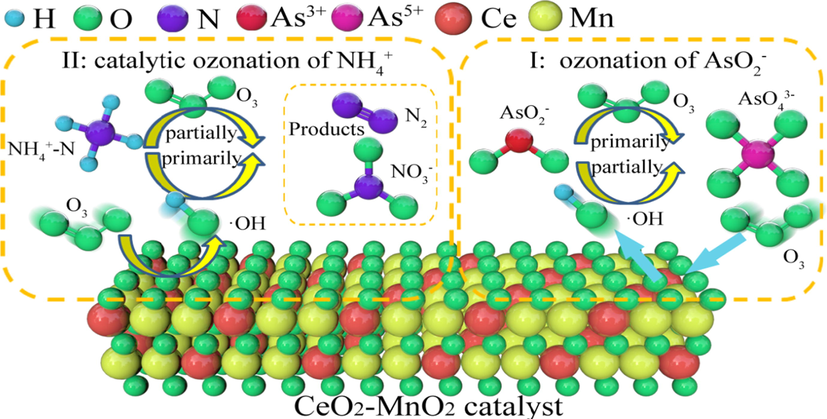
Possible oxidation mechanism for NH4+ and AsO2−.
4 Conclusions
CeO2-MnO2 composite metal oxide catalysts prepared were investigated for the catalytic ozonation of wastewater containing AsO2− (2 mg/L) and NH4+ (50 mg/L). Comparison of redox potential shows that AsO2− with lower redox potential is easily oxidized. The experimental result of ozonation time reveals that the oxidation of AsO2− is prior to NH4+-N. The presence of NH4+ cannot affect the ozonation of AsO2−, whereas the coexisting of AsO2− inhibits the ozonation of NH4+. The experiment test of catalyst dosage is consistent with the experiment essence of initial NH4+ concentration. The catalytic ozonation greatly improves the oxidation rate of NH4+, indicating the major role of ·OH obtained from the catalytic decomposition of O3 by CeO2-MnO2 composite metal oxide catalysts in the oxidation of NH4+. The possible competitive oxidation mechanism of AsO2− and NH4+ in water is proposed by the test of specific scavenger (TBA) of ·OH. It is considered that the oxidation of AsO2− is mainly by O3, while the removal of NH4+ in oxidation system is primarily due to the strong oxidation of hydroxyl radical (·OH). The treatment of oxidized AsO43− will be studied further.
CRediT authorship contribution statement
Caiqing He: Conceptualization, Validation, Formal analysis, Investigation, Visualization, Writing - original draft. Yunnen Chen: Formal analysis, Investigation, Visualization, Writing - review & editing. Lin Guo: Investigation, Methodology, Resources. Ruoyu Yin: Formal analysis, Investigation, Methodology, Resources. Tingsheng Qiu: Investigation, Visualization, Supervision, Validation.
Acknowledgements
This work was supported by the National Key Research and Development Program of China (grant number 2018YFC1903401) and the National Natural Science Foundation of China (No.51568023, 51864021), and the authors are grateful for the helpful suggestions and evaluations given by many anonymous reviewers.
Declaration of Competing Interest
The authors declare that they have no known competing financial interests or personal relationships that could have appeared to influence the work reported in this paper.
References
- Catalytic ozonation of high saline petrochemical wastewater using PAC@FeIIFe2IIIO4; Optimization, mechanisms and biodegradability studies. Sep. Purif. Technol.. 2017;177:293-303.
- [Google Scholar]
- Selective removal of arsenate from drinking water using a polymeric ligand exchanger. Water Res.. 2005;39:4993-5004.
- [Google Scholar]
- Mechanistic investigations in sono-hybrid (ultrasound/Fe2+/UVC) techniques of persulfate activation for degradation of Azorubine. Ultrason. Sonochem.. 2017;38:652-663.
- [Google Scholar]
- Adsorptive removal of As(III) ions from water using spent grain modified by polyacrylamide. J. Environ. Sci.. 2016;45:124-130.
- [Google Scholar]
- Migration and transformation of arsenic in groundwater. Nonferrous Metals.. 2008;1:109-122.
- [Google Scholar]
- Low-temperature conversion of ammonia to nitrogen in water with ozone over composite metal oxide catalyst. J. Environ. Sci.. 2018;66:265-273.
- [Google Scholar]
- Arsenite removal from groundwater by iron–manganese oxides filter media: Behavior and mechanism. Water. Environ. Res.. 2019;91:536-545.
- [Google Scholar]
- Arsenic adsorption on lignocellulosic substrate loaded with ferric ion. Environ. Chem. Lett.. 2007;5:125-129.
- [Google Scholar]
- Lithotrophic growth of Sulfurospirillum deleyianum with sulfide as electron donor coupled to respiratory reduction of nitrate to ammonia. Arch. Microbiol.. 1995;164:180-185.
- [Google Scholar]
- Analysis of ozone at low concentrations with boric acid buffered potassium iodide. Environ. Sci. Technol.. 1977;11:978-983.
- [Google Scholar]
- The role of reagent adding sequence in the NH4+-N recovery by MAP method. Sci. Reports.. 2020;10:7672.
- [Google Scholar]
- Enhancing the stability of Mn–Ce–O WETOX catalysts using potassium. Appl. Catal. B: Environ.. 2001;34:1-9.
- [Google Scholar]
- Catalytic oxidation of ammonium ion in water with ozone over metal oxide catalysts. Catal. Today.. 2014;232:192-197.
- [Google Scholar]
- Behavior of ammonium adsorption by clay mineral halloysite. Transactions of Nonferrous Metals Society of China. 2017;27:1627-1635.
- [Google Scholar]
- Adsorption of copper ions on porous ceramsite prepared by diatomite and tungsten residue. Trans. Nonferrous Met. Soc. China.. 2018;28:1053-1060.
- [Google Scholar]
- Lattice vibrations of manganese oxides: Part I. Periodic structures. Spectrochim. Acta. Part. A: Mol. Bio. Spectro.. 2004;60:689-700.
- [Google Scholar]
- Removal of Ammonia from Water by Ozone Microbubbles. Ind. Eng. Chem. Res.. 2013;52:318-326.
- [Google Scholar]
- Lee, Deuk Ki, 2003. Mechanism and Kinetics of the Catalytic Oxidation of Aqueous Ammonia to Molecular Nitrogen. Environ. ence & Technol.
- Scheelite conversion in sulfuric acid together with tungsten extraction by ammonium carbonate solution. Hydrometallurgy.. 2017;171:106-115.
- [Google Scholar]
- Fe/Ti co-pillared clay for enhanced arsenite removal and photo oxidation under UV irradiation. Appl. Sur. Sci.. 2015;324:179-187.
- [Google Scholar]
- Effect and kinetics analysis of eugenol degradation by ozone. Technol: J. South. China. Uni; 2016.
- Ultrasound-Enhanced Catalytic Ozonation Oxidation of Ammonia in Aqueous Solution. Intern. J. Environ. Res. Public. Health.. 2019;16:2139.
- [Google Scholar]
- Catalytic ozonation of high concentrations of catechol over TiO2@Fe3O4 magnetic core-shell nanocatalyst: Optimization, toxicity and degradation pathway studies. J. Clean. Prod. 2018
- [Google Scholar]
- Ion-exchange process for ammonium removal and release using natural Iranian zeolite. Appl. Sur. Sci.. 2011;51:323-329.
- [Google Scholar]
- Spectrophotometric determination of arsenic and antimony by the silver diethyldithiocarbamate method. Analyst.. 1980;105:558-563.
- [Google Scholar]
- Nie, Jinxia, Chen, Yunnen, Luo, Xianping, Chai, Liyuan, Wang, Dongshuang, 2015. The treatment of trace As(III) from water by modified spent grains. Des. & Water. Treat. Sci. & Eng.
- Removal of As(V) from aqueous solutions by iron coated rice husk. Fuel. Pro. Technol.. 2013;106:511-517.
- [Google Scholar]
- Removal of tungsten oxyanions from industrial wastewater by precipitation, coagulation and flocculation processes. J. Hazard. Mater.. 2007;148:613-615.
- [Google Scholar]
- Kinetic study on the photocatalytic degradation of salicylic acid using ZnO catalyst. J. Hazard. Mater.. 2009;166:1357-1361.
- [Google Scholar]
- Modification of montmorillonite by Gemini surfactants with different chain lengths and its adsorption behavior for methyl orange. Appl. Clay. Sci.. 2018;151:29-36.
- [Google Scholar]
- Saepurahman, Abdullah, M.A., Chong, F.K., 2010. Preparation and characterization of tungsten-loaded titanium dioxide photocatalyst for enhanced dye degradation. J. Hazard. Mater. 176, 451–458.
- Sustainable and efficient leaching of tungsten in ammoniacal ammonium carbonate solution from the sulfuric acid converted product of scheelite. J. Clean. Prod.. 2018;197:690-698.
- [Google Scholar]
- Combined SHARON and ANAMMOX processes for ammoniacal nitrogen stabilisation in landfill bioreactors. Bio. Technol.. 2018;250:723-732.
- [Google Scholar]
- Selective oxidative decomposition of ammonia in neutral water to nitrogen over titania-supported platinum or palladium catalyst. Appl. Catal. A: General. 2000;194–195:89-97.
- [Google Scholar]
- Effect of Co and Ce on silica supported manganese catalysts in the reactions of complete oxidation of n-hexane and ethyl acetate. J. Mater. Sci.. 2011;46:7152-7159.
- [Google Scholar]
- Effects of water chemistry on arsenic removal from drinking water by electrocoagulation. Water. Res.. 2011;45:384-392.
- [Google Scholar]
- Fe- and Co-doped lanthanum oxides catalysts for ammonia decomposition: Structure and catalytic performances. J. Rare. Earths.. 2017;35:15-23.
- [Google Scholar]
- Promoting oxidative activity and stability of CeO2 addition on the MnOx modified kaolin-based catalysts for catalytic combustion of benzene. Chem. Eng. Sci.. 2017;162:218-226.
- [Google Scholar]
- Sensitivity enhancement of inorganic arsenic analysis by in situ microplasma preconcentration coupled with liquid chromatography atomic fluorescence spectrometry. J. Anal. At. Spectrom.. 2020;35:1654-1663.
- [Google Scholar]
- The effect of CuO loading on different method prepared CeO2 catalyst for toluene oxidation. Sci. Total. Environ.. 2020;712:135635
- [Google Scholar]
- Rapid and wide pH-independent ammonium-nitrogen removal using a composite hydrogel with three-dimensional networks. Chem. Eng. J.. 2012;179:90-98.
- [Google Scholar]
- Adsorption kinetic and species variation of arsenic for As(V) removal by biologically mackinawite (FeS) Chem. Eng. J.. 2018;354:237-244.
- [Google Scholar]
- Control of As-/NH3-N-containing Waste Water in W Metallurgy. Rare. Met. Cement. Car.. 2007;31–33
- [Google Scholar]
- Zhong, C. M. Wang, R. S. Wu, K. Z., Yu, X. J., 2014. Treatment of tungsten smelting wastewater containing arsenic and ammonia nitrogen by ferric salt flocculation +MBR. Chinese. J. Environ. Eng. 8, 1840–1844.


