

Translate this page into:
Comprehensive evaluation of solvent in dispersive liquid-liquid microextraction for determination of itraconazole and hydroxy itraconazole by high performance liquid chromatography with fluorescence detection
⁎Corresponding author. shen.xiong@zs-hospital.sh.cn (Xiong Shen)
-
Received: ,
Accepted: ,
This article was originally published by Elsevier and was migrated to Scientific Scholar after the change of Publisher.
Abstract
This paper aims to propose a multicriteria decision analysis (MCDA) method to evaluate and select solvent in a dispersive liquid-liquid microextraction (DLLME) approach. The DLLME is applied to the determination of itraconazole and hydroxy itraconazole in plasma by high performance liquid chromatography with fluorescence detection (HPLC-FLD). To achieve this goal, extraction efficiency, chromatographic resolution, and greenness of solvent were identified as the three indicators in MCDA. Then, Technique for Order of Preference by Similarity to Ideal Solution (TOPSIS) was employed to evaluate and select the solvent. Weight assignment was set up by integrating the subjective scoring from experienced analysts and the objective approach using Shannon’s entropy weight method. Under chosen parameters (extraction solvent: 1-decanol 40 μL, dispersing solvent: methanol 400 μL), the method was validated satisfactorily and applied successfully to the analysis of itraconazole and hydroxy itraconazole in real human plasma samples. The results show that the comprehensive weighted TOPSIS analysis is a promising tool to choose experimental conditions toward an integrative goal. It can provide analysts with a decision making reference to maintain a balance between the analytical performance and eco-friendliness.
Keywords
Technique for order of preference by similarity to ideal solution (TOPSIS)
Entropy
Multicriteria decision analysis
Dispersive liquid-liquid microextraction
Green analytical chemistry

1 Introduction
Multicriteria decision analysis (MCDA), a research that evaluates multiple criteria in a decision process, has become a valuable support in analytical chemistry (Bezerra et al., 2019; Haq et al., 2017; Rahman et al., 2020; Cerqueira et al., 2021). Development of HPLC method involves a set of indicators and many MCDA methods have been adopted. These indicators mainly consist of three aspects, sample preparation, analytical procedure, and greenness. Efficiency of sample preparation is generally evaluated by recovery value. Analytical procedure is commonly assessed by method validation. (International Conference for Harmonisation (ICH) Guidelines for Industry, 2005). In the last two decades, Green Analytical Chemistry (GAC) has been advocated and greenness of the analysis process has been included as one of main objectives of the analytical chemistry community (Haq et al., 2022). The GAC practice aims to achieve a compromise between performance parameters and environmental friendliness during an analytical process (Gałuszka et al., 2013).
Sample preparation is crucial in the development of LC method by affecting the whole methodology. Specifically, efficiency of sample preparation determines to a great extent the sensitivity and the selectivity of LC method. On the other hand, considerable amount of solvents and energy are consumed in the sample preparation process, improvement of greenness relies largely on it (Haq et al., 2022; Gałuszka et al., 2013). Therefore, green approaches in sample preparation such as microextraction techniques have been proposed as an alternative to classical sample preparation procedures.
One of the best choices for this purpose is dispersive liquid–liquid microextraction (DLLME) which gives consideration of both analytical parameters and GAC. In DLLME, the target analyte is extracted by a ternary solvent system consists of an immiscible extraction solvent, an amphipathic disperser solvent, and an aqueous sample solution (Shen et al., 2017). The two solvents are mixed and introduced rapidly into the aqueous sample to form a cloudy solution. The dispersion process significantly increases the contact surface between the droplets of extraction solvent and the sample, and fast extraction is achieved (Ghambarian et al., 2020; Zgoła-Grześkowiak and Grześkowiak, 2011). The solvent pair - extraction solvent and disperser solvent - is crucial for the DLLME practice (Shen et al., 2018; El-deen and Shimizu 2020; Armenta et al., 2015).
Various solvents are used in DLLME. Application of different solvent in DLLME may lead to conflicting results between analytical performance and GAC. Solvents with high hazard value, such as halogenated solvents, generally achieve high recovery value. On the other hand, those non-halogenated solvents with low hazard value are less efficient in extraction. Analytical chemists are preferentially to choose eco-friendly solvent while maintain the quality of analysis (e.g., analytical procedure parameters). Therefore, many MCDA methods are used to determine a priority ranking for solvent selection in DLLME.
There are two main kinds of MCDA methods adopted for DLLME methodology. The most widely used method is experimental design (DoE) with response surface methodology (RSM), aiming to optimize the experimental condition of DLLME (Bezerra et al., 2008; Bernardo et al., 2021). The other kind of MCDA in DLLME is relatively less used and in most cases is more important. It focuses on qualitatively selecting the type of the solvents in DLLME and should be employed prior to the DoE and RSM. Relevant theories and methodologies include Self-Organizing Maps (SOM) (Tobiszewski, et al., 2014), Preference Ranking Organization Method for Enrichment Evaluations (PROMETHEE) (Tobiszewski and Orłowski, 2015; Jędrkiewicz et al., 2016), Technique for Order of Preference by Similarity to Ideal Solution (TOPSIS) (Bigus et al., 2016), Analytical Hierarchy Process (AHP) (Fabjanowicz et al., 2018), clustering analysis (Tobiszewski et al., 2018), and combination of these methods.
Among these methods, TOPSIS is a systematic strategy and practical method for ranking and selecting the possible alternatives. It is determined by measuring the Euclidean distances between the alternative and the positive/negative ideal solution. Theory of TOPSIS was proposed and further completed in 1980 s and 1990 s (Hwang and Yoon, 1981; Behzadian, et al., 2012; Hwang et al., 1993). The method is simple and flexible with no special restriction to the alternatives. It has been applied in many areas (Behzadian, et al., 2012). In recent years, TOPSIS have been introduced to analytical chemistry, such as to select solvent in DLLME (Shen et al., 2018), being used as an criterion in DoE (Bigus et al., 2018), select and assess the analytical procedures (Al-Hazmi et al., 2016; Jędrkiewicz et al., 2018; Marć et al., 2020), simultaneous study of several responses in an DoE for an HPLC method development (Mousavi et al., 2020), and comprehensive quality assessment of Chinese traditional medicine (Yuan et al., 2022).
Most MCDAs adopted for analytical chemistry tend to apply equal weights, leaving the weight assignment to analysts. However, the various indicators in LC methodology own different significance and it should not be assumed as equal (Wang and Lee, 2009). They should be weighted to distinguish the significance from each other. There are two types of weighting methods, subjective methods and objective ones (Wang and Lee, 2009). The subjective methods, such as scoring by the experts of the relevant field, analytic hierarchy process (AHP) (Wang et al., 2019), calculate weights by the decision maker’s preferences. The objective methods, including entropy method, principal component analysis (PCA) (Allegretta et al., 2020; Sudol et al., 2020), Criteria Importance Though Intercrieria Correlation (CRITIC) (Xu et al., 2020), etc. determines weights by applying mathematical calculation, without consideration of the decision makers preferences.
Entropy weight method, adapted from thermodynamics to information theory by Shannon in 1948 (Shannon, 1948), is extended and applied widely in decision-making process. The essential principle is that the smaller the entropy value, the greater the weight, i.e., the criterion contains more information and is more important, and vice versa. (Wang and Lee, 2009; Shannon, 1948; dos Santos, et al., 2019).
This study develops an HPLC method with fluorescence detection (HPLC-FLD) to determine itraconazole (ITZ) and hydroxy itraconazole (HITZ) in human plasma. Plasma samples were pretreated by DLLME. ITZ and its metabolite HITZ are antifungal medication used in adults to treat fungus-caused infections. It is also used as antifungal prophylaxis for patients of hematological malignancy with high risk of invasive fungal infections (IFI). ITZ is very slightly soluble and absorbed irregularly after orally administration In addition, they are easy to interact with other drugs (Redmann and Charles, 2006). These issues results in substantial variability in pharmacokinetics and clinical effect. Therefore, plasma concentration monitoring is necessary for ITZ and HITZ.
A number of HPLC assays have been reported for the determination of ITZ and HITZ in human plasma, including liquid chromatography-tandem mass spectrometry (LC/MS/MS), HPLC with ultraviolet detection (HPLC-UV), and HPLC with fluorescence detection (HPLC-FLD) (Liang C. et al., 2016; Srivatsan et al., 2004; Miura et al., 2010; Buckner et al., 2011). Sample pretreatment methods in these assays are classic techniques such as liquid–liquid extraction (LLE) and solid-phase extraction (SPE) which are either not eco-friendly, or slow and labor intensive. Accordingly, this paper uses DLLME as sample pretreatment method.
The main objective of this paper is to introduce a comprehensive evaluation method for the solvent selection in DLLME. The TOPSIS method is employed to evaluate the inhomogeneity between extraction efficiency, resolution of chromatographic peaks, and greenness of the solvent. Weight assignment is set up by integrating the subjective opinion (scoring from experienced LC experts) and the objective approach (entropy weighting method). To the best of authors' knowledge, this is the first study in which DLLME was used to determine these compounds which leads to efficient and eco-friendly sample pre-treatment. It is also the first try to screen and optimize solvent in DLLME using TOPSIS with combinational weighting method.
2 Materials and methods
2.1 Chemicals and reagents
Itraconazole (ITZ) and hydroxy itraconazole (HITZ) (>98 % purity grade) were purchased from the National Institute for the Control of Pharmaceutical and Biological Products (Beijing, China). Internal standard R051012 was provided by Xi’an Janssen Pharmaceutical ltd. (Xi’an, China). Chemical structures of ITZ, HITZ, and internal standard R051012 are presented in Supplementary Materials S1.
Acetonitrile and Methanol of HPLC-grade were obtained from Fisher Scientific (Pittsburgh, PA, USA). Analytical grade trichloroethane, 1,1,2,2-tetrachloroethane, hexane, 1-octanal, and 1-decanol were available from Shanghai Lingfeng Chemical Reagent Co. ltd. (Shanghai, China). Analytical grade 1-undecanol and 1-dodecanol were purchased from Sigma-Aldrich Co. ltd. (Shanghai, China). Ultrapure water was prepared by a Milli-Q system (Millipore, Bedford, MA, USA).
Stock solutions of ITZ, HITZ, and internal standard R051012 were prepared in dimethyl sulfoxide (DMSO) at a concentration of 1.0 mg/mL. Working solutions for experiments were prepared by diluting the stock solutions with methanol.
2.2 Instrumentation
A chromatographic system from Waters (Waters Corporation, Milford, USA) consists of two 1525 pumps, a 2707 auto-sampler, a 1500 oven and a 2475 fluorescence detector. Waters Breeze2 software was used to operate the system and process the chromatographic data. Excitation and emission wavelengths were 260 and 350 nm, respectively. Centrifuge 5430R (Eppendorf, Hamburg, Germany) was used to centrifuge samples.
2.3 Plasma samples
Drug-free plasma from Zhongshan Hospital, Fudan University (Shanghai, China) was used for the preparation of calibration standards. Plasma samples containing ITZ and HITZ were prepared by adding appropriate aliquots of the stock solutions to plasma. The utilization of human plasma was in accordance with the guidelines of the Ethics Committee of Zhongshan Hospital, Fudan University. Real samples were treated according to the literature (Srivatsan et al., 2004). The real blood samples were collected in vacutainers and mixed with anticoagulant. The plasma samples were separated by centrifugation (5000 rpm /4946g, 5 min at 4 °C), stored in Eppendorf tubes, and frozen below − 20 °C until use.
Calibration graphs were constructed from the peak–area ratios of ITZ and HITZ to the internal standard from the HPLC chromatograms and the nominal concentrations of ITZ and HITZ.
2.4 Dispersive liquid-liquid microextraction procedure
In order to reduce interference from protein, plasma sample was treated before DLLME with procedure described in our previous paper (Shen et al., 2018). The obtained aqueous solution (sample solution, 10 mL, contain 1.5 % NaCl, w/v) was transferred to a 15 mL glass tube with a conical bottom.
A mixture of extraction solvent and disperser solvent was injected instantly into the sample solution via a 2.5 mL gastight syringe. The glass tube was shaken manually for 30 s and a cloudy solution was readily formed. After that, the glass tube was centrifuged to achieve phase separation (4000 rpm/3957 g, 4 min, 4 °C). The analyte interested was then extracted in the organic phase. Finally, the organic phase was transferred to a glass tube with a conical bottom and evaporated to dryness at room temperature under a stream of nitrogen. The dry residues were reconstituted with 200 μL methanol, vortex mixed, and applied in the RP-HPLC analysis.
2.5 Chromatographic analysis
Chromatographic method was established according to the literature (Liang C. et al., 2016; Srivatsan et al., 2004). The samples were injected onto a Diamonsil C18(2) column (250 mm × 4.6 mm I.D., 5 μm) from Dikma Technologies Inc. (Beijing, China) with a guard column (EasyGuard®, C18, 10 mm × 4.0 mm I.D., 5 μm) from the same supplier. The injection volume was 10 μL and the column was kept at 30 °C. The mobile phase was composed of 0.5 % potassium dihydrogen phosphate (pH 3.5)- acetonitrile (50:50, v/v). The pH of 0.5 % potassium dihydrogen phosphate was adjusted with 50 % phosphoric acid. The flow rate was 1.0 mL/min. Signal responses were measured by fluorescence detection at wavelengths set at 260 nm for excitation and 365 nm for emission.
2.6 TOPSIS approach
TOPSIS approach based on combinational weight was employed to evaluate eight solvent pairs for the DLLME procedure in this study.
2.6.1 Definition of three criteria in TOPSIS
Three indicators, enrichment factor (EF), hazard value (HV), and chromatographic resolution (R) are used as criteria of TOPSIS analysis in this study (Table 1). a: VES: Volume of extraction solvent. b: VDS: Volume of disperser solvent. c: Ci: Relative closeness coefficient, which demonstrates how close the alternative is to the ideal solution and represents the result of TOPSIS analysis.
No.
Extraction Solvent
VE/μLa
Disperser Solvent
VD/μLb
Enrichment factor/Ranking
Chromatographic Resolution /Ranking
Hazard value/Ranking
Cic /Ranking
1
trichloroethane
40
methanol
800
54.82 /6
1.86 /4
15,092 /6
0.1940 /8
2
tetrachloroethane
60
acetonitrile
400
64.87 /2
1.73 /8
18,864 /7
0.5384 /3
3
tetrachloroethane
80
acetone
800
65.91 /1
1.76 /7
19,115 /8
0.5664 /2
4
hexane
80
acetone
800
53.89 /8
1.84 /5
12,415 /4
0.2706 /7
5
1-octanol
80
acetone
600
55.17 /4
2.03 /1
10,742 /3
0.3589 /4
6
1-decanol
40
methanol
400
62.48 /3
1.96 /2
8190 /1
0.7601 /1
7
1-undecanol
40
acetonitrile
400
55.07 /5
1.83 /6
12,879 /5
0.2784 /6
8
1-dodecanol
80
acetone
600
54.69 /7
1.92 /3
10,394 /2
0.3525 /5
Enrichment factor (EF) demonstrates the extraction efficiency of DLLME and is calculated as follows: where, Cfinal is the final concentration of analytes in the extracts, and C0 is concentration in the sample solution (Shen et al., 2018). Note that EF in the current paper is the mean value for ITZ and HITZ.
Hazard value (HV) shows the green aspect of solvents. It is calculated as follows: where, HVT is the total hazard value of solvent, and V represents the volume of extraction and disperser solvent consumed in the DLLME process per sample. In the current paper, HV is the mean value for ITZ and HITZ. Algorithm of the HV includes a series of calculation with respect to human health effects, environmental effects, and exposure factor of solvent. It has been reported in literatures (Bigus et al., 2016; Swanson et al., 1997; Tobiszewski and Namieśnik, 2015; Lam et al., 2012) and the detailed calculating process is presented in Supplementary Materials S2.
In this study, chromatographic resolution (R) represents the efficiency of DLLME technique to remove the impurity and reduce the interference. The R value for ITZ and its adjacent impurity is lower than those of HITZ and internal standard R051012. The improvement of the peak resolution of ITZ is therefore the primary concern in this study. The value of R is provided by Waters Breeze2 software.
In this paper, EF and R reflects the corresponding indicators in positive way, i.e. the higher the better. On the other hand, HV reflects the green aspect of solvent from the opposite direction, the lower the value of HV, the greener the solvent is.
2.6.2 Algorithm of TOPSIS
Algorithm of TOPSIS has been elaborated in various papers (Bigus et al., 2016; Behzadian, et al., 2012; Sánchez-Lozano et al., 2013). The detailed mathematical procedure is presented in Fig. 1 and supplementary materials S3.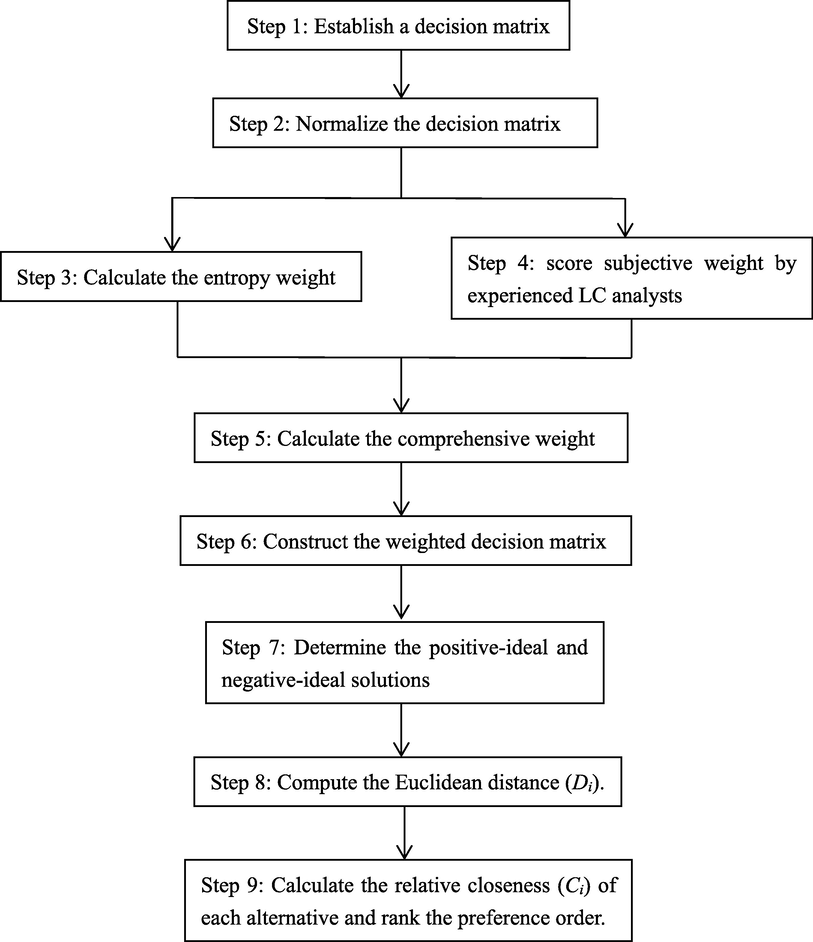
Algorithm of combinational weighted TOPSIS.
2.7 Validation procedure
The established HPLC method was validated according to the guidance of International Conference on Harmonization (ICH) with respect to linearity, limit of detection (LOD), limit of quantification (LOQ), precision, and accuracy (International Conference for Harmonisation (ICH) Guidelines for Industry, 2005). Under the optimal condition, real samples of plasma were investigated. Linearity was investigated by analyzing calibration curves at five different levels. Calibration curve was obtained by least-squares linear regression analysis of peak area ratios to internal standard against analyte concentrations. LOD and LOQ were defined as concentration yielding a chromatographic signal-to-noise ratio of 3 and 10, respectively. Precision was assessed as relative standard deviation (RSD) intra-day and inter-day in three concentrations (three replicates each). Accuracy was reported as percent recovery by determination of known added amount of analyte in samples. Three different levels of ITZ and HITZ were spiked to the samples and assessed (three replicates each).
3 Results and discussion
In this paper, solvent selection in a DLLME approach is assessed via a combinational weighted TOPSIS analysis. Algorithm of TOPSIS ends by acquiring the relative closeness coefficient (Ci). The assessed solvent pairs are ranked according to the descending order of the Ci. Note that the normalized value ranges from 0 to 1, accordingly, some solvent pairs in Fig. 2 do not show the all the four bars when the normalized values equal to 0.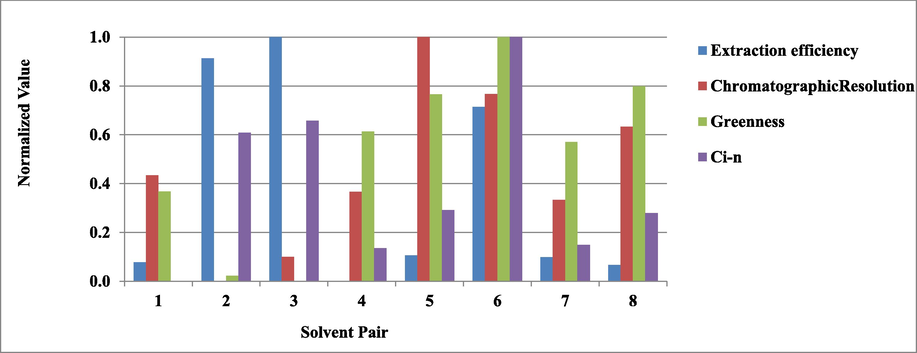
Normalized values of solvent pairs of extraction efficiency, chromatographic resolution, greenness, and combinational weighted TOPSIS. Ci: closeness coefficient of TOPSIS, the relative closeness which demonstrates how close the alternative is to the ideal solution. Note that the normalized values range from 0 to 1. Some solvent pairs do not show all the four bars when the normalized values equal to 0.
3.1 Preliminary experiment to prescreen solvent
Type and volume of solvents are the key factors that impact the performance of DLLME. Preliminary experiments were carried out to prescreen the solvent pairs. Specifically, combination of different kinds of extraction solvents and disperser solvents were tested for extracting ITZ and HITZ in plasma via DLLME. Those solvent-pair performed the extraction successfully were selected, i.e. when the extraction-disperser solvent pair injects into the sample solution, cloudy phase is readily formed and phase separation achieved successfully. As a result, eight pairs of extraction-disperser solvent were selected for the following study (Table 1).
3.2 Solvent pair sorted by single criterion
The ranking order of the solvent pair according to the single criterion is shown in Table 1.
The top 3 solvent pair of extraction efficiency (EF) are: (1) No.3, tetrachloroethane 80 μL - acetone 600 μL, (2) No.2, tetrachloroethane 60 μL - acetonitrile 400 μL, and (3) SP6, 1-decanol 40 μL - methanol 400 μL. The non-polar halogenated hydrocarbon, tetrachloroethane, shows the advantage over the other extraction solvents.
The top 3 solvent pair regarding chromatographic resolution (R) are: (1) No.5, octanol 80 μL - acetone 800 μL, (2) No.6, 1-decanol 40 μL - methanol 400 μL, and (3) No.8, 1-dodecanol 80 μL - acetone 600 μL. In solvent system with long chain alcohol as extraction solvent are more efficient to remove the impurity and reduce the interference.
The top 3 green solvent pairs are: (1) No.6, 1-decanol 40 μL - methanol 400 μL, (2) No.8, 1-dodecanol 80 μL - acetone 600 μL, and (3) No.5, 1-octanol 80 μL - acetone 600 μL. Solvent system consists of saturated long chain alcohols (extraction solvent) and acetone (disperser solvent) shows higher greenness against the other solvent pairs.
3.3 Comprehensive selection of solvents by TOPSIS analysis
3.3.1 Identification of the weights for each criterion
Result of the combinational weights for the three criteria is: extraction efficiency (EF) 0.4759, chromatographic resolution (R) 0.2161, and hazard value (HV) 0.3080.
3.3.2 Selection of solvent pair by combinational weighted TOPSIS
Assigning the calculated weight, TOPSIS method is applied to analysis the performance of eight solvent pairs in DLLME. Solvent pairs achieving the top 3 ranking are: (1) No. 6, 1-decanol 40 μL - methanol 400 μL, (2) No. 3, tetrachloroethane 80 μL - acetone 800 μL, and (3) No. 2, tetrachloroethane 60 μL - acetonitrile 400 μL (Table 1). Each result, the three single criteria and the comprehensive TOPSIS analysis was normalized and compared under the same dimension (Supplementary material S4). Fig. 2 shows the normalized results of the eight pairs of solvent with respect to the relevant criteria.
It turns out that solvent pairs No.6 being the ideal solution after the overall assessment. This solvent pair ranks No.3 in efficiency of extraction, and ranks No.1 and No.2 in greenness and chromatographic resolution, respectively. In other words, it achieves an ideal balance in the three assessed criteria.
The solvent pairs No.2 and 3 containing 1,1,2,2-tetrachloroethane as extraction solvent, achievs the top 2 in extraction efficiency whereas their respective ranking orders are No.7 and 8 in greenness, and No.8 and 7 in chromatographic resolution. Although extraction efficiency is assigned a higher weight in subjective evaluation as, extraction efficiency: chromatographic resolution: greenness equal to 2:1:1, the unbalance in the comprehensive evaluations leads to their ranking orders below that of the solvent pair No.6.
This can also be explained from another perspective. 1,1,2,2-tetrachloroethane is a kind of extraction agent which is easy to operate, highly efficient whereas highly polluting. Its symmetrically spatial conformation and lipophilic property (logP = 2.39) lead to high efficiency of extraction. The solubility property and density value (1.59 g/mL) make it easy to dispersion, phase formation, and quick phase separation in the DLLME process (Zgoła-Grześkowiak and Grześkowiak, 2011; Płotka-Wasylka et al., 2016). From the environmental perspective, however, 1,1,2,2-tetrachloroethane is highly toxic and volatile. Its long-lasting sweetish suffocating and chloroform-like odor also makes it unwelcome in laboratory.
Therefore, MCDA method which allows decision makers to include a full range of indicators is necessary in selecting ideal solvent in DLLME procedure. The method can also be applied in sample pretreatment methods other than DLLME.
3.4 Analytical figures of merit
Fig. 3 shows the typical LC chromatograms for blank sample (a), standard solution (b), and plasma sample (c).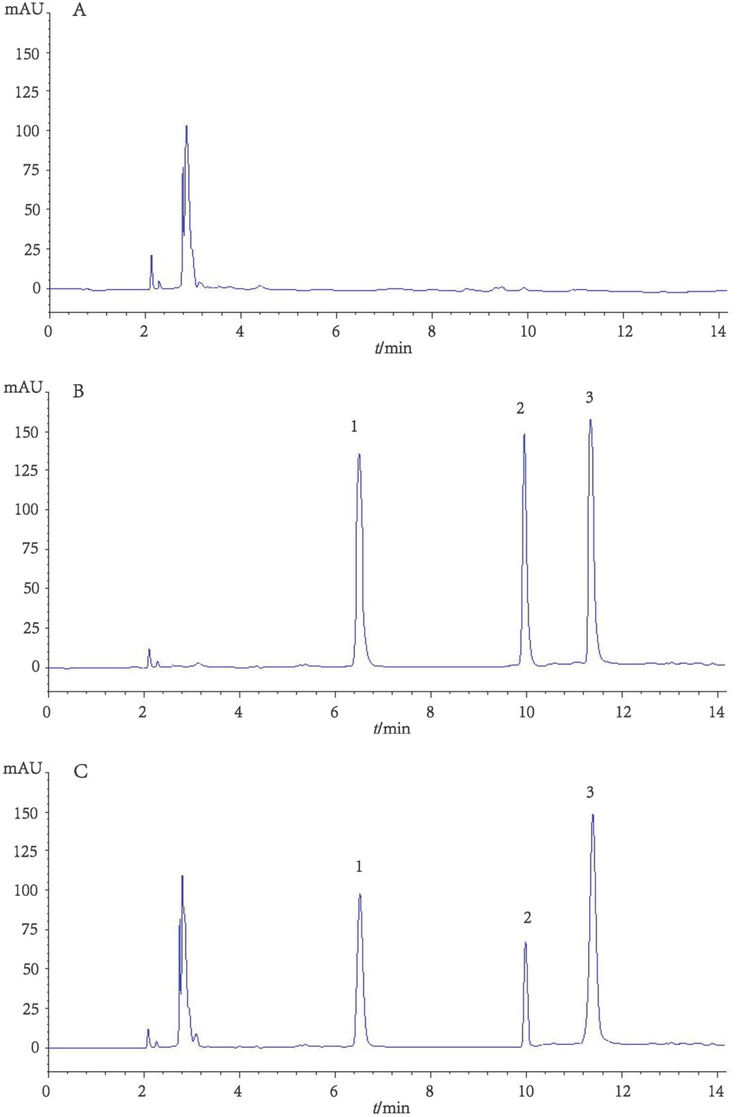
Typical HPLC chromatograms for blank sample (a), standard solution (b), and plasma sample (c). 1: itraconazole (ITZ), 2: hydroxy itraconazole (HITZ), 3: R051012 (internal standard).
Results of HPLC-FLD method validation are shown in Table 2 and Table 3. The results showed that the developed method could be used for the pretreatment and determination of ITZ and HITZ in human plasma samples.
Analyte
Linear range (μg⋅L-1)
R2
LOD (μg⋅L-1)
LOQ (μg⋅L-1)
ITZ
0.8–500
0.992
0.8
2.0
HITZ
0.8–500
0.996
0.5
1.5
Analyte
Intra-day Precision (% RSD, n = 3)
Inter-day Precision (% RSD, n = 3)
Accuracy a (% Recovery, n = 3)
10 μg⋅L-1
200 μg⋅L-1
400 μg⋅L-1
10 μg⋅L-1
200 μg⋅L-1
400 μg⋅L-1
10 μg⋅L-1
200 μg⋅L-1
400 μg⋅L-1
ITZ
7.2
4.6
3.1
10.2
6.3
3.7
83.5 (5.7)
89.1 (3.4)
88.4 (5.1)
HITZ
6.9
5.4
5.2
9.6
7.5
5.1
84.7 (4.3)
95.4 (4.8)
91.6 (3.8)
3.5 Comparison with other reported methods
To evaluate the performances of DLLME in this study, some analytical parameters of the established method were compared with several reported methods in the literature (Table 4). The proposed method shows comparable results with other reported methods in features of precision, accuracy, and linear range. In most cases, the current study shows superiority in lower limit of quantification (LLOQ) and consumed less solvent in sample preparation. However, there is one exception (Jenkins et al., 2018) which exhibits superiority against this study in both solvent consumption and LLOQ (Table 4). The reason might be attributed to the analysis method it applied - Ultra Performance Liquid Chromatography -tandem mass spectrometry (UPLC–MS/MS) (Jenkins et al., 2018), which is more sensitive than the HPLC-FLD in the current study. Considering that LC-MS/MS is not commonly available in laboratories, the proposed method has certain advantage and can be used as sample pretreating method for the determination of ITZ and HITZ in plasma samples. aFLD: fluorescence detection. bLLOQ: lower limit of quantificatio.
Analytical method
Extraction method
Organic reagent consumed in sample preparation
Linear range (ng/mL)
LLOQb (ng/mL)
Precision (%RSD)
Accuracy (%Recovery)
Reference
HPLC-MS/MS
solid supported liquid extraction
1.6 mL methyl tertiary butyl ether, 225 μL methanol
5–2500
5
≤ 8.9 (ITZ) ≤ 6.5 (HITZ)
92.4–99.0
Liang X. et al., 2016
UPLC-MS/MS
protein precipitation
100 μL precipitation reagent
0.18–3.64 (ITZ) 0.18–3.81 (HITZ)
0.1
1.9–8.3 (ITZ) 2.6–8.2 (HITZ)
91–100
Jenkins et al., 2018
HPLC-FLD
liquid-phase extraction
4 mL of hexane-dichloromethane (70:30) mixture, 100 μL acetonitrile
5.0–500
5
5.2–12.1 (ITZ) 3.6–14.7 (HITZ)
94.8–110.7
Srivatsan et al., 2004
HPLC-FLD
liquid-phase extraction
600 μL methyl tertiary butyl ether, 50 μL methanol, 50 μL Tris solution
50–8000 (ITZ) 100–8000 (HITZ)
50 (ITZ) 100 (HITZ)
3.2–13.4
83–115.5
Buckner et al., 2011
HPLC-FLD
liquid-phase extraction
5 mL methyl tertiary butyl ether, 200 μL acetonitrile
20–2000
20
< 9.16 %
86.94–99.4 %
Liang C. et al., 2016
HPLC-FLD
DLLME
40 μL 1-decanol, 400 μL methanol
0.8–500
1.5–2.0
3.1–10.2 (ITZ) 5.1–9.6 (HITZ)
83.5–95.4
this study
3.6 Real samples
The introduced method was applied to investigate ITZ and HITZ levels in patients (n = 21) of hematological malignancy 5 h (Tmax) after orally administrated with ITZ (200 mg). The analytes ITZ and HITZ were detected in all the subjects. The level of ITZ and HITZ ranged from 176.4 μg⋅L-1 to 382.7 μg⋅L-1 and 138.1 μg⋅L-1 to 360.8 μg⋅L-1 respectively.
4 Conclusions
This paper explores the applicability of a combinational weighted TOPSIS analysis to determine optimal solvent system in a DLLME method. The proposed method enables an integrative assessment of solvent with respect to extraction efficiency, chromatographic resolution, and greenness. The objective weight (Shannon’s entropy weight) and subjective weight (scoring from experienced LC experts) are integrated to assign a combinational weight in the TOPSIS analysis. The methodology in this study can be served as a substantial aid for analytical chemists to choose solvent in sample pretreatment. It can be extended into many fields in analytical chemistry for method optimization.
Acknowledgement
The authors would like to sincerely thank all the subjects of this trial and hope they rehabilitate successfully in the future.
Declaration of Competing Interest
The authors declare that they have no known competing financial interests or personal relationships that could have appeared to influence the work reported in this paper.
References
- Application of TOPSIS for selection and assessment of analytical procedures for Ibuprofen determination in wastewater. Curr. anal. Chem.. 2016;12:261-267.
- [CrossRef] [Google Scholar]
- Macro-classification of meteorites by portable energy dispersive X-ray fluorescence spectroscopy (pED-XRF), principal component analysis (PCA) and machine learning algorithms. Talanta. 2020;212:120785
- [CrossRef] [Google Scholar]
- The role of green extraction techniques in green analytical chemistry. Trends Anal. Chem.. 2015;71:2-8.
- [CrossRef] [Google Scholar]
- A state-of the-art survey of TOPSIS applications. Expert Syst. Appl.. 2012;39:13051-13069.
- [CrossRef] [Google Scholar]
- Using design of experiments to optimize a screening analytical methodology based on solid-phase microextraction/gas chromatography for the determination of volatile methylsiloxanes in water. Molecules. 2021;26:3429.
- [CrossRef] [Google Scholar]
- Bezerra, M.A., Ferreira, S.L.C., Novaes, C.G., dos Santos, A.M.P., Valasques, G.S., Cerqueira, U.M.F. da M., Alves, J.P. dos S., 2019. Simultaneous optimization of multiple responses and its application in Analytical Chemistry – A review. Talanta 194, 941–959. https://doi.org/10.1016/j.talanta.2018.10.088.
- Response surface methodology (RSM) as a tool for optimization in analytical chemistry. Talanta. 2008;76:965-977.
- [CrossRef] [Google Scholar]
- Application of multicriteria decision analysis in solvent type optimization for chlorophenols determination with a dispersive liquid–liquid microextraction. J. Chromatogr. A. 2016;1446:21-26.
- [CrossRef] [Google Scholar]
- Implementation of multicriteria decision analysis in design of experiment for dispersive liquid-liquid microextraction optimization for chlorophenols determination. J. Chromatogr. A. 2018;1553:25-31.
- [CrossRef] [Google Scholar]
- Measurement of posaconazole, itraconazole, and hydroxyitraconazole in plasma/serum by high-performance liquid chromatography with fluorescence detection. Ther. Drug Monit.. 2011;33:735-741.
- [CrossRef] [Google Scholar]
- Cerqueira, U.M.F.M., Bezerra, M.A., Ferreira, S.L.C., Araújo, R.de J., Silva, B.N.da, Novaes, C.G., 2021. Doehlert design in the optimization of procedures aiming food analysis - A review. Food Chem. 364, 130429. https://doi.org/10.1016/j.foodchem.2021.130429.
- Performance evaluation of green suppliers using entropy-TOPSIS-F. J. Clean. Prod.. 2019;207:498-509.
- [CrossRef] [Google Scholar]
- A green air assisted-dispersive liquid-liquid microextraction based on solidification of a novel low viscous ternary deep eutectic solvent for the enrichment of endocrine disrupting compounds from water. J. Chromatogr. A. 2020;1629:461498
- [CrossRef] [Google Scholar]
- An analytical hierarchy process for selection of the optimal procedure for resveratrol determination in wine samples. Microchem. J.. 2018;142:126-134.
- [CrossRef] [Google Scholar]
- The 12 principles of green analytical chemistry and the SIGNIFICANCE mnemonic of green analytical practices. Trends Anal. Chem.. 2013;50:78-84.
- [CrossRef] [Google Scholar]
- An efficient sample preparation method based on dispersive liquid–liquid microextraction associated with back extraction for trace determination of acidic pharmaceuticals. Arab. J. Chem.. 2020;13:1924-1932.
- [CrossRef] [Google Scholar]
- Greenness estimation of chromatographic assay for the determination of anthracycline-based antitumor drug in bacterial ghost matrix of Salmonella typhimurium. Sustain. Chem. Pharm.. 2022;26:100642
- [CrossRef] [Google Scholar]
- Haq, N., Iqbal, M., Alanazi, F.K., Alsarra, I.A., Shakeel, F., 2017. Applying green analytical chemistry for rapid analysis of drugs: Adding health to pharmaceutical industry. Arab. J. Chem. 10, S777–S785. http://dx.doi.org/10.1016/j.arabjc.2012.12.004.
- A new approach for multiple objective decision making. Comput. Oper. Res.. 1993;20:889-899.
- [CrossRef] [Google Scholar]
- Multiple attribute decision making methods and applications. Berlin Heidelberg: Springer; 1981.
- International Conference for Harmonisation (ICH) Guidelines for Industry, 2005. ICH Q2(R1), Validation of Analytical Procedures: Methodology
- Green analytical chemistry introduction to chloropropanols determination at no economic and analytical performance costs? Talanta. 2016;147:282-288.
- [CrossRef] [Google Scholar]
- Simultaneous grouping and ranking with combination of SOM and TOPSIS for selection of preferable analytical procedure for furan determination in food. Talanta. 2018;178:928-933.
- [CrossRef] [Google Scholar]
- Simultaneous determination of voriconazole, posaconazole, itraconazole and hydroxy-itraconazole in human plasma using LCMS/MS. Clin. Biochem.. 2018;53:110-115.
- [CrossRef] [Google Scholar]
- Lam, C.W., Aguirre, M.P., Schischke, K., Nissen, N.F., Ogunseitan, O.A., Schoenung, J.M., 2012. International Harmonization of Models for Selecting Less Toxic Chemical Alternatives: Effect of Regulatory Disparities in the United States and Europe. Integrated Environmental Assessment and Management — Volume 8, Number 4—pp. 723–730. https://doi.org/ 10.1002/ieam.1305.
- Simultaneous determination of itraconazole, hydroxy itraconazole, keto itraconazole and N-desalkyl itraconazole concentration in human plasma using liquid chromatography with tandem mass spectrometry. J. Chromatogr. B. 2016;1020:111-119.
- [CrossRef] [Google Scholar]
- Pharmacokinetics and bioavailability of itraconazole oral solution in cats. J. Feline Med. Surg.. 2016;18(4):310-314.
- [CrossRef] [Google Scholar]
- Exploratory analysis and ranking of analytical procedures for short-chain chlorinated paraffins determination in environmental solid samples. Sci. Total Environ.. 2020;711:134665
- [CrossRef] [Google Scholar]
- A simple, sensitive high-performance liquid chromatography -ultraviolet method for the quantification of concentration and steady-state pharmacokinetics of itraconazole and hydroxyitraconazole. Ann. Clin. Biochem.. 2010;47:432-439.
- [CrossRef] [Google Scholar]
- Combining chemometrics and the technique for the order of preference by similarity to ideal solution: a new approach to multiple-response optimization of HPLC compared to desirability function. Microchem. J.. 2020;155:104752
- [CrossRef] [Google Scholar]
- Modern solutions in the field of microextraction using liquid as a medium of extraction. Trends Anal. Chem.. 2016;85:46-64.
- [CrossRef] [Google Scholar]
- Experimental design approach for optimization of Pb(II) removal from aqueous solution using poly-o-toluidine/stannic(IV) triethanolamine as adsorbent. Environ. Technol. Inno.. 2020;17:100634
- [CrossRef] [Google Scholar]
- Redmann, S., Charles. B.G., 2006. A rapid HPLC method with fluorometric detection for determination of plasma itraconazole and hydroxyitraconazole concentrations in cystic fibrosis children with allergic bronchopulmonary aspergillosis. Biomed Chromatogr. 20. 343–348. https://doi.org/ 10.1002/bmc.569.
- Geographical information systems (GIS) and multi-criteria decision making (MCDM) methods for the evaluation of solar farms locations: casestudy in south-eastern Spain. Renew. Sust. Energ. Rev.. 2013;24:544-556.
- [CrossRef] [Google Scholar]
- A mathematical theory of communication. Bell Syst. Tech. J.. 1948;27(379–423):623-656.
- [CrossRef] [Google Scholar]
- Application of dispersive liquid–liquid microextraction for the preconcentration of eight parabens in real samples and their determination by high-performance liquid chromatography. J. Sep. Sci.. 2017;40:4385-4393.
- [CrossRef] [Google Scholar]
- Ultrasound-assisted dispersive liquid-liquid microextraction followed by gas chromatography–mass spectrometry for determination of parabens in human breast tumor and peripheral adipose tissue. J. Chromatogr. B. 2018;1096(2018):48-55.
- [CrossRef] [Google Scholar]
- Simultaneous determination of itraconazole and hydroxyitraconazole in human plasma by high-performance liquid chromatography. J. Chromatogr. A. 2004;1031:307-313.
- [CrossRef] [Google Scholar]
- Impact of data bin size on the classification of diesel fuels using comprehensive two-dimensional gas chromatography with principal component analysis. Talanta. 2020;206:120239
- [CrossRef] [Google Scholar]
- A screening method for ranking and scoring chemicals by potential human health and environmental impacts. Environ. Toxicol. Chem.. 1997;16:372-383.
- [CrossRef] [Google Scholar]
- Scoring of solvents used in analytical laboratories by their toxicological and exposure hazards. Ecotox. Environ. Safe.. 2015;120:169-173.
- [CrossRef] [Google Scholar]
- Pre-selection and assessment of green organic solvents by clustering chemometric tools. Ecotox. Environ. Safe.. 2018;147:292-298.
- [CrossRef] [Google Scholar]
- Multicriteria decision analysis in ranking of analytical procedures foraldrin determination in water. J. Chromatogr. A. 2015;1387:116-122.
- [CrossRef] [Google Scholar]
- Multivariate statistical comparison of analytical procedures for benzene and phenol determination with respect to their environmental impact. Talanta. 2014;130:449-455.
- [CrossRef] [Google Scholar]
- Developing a fuzzy TOPSIS approach based on subjective weights and objective weights, Expert Syst. Appl.. 2009;36:8980-8985.
- [CrossRef] [Google Scholar]
- Application of AHP, TOPSIS, and TFNs to plant selection for phytoremediation of petroleum-contaminated soils in shale gas and oil fields. J. Clean. Prod.. 2019;233:13-22.
- [CrossRef] [Google Scholar]
- Data-driven configuration optimization of an off-grid wind/PV/hydrogen system based on modified NSGA-II and CRITIC-TOPSIS. Energ. Convers. Manage.. 2020;215:112892
- [CrossRef] [Google Scholar]
- A study for quality evaluation of Taxilli Herba from different hosts based on fingerprint-activity relationship modeling and multivariate statistical analysis. Arab. J. Chem.. 2022;15:103933
- [CrossRef] [Google Scholar]
- Dispersive liquid-liquid microextraction. Trends Anal. Chem.. 2011;30:1382-1399.
- [CrossRef] [Google Scholar]
Appendix A
Supplementary material
Supplementary data to this article can be found online at https://doi.org/10.1016/j.arabjc.2023.104565.
Appendix A
Supplementary material
The following are the Supplementary data to this article:Supplementary data 1
Supplementary data 1


