

Translate this page into:
Cross-mixing study of a poisonous Cestrum species, Cestrum diurnum in herbal raw material by chemical fingerprinting using LC-ESI-QTOF-MS/MS
⁎Corresponding authors at: H.E.J. Research Institute of Chemistry, International Center for Chemical and Biological Sciences, University of Karachi, Karachi 75270, Pakistan (S.G. Musharraf). Pharmacognosy Group, Department of Medicinal Chemistry, Biomedical Centre, Uppsala University, Box 574, 75 123 Uppsala, Sweden (H.R. El-Seedi). hesham.el-seedi@farmbio.uu.se (Hesham R. El-Seedi), musharraf1977@yahoo.com (Syed Ghulam Musharraf)
-
Received: ,
Accepted: ,
This article was originally published by Elsevier and was migrated to Scientific Scholar after the change of Publisher.
Peer review under responsibility of King Saud University.
Abstract
Abstract
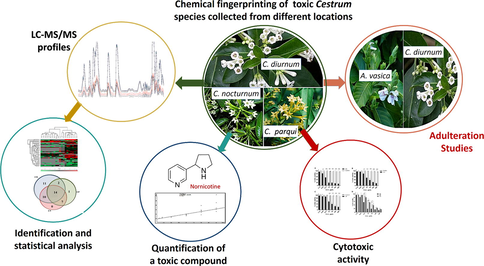
Poisonous plants are widely distributed and may have risk of phytotoxicity upon mixing with medicinal plants. Several species of Cestrum genus are poisonous and linked with many serious health issues. In the present study, cross-mixing of a toxic plant, Cestrum diurnum with morphologically resembling medicinal plant, Adhatoda vasica was studied using chemical fingerprinting approach. LC-ESI-MS/MS tool was used to develop the chemical fingerprints of three toxic species of Cestrum, including, C. diurnum, C. nocturnum and C. parqui. Total forty-three compounds were identified using high-resolution LC-ESI-MS/MS data comparison. Chemometric analyses were done to compare the distribution of identified compounds present in these Cestrum species. One of the identified compounds, nornicotine (a toxic compound) was also quantified using LC-IT-MS/MS. Adulteration study was conducted by mixing toxic C. diurnum in A. vasica with various ratios (w/w) and five differentiable compounds were identified to detect the adulteration. The method was able to detect up to the limit of 5% mixing of toxic C. diurnum. Moreover, cytotoxicity of the methanolic extracts of these three species were also studied on normal human PBMC (peripheral blood mononuclear cells) and all found to be toxic, while the C. nocturnum showed the highest level of toxicity with the IC50 12.5 μg/mL.
Keywords
LC-ESI-MS/MS
Chemical fingerprinting
Quantification
Adulteration
Cytotoxicity

1 Introduction
Many plant species contain toxic components and thus can be either fatal or can cause serious harm when consumed. The toxic constituents of these plants, have been reported in several studies using isolation of toxic compounds, chromatographic fingerprinting and mass spectrometric screening (Carlier et al., 2015). Cestrum species are cultivated and widely used as ornamental plants in South East Asian countries. Several species of Cestrum are also known for their severe toxicity and ingestion of these plants can cause illnesses such as vomiting or diarrhea (Filmer and Dodge, 2012). When consumed, C. diurnum triggers dystrophic calcinosis of cardiac tissues, arteries, and tendons. Different toxic alkaloids have been reported in these species (Halim et al., 1971). It also contains a steroidal glycoside which is hydrolyzed to vitamin D3 and causes increased intestinal absorption of calcium beyond the levels that can physiologically be accommodated (Mair and Love, 2012). C. parqui is also reported to be toxic showing hepatotoxic effects when consumed (Cullen and Stalker, 2016).
The global trade of herbal medicines has been growing by about 15% yearly and the Southeast and South Asian countries are the largest source of raw material for these products (Ming and Sulaiman, 2016). The fast-growing global trade of herbal products also increased the concerns for their safety and quality. The raw herbal material which is used in the production of herbal products is quite hard to identify physically in its dried state. So there is possibility of adulteration of any toxic or non-toxic plants with medicinal plants used in herbal products, as there is lack of proper quality control and standardization protocols in the production of these products (Mbendana et al., 2019; Shaheen et al., 2019). Adulteration in raw plant material can cause serious consequences on health and safety of the consumers which can be countered by developing sensitive and accurate quality control protocols (Srirama et al., 2017). In literatures, many analytical tools are mentioned to detect mixing/adulteration in plant material, including electrophoric techniques, DNA-based tools (genomics), differential scanning calorimetry (DSC), chromatographic tools, fluorescence and vibrational spectroscopy, isotopic detection, elemental tools, NMR spectroscopy, mass spectrometry, liquid chromatography mass spectrometry (LC–MS and LC–MS-MS) (Witjaksono and Alva, 2019). Amongst all, LC–MS and LC–MS-MS are preferred choice for complex samples due to high-throughput and sensitive analysis.
In previously reported studies, identification, and quantification of some metabolites in extracts of C. diurnum, C. parqui and C. nocturnum were done through mass spectrometric techniques (Black et al., 2017; Chaskar et al., 2017; Hughes et al., 1977; Doshi, 2016; Hanhineva et al., 2011). This study aims to develop a method that can help to prevent the adulteration of toxic Cestrum species. For this purpose, two-step strategy was conducted, firstly, comprehensive chemical profiles of three species of Cestrum genus were developed. Secondly, an adulteration study of A. vasica was performed with physically resembling toxic species C. diurnum. A. vasica is a well-known medicinal plant used in many herbal products for the treatment of fever, cough and asthma (Rahman et al., 2019). Due to their similar appearance, there is a strong chance of A. vasica being adulterated with toxic C. diurnum. The aerial parts of A. vasica and C. diurnum are shown in Fig. 1. Furthermore, the cytotoxic effects of all three Cestrum species were evaluated in human peripheral blood mononuclear cells (PBMCs). These profiles would be useful in the prevention of their adulteration and the quality control of herbal formulations.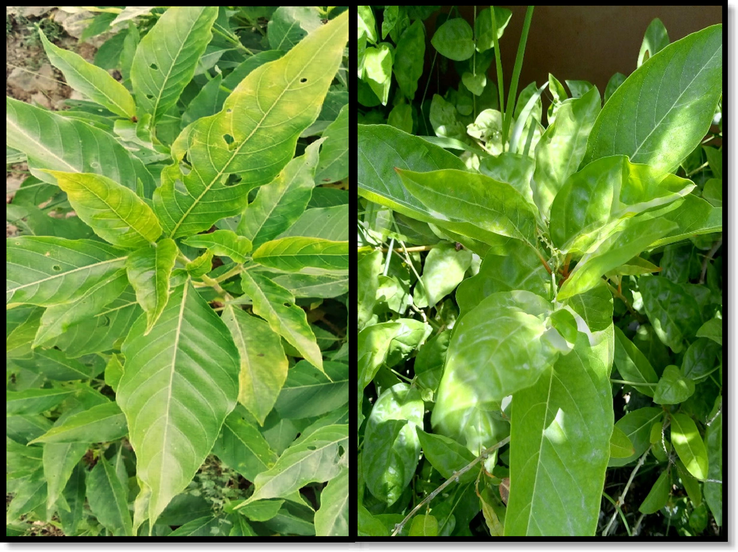
Aerial parts of Adhatoda vasica (left) and Cestrum diurnum (right).
2 Experimental
2.1 Chemicals and reagents
For the preparation of sample solutions and mobile phase, HPLC-grade methanol was acquired from Merck (Darmstadt, Germany) while Ultrapure Type-I water was obtained from the Ultra-pure Water Purifier (GenPure, Waltham, MA., USA). Formic acid (>98% pure) was obtained by DaeJung Chemical and Metals (South Korea).
2.2 Sample collection
C. diurnum, C. parqui and C. nocturnum samples were gathered from different regions of Pakistan including Islamabad, Swat, Lahore, Bajour and Karachi (Supplementary Table 1). The identification of plant samples was carried out by plant taxonomist, Mr. Shabbir Ijaz, Herbarium, University of Karachi.
2.3 Sample preparation
Plant samples were ground, and 1 g of each sample was transferred to a conical centrifuge tube (15 mL) containing 10 mL of methanol. Extraction was done through sonication for 30 min at ambient temperature which was followed by centrifugation at 6000 RPM for 30 min. 1 mL supernatant from each centrifuge tube was filtered through a syringe-driven PTFE filter (0.22 μm) into another centrifuge tube (1.5 mL). For analysis, all the samples were transferred into HPLC vials and twenty times diluted with methanol.
2.4 UHPLC-ESI-QTOF-MS/MS analysis
Chemical fingerprinting of three plant species was performed using high-resolution Bruker maXis-II QTOF Mass Spectrometer (Bremen, Germany) coupled to Thermofisher Ultimate 3000 series Ultra Performance Liquid Chromatography. Macherey-Nagel C-18 column (3.0 × 50 mm, 1.8 µm particle size) was selected for chromatographic separation. Linear mobile phase gradient system was applied, consisting of type-I water as eluent (A) and methanol as eluent (B), with 0.1% formic acid as additive in both mobile phases. Solvent gradient was run as 40% B in 0.0 to 1.0 min, 50% B in 1.0 to 2.0 min, 60% B in 2.0 to 7.0 min, 80% B in 7.0 to 7.5 min, 90% B in 7.5 to 9.0 min and then again 40% B in 9.0 to 9.5 min. The overall run-time was 10 min including 0.5 min of column equilibration at the end. The constant solvent flowrate was set at 0.7 mL/min and 2 μL of each sample was injected through autosampler. The column was maintained at the temperature of 40 °C. Each experiment was accompanied with calibration using sodium formate solution (10 mM). Mass detection range was set between 50 and 1500 m/z. For positive ionization mode, 4500 V of capillary voltage was provided while drying gas (nitrogen) was flown at the rate of 10 mL/min with a temperature of 300 °C. For negative ionization mode, all the parameters were same as with positive ionization mode except for the capillary voltage which was set at 3500 V.
A smart strategy was designed for targeted and untargeted identification of metabolites. The targeted identification was done by generating a custom-made library of compounds reported from these plants. Bruker Daltonics Target Analysis 1.3 (Bremen, Germany) was used to screen the high-resolution mass spectra for these reported compounds by comparing accurate masses and isotopic patterns. The untargeted identification was performed by utilizing different ESI MS/MS libraries such as Mass Bank of North America, NIST MS/MS libraries, and Mass Bank of Europe. All these libraries are easily accessible, and these libraries were incorporated in the NIST MS search system to make searching simple. The parameters like exact masses, isotopic patterns and MS/MS fragmentations were used for identification. The threshold value for high-resolution m/z matching was set under 5 ppm error and for isotopic matching, it was set under 50 mSigma value. DataAnalysis (version 4.4) was utilized to generate Extracted Ion Chromatograms (EIC) of each identified compound.
2.5 Quantitation using HPLC-ESI-IT-MS/MS
Quantitation experiments were performed on Bruker amaZon speed Ion trap mass spectrometer (Bremen, Germany) coupled to Thermofisher Scientific Ultimate 3000 High-Performance Liquid Chromatography system (USA). HPLC system was accompanied with a quaternary pump, a column thermostat, and an auto sampler. Macherey-Nagel C-18 column (3.0 × 50.0 mm, 1.8 µm particle size) was selected for chromatographic separation. Mobile phase contained water (solvent A) and methanol (solvent B), both having 0.1% formic acid as additive. The linear gradient system used was just same as for the profiling experiment. A narrow spectral scan range 50–500 m/z was set to achieve good sensitivity. All the voltages were optimized for maximum resolution and were then set as; endplate offset at 500 V and nozzle voltage at 4500 V. Ion Charge Control (ICC) was set as 20,0000. Drying gas pressure was flown with a rate of 4.0 L/min, 49.9 °C temperature and 10.0 psi pressure. The accumulation time was set at 200 ms while an average of 5 spectra was fixed. Six calibration solutions were prepared ranging 1–2000 ng/mL concentration.
For method validation, three QC samples were prepared with concentrations 25, 175 and 375 ng/mL. QC samples were analysed with six replicates each for intra-day and inter-day analysis. The percent relative standard deviation (%RSD) values were used to determine precision while percent accuracy was used to determine accuracy.
2.6 Preparation of adulterated samples
Shade-dried samples of A. vasica (medicinal plant) and toxic plant C. diurnum were ground to a fine powder and mixed at different ratios. Total, nine powdered plant samples were prepared, 10 g each, with 1%, 2%, 5%, 10%, 20%, 30%, 40%, 50% and 60% mixing of toxic C. diurnum. The remaining sample preparation strategy was same as for the chemical fingerprinting.
2.7 Cytotoxicity assay of Cestrum species
Human peripheral blood mononuclear cells (PBMCs) were extracted from the whole blood using a gradient density centrifugation technique utilizing Ficoll-hypaque (Sigma, USA). 10 mL of the venous whole blood sample was collected from a healthy volunteer in a heparinised tube. The blood was gently layered on 5 mL Ficoll medium in 15 mL tube and centrifuged for 20 min at 400g with breaks off. The cells in the interphase (buffy coat) representing PBMCs were softly aspirated out and transferred aseptically into sterile centrifuge tubes. The isolated cells were cleaned with 10 mL sterile 1x PBS (phosphate buffer saline) solution at 200g for 10 min to remove the platelets. Trypan Blue dye exclusion method was used to count the PBMCs.
Isolated PBMCs were cultured in RPM1 (Roswell Park Memorial Institute)-1640 medium (Gibco, UK) supplemented with 10% FBS (Fetal bovine serum) (Gibco, USA) 1% Pen/Strep (Gibco, Germany) at 37 °C and 5% CO2 in humidified conditions. PBMCs were seeded in 96 well plates at density 4 × 10⁴ cells per well having 100 μL complete culture media. The cells were dosed with methanolic extracts of CN, CP and CD at 200, 100, 50, 25, 12.5, 6.25 and 3.12 μg/mL, and DMSO (Sigma, USA) as vehicle control. The treated cultures were incubated for 48 h at 37 °C and 5% CO2 in moistened conditions.
The effects of C. nocturnum, C. parqui and C. diurnum extracts on cell viability were determined using Alamar Blue (Resazurin). Briefly, 10 μL of 0.02% Alamar blue (Thermo scientific, USA) solution was added to post-treatment PBMCs cultured in 96 well plates and incubated for 8 h in a CO2 incubator at 37 °C. The fluorescence readings were measured at 560 nm excitation and 590 nm emission wavelengths, using Thermofisher Scientific Varioskan LUX multimode microplate reader and SkanIt tool version 4.1. The half-maximal inhibitory concentration (IC50) values were calculated, and the percent cell viability was used to determine the cytotoxic effects of tested extracts. The data was analysed through GraphPad Prism v6.01 through two-way ANOVA and Bonferroni P-value test for multiple comparisons and represented as mean ± SD, n = 3. <0.05P-value was believed to be statistically substantial. Independent Ethics Committee, International Center for Chemical and Biological Sciences has approved the study protocols under protocol number ICCBS/IEC-022-HB-2019/Protocol/1.0.
2.8 Compliance with ethics requirements
Independent Ethics Committee working under International Center for Chemical and Biological Sciences has approved all the study protocols under protocol number ICCBS/IEC-022-HB-2019/Protocol/1.0. All procedures followed were in according to Helsinki Declaration of 1975 (revised 2008). Informed permission was taken from volunteer before involving in the research.
3 Results and discussion
3.1 Chemical fingerprinting and identification of compounds
Chromatographic conditions were optimized for good shape and well separated peak. The overall runtime along with equilibration was kept within 10 min while the solvent flowrate was fixed at 0.7 mL/min. The LC-MS chromatograms of each Cestrum species collected from different regions of Pakistan were observed quite similar except for some variations in peak intensities (Supplementary Fig. 1). A total of forty-three plant metabolite were identified by comparing accurate masses, fragmentation data and isotopic pattern (Table 1). The MS/MS spectra of these compounds are given in Supplementary Table 2. Most of the identified compounds belong to carboxylic acids, esters, and flavonoids classes of compounds.
3.2 Chemometric analysis
Heatmap cluster analysis of identified compounds was performed using software Perseus (1.6.2.1) to study the distribution of these compounds in all the samples. For heat maps, log2(X) transformed peak areas were used. Identified compounds were screened in all the twenty plant samples using Target Analysis and Data Analysis acquisition software. Heatmap clusters showed good similarities in the spread of compounds in plant samples growing at different regions.
Heat-map cluster analysis demonstrates a clear spread of compounds in selected Cestrum species (Fig. 2). Heatmap showed nornicotine (compound 09) present in all samples of all three species with no significant difference in intensities. The identified compounds were mostly found in C. diurnum samples including compounds 12, 13, 15, 18, 27, 32 and 39, contrarily compound 20, 34 and 42 are specific in Cestrum nocturnum while no compound was found specific to C. parqui samples only. These compounds are important in chemical profiles as they are differentiative. The clustering has shown clear grouping of all the samples related to each species except sample CP2. This split in clustering of C. parqui samples could be attributed to variation in metabolites due to growing conditions, genotype and age of plant (Verma and Shukla, 2015).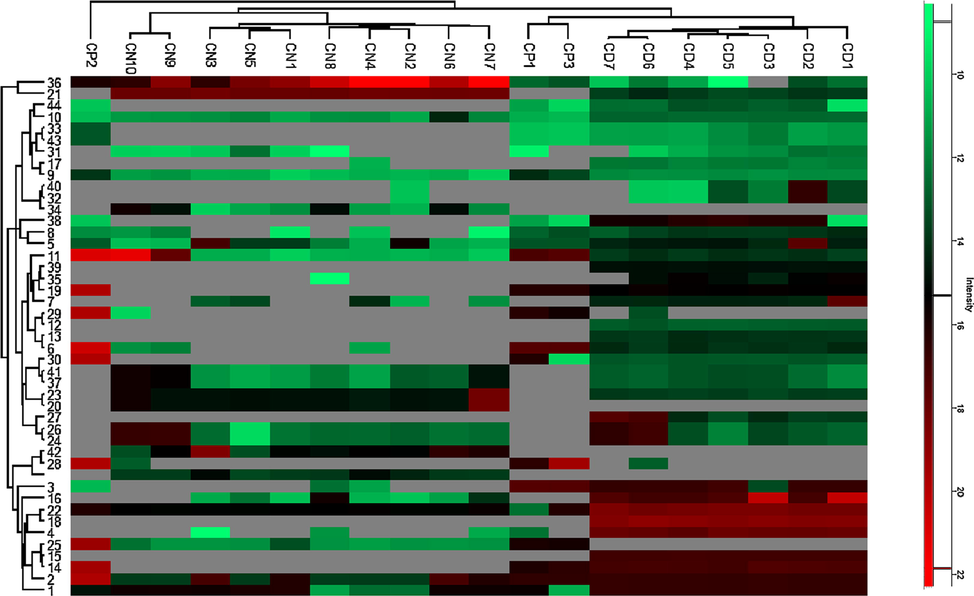
Heatmap cluster of identified compounds in all samples.
SIMCA version 14.1 (Umetrics, Sweden) was used to produce principal component analysis (PCA plot) according to peak areas of found compounds. The discrimination between the three species was determined. All the C. diurnum samples were clearly discriminated against with other samples of C. nocturnum and C. parqui lied quite separated in the plot with clear discrimination between them. The PCA plots of positive and negative ionization modes data are given Supplementary Fig. 2, respectively. Venn diagrams were also created employing Umetrics SIMCA 14.1 (Sweden), to show the possible relationships between these three different groups of Cestrum species based on mutually identified compounds. The Venn diagrams are given in Supplementary Fig. 3.
3.3 Quantification of nornicotine
From the identified compounds, nornicotine was selected for quantitation in C. diurnum, C. parqui and C. nocturnum samples as it is one of the mutually identified toxic compounds of these plants (Nishtha and Rao, 2017) There are many reported cases of neurotoxicity and cardiotoxicity caused by nornicotine (Holtman et al., 2010; Kovacic and Thurn, 2005; Stairs et al., 2007; Sundaragiri and Tandur, 2016). Nornicotine was quite stable and showed good mass spectrometric features. Chemical structure of nornicotine, MS/MS fragments and calibration curve are given in Supplementary Fig. 4. A good chromatographic separation is necessary for LC-MS analysis, which was optimized using a reverse phase (C-18) column. The overall runtime was limited to 8 mins with equilibration. Positive ionization mode mass spectrometry was found more compatible with nornicotine as it showed better sensitivity than negative ionization mode. A good shaped and intense parent ion peak was observed at 0.45 min and selected for MS/MS transitions. 149.0 m/z and 132.0 m/z were selected as quantifier ions and to get good intensity peaks, fragmentor amplitude was optimized and set at 90 V. Nornicotine was found abundant in all the samples and its concentration (mg/Kg) is given in Supplementary Table 3. The concentration of nornicotine is in the range of 10.04 to 11.27 mg/Kg in collected samples of Cestrum species. The developed quantitation method has shown good accuracy (98.7 to 103.0%) and reproducibility (under 4.8 %RSD). Supplementary Table 4 shows the results of the method validation experiment.
3.4 Adulteration studies using LC-ESI–QTOF-MS/MS
Chemical profiles of C. diurnum and A. vasica were generated using LC-ESI-QTOF analysis with the same conditions of positive ionization mode. Detailed chemical profiles of A. vasica along with quantitation of bioactive metabolites have already been published (Rahman et al., 2019). The chemical profiles of both plants were compared and the region of 3 min to 6.5 min was aimed due to presence of C. diurnum related peaks. Five marker compounds were selected based on (i) visible peak chromatogram in C. diurnum, (ii) absent in A. vasica and (iii) identified compounds. These compounds are 5-hydroxy-2-[2-hydroxy-3-[(2S,3R,4S,5S,6R)-3,4,5-trihydroxy-6-(hydroxymethyl)oxan-2-yl]oxyphenyl]-7,8-dimethoxychromen-4-one (A) at 2.8 min., ladroside (B) 3.4 min., plumbagine at 3.9 min. (C), 7-hydroxy-4-(methoxymethyl)coumarin (D) at 3.9 min. and 1-(β-D-Glucopyranosyloxy)-1,4a,5,6,7,7a-hexahydro-5-hydroxy-7-methyl-6-[[(2E)-1-oxo-3-phenyl-2-propen-1-yl]oxy]-, methyl ester, (1S,4aS,5S,6R,7R,7aR)-cyclopenta[C]pyran-4-carboxylic acid (E) at 5.1 min. (Table 1). Their extracted ions chromatograms and fragment ions are shown in Supplementary Fig. 5. Profiles of adulterated samples with different percent mixing of C. diurnum were also produced and their peak areas were plotted to check the lowest detectable percentage of C. diurnum in the adulterated sample (Fig. 3). The comparative profiles showed that the developed method was able to detect as low as 5% mixing of C. diurnum in medicinal plant A. vasica.
Codes
Compound names
Formula
R.T
Adduct
m/z Observed
m/z calculated
Error (ppm)
MS/MS fragments
1
3α-Galactobiose
C12H22O11
0.5
[M + H]+
365.1059
365.1054
1.3
347.0963, 203.9517, 185.0409
2
Glycan 3α-Galactobiose
C12H22O11
0.5
[M + H]+
365.1067
365.1054
3.5
347.0963, 203.9517, 185.0409
3
Methyl (1S,4aS,5R,7S,7aS)-1-(β-D-glucopyranosyloxy)-5,7-dihydroxy-7-methyl-1,4α,5,6,7,7α -hexahydrocyclopenta[C]pyran-4-carboxylate
C17H26O11
0.6
[M + H]+
429.1372
429.1376
2.1
267.0839, 235.0568
4
Lamiide
C17H26O12
0.6
[M + Na]+
445.1322
445.1322
0.0
445.1523, 233.0420, 265.0691 , 283.0802
5
Sinapinic acid
C11H12O5
0.7
[M + H]+
225.0763
225.0757
2.6
147.0422, 174.0534, 192.0647
6
Genipin
C11H14O5
0.7
[M + H]+
227.0919
227.0912
3.0
165.0542, 175.0386
7
6,8-Dihydroxy-7-methoxy-3-methyl-3,4-dihydroisochromen-1-one
C11H12O5
0.8
[M + H]+
225.0756
225.0754
3.9
179.0687, 147.0422
8
Acteoside
C29H36O15
1.4
[M + H]+
647.1951
647.1946
0.7
163.0398, 467.1526
9
Nornicotine
C10H12N2
0.4
[M + H]+
148.2184
148.2181
0.6
132.0
10
2-Hydroxy-2-(4-methoxyphenyl)-1-methylethyl hexopyranoside
C16H24O8
1.7
[M + Na]+
367.1369
367.1360
2.4
185.0410, 203.0670
11
1-(β-D-Glucopyranosyloxy)-1,4a,5,6,7,7a-hexahydro-6-[[(2E)-3-(4-hydroxy-3-methoxyphenyl)-1-oxo-2-propen-1-yl]oxy]-7-methyl-, (1S,4aS,6S,7R,7aS)- cyclopenta[C]pyran-4-carboxylic acid
C26H34O13
2.7
[M + Na]+
553.1921
553.1916
0.9
337.1311, 195.0641, 177.0529
12
5-Hydroxy-3-[4-hydroxy-2-[(2S,3R,4S,5S,6R)-3,4,5-trihydroxy-6-(hydroxymethyl)oxan-2-yl]oxyphenyl]-7-methoxychromen-4-one
C22H22O11
2.7
[M + Na]+
485.1063
485.1067
0.8
323.0500
13
Phenylalanine
C9H11NO2
0.6
[M + H]+
166.0820
166.0859
2.3
152.1058
14
Scoparone
C11H10O4
2.8
[M + H]+
207.0657
207.0652
2.4
179.0700
15
5-Hydroxy-2-[2-hydroxy-3-[(2S,3R,4S,5S,6R)-3,4,5-trihydroxy-6-(hydroxymethyl)oxan-2-yl]oxyphenyl]-7,8-dimethoxychromen-4-one (A)a
C23H24O12
2.8
[M + Na]+
515.1165
515.1160
0.9
353.0626, 185.0421
16
Oenin
C23H25O12
2.8
[M]+
493.1341
493.1336
1.0
331.0808, 316.0568
17
Petunidin-3-O- β-glucoside
C22H23O12
3.3
[M]+
479.1189
479.1189
0.0
317.0651
18
Ladroside (B)a
C26H32O13
3.4
[M + H]+
575.1740
575.1724
2.7
373.1321, 177.0529, 195.0641
19
2-Methoxy-1,4-naphthoquinone (C)a
C11H8O3
3.9
[M + H]+
189.0551
189.0488
3.3
187.0910, 161.0571
20
7-Hydroxy-4-(methoxymethyl)coumarin (D)a
C11H10O4
2.8
[M + H]+
207.0657
207.0652
2.4
147.0436, 161.0583, 157.0388, 192.0415
21
Coumarin-6-carboxaldehyde
C10H6O3
4.0
[M + H]+
175.0399
175.0395
2.2
147.0436
22
4-Hydroxynaphthalene-1,2-dione
C10H6O3
4.0
[M + H]+
175.0399
175.0387
4.8
147.0439
23
1-(β-D-Glucopyranosyloxy)-1,4a,5,6,7,7a-hexahydro-5-hydroxy-7-methyl-6-[[(2E)-1-oxo-3-phenyl-2-propen-1-yl]oxy]-, methyl ester, (1S,4aS,5S,6R,7R,7aR)- Cyclopenta[C]pyran-4-carboxylic acid (E)a
C26H32O12
5.1
[M + H]+
559.1799
559.1795
0.8
357.1346, 225.1083, 277.0912, 195.0642, 177.0530, 149.0602
24
Protopine
C20H19NO5
6.0
[M + H]+
354.1333
354.1336
0.8
336.1234, 265.0380, 223.0837, 206.0810
25
Sphinganine
C20H30O
8.5
[M + H]+
287.2688
287.2697
1.7
270.2474, 226.2160
26
Benzyl dodecyl-dimethyl ammoniumb
C21H38N
8.4
[M + H]+
304.2991
304.2998
0.2
212.2368
27
Malvidin 3-O-β-D-glucoside
C12H25O12
2.8
[M + H]+
493.1341
493.1341
1.0
331.0808, 315.0368
28
3-(2,4-Dihydroxypentyl)-8-hydroxy-6-methoxyisochromen-1-one
C22H23O12
0.6
[M + H]+
295.1131
295.1176
1.7
277.1020, 259.1020
29
4-Hydroxynapthalene-1,2-dione
C10H6O3
4.0
[M + H]+
175.0384
175.0387
1.7
147.0439
30
Indole-3-lactic acid
C11H11NO3
0.8
[M + H-H2O]+
188.0707
188.0706
0.5
146.0606, 170.0602
31
Benzoylcholine
C12H18NO2
0.6
[M]+
208.1324
208.1327
0.8
149.0571
32
Temazepam
C16H13ClN2O2
2.1
[M + H]+
301.0820
301.0738
2.7
283.0715, 255.0763
33
S-Hexylglutathione
C16H29N3O6S
4.5
[M + Na]+
414.1655
414.1669
3.3
396.1532
34
Shanzhiside methyl ester
C17H26O11
0.7
[M + H]+
406.1553
406.1548
1.2
195.0639, 177.0530, 167.0682, 149.0570
35
5-Hydroxy-2-methyl-7-[(2S,3R,4S,5S,6R)-3,4,5-trihydroxy-6-(hydroxymethyl)oxan-2-yl]oxychromen-4-one
C16H18O9
0.6
[M + H]+
355.1014
355.1024
2.8
194.0483, 193.0457
36
Methyl (1S,4aS,6R,7R,7aR)-1-(β-D-glucopyranosyloxy)-5,6-dihydroxy-7-methyl-1,4a,5,6,7,7a-hexahydrocyclopenta[C]pyran-4-carboxylate
C17H26O11
0.8
[M + FA-H]−
451.1459
451.1479
4.4
405.1396, 243.0875
37
Acetocide
C29H36O15
1.4
[M−H]−
623.1977
623.1981
0.6
461.1659, 179.0351, 161.0243
38
Methyl (1S,4aR,6S,7R,7aS)-1-(β-D-glucopyranosyloxy)-4a,6,7-trihydroxy-7-methyl-1,4a,5,6,7,7a-hexahydrocyclopenta[C]pyran-4-carboxylate
C17H26O12
0.8
[M + FA-H]−
467.1409
467.1406
0.6
403.1248, 331.1045, 259.0825, 241.0717, 179.0563
39
Methyl 1-(hexopyranosyloxy)-5,6-dihydroxy-7-({[(2E)-3-(4-hydroxyphenyl)-2-propenoyl]oxy}methyl)-1,4a,5,6,7,7a-hexahydrocyclopenta[C]pyran-4-carboxylate
C26H32O14
2.8
[M−H]−
567.1714
567.1720
1.0
387.1077, 303.0866, 179.0346, 163.0400
40
2-(3,5-Dihydroxy-4-methoxyphenyl)-5,7-dihydroxy-3-[(2S,3R,4R,5R,6S)-3,4,5-trihydroxy-6-methyloxan-2-yl]oxychromen-4-one
C22H22O12
3.1
[M−H]−
477.1035
477.1038
0.6
315.0510
41
Petunidin-3-O- β-glucoside
C22H22O12
3.1
[M−H]−
477.1035
477.1047
2.5
315.0510
42
9-Hydroxy-10E,12Z-octadecadienoic acid
C18H32O3
9.6
[M−H]−
295.2274
295.2284
3.3
277.2165, 171.1026
43
12(13)-Epoxy-9Z-octadecenoic acid
C18H32O3
9.6
[M−H]−
295.2274
295.2278
1.3
277.2165, 195.1387, 171.1026
44
Lactitol
C12H24O11
1.8
[M−H]−
343.1289
343.1247
1.2
181.0815
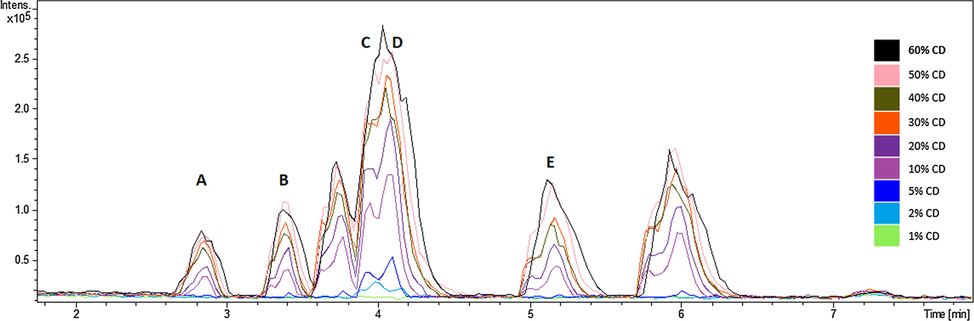
Positive ionization base peak chromatogram (BPC) of Cestrum diurnum and Adhatoda vasica mixed at different ratios.
3.5 Comparative cytotoxic effect of Cestrum species on PBMCs
The cytotoxic effects of crude methanolic extracts of three Cestrum species were determined against PBMCs isolated from a healthy donor, at concentrations range of 3.12–200 μg/mL. A noteworthy decrease in cell viability was observed in treated PBMCs in dose-dependent way which indicates that extracts from all three species of Cestrum (C. diurnum, C. parqui and C. nocturnum) were highly cytotoxic. The extract of C. nocturnum showed a high level of cytotoxicity and significantly induced cell death at a concentration ≥ 6.25 μg/mL with IC50 12.5 ± 1.4 μg/mL (Fig. 4A). Extract of C. diurnum significantly inhibited cells viability at ≥ 12.5 μg/mL with IC50 28 ± 3.3 μg/mL (Fig. 4B), while C. parqui extract displayed cytotoxic effects toward PBMCs at ≥ 25 μg/mL with IC50 29.3 ± 3.5 μg/mL (Fig. 4C). Moreover, the C. nocturnum was found significantly more toxic at 12.5, 25 and 50 μg/mL as compared to C. diurnum and C. parqui. However, no statistically substantial variation was found among cytotoxic effects of C. diurnum and C. parqui extracts at any concentration as shown in Fig. 4D.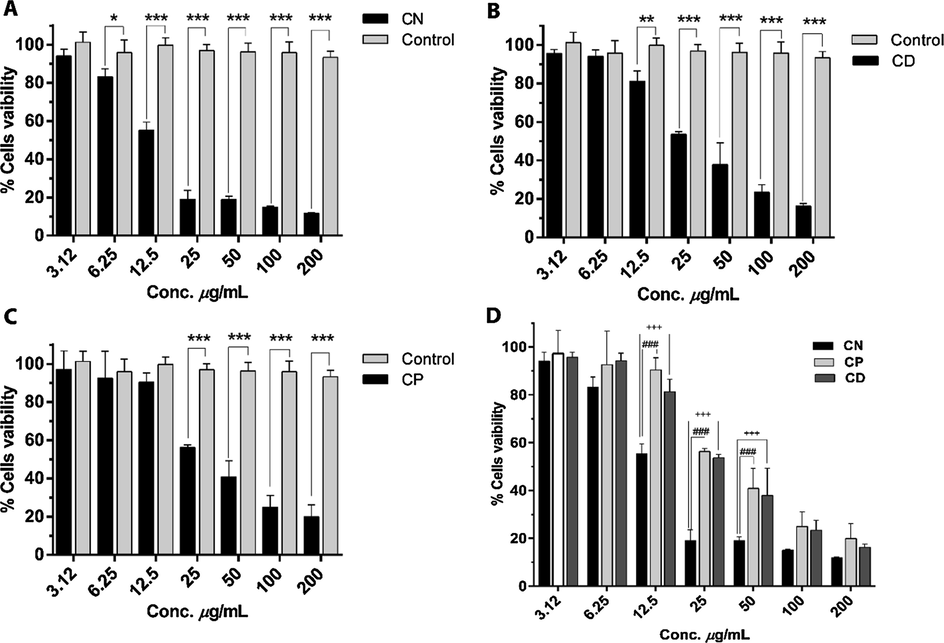
(A-C) Cytotoxic effects of different concentrations of CN (C. nocturnum), CP (C. parqui) and CD (C. diurnum) methanol extract on human PBMCs at 48 h. (D) Comparison between the cytotoxic effects of CN, CD and CP indicate that 12.5 to 50 μg/mL concentrations of CN significantly decrease the PBMCs viability as compared to CD and CP. The data represented as mean ± SD, n = 3. *P value < 0.05 **P value < 0.01, ***P < 0.001 vs control. ###P value < 0.001 CN vs CP. +++P value < 0.001 CN vs CD.
4 Conclusion
A rapid and sensitive method was developed using high-resolution LC-QTOF-MS/MS analysis for chemical profiling and identification of secondary metabolites in three toxic species of Cestrum and to study the adulteration of a toxic plant with the herbal plant material. Phytotoxicity of methanolic extracts of three Cestrum species were observed PBMCs isolated from a healthy donor. Different chemometric means were utilized to study the spread of forty-three identified compounds in multiple samples of all three species for the development of characteristic fingerprint. The phytochemical profiles developed would also be helpful in taxonomical identification, toxicological studies and to study the bioactive components of these plants. Similarly, adulteration protocol will be very helpful to prevent accidental consumption of this toxic species and help to develop quality control methods.
Acknowledgments
The authors acknowledge the support of Organization for the Prohibition of Chemical Weapons (OPCW) for research funding under project number S/1258/2015. The authors are also grateful to Mr. Saeedur Rahman and Mr. Shabbir Ijaz for sample collection and Mr. Junaid Ul Haq and Mr. Arsalan Tahir for technical help.
Declaration of Competing Interest
The authors declare no conflict of interest
References
- Screening approach by ultra-high performance liquid chromatography-tandem mass spectrometry for the blood quantification of thirty-four toxic principles of plant origin. Application to forensic toxicology. J. Chromat. B Anal. Technol. Biomed. Life Sci.. 2015;975:65-76.
- [Google Scholar]
- Gas Chromatography-Mass Spectroscopy Studies on Cestrum nocturnum Macerated Methanolic Extract. Asian J. Pharm. Clin. Res.. 2017;10(3):258263
- [Google Scholar]
- Cullen, J.M., Stalker, M.J., 2016. Liver and Biliary System, 258–352.e1.
- Pharmacognostic quantification of flavonoids by high performance thin layer chromatography and in vitro cell line study on developed herbal formulation from Cestrum nocturnum plant extract. Int. J. Green Pharm. (IJGP). 2016;10(03)
- [Google Scholar]
- Safe and Poisonous Garden Plants. Davis USA: University of California; 2012.
- Alkaloids produced by Cestrum nocturnum and Cestrum diurnum. Planta Med.. 1971;20(1):44-53.
- [Google Scholar]
- Identification of novel lignans in the whole grain rye bran by non-targeted LC–MS metabolite profiling. Metabolomics. 2011;8(3):399-409.
- [Google Scholar]
- The analgesic and toxic effects of nornicotine enantiomers alone and in interaction with morphine in rodent models of acute and persistent pain. Pharmacol. Biochem. Behav.. 2010;94(3):352-362.
- [Google Scholar]
- Presence of 1,25-dihydroxyvitamin D3-glycoside in the calcinogenic plant Cestrum diurnum. Nature. 1977;268(5618):347-349.
- [Google Scholar]
- Cardiovascular toxicity from the perspective of oxidative stress, electron transfer, and prevention by antioxidants. Curr. Vasc. Pharmacol.. 2005;3(2):107-117.
- [Google Scholar]
- Mair, T.S., Love, S., 2012. Metabolic diseases and toxicology, pp. 461–468.
- Practices at herbal (muthi) markets in Gauteng, South Africa and their impact on the health of the consumers: A case study of KwaMai-Mai and Marabastad muthi markets. S. Afr. J. Bot.. 2019;126:30-39.
- [Google Scholar]
- Use of herbal products in Southeast Asian countries. Arch. Pharm. Pract.. 2016;7(5):1.
- [Google Scholar]
- Nishtha, Richa, Rao, A., 2017. Phytochemical analysis and anatomical study of two species of cestrum from Chandigarh. Int. J. Pharmaceut. Sci. Res., 8, 12, pp. 5234-5240.
- Combining untargeted and targeted metabolomics approaches for the standardization of polyherbal formulations through UPLC-MS/MS. Metabolomics. 2019;15(9):116.
- [Google Scholar]
- Microscopic techniques used for the identification of medicinal plants: A case study of Senna. Microsc. Res. Tech.. 2019;82(10):1660-1667.
- [Google Scholar]
- Species adulteration in the herbal trade: causes, consequences and mitigation. Drug Saf.. 2017;40(8):651-661.
- [Google Scholar]
- Effects of nornicotine enantiomers on intravenous S(-)-nicotine self-administration and cardiovascular function in rats. Psychopharmacology. 2007;190(2):145-155.
- [Google Scholar]
- Electrocardiographic profile of cardiotoxic plants and animals. Int. J. Med. Res. Health Sci.. 2016;11:719-725.
- [Google Scholar]
- Impact of various factors responsible for fluctuation in plant secondary metabolites. J. Appl. Res. Med. Aromat. Plants. 2015;2(4):105-113.
- [Google Scholar]
- Witjaksono, G., Alva, S., 2019. Applications of Mass Spectrometry to the Analysis of Adulterated Food.
Appendix A
Supplementary material
Supplementary data to this article can be found online at https://doi.org/10.1016/j.arabjc.2020.09.016.
Appendix A
Supplementary material
The following are the Supplementary data to this article:Supplementary data 1
Supplementary data 1


