

Translate this page into:
Defluoridation in aqueous solution by a composite of reduced graphene oxide decorated with cuprous oxide via sonochemical
⁎Corresponding author at: Dept. of Inorganic & Analytical Chemistry, Andhra University, Visakhapatnam 530003, India. bsathish401@gmail.com (Sathish Mohan Botsa)
-
Received: ,
Accepted: ,
This article was originally published by Elsevier and was migrated to Scientific Scholar after the change of Publisher.
Peer review under responsibility of King Saud University.
Abstract
The World Health Organization (WHO) has recommended the fluoride level in drinking water (1.5 mg/L) and defluoridation of water is an essential to remove of fluoride from contaminated water. Hence, the effective and rapid adsorbent Cuprous oxide-reduced graphene oxide (Cu2O-RGO) composite was developed to overwhelm this concern. Sonochemical approach was adopted for the synthesis of desirable composite which was further characterized by XRD, FTIR, SEM, and EDS. The optimized composite (30 mg) shown the significant adsorption capacity of 34 mg/g of F− solution (pH = 9), 70% removal of F− solution from real experiment and Freundlich model was fitted than Langmuir and Temkin isotherms. The experimental results corroborate that adsorbent is the most effective for removal of fluoride from its polluted water.
Keywords
Cuprous oxide
Reduced graphene oxide
Sonochemical
Defluoridation
Adsorption

1 Introduction
Fluoride ion is ubiquitous in water, groundwater may contain high levels of fluoride by exposure to inorganic fluoride-containing minerals causing teeth molting and graze of endocrine glands, thyroid, and liver due to ground water is the major source of Fluoride. Fluoride is a very toxic element and known to cause adverse health effects on living humans and animals due to environmental and occupational exposure (Krachler and Emons, 2001). Fluoride has been classified as a important pollutant by the United States Environmental Protection Agency (US EPA) and the German Research Council (Cabral et al., 2008). The World Health Organization (WHO) has recommended the fluoride level in drinking water is 1.5 mg/L and Bureau of Indian standards (BIS) recommends 1 mg/L. Copious approaches like coagulation-precipitation, membrane separation, ion exchange, adsorption and others (electro-dialysis and electrochemical) are existed for defluoridation but each method have their compensations and limitations (Sanghratna and Arfin, 2015). However these methods except adsorption have significant disadvantages, which are for instance incomplete removal, high-energy requirements, production of toxic sludge or waste products that also require disposal and become economically unviable for the removal of heavy metals at lower concentrations (Aklil et al., 2004). Contrast to them, the adsorption technique is broadly utilized and offers acceptable results and is by all accounts more appealing technique for the removal of fluoride regarding expense, straight forwardness of outline and operation.
Since the adsorption is due to H-bonding, the more electronegative F-ion gets adsorbed first and then the other anions (Gavalas et al., 2004). The preference of adsorption of anions may be in the following order: F− > Cl− > NO3− > SO42−. Few carbon-based sorbents have also been explored for fluoride removal by various researchers (Singh et al., 2016). Many adsorbents both natural and synthetic have been successfully experimented for F− removal including agricultural waste, carbon-based materials, activated alumina, calcite, granular ferric hydroxide, and fly ash (Bazrafshan et al., 2016). The unique physicochemical properties and large surface-to-volume ratio of the nanomaterials make them very efficient, cost-effective, and attractive separation media for water purification (Ali et al., 2017). Till now, many adsorbents have been reported for the removal of F- from its contaminated water including metal oxides/hydroxides (zirconium and cerium modified materials, hydroxyapatite, ferric oxide/hydroxide, Titanium and Magnesium derived adsorbents, etc.), geomaterials (bauxite, haematite, etc.), biosorbents (seed extracts of Moringa oleifera, etc.) and carbonaceous materials (activated carbon, charcoal,) (Stanic et al., 2014). Moreover, the nanoparticles (NPs) showed higher adsorption efficiency especially due to higher surface area and greater active sites for interaction with metallic species. Furthermore, the adsorbents with specific functional groups have been developed to improve the adsorption capacity (Farghali et al., 2013). Nanoscale metal oxides potentially offer a more cost-efficient water treatment and remediation technology due to their size and adsorption efficiency (Engates and Shipley, 2010).
In point of that, Cuprous oxide (Cu2O) nanoparticles have a great adsorption capacity of heavy metals on their surface (Huang et al., 2009). Moreover, Cu2O is a direct bandgap (2.0 eV) semiconductor with attractive p-type oxide for visible-light-driven photocatalysis, and battery cells (An et al., 2014; Botsa et al., 2019). Moreover, recently the graphene oxide-based nanocomposites (GO) with copper oxides have captured considerable attention due to their unique properties and the large variety of possible applications, ranging from sensing and energy storage to heterogeneous, electro, and photocatalysis due to great specific area, chemical inertness, great mechanical strength, and excellent electrical and thermal conductivities, the utilization of graphene as an active support framework for functional nanoparticles (NPs) has open promising research areas (Ramesh et al., 2020; Sathish Mohan et al., 2019; Sree et al., 2020). Several researchers have stated that reduced graphene oxide (RGO) decorated with metal oxides possess great applications such as photocurrent response, NIR detecting and photodegradation of dyes as RGO accelerates the catalytic activity and pure crystallinity of pure metal oxide (Azarang et al., 2014, 2015; Yousefi et al., 2016; Sookhakian et al., 2017). So far, few studies are available on decoration of Cu2O-RGO composite by one-pot, microwave, wet-reduction, hydrothermal method, and composite applications to hydrogen generation, detection of dopamine and uric acid, conversion of CO2, removal of organic pollutant, and supercapacitors (Tran et al., 2012a; Aparna et al., 2018; An et al., 2014; Li et al., 2013).
Therefore in this manuscript, we report a facile sonochemical synthesis route for the preparation of adsorbent Cu2O-RGO composite and characterized by series of instruments, its adsorption efficiency on Fluoride ion from contaminated water was explored with adsorption isotherm models such as Langmuir, Temkin and Freundlich. The case study was conducted on the adsorption effect of prepared composite on fluoride containing water and optimized the conditions like pH, adsorbent dose for batch processing.
2 Materials and methodology
The materials are Graphite flakes, Potassium permanganate (KMnO4), Hydrogen peroxide (H2O2, 30%), Hydrochloric acid (HCl), Sulphuric acid (H2SO4, 98%), Sodium nitrite (NaNO3), Copper acetate Cu(CH3COO)2, Hydrazine hydrate (N2H4 H2O), Sodium hydroxide (NaOH), and Sodium fluoride (NaF), were purchased from Merck Chemicals Pvt. Ltd, India and were used as received.
2.1 Preparation of adsorbent
In a simple synthesis of Cuprous oxide and reduced graphene oxide composite, addition of 0.25 M 100 mL Cu(CH3COO)2 H2O was ultrasonicated for 10 min and then GO (50 mg and 100 mg) was added under ultrasonication for 20 min. To the homogeneous reaction mixture, 100 mL of 0.1 M NaOH was added, ultrasonicated for 30 min and 1.2 mL hydrazine hydrate dropwise was added (Fig. 3). The reaction system was exposed to high-intensity ultrasonic irradiation of 20 KHz for 20 min. The red precipitate was centrifugated, washed with distilled water and absolute ethanol in periodically, and then dried at 60 °C under vacuum to obtain the Cu2O/RGO (1, 2) nanocomposites.
2.2 Graphene oxide (GO) synthesis
In our previous reports (Sathish Mohan et al., 2019; Sree et al., 2020); Graphene oxide (GO) was obtained using universal Modified Hummers method. In briefly, the primary materials are graphite flakes (1.0 g), KMnO4 (3.0 g) and NaNO3 (0.5 g) were taken in a round bottom flask which contains concentrated H2SO4 (23 mL) under an ice bath followed by the vigorously stirring for 30 min. After that,the aqueous solution (46 mL) was added to above mixture and this reaction was continued for 15 min at 96 °C. Later, the temperature was declined to 60 °C and H2O2 (30%, 10 mL) was added. The reaction was further continued for 2 hrs and finally filtered, washed with HCl solution, then washed three times with Milli Q water and finally, the material was dried under room temperature-controlled vacuum for further use.
2.3 Instrumentation for adsorbent
The prepared adsorbent was studied their pure phase confirmation, morphology by XRD (Bruker) with Cu-kα wavelength at the scan rate speed of 0.02°/C and the range of 10 to 80°, FTIR (IR prestige 21 shimadzu) was used at spectra ranges from 500 to 4000 cm−1, SEM and EDX analysis by Quanta FEG 450.
2.4 Defluoridation process
The defluoridation of water by adsorption was examined at batch mode. Initially, a stock of F− solution was prepared with Milli Q water from which serial dilutions were made. In adsorption process, firstly known concentration of F− solution poured into a beaker with the 50 mg of composite and stirring well for 30 min in a dark environment for reach the equilibrium of adsorption–desorption among the composite surface and F− solution. All of the experiments were carried out at 30 ± 5 °C temperature. Fluoride ion concentration was measured with an automatic ion analyser and the pH of the solution was also measured by Orion ion selective equipment. The effects of different dosages of sorbent on fluoride uptake were studied by keeping the initial fluoride concentration and volume of the solution steady at 10 mg/L and 50 mL respectively at pH 4. The fluoride concentration is retained in the adsorbent phase, qe (mg/g), was calculated according to Eq. (1),
3 Results and discussion
3.1 Fabrication of Cu2O-RGO composite
The fabrication of cuprous oxide-reduced graphene oxide (Cu2O-RGO) composite by using ultrsonications with Cu(CH3COO)2, NaOH and GO. At start, the Cu(CH3COO)2 solution was ultrasonicated and ionised into Cu(II) which further combined with OH from NaOH to form Cu(OH)2. A pinch of hydrazine added slowly to the above mixture solution preceded by calculated GO amount. Simultaneously, GO and Cu(OH)2 were reduced into RGO and Cu2O respectively as shown in Eqs. (2)–(4).
3.2 Characterization of adsorbent
Fig. 1(i) exhibits the XRD patterns of prepared GO, Cu2O and Cu2O/RGO NCs and it can be seen from Fig. 1(i)a that GO displays the important two peaks were located at 2θ = 11° and 43° were indexed to respective planes of (0 0 2) and (1 0 0) (Ju et al., 2019). The prepared Cu2O and Cu2O/RGO NCs shown the diffraction peaks at (2θ = ) 39°, 43°, 50.7° and 74° represent the planes of (1 1 1), (2 0 0), and (3 1 1) respectively and compared these planes with JCPDS (file No: 05-0667) of octahedral Cu2O (Feng et al., 2012). The corresponding GO peaks were absent in prepared Cu2O/RGO NCs, due to GO was completely reduced into RGO. Though, the crystallinity phase is not changed as no impure peaks in sonochemically synthesized Cu2O/RGO NCs (Lee et al., 2012). The crystalline size (S) was obtained using Debey Scherrer’s Eq. (5).
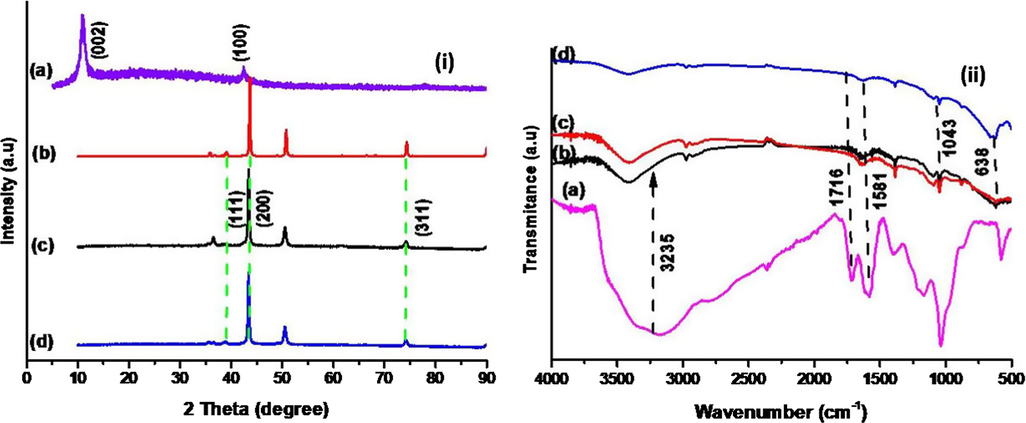
XRD patterns (i) and FTIR spectra (ii) of prepared (a) GO, (b) Cu2O, (c) Cu2O/RGO-1 and (d) Cu2O/RGO-2 NCs.
The functional groups on the surface of prepared samples were confirmed by FTIR and the results are depicted in Fig. 1(ii). The FTIR spectrum of Cu2O shows the peak at 630 cm−1 which identified the bond of metal oxide, Cu—O and the same we can seen in prepared NCs. The FTIR spectrum of GO displays major peaks at 1586, 1717 and 3235 cm−1 assigned to C⚌C, C⚌O and O—H groups respectively (Tran et al., 2012b). The O—H group of GO was disappeared in FTIR spectra of Cu2O/RGO composites was evident for the formation of RGO in composites, further supported by XRD patterns (Anjaneyulu et al., 2018).
Raman spectroscopy is widely adopted to determine the structural modification of GO while GO was converted into RGO. In general, the Raman spectra of monolayer GO exhibits two bands are D (disorder band) and G (in-phase vibration) at 1350 cm−1 and 1580 cm−1 respectively (Azarang et al., 2014). But, the prepared composite showing a slight variation in position of two bands D and G were placed at 1356 and 1590 cm−1 respectively (Fig. S1 in ESI). This may occur due to GO concentration and usage of reducing agent in preparation of composite which provides evidence for the formation of RGO from GO by restoration of isolated to conjugated double bonds and there is no peak of G band in prepared composite. The obtained results were concurred with FTIR.
Fig. 2 depicts the morphology of prepared samples by sonochemical route. The FESEM images of Cu2O suggested that they exhibits smooth surface with octahedral shape at different magnifications as shown in Fig. 2(a, b). This is not seen in prepared NCs that shown agglomeration due to RGO layers decorated with Cu2O in Fig. 2(c-f). It has been observed that Cu2O is having more aggregation and form the dispersed octahedral structured alignments to lower their surface energies. Highly and consistently distributed Cu2O NPs on RGO layer and exhibited to appear that shape and prevent their agglomeration by stacking each other (Park et al., 2011). The size of prepared materials varies based on GO loading effect. The oxygenic groups of RGO nanosheets can aid as anchoring sites to affect the size and dispersity of Cu2O nanoparticles which efficiently esteem the homogeneous scattering of Cu2O over RGO nanosheets with smaller in size and enhanced dispersity (Li, 2013). Energy dispersive x-ray (EDX) spectra of sonochemically prepared Cu2O and Cu2O/RGO composites declared that they formed in pure phase form by the presence of carbon (C), copper (Cu), and oxygen (O) in samples without any impurities as shown in Fig. 2g.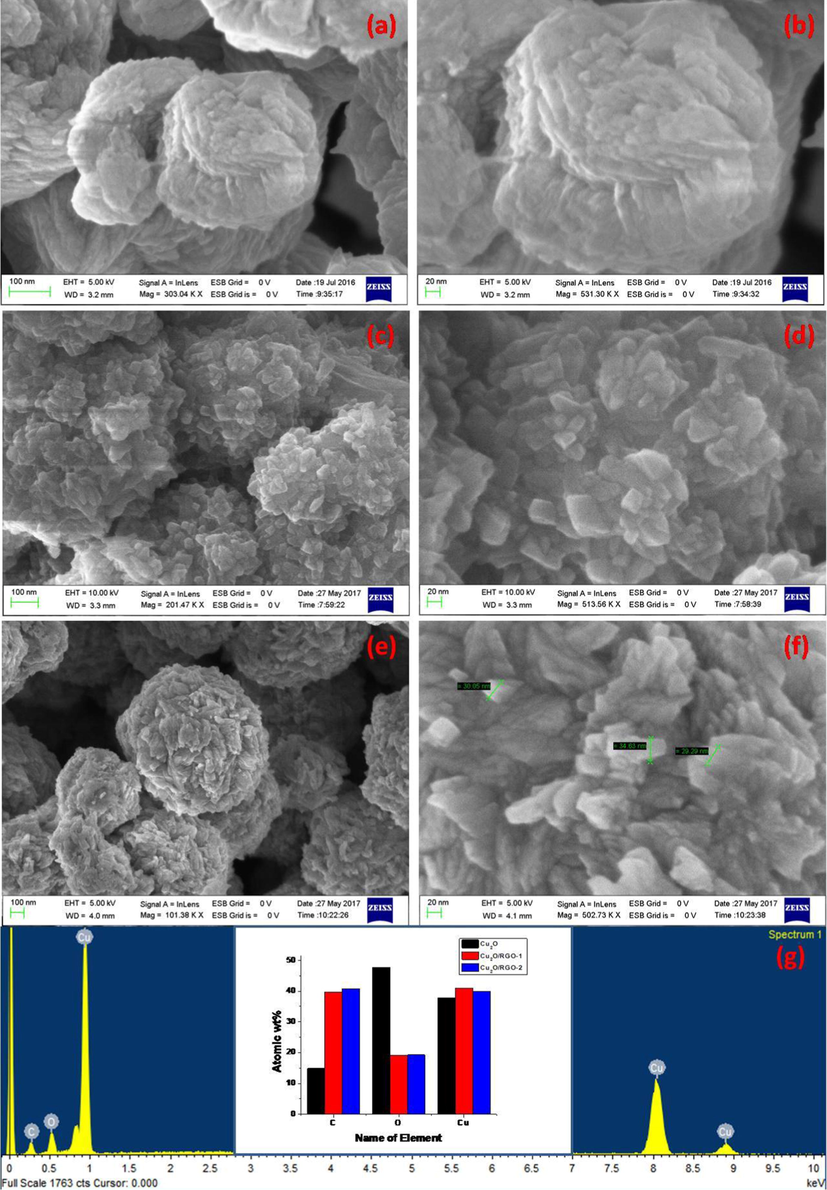
FESEM images of (a,b) Cu2O, (c,d) Cu2O/RGO-1 and (e,f) Cu2O/RGO-2 NCs and (g) EDS images of prepared samples.
3.3 Removal of fluoride ion (F−)
The prepared nanocomposites were utilized for the removal of fluoride from its aqueous solution by adsorption. Compared with pure cuprous oxide, composites have great potential to high adsorption of fluoride ions due to rich surface groups, mechanic feasibility and enhanced stability. It was observed from Fig. 3 that Cu2O exhibits less adsorption ability (37%) in 90 min, but the GO containing composite shown moderate removal rate (45%) and hence, we increased GO content in composite that performs superior adsorption rate of F− (70%). The sorption isotherm and kinetics experiments were performed by batch adsorption experiments and were carried out by mixing 30 mg of sorbent (obtained by the study of effect of adsorbent dose) with 50 mL of water containing sodium fluoride at 10 mg/L as initial fluoride concentration. The mixture was agitated in a thermostatic shaker at a speed of 250 rpm at room temperature. The defluoridation studies were conducted for the optimization of various experimental conditions like contact time, initial fluoride concentration, adsorbent dose, and fluoride uptake by varying pH and dosage. Fig. 3 displays the schematic representation of removal of fluoride ion in aqueous solution using sonochemically prepared Cu2O/RGO composite by adsorption. In addition, this composite have great adsorption opacity for the removal of fluoride ion in aqueous solution and compared with different adsorbents as mentioned in Table S1 in ESI (Gao et al., 2012).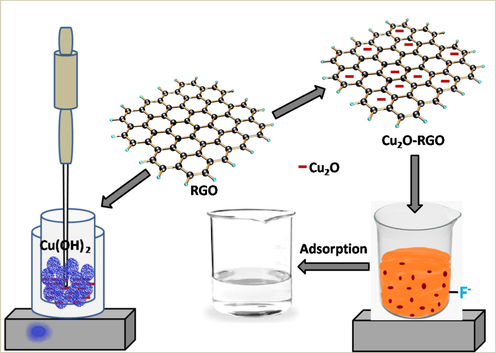
Schematic representation of adsorption of F- by prepared Cu2O-RGO composite.
3.4 Effect of contact time and sorbent
The contact time plays a very significant role in the adsorption dynamics. The effect of contact time on adsorption of fluoride by as-prepared composites is shown in Fig. 4. Batch adsorption studies using the fixed concentration 10 mg/L of fluoride solution with 30 and 10 mg of the adsorbent dosage at different pH (4, 7 and 9) were carried out at 30 ± 5 °C as a function of time to evaluate the defluoridation and adsorption rate constants. The adsorption of fluoride increases with time and gradually attains equilibrium after 60 min (Fig. 4). Therefore 60 min was fixed as minimum contact time for the maximum defluoridation of the sorbent. The adsorption of fluoride rate was increased from 49.4% to 76.4% by rising sorbent dosage amount with constant fluoride concentration, 10 mg/L (Fig. 4). Further, it was observed that the removal curves are continuously decreasing indicating the possibility of the formation of multilayers of fluoride ion at the pore volume and interface of the adsorbent. The existence of functional groups on RGO in composite may adsorb more F- on its surface.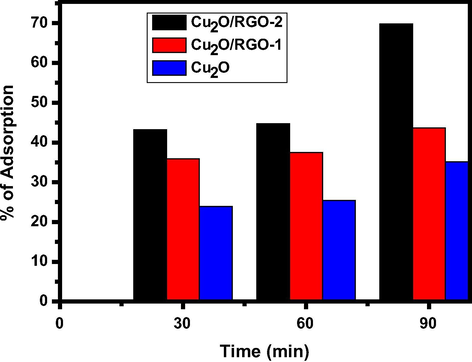
Adsorption of F- (%) by prepared composites at pH-9 and 30 mg catalyst dose.
3.5 Influence of pH and adsorbent dose
The influence of pH plays an important role to optimise the pH condition of fluoride with sorbent. Therefore, the effect of pH on removal of fluoride was examined (Fig. 5). Test mixtures containing initial fluoride ion concentration of 10 mg/L and 30 mg of adsorbents were adjusted to various pH values includes acidic, neutral and alkaline ranges, mixed for 60 min and analysed for residual fluoride ion concentration. Observations from Fig. 4 were made at pH levels of 4, 7 and 9, these experiments were conducted separately for all three adsorbents. The pH was maintained at the desired value within ± 0.2 by adding 0.5 N HCl or 0.1 N NaOH. The percentage of fluoride ions removed decreases with increase in pH for all three adsorbents. For F−, the adsorption on sonochemically prepared composite was usually increased with pH increasing. At a pH = 9, the maximum fluoride removal was recorded for Cu2O/RGO-2 composite (30 mg), about 76.4% of fluoride ions are removed (Fig. 4) than Cu2O/RGO-2 composite (10 mg) about 49.7% of defluoride was shown in Fig. 4b. This may be due to presence of copious functional groups such as —COOH, —OH and oxy, etc. are protonated at lower pH with positive charge and they are deprotonated and negatively charged at higher pH. In addition, aqueous solution contains H+ and OH− may compete in the removal of F−.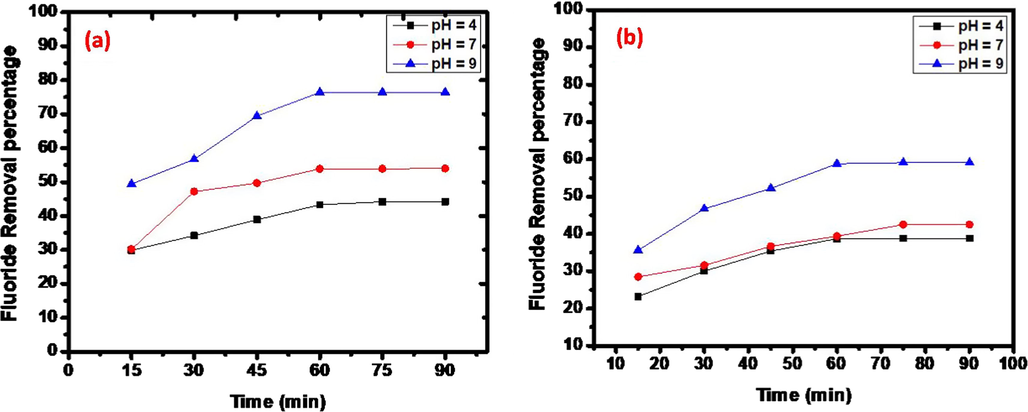
Effect of sorbent dose (a) 30 mg and (b) 10 mg at pH = 4, pH = 7 and pH = 9.
The recyclability and sustainability of prepared adsorbent was tested over the deterioration of fluoride form its polluted water. To that, six continuous cycles were elucidated for stability and recyclability also. After six runs, the adsorbent was not changed its crystallinity and pure phase means there is no change in structural formation. The adsorbent was loss almost 13.7% removal rate after tested six consecutive runs for the removal of F− as during the catalyst washing and few stick with magnetic peddle, hard to recover it. However, the tested adsorbent was efficient, recycled and stable for continuous six cycles which has proven by XRD results (Fig. 6).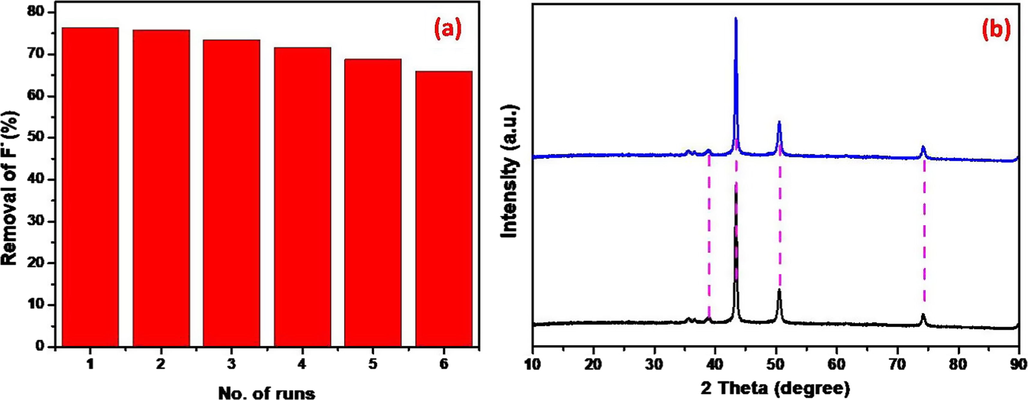
Recyclability (a) and sustainability (b) of prepared adsorbent.
3.6 Adsorption isotherms & kinetic models
The equilibrium data isotherm analysis for fluoride adsorption onto the prepared nanocomposite at pH = 9 and 35 °C. Results indicate that the adsorbent has high affinity for fluoride ion adsorption under these conditions. As the concentration increases, adsorption capacity of fluoride also increases. The equilibrium data has been analysed by linear regression of isotherm model equations, Freundlich, Langmuir and Temkin. The related parameters were obtained by calculation from the values of the slopes and intercepts of the respective linear plots.
Freundlich Eq. (6) signifies the amount adsorbed increases infinitely with an increasing concentration.
The present data fit the Freundlich models (Figs. S2a& S2b in ESI) well (R2 > 0.99) was listed in Table 1. The average adsorption capacity (log kF) obtained for 30 mg dosage of catalyst is 1.32, while the adsorption intensity (n) is found to be 1.8. It is observed that both adsorption capacity and adsorption intensity for Cu2O/RGO-2 NC is found to be higher. With n > 1, there is support for the favourable adsorption of fluoride onto the sorbent.
Catalyst dose
pH
R2
Slope
Intercept
30 mg
4
0.99227
−1.67286
2.1192
7
0.98374
−1.3884
1.88151
9
0.97734
−0.5681
1.32432
10 mg
4
0.98844
−2.20749
3.02853
7
0.99187
−1.8034
2.70137
9
0.97706
−1.07496
2.13368
Langmuir adsorption isotherm Eq. (7) is obtained from easy mass kinetics, presumptuous chemisorptions. The linear plots for the Langmuir isotherm were shown in ESI (Figs. S3a & S3b) and the data shows the slope and intercept were listed in Table S2 in ESI. The relationship of linearity represented by Ce/qe versus Ce exhibits a correlation coefficient, R2 (>0.98) which is partially deviating from linearity. Fig. S1 expressed about the sorbent dose is 30 mg while Fig. S2 about 10 mg of sorbent.
The linear plots for the Temkin isotherm is shown in Figs. S4a & S4b (ESI) and the data shows the slope and intercept were listed in Table S3. The B1 shows the 3.52, while kT is 0.21 and Qe is 3.19 mg/g for optimised pH = 9, 30 mg catalyst amount (Fig. S3).
The present data is well fit to the Freundlich isotherm inferring multilayer adsorption is taking place on the surface of the sorbent, due to ionic interactions between composite and adsorbent. This finding is further explained by using adsorption potential theory (Bhatnagar et al., 2011) which explains that adsorptive forces originating from the well-known vanderwaals interaction can attract molecules at distances greater than a single molecular diameter. This force helps to reinforce the cohesive interaction between adsorbing molecules. Therefore, adsorbate molecules tend to concentrate at high energy sites on the modified copper surface and undergo precipitation. The adsorption potential is highest in cracks and pores of the adsorbent, thus explaining the extensive adsorptive powers of fibrous carbon with its highly developed pore structure.
The kinetic models such as pseudo first order and pseudo second order studies were explored to determine the adsorption rate of fluoride onto the composite. The linearized form of adsorption kinetics and their respective constants were presented in Table 2. Based on values of correlation coefficients (R2) of both orders, the R2 value for pseudo second order is relatively higher than pseudo first order, declared that chemisorption process. The results clearly suggesting that adsorption of F− onto the surface of composite is well fitted with pseudo second order.
nth order
Equation
Constants
Pseudo first order
Log (qe-qt) = Log qe − (k1/2.303) * t
R2 = 0.95
K1 = 0.082 min−1
Pseudo second order
t/qt = (1/k2 + 1/qe) * t
R2 = 0.98
K2 = 0.046 g mg−1 min−1
4 Conclusion
In conclusion, the prepared cuprous oxide-reduced graphene oxide composites show the adsorption of 34 mg/g of F− solution and Freundlich model was fitted than Langmuir and Temkin isotherms. At pH = 9 of F− solution with 30 mg catalyst has shown a high adsorption capacity and high adsorption intensity that may be due to dominating electrostatic interactions as well as vander wall forces existing between adsorbate and adsorbent. The more cracked and porous structure with positive surface potential has high affinity to fluoride uptake as compared to others. The Freundlich model, which is an indicator for surface heterogeneity of the adsorbent, explains the observed phenomena with the experimental findings. The adsorption of F− on synthesized composite followed pseudo second order reaction.
Acknowledgement
Sathish Mohan Botsa obliged the University Grants Commission, India for providing financial support (RGNF-2015-17-SC-AND-9309).
Declaration of Competing Interest
No conflicts of interest.
References
- Hazrd Mater.. 2004;112(3):183-190.
- Water Purification 2017:209-262.
- Chem. Sus. Chem.. 2014;7(4):1086-1093.
- J. Asian Ceram. Soc.. 2018;6:183-195.
- J. Alloy. Compd.. 2018;741:1130-1141.
- J. Appl. Phys.. 2014;116:084307.
- RSC Adv.. 2015;5:53117-53128.
- Res. Report Fluoride. 2016;49:233-244.
- Chem. Eng. J.. 2011;171:811-840.
- Curr. Nanosci.. 2019;15(2):209-213.
- Mem. Inst. Oswaldo Cruz.. 2008;103:130-137.
- Environ. Sci. Pollut. Res.. 2010;18:386-395.
- Beni-Suef Univ. J. Basic Appl. Sci.. 2013;2:61-71.
- RSC Adv.. 2012;2:6988-6993.
- Solid State Sci. 2012;14:276-280.
- Anal. Biochem.. 2004;329:247.
- Solid State Sci.. 2009;11(1):129-138.
- Compos. Interfaces. 2019;27(9):845-858.
- Anal. Spectrom.. 2001;16:20-25.
- Adv. Mater.. 2012;24:1084-1088.
- J Phys Chem Solids. 2013;74(4):635-640.
- J. Phys. Chem. Solids. 2013;74(4):635-640.
- ACS Appl. Mater. Interfaces. 2011;3:360-368.
- J. Envi. Chem. Eng.. 2020;8(5):104071.
- Int. J. Innovative Sci. Eng. Technol.. 2015;2(9):560-571.
- Phys. B: Condensed Matter. 2019;55315:190-194.
- Arabian J Chem.. 2016;9:815-824.
- Electrochim. Acta. 2017;230:316-323.
- Arab. J. Chem.. 2020;13(4):5137-5150.
- Materials. 2014;7:6317-6366.
- Nanoscale. 2012;4:3875-3878.
- Energy Environ. Sci.. 2012;5:5902-5918.
- Ceram. Int.. 2016;42(14):15209-15216.
Appendix A
Supplementary material
Supplementary data to this article can be found online at https://doi.org/10.1016/j.arabjc.2020.09.026.
Appendix A
Supplementary material
The following are the Supplementary data to this article:Supplementary data 1
Supplementary data 1


