

Translate this page into:
Degradation of salicylhydroxamic acid in mineral beneficiation wastewater by dielectric barrier discharge and La-Fe3O4-doped activated carbon: Parametric optimization, kinetics, activation process, and transformation pathway
⁎Corresponding author. dongbingyan1@sina.com (Bingyan Dong)
-
Received: ,
Accepted: ,
This article was originally published by Elsevier and was migrated to Scientific Scholar after the change of Publisher.
Peer review under responsibility of King Saud University.
Abstract
In this study, the degradation of salicylhydroxamic acid (SHA) in industrial beneficiation wastewater was investigated using dielectric barrier discharge (DBD) and La-Fe3O4-doped activated carbon (La-Fe3O4/AC). The physical and chemical properties of La-Fe3O4/AC were studied using several characterization techniques including scanning electron microscopy, transmission electron microscopy, energy dispersive spectroscopy, X-ray diffraction, and X-ray photoelectron spectroscopy. The response surface methodology was used to optimize three critical experimental parameters of the catalyst: its dosage and the mass ratios of La and Fe3O4. These parameters contributed to the SHA degradation in the following decreasing order: mass ratio of La > catalyst dosage > mass ratio of Fe3O4. The SHA degradation efficiency reached 98.6%, and the synergistic factor was 2.83 at a peak-to-peak discharge voltage of 23 kV. The results showed that the DBD-La-Fe3O4/AC system improved the SHA degradation efficiency and exhibited a significant synergistic effect. Pb2+ and Cu2+ slightly increased the SHA degradation efficiency. Quenching experiments on activated substances confirmed that •OH and •O2– were crucial to the degradation of SHA. The O3 and H2O2 generated by the DBD-catalyst system were absorbed by the La-Fe3O4/AC catalyst to produce more •OH. Ten main intermediates were detected in the degradation process of the DBD-catalyst system using HPLC-MS, and three degradation procedures were proposed.
Keywords
Dielectric barrier discharge
Salicylhydroxamic acid
La-Fe3O4-doped activated carbon
Wastewater

- AC
-
activated carbon
- BQ
-
benzoquinone
- DBD
-
dielectric barrier discharge
- EDS
-
energy dispersive spectroscopy
- HPLC
-
high-performance liquid chromatography
- SEM
-
scanning electron microscopy
- SF
-
synergetic factor
- SHA
-
salicylichydroxamic acid
- TBA
-
tert butyl alcohol
- TEM
-
transmission electron microscopy
- XPS
-
X-ray photoelectron spectroscopy
- XRD
-
X-ray diffraction
Abbreviations
1 Introduction
Flotation agents play a crucial role in mineral extraction, and with the depletion of a large number of rich ore resources, the mining and beneficiation of low-grade minerals have become increasingly important (Xie et al. 2021; Jordens et al. 2013). The efficiency of mineral processing needs to be improved constantly, and the use of new mineral processing agents is increasing; consequently, the pollution of water is becoming increasingly serious, and the requirements for water and living environments are becoming more stringent. Salicylichydroxamic acid (SHA) is a new and efficient collector that is widely used in the flotation process of rare earths, iron ores, tin ores, and other minerals (Feng et al. 2017; Tian et al. 2019; Zhao et al. 2020); however, the residual agent causes serious pollution to the water and soil around the mine, endangering human health.
SHA is highly soluble in alkali solutions, slightly soluble in water, stable in nature, biotoxic, and difficult to biodegrade (Qin et al. 2011; Jonathan et al. 2015). Elizondo-Álvarez et al. (Elizondo-Alvarez et al. 2021) tested the chemical stability and environmental impact of three typical flotation agents—xanthate, black drug, and hydroxamic acid—in an aqueous solution. The results showed that in a natural environment, hydroxamic acid was not easy to hydrolyze or oxidize, exhibiting relatively stable chemical properties and lengthy natural degradation or almost no degradation. Therefore, an urgent need exists to use new technologies to treat beneficiation wastewater scientifically and efficiently.
Dielectric barrier discharge (DBD) wastewater treatment is a new technology that integrates various advanced oxidation techniques, such as high-energy electron radiation, chemical oxidation, and photochemical oxidation (Raynard Christianson Sanito et al. 2022; Kan et al. 2020; Wardenier et al. 2019). The reaction system does not need high temperature, high pressure, external light source, or any other technical means; therefore, it has a wide range of applications (Duan et al. 2018; Fang et al. 2023; Ren et al. 2020; Durme et al. 2015). In addition to the chemical effect of low-temperature plasma, physical effects occur, such as ultraviolet light radiation, cavitation, and generation of ultrasonic waves, which enhance the treatment of sewage (Wardenier et al. 2019; Farzinfar et al. 2022; Wang et al. 2021). At present, to reduce the energy consumption in discharge water treatment and improve the degradation efficiency, the combination of discharge technology and other advanced oxidation techniques has become a research area of interest (N. Jiang et al. 2021; Shang et al. 2021).
Activated carbon (AC), a common adsorbent, has been studied in synergy with DBD technology to treat pollutants (Cheng et al. 2021; Xin et al. 2016; Wu et al. 2018). When the discharge is combined with the catalyst, the plasma and ultraviolet light generated by the discharge stimulate the catalytic activity of the catalyst and further improve the degradation rate of organic pollutants in wastewater (Chen et al. 2022). A preliminary study on the degradation of xanthate in beneficiation wastewater using high-voltage discharge was performed (Lou et al. 2022), and another experiment treated three typical hydroxamic acid agents wastewater via UVA-B activated H2O2 and persulfate (Pang et al. 2023). However, to date, there has been no related research using DBD combined with AC-supported noble metal catalysts degradation hydroxamic acid mine wastewater.
In order to maximize SHA degradation efficiency, a classical optimization method, namely, the Box-Behnken design (BBD) model, was used to optimize the experimental conditions and minimize the cost of experimental materials and the optimization time (Jawad et al. 2020; Abdulhameed et al.2021). In this regard, this article presents the first investigation of the degradation of SHA in industrial beneficiation wastewater using DBD combined with La-Fe3O4-doped activated carbon (La-Fe3O4/AC).
2 Experimental materials and methods
2.1 Experimental materials
All agents used in this study—salicylic hydroxamic acid, titanium sulfate, AC, lanthanum nitrate, ferric tetroxide, lead nitrate, and copper nitrate—were provided by Shanghai Maclin Company. When salicylic hydroxide is used for mineral flotation, it is generally adjusted to be alkaline; therefore, in this experiment, the pH of the simulated salicylic hydroxide-treated wastewater was adjusted to 8. Referring to the actual SHA-wastewater situation, the concentration of SHA in the simulated wastewater was 80 mg/L (Feng et al. 2017).
2.2 Preparation of the catalyst
Ferric tetroxide (Fe3O4) and lanthanum nitrate (La(NO3)3) were mixed and dissolved in deionized water, followed by the addition of AC and stirring for 60 min to obtain a uniform mixed suspension. The suspension was added to a 150 ml polytetrafluoroethylene high pressure reactor and reacted at 180 °C for 12 h to obtain the La-Fe3O4/AC catalyst, which was dispersed by ultrasound and separated by centrifugation, followed by oven drying at 60 °C. The composite catalyst was prepared in different proportions, xLa-yFe3O4/AC (x = 0.8, 1.2, and 1.6 wt%; y = 8, 12, and 16 wt%).
2.3 DBD system
The DBD system in this study was divided into three main components: reactor, power supply and monitoring system, as shown in Fig. 1(a). The DBD reactor consisted mainly of a water tank, quartz medium tube, and rebar steel rod. Detailed data can be found in our previous report (Dong et al. 2022).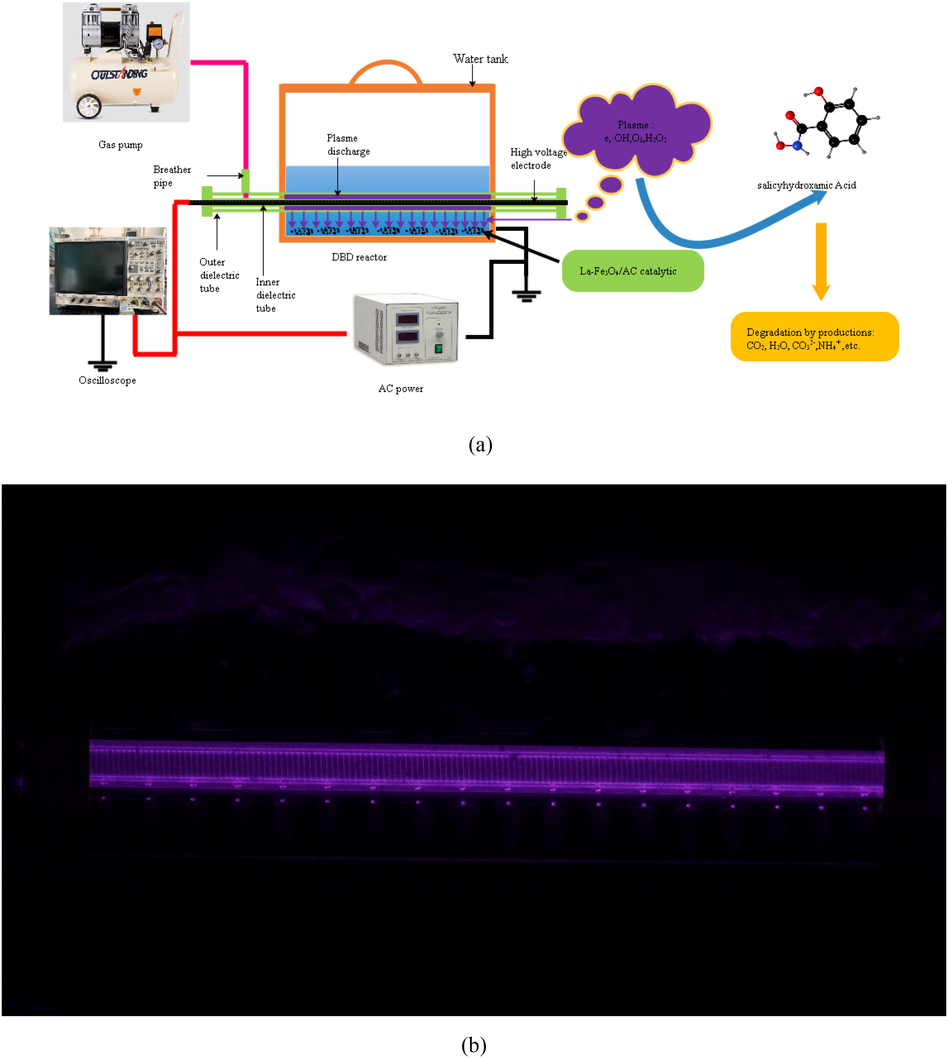
(a) Schematic diagram of the DBD–catalyst system and (b) photograph of plasma discharge during treatment.
2.4 Analytical methods
The SHA degradation (η) and energy efficiency (E) were calculated using Eqs. (1)–(3) (Dong et al. 2022):
The kinetic expression for SHA degradation can be written as follows:
To evaluate the synergetic effect between La-Fe3O4/AC and the DBD plasma, the synergetic factor (SF) is defined as follows (Guo et al. 2019), and the calculated SF values are listed in Table 1:
Codes
Variables
Level 1 (-1)
Level 2 (0)
Level 3 (+1)
A
Catalyst dose/g
1
1.5
2
B
Mass ratios of La/%
0.8
1.2
1.6
C
Mass ratios of Fe3O4/%
8
12
16
2.5 Measurement methods
The surface morphology was examined using scanning electron microscopy (SEM; ZEISS Gemini 300, Germany) and transmission electron microscopy (TEM; FEI TF20, Netherlands). The acceleration voltage during topography shooting was 3 kV. X-ray photoelectron spectroscopy (XPS) was performed using a Thermo Scientific K-Alpha instrument, USA. The crystal phases of the catalyst were examined by conducting X-ray diffraction (XRD; Rigaku Ultimate IV, Japan).
The main SHA intermediates were determined by high-performance liquid chromatography (HPLC, 1260 Infinity Agilent, USA). The absorption wavelength was set to 298 nm. The concentration test of O3 and H2O2 is described in our previous report (Dong et al. 2022).
3 Results and discussion
3.1 Optimization of the doping ratio of La-Fe3O4 and catalyst dosage
By designing a reasonable finite number of experiments, the response surface methodology establishes a mathematical model including the primary term, the square term of each significant factor, and the first-order interaction term between any two factors; accurately studies the relationship between each factor and the response value; and quickly and effectively determines the optimal conditions of the multi-factor system (Jawad et al. 2020; Abdulhameed et al. 2021). This method has the advantages of a short test time, short cycle, and high precision, making it effective for optimizing the basic test conditions (Reghioua et al. 2021).
The mutual effects of the three parameters—the catalyst dosage (A) and mass ratios of La (B) and Fe3O4 (C)) (refer to Table 1)—on the SHA degradation efficiency in the La-Fe3O4/AC-DBD system were studied using the 3D response surface (Ren et al. 2020). The data in Table 1 were obtained after 18 min of a peak-to-peak voltage of 23 kV.
An analysis of variance (ANOVA) was conducted to verify the SHA degradation experimental data obtained from BBD, and the results are presented in Table 3. The ANOVA test show with model p-values < 0.0001 and an F-value of 103.81. The accuracy and effectiveness of the proposed model were verified by a lack-of-fit F-value of 1.52. The R2 and R2adj values were 0.99 and 0.98, respectively. These data showed a good fit between the predicted and experimental values. (Jawad et al. 2020; Abdulhameed et al.2021).
Through the fitting of the 17 groups of experimental data in Table 2, the final coding equation of the SHA degradation efficiency predictor factor was obtained as follows:
Run
A: Catalyst dose
B: Mass ratio of La
C: Mass ratio of Fe3O4
SHA degradation
1
1
1.6
12
89.5
2
1
1.2
16
90.3
3
1
1.2
8
89.9
4
1.5
1.2
12
98.6
5
2
1.2
8
94.7
6
1.5
1.2
12
98.6
7
2
1.6
12
93.8
8
1.5
1.2
12
98.6
9
2
0.8
12
92.4
10
2
1.2
16
95.3
11
1.5
0.8
16
94.5
12
1.5
1.2
12
98.6
13
1.5
0.8
8
95.9
14
1.5
1.6
16
96.4
15
1.5
1.6
8
97.2
16
1
0.8
12
88.2
17
1.5
1.2
12
98.6
Source
Sum of squares
Df
Mean square
F-value
p-value
Model
203.21
9
22.58
103.81
<0.0001
A- Catalyst dose
41.86
1
41.86
192.47
<0.0001
B- Mass ratios of La
4.35
1
4.35
20.01
0.0029
C-Mass ratios of Fe3O4
0.18
1
0.18
0.83
0.3932
AB
0.0025
1
0.0025
0.011
0.9176
AC
0.01
1
0.01
0.046
0.8363
BC
0.09
1
0.09
0.41
0.5405
A2
129.11
1
129.11
593.61
<0.0001
B2
18.35
1
18.35
84.36
<0.0001
C2
1.11
1
1.11
5.08
0.0588
Residual
1.52
7
0.22
Lack of fit
1.52
3
0.51
Cor total
204.74
16
As shown in Figure S1(a,d), the catalyst dosage has a significant impact on the SHA degradation efficiency, which first increases and then slightly decreases as the amount of catalyst increases from 1 to 2 g. The reason is that with increasing catalyst dosage, the contact area with pollutants and SHA degradation efficiency increase. However, when the amount of catalyst is too large, more catalysts will cover each other and precipitate at the bottom of the treatment solution (Cheng et al. 2020). As shown in Figure S1(b,e), the mass ratio of La also has a significant effect on the SHA degradation efficiency. An appropriate amount of lanthanum on AC can increase the number of active sites and the specific surface area of the catalyst, but too much lanthanum clogs the pore structure of the catalyst and generates too many oxygen vacancies, resulting in the recombination of holes and electrons (C. Wang et al. 2012).
As shown in Figure S1(c,f), the SHA degradation efficiency increases with the mass ratio of Fe3O4 from 8 wt% to 12 wt%, because the doped Fe3O4 induces the Fenton effect with H2O2, promoting the formation of more ·OH, as shown in Eq. (5). However, when the mass ratio of Fe3O4 exceeds 12 wt%, the agglomeration of the catalyst particles results in a reduction in the surface area and degradation of the catalytic activity, and Eq. (6) is given by (Xu et al. 2020; Sang et al. 2019)
The contributions of the three parameters to the SHA degradation efficiency are shown in Table 2. According to the Box-Behnken model, the three influencing factors have diminishing effects on the SHA degradation efficiency in the order: mass ratio of La (B) > catalyst dosage (A) > mass ratio of Fe3O4 (C). The optimal optimization conditions of the model were A = 1.5 g, B = 1.2 wt%, and C = 12 wt%, and the La-Fe3O4/AC-DBD system improved the SHA degradation efficiency (98.6%).
3.2 Characterization of La-Fe3O4/AC
3.2.1 SEM analysis
To visualize the catalyst morphology, SEM, TEM, and energy dispersive spectroscopy (EDS) were used to analyze and characterize the prepared AC, AC-supported catalyst, and post-discharge AC-supported catalyst (a, b, and c, respectively). In Fig. 2(a), it can be seen that the AC has small pores and irregular small corrugated folds, which is consistent with the results of previous studies (Zhou et al. 2016). However, Fig. 2(b,c) exhibits a large number of typical irregular spherical structures distributed on the corrugated folds of the AC, indicating that the material was successfully doped into the AC. In addition, the number of active surface sites and the specific surface area were increased by the spherical catalyst loaded on the AC, which was conducive to improving the contact probability between the treated pollutants and active substances. Fig. 3(a-c) shows the TEM images of the AC, AC-supported catalyst, and post-discharge AC-supported catalyst. The experimental results demonstrate that the AC has a regular hexagonal honeycomb structure, whereas Fig. 3(b,c) shows a honeycomb regular hexagonal and trans spinel structures. The difference is not significant, and the catalyst is relatively stable (N. Jiang et al. 2019). In addition, Fig. 4(a-c) presents EDS mapping images that reveal elements La, Fe, and O, evenly distributed on the La-Fe3O4/AC composite catalyst. Therefore, it could be inferred that the La-Fe3O4/AC composite catalyst was successfully prepared and relatively stable.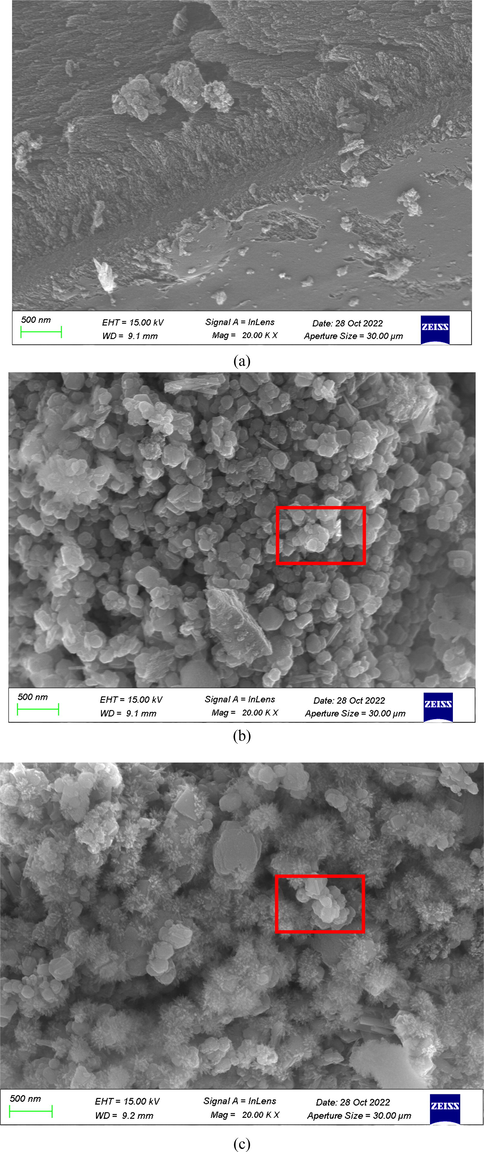
SEM images of (a) AC, (b) La-Fe3O4-doped AC (La-Fe3O4/AC), and (c) post-treatment La-Fe3O4/AC.
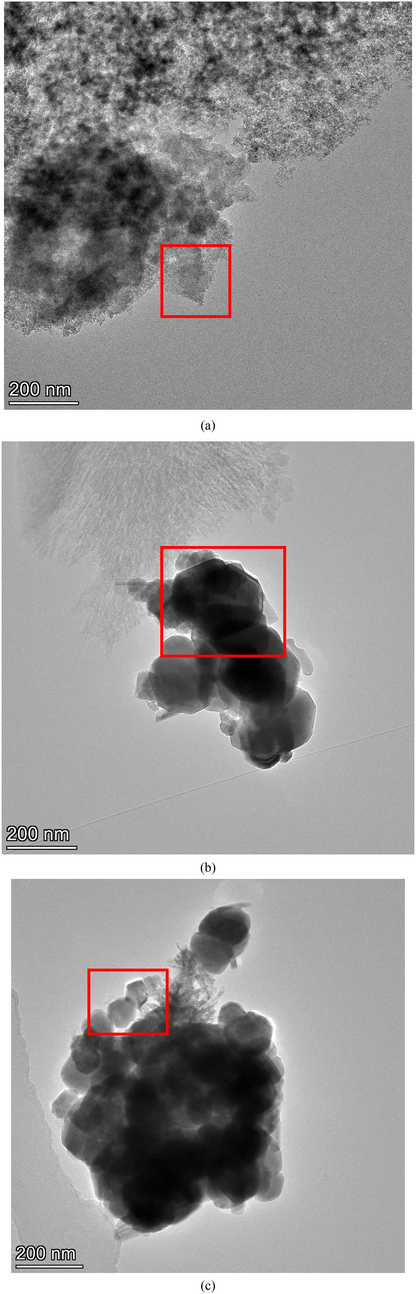
TEM images of (a) AC, (b) La-Fe3O4/AC, and (c) post-treatment La-Fe3O4/AC.
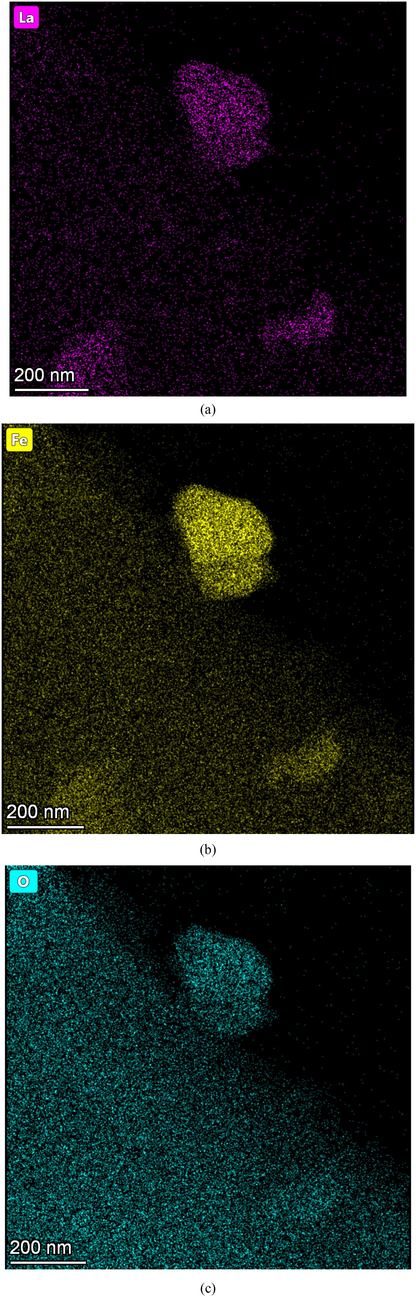
EDS mapping images of (a) La, (b) Fe, and (c) O on La-Fe3O4/AC.
3.2.2 XPS analysis
XPS was used to analyze the surface element composition and chemical bond structure of La-Fe3O4/AC and post-discharge La-Fe3O4/AC. Fig. 5(a) shows the full scanning XPS map, and Fig. 5(b-d) presents the fine scanning maps of Fe, La, and O. Before treatment, the binding energies of Fe are 711.07 and 723.87 eV, corresponding to 2p3/2 and 2p1/2 of Fe2+, respectively, and account for 39.4%. The binding energies of 713.02 and 726.3 eV correspond to 2p3/2 and 2p3/2 of Fe3+, respectively, and account for 60.6%. The binding energies of La are 836.7 and 853.3 eV, corresponding to 3d5/2 and 3d3/2 of La3+, respectively, and account for 54.0%. The binding energies of 840.4 and 857.0 eV correspond to 3d5/2 and 3d3/2 of La3+, respectively, and account for 46.0%. The binding energy of O is 530.51 eV, corresponding to the metal-O bond and accounting for 9.4%. After the discharge treatment, the binding energies of Fe are 710.77 and 723.98 eV, corresponding to 2p3/2 and 2p1/2 of Fe2+, respectively, and account for 40.8%. The binding energies of 713.82 and 726.86 eV correspond to 2p3/2 and 2p3/2 of Fe3+, respectively, and account for 59.2%. The binding energies of La are 836.48 and 852.8 eV, corresponding to 3d5/2 and 3d3/2 of La3+, respectively, and account for 62.4%. The binding energies of 839.94 and 856.22 eV correspond to 3d5/2 and 3d3/2 of La3+, respectively, and account for 37.6%. The electron binding energy of O is 530.8 eV, corresponding to the metal-O bond and accounting for 10.7%.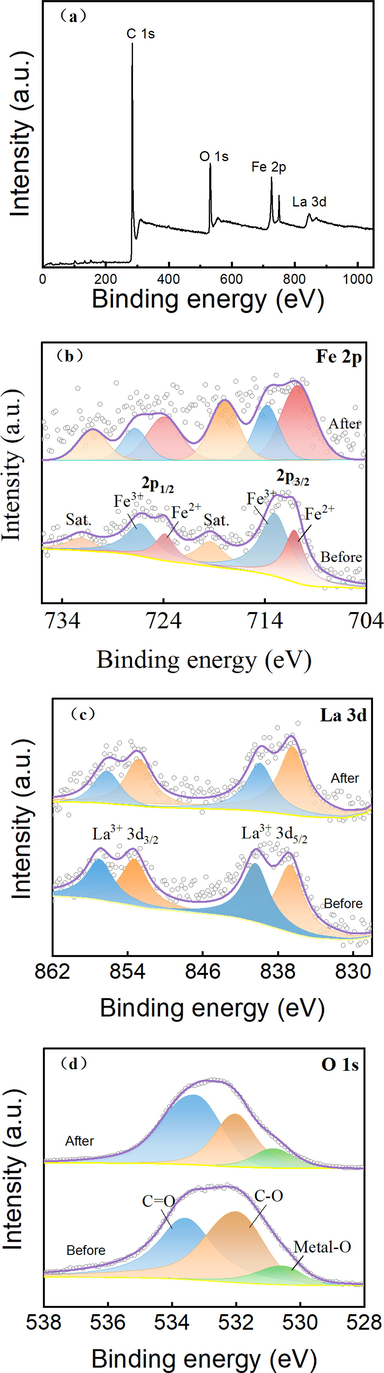
XPS spectra of La-Fe3O4/AC: (a) full spectrum and spectra of (b) Fe 2p, (c) La 3d, and (d) O 1 s.
The typical peaks corresponding to Fe and La prove their existence in the sample, and the formation of the metal-O bond shows that La-Fe3O4 and AC are not only simply bound through physical interaction (H. Guo et al. 2021), but also through tight chemical bonds, forming a real complex. The XPS profile of the La-Fe3O4/AC sample changed slightly after discharge, indicating that La-Fe3O4/AC was stable.
3.2.3 XRD analysis
Fig. 6 shows the XRD patterns of the AC, La-Fe3O4/AC, and post-discharge La-Fe3O4/AC. Both La-Fe3O4/AC and post-discharge La-Fe3O4/AC exhibit the characteristic peaks of Fe3O4 and La, corresponding to the crystal surfaces of Fe3O4 at 35.2° (JPCD, No.03–0863) and La at 30.1° (P. Feng et al. 2015). Moreover, the X-ray diffraction peak of the catalyst doped with La became wider. The XRD results show that the La-Fe3O4/AC catalyst was successfully prepared and exhibited good stability after the discharge treatment, which corresponds to the characterization results described above.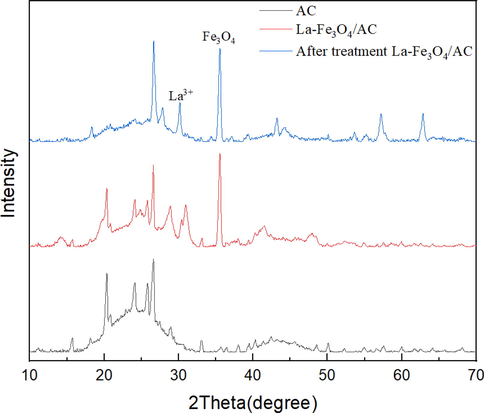
XRD patterns of AC, La-Fe3O4/AC, and post-treatment La-Fe3O4/AC.
3.3 Evaluation of the degradation performance for SHA
3.3.1 Degradation performance and synergetic factors
The catalytic performance of the catalysts with different proportions of La-Fe3O4/AC in the DBD system was investigated, and the results are presented in Fig. 7(a). In the chart, the proportions of La-Fe3O4/AC-1, La-Fe3O4/AC −2, and La-Fe3O4/AC −3 are respectively as follows: 1.2 wt% La-12 wt% Fe3O4, 0.8 wt% La-8 wt% Fe3O4, and 1.6 wt% La-16 wt% Fe3O4; 1.5 g of each catalyst was used. As can be seen from Fig. 6(a), only the La-Fe3O4/AC catalyst has a relatively low SHA degradation efficiency, and the SHA degradation efficiency is only 21.3% after 18 min of treatment. Compared to the DBD alone, the addition of catalyst materials promotes the SHA degradation efficiency. The DBD-La-Fe3O4/AC-1 system exhibits the best degradation performance, and the SHA degradation efficiency reaches 98.6% after 18 min of treatment, which is 28.9% and 77.3% higher than those of DBD and La-Fe3O4/AC, respectively. Further, the catalytic performance of DBD-La-Fe3O4/AC is better than that of DBD-La-Fe3O4, indicating that the combined system has a significant synergistic effect on the SHA degradation performance.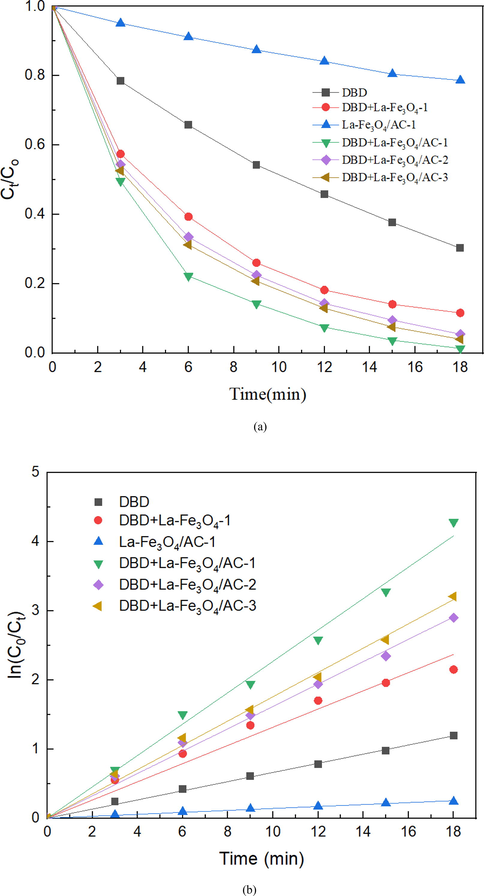
(a) Degradation of SHA and (b) first-order kinetic constants.
Fig. 7(b) shows the first-order kinetic constants corresponding to each group in Fig. 7(a). The degradation kinetic constants of SHA in descending order are DBD-La-Fe3O4/AC-1 > DBD-La-Fe3O4/AC-3 > DBD-La-Fe3O4/AC-3 > DBD-La-Fe3O4-1 > DBD > La-Fe3O4/AC-1. When the catalyst ratio is 1.2 wt% La-12 wt%Fe3O4, the maximum kinetic constant of DBD-1.2 wt% La-12 wt%Fe3O4 is 0.227, which is 3.42 and 1.72 times those of the DBD-only system and DBD-La-Fe3O4-1 system, respectively. Moreover, when the mass ratio of La to Fe3O4 is further increased, the kinetic constant of the system does not increase, but rather decreases. This tendency occurs because excessive La and Fe3O4 lead to their aggregation on the AC pores, increasing the mass transfer resistance and reducing the specific surface area of the catalyst, which is mutually supported by previous detection and SEM results.
To illustrate the synergistic effect between DBD and the La-Fe3O4/AC catalyst further, the synergistic factor SF between DBD and the La-Fe3O4/AC catalyst was calculated, and the results are shown in Table 4. The R2 values in the table are all greater than 0.98, indicating that all systems conform to the first-order kinetic model, which corresponds to the conclusion of the quasi-first-order kinetic equation. After the addition of the La-Fe3O4/AC catalyst, all the synergistic factors are greater than 1, indicating that a synergistic effect can be formed between the DBD and La-Fe3O4/AC catalyst. In addition, the synergistic factors of the DBD-La-Fe3O4/AC system are all greater than those of DBD-La-Fe3O4/AC (1.639), which proves that the synergistic effect between DBD and La-Fe3O4/AC is more obvious, and the highest synergistic factor of DBD- La-Fe3O4/AC-1 is 2.826.
System
First-order kinetic constants
SF
K (min−1)
R2
DBD
0.066
0.999
–
DBD-La-Fe3O4-1
0.132
0.989
1.639
DBD-La-Fe3O4/AC-1
0.227
0.997
2.826
DBD-La-Fe3O4/AC-2
0.162
0.998
2.014
DBD-La-Fe3O4/AC-3
0.176
0.998
2.189
3.3.2 Effect of the discharge voltage and energy yield
The discharge voltage directly affects the electric field intensity and electron energy between the discharge areas of the DBD reactor and determines the input energy and discharge mode of the DBD discharge system. The SHA degradation efficiency of the DBD and DBD + La-Fe3O4 systems at peak-to-peak voltages of 20, 23 and 26 kV, as determined above. It is clear from Fig. 8(a) that a higher peak-to-peak voltage corresponds to a higher SHA degradation efficiency because a higher electric field intensity stimulates the reactor to produce more active substances (T. Wang et al. 2016), resulting in accelerated SHA degradation. In addition, when the peak-to-peak value is 26 kV, the degradation efficiency of SHA is 83.6% after 18 min of DBD alone; however, the degradation efficiency of SHA is greatly increased to 99.8% after the addition of the La-Fe3O4 catalyst, where SHA is almost completely degraded. Therefore, the experimental results demonstrate that addition of the La-Fe3O4 catalyst to the discharge system significantly improves the degradation efficiency of SHA, which increases by 44.67%, 28.58%, and 16.2% at 20, 23, and 26 kV, respectively.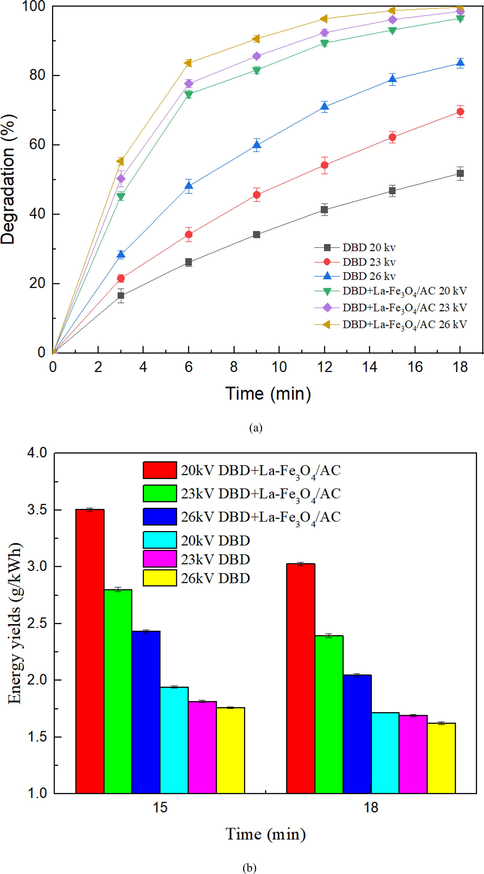
(a) SHA degradation with different discharge voltages and (b) SHA energy efficiency with different discharge voltages.
The higher the discharge voltage, the greater the input energy of the DBD reaction system (Wang et al. 2016). Simply increasing the peak-peak voltage to improve the efficiency of SHA degradation is unreasonable. Therefore, Fig. 8(b) shows the calculated energy efficiency of SHA degradation at different peak-to-peak voltages, which were selected to calculate the energy efficiency of each system after 15 and 18 min of discharge reactor treatment. The data in Fig. 8(b) demonstrate that when the degradation efficiency of SHA reaches 99.8%, the energy efficiency is only 2.05 g/kWh, which is not the best choice for SHA degradation. It can be concluded that the addition of the La-Fe3O4 catalyst greatly improves the energy efficiency of the DBD reaction system. After maintaining the peak-to-peak discharge voltage at 20 kV for 15 min, the energy efficiency of the collaborative treatment of the DBD system with the La-Fe3O4 catalyst reached 3.5 g/kWh, and the SHA degradation efficiency reached 93.4%.
3.3.3 Effects of Pb2+ and Cu2+
The composition of mineral processing wastewater is complex, and one of its remarkable characteristics is that it contains excessive metal ions (Xie et al. 2021). To improve the flotation ability of SHA, mining enterprises typically use Pb2+ and Cu2+ as activators (Feng et al. 2017). Fig. 9 shows the effects of adding Pb2+ and Cu2+ on the degradation efficiency of SHA at a peak-to-peak discharge voltage of 20 kV. The addition of Pb2+ and Cu2+ slightly improves the degradation efficiency of SHA. After 18 min of treatment, the degradation efficiency of the SHA is 96.5%. However, after adding 2 mmol/L Pb2+ and Cu2+, the degradation efficiency of the SHA slightly increases to 99.9% and 98.7%, respectively. The addition of Pb2+ and Cu2+ forms chelates with SHA, which improves the SHA degradation efficiency and further activates the catalyst to produce active substances for the degradation of SHA, which is consistent with the conclusions of Lou et al. (Lou et al. 2022). In addition, the discharge area of the SHA reactor was in the air. Although the addition of Pb2+ and Cu2+ increased the conductivity of the SHA solution, it did not affect the electric field intensity in the discharge area; therefore, it did not reduce the degradation efficiency of SHA (G. Han et al. 2021):
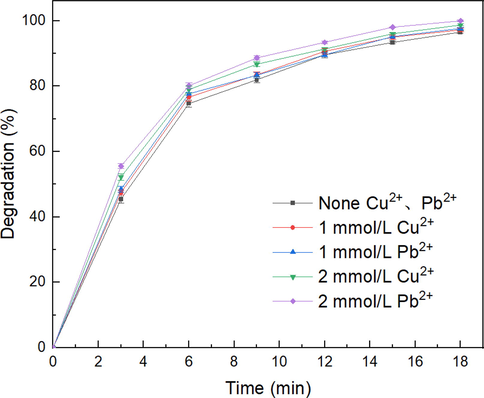
Effects of Cu2+ and Pb2+ on SHA degradation after 18 min of a peak-to-peak discharge voltage of 20 kV.
3.4 Identification of the active species for the SHA degradation
3.4.1 Variation of O3 and H2O2
O3 and H2O2 play important roles in the degradation of SHA, and their concentration changes can be used to evaluate the changing trend of the active substances during DBD (Ren et al. 2019). To study the contributions of O3 and H2O2 to SHA degradation in one step, we tested the changes in the concentrations of O3 and H2O2 in the DBD + La-Fe3O4/AC and DBD-only systems. The results are depicted in Fig. 10(a,b) (the discharge peak-to-peak voltage is 20 kV). The concentrations of O3 and H2O2 clearly increase with increasing discharge treatment time in both the DBD-only and DBD-La-Fe3O4/AC systems. After 18 min of treatment, the concentrations of O3 and H2O2 in the single DBD system are 1.64 mg/L and 12.39 μmol/L, respectively, whereas the concentrations of O3 and H2O2 in the synergistic system are only 1.17 mg/L and 5.29 μmol/L, respectively, which are significantly lower than those in the DBD-only system. Combined with the previous SHA degradation efficiency changes, the experimental results indirectly indicate that the addition of the La-Fe3O4/AC catalyst promotes the conversion of O3 and H2O2 to •OH in the collaborative system, and the conversion formula is given by Eqs. (7)–(13) (K.H.H. Aziz et al. 2017). Therefore, the degradation efficiency of the SHA in the DBD collaborative La-Fe3O4/AC system is higher than that of the DBD-only system.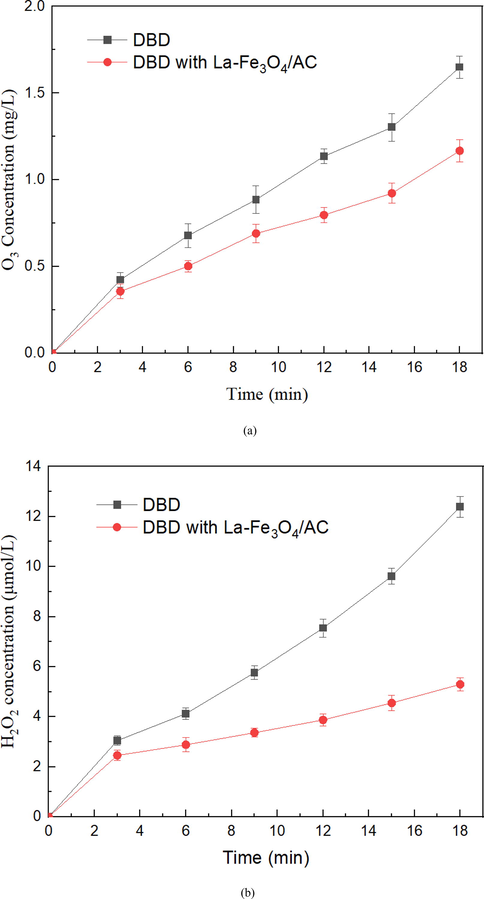
Concentrations of (a) O3 and (b) H2O2 after 18 min of a peak-to-peak discharge voltage of 20 kV.
3.4.2 Effect of various radical scavengers
To explore the roles of •OH and •O2– in SHA degradation, tert butyl alcohol (TBA) and benzoquinone (BQ) were selected as trapping agents for the free radical capture experiment (with a peak-to-peak discharge voltage of 20 kV) (Lou et al. 2022; Ren et al. 2021). The experimental results are shown in Fig. 11(a). After 18 min of treatment, the SHA degradation efficiency is 96.53% with no trapping agent added, whereas the addition of TBA and BQ reduces the SHA degradation efficiency. When 3 mmol/L BQ and TBA are added, the degradation efficiency of SHA decreases significantly to 60.16% and 19.33%, respectively. Both trapping agents significantly inhibit the degradation of SHA, indicating that •OH and •O2– are important active substances in the DBD–catalyst synergistic system. In contrast, the SHA degradation efficiency decreases by 36.37%, whereas the SHA degradation efficiency decreases by 77.2%, which is 2.12 times the decrease in 3 mmol/L BQ. Therefore, •OH is a more important strongly oxidizing active species than •O2–, especially in the DBD + La-Fe3O4/AC system.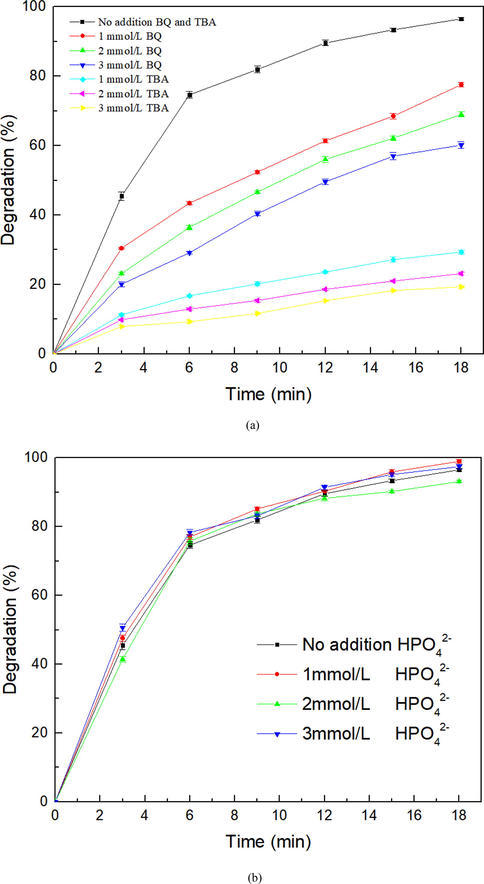
(a) Effects of TAB and BQ capture reagents on SHA degradation and (b) effects of phosphate capture reagents on SHA degradation after 18 min of a peak-to-peak discharge voltage of 20 kV.
Zhang et al. found that hydration electrons are important activating substances when dealing with microcystin-LR (H. Zhang et al. 2012). Fig. 11(b) presents the results, demonstrating that the addition of HPO42- does not affect the degradation of SHA in the DBD–catalyst collaborative system, indicating that hydrated electrons are not important for SHA degradation. This was because in the previous research by the authors (B. Dong et al. 2022), the discharge plasma was formed in an air atmosphere and then diffused into the liquid phase to set off a series of reactions, so that hydrated electrons could hardly be generated:
3.4.3 Mineralization of SHA
To explore the degree of SHA mineralization, the TOC removal rates in the DBD-only, DBD-LA-Fe3O4, and DBD-LA-Fe3O4/AC systems were compared experimentally. As shown in Fig. 12, after the discharge voltage was treated at 20 kV for 18 min, the TOC removal rate in the single DBD system was only 22.36%, that of the DBD co-catalyst LA-Fe3O4 slightly increased to 27.78%, and that of the last group of DBD-LA-Fe3O4/AC was significantly increased to 36.16%. The results showed that AC can significantly improve the TOC of SHA and that the removal rate of TOC is much lower than the degradation efficiency of SHA, indicating that the degradation process of SHA is accompanied by the formation of intermediate products.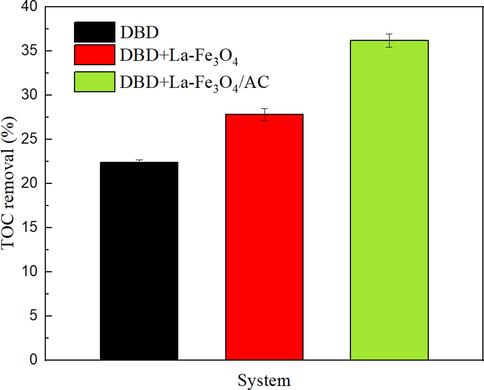
Variation of TOC for SHA wastewater after 18 min of a peak-to-peak discharge voltage of 20 kV.
3.5 Possible degradation pathway for SHA
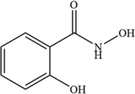
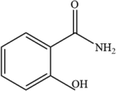
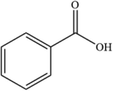
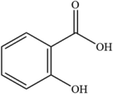
Combined with the obtained high-resolution data, the structures of SHA the intermediate products during the degradation process were determined (Table 5). The degradation path was determined to be mainly through the following three reaction channels, as shown in Fig. 13.
Serial number
Byproducts
m/z
Structural formula
SHA
C7H7NO3
154.14
1
C7H7NO2
138.05
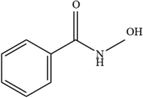
2
C7H7NO2
138.05
3
C7H6O2
123.04
4
C6H5OH
95.04

5
C7H6O3
139.03
6
C6H6O2
112.03

7
C7H7NO
122.06
8
C6H6O2
112.03
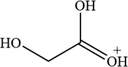
9
C2H5O3
77.02
10
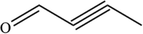
C4H4O
69.07
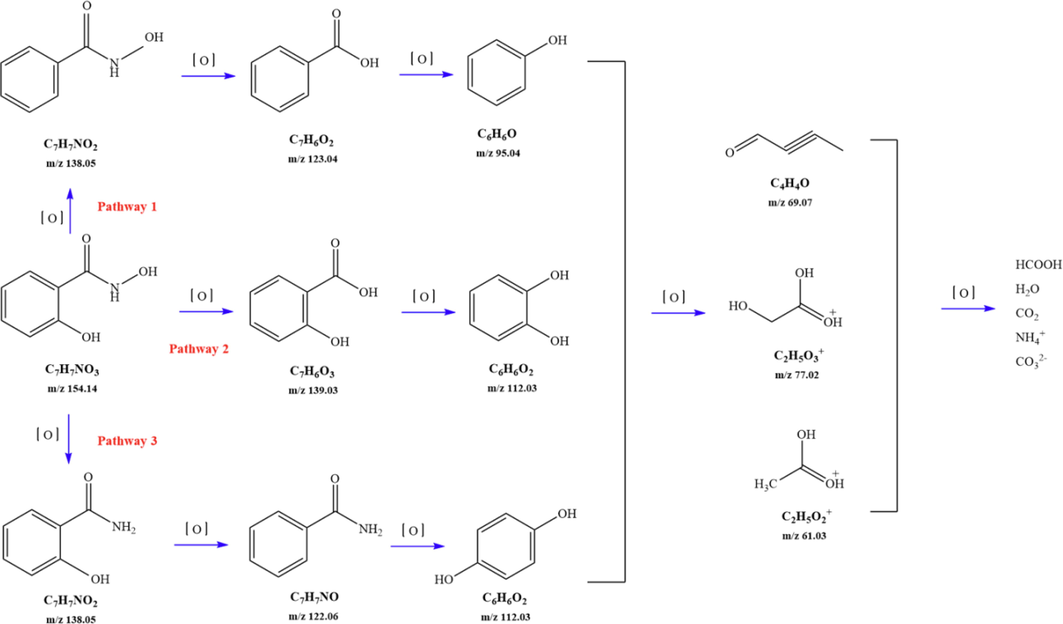
Degradation on possible pathways of SHA.
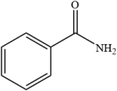
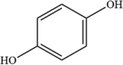
For the degradation target SHA (positive ion peak [M + H] + m/z 154), the main degradation sites occur in the molecular structure of hydroxyl amino groups and aromatic rings. In pathway 1, the benzene ring of SHA was oxidation of to obtain C7H7NO2 (m/z 138). Then, C7H7O2 (m/z 123) was degraded and oxidized to decarboxylate and hydroxylate phenol and C6H5OH (m/z 95). In pathway 2, the hydroxylamine group of SHA was the degradation of to C7H6O3 (m/z 139); then, it underwent oxidation of the decarboxylate group and oxidative hydroxylation to obtain C6H6O2 (m/z 112). In pathway 3, the hydroxylamine group of SHA was degradation of to C7H7NO2 (m/z 138) and C7H6O2 (m/z 122), and hydroquinone and C6H6O2 (m/z 112) were obtained. Pathways 2 and 3 are commonly reversed to prepare SHA. Similar degradation paths were also inferred by Pang et al (Pang et al. 2019) and Liping et al. (Zhang et al. 2019) when advanced oxidation techniques were used for degradation.
Further degradation of the above products is manifested as oxidation, small molecules of acid degradation, and finally degradation to H2O, CO32–, NH4+, etc.
Various advanced oxidation techniques for the treatment of SHA wastewater are summarized, and the results are presented in Table S1. The results show that DBD collaboration with La-Fe3O4/AC is a promising method of SHA wastewater treatment.
4 Conclusion
In this study, the degradation of SHA in mineral processing wastewater by the DBD-La-Fe3O4/AC collaborative system was investigated. Three catalyst parameters (the catalyst dose and mass fractions of La and Fe3O4) affecting the SHA degradation efficiency were optimized using the response surface method. The optimal combination was 1.2 wt%La-12 wt%Fe3O4/AC in 1.5 g, and the SHA degradation efficiency was 98.6%. The catalyst was characterized by SEM, TEM, EDS, XRD, and XPS. The results showed that AC was successfully loaded with La-Fe3O4 and that the synthesized catalyst had a high stability and crystallization state. After the peak-to-peak discharge voltage was maintained at 20 kV for 15 min, the energy efficiency of the collaborative treatment of the DBD- La-Fe3O4 system reached the highest value of 3.5 g/kWh, and the SHA degradation efficiency reached 93.4%, which were increased by 46.6% and 1.8 times compared with those of the DBD-only system, respectively. The first-order kinetic constant of the DBD-La-Fe3O4 system was 0.23, the synergistic factor was 2.83, and the synergistic effect was significant. Metal ions Pb2+ and Cu2+ can slightly improve the degradation efficiency of SHA in mineral processing of wastewater. The concentrations of O3 and H2O2 in the DBD-La-Fe3O4/AC system were significantly lower than those of the single DBD, indicating that the addition of the La-Fe3O4/AC catalyst promoted the conversion of O3 and H2O2 to •OH in the collaborative system. Moreover, the addition of quenching agents significantly reduced the degradation efficiency of SHA, indicating that •OH and •O2–, two strong oxidant active substances, are crucial for the SHA degradation. Ten main degradation intermediates were identified using HPLC-MS, and three possible degradation pathways were deduced. This article provides a promising method for the treatment of organic flotation agents in mineral processing wastewater residues using rare-earth catalyst materials in collaboration with DBD.
CRediT authorship contribution statement
Bingyan Dong: Conceptualization, Methodology, Supervision, Validation, Resources. Peixiang Wang: Data curation, Writing – original draft, Writing – review & editing. Zhendong Li: Investigation. Yanwen Tan: Software.
Acknowledgements
Funding: This work was supported by the National Natural Science Foundation of China [grant number 50867003].
Declaration of Competing Interest
The authors declare that they have no known competing financial interests or personal relationships that could have appeared to influence the work reported in this paper.
References
- Statistical modeling and mechanistic pathway for methylene blue dye removal by high surface area and mesoporous grass-based activated carbon using K2CO3 activator. J. Environ. Chem. Eng. 2021;1
- [CrossRef] [Google Scholar]
- Degradation of pharmaceutical diclofenac and ibuprofen in aqueous solution, a direct comparison of ozonation, photocatalysis, and non-thermal plasma. Chem. Eng. J.. 2017;313:1033-1041.
- [CrossRef] [Google Scholar]
- Synergistic effect of dielectric barrier discharge plasma and Ho-TiO2/rGO catalytic honeycomb ceramic plate for removal of quinolone antibiotics in aqueous solution. Sep. Purif. Technol. 2022;281:118723.
- [CrossRef] [Google Scholar]
- Plasma-catalytic degradation of ciprofloxacin in aqueous solution over different MnO2 nanocrystals in a dielectric barrier discharge system. Chemosphere. 2020;253:126595.
- [CrossRef] [Google Scholar]
- Degradation of tetracycline hydrochloride in aqueous via combined dielectric barrier discharge plasma and Fe–Mn doped AC. Chemosphere. 2021;286:131841.
- [CrossRef] [Google Scholar]
- Degrading hazardous benzohydroxamic acid in the industrial beneficiation wastewater by dielectric barrier discharge reactor. Sep. Purif. Technol.. 2022;299:121644.
- [CrossRef] [Google Scholar]
- Synergetic effect of TiO2 and Fe3+ as co-catalysts for enhanced phenol degradation in pulsed discharge system. Appl. Cat. B.. 2018;221:521-529.
- [CrossRef] [Google Scholar]
- Leys, Removal of atrazine in water by combination of activated carbon and dielectric barrier discharge. J. Hazard. Mater.. 2015;299:647-655.
- [CrossRef] [Google Scholar]
- Chemical stability of xanthates, dithiophosphinates and hydroxamic acids in aqueous solutions and their environmental implications. Ecotoxicol. Environ. Saf.. 2021;207
- [CrossRef] [Google Scholar]
- Synergistic degradation of aqueous p-nitrophenol using DBD plasma combined with ZnO photocatalyst. Process Saf. Environ. Protection. 2022;168:907-917.
- [CrossRef] [Google Scholar]
- Reaction mechanism of lanthanum nitrate-doped Mo–La material during solid–liquid spray doping processing. Rare Met.. 2015;34(11):814-817.
- [CrossRef] [Google Scholar]
- Activation mechanism of lead ions in cassiterite flotation with salicylhydroxamic acid as collector. Sep. Purif. Technol.. 2017;178:193-199.
- [CrossRef] [Google Scholar]
- Enhanced catalytic performance of graphene-TiO2 nanocomposites for synergetic degradation of fluoroquinolone antibiotic in pulsed discharge plasma system. Appl. Catal. B Environ.. 2019;248:552-566.
- [CrossRef] [Google Scholar]
- Efficient removal of antibiotic thiamphenicol by pulsed discharge plasma coupled with complex catalysis using graphene-WO3-Fe3O4 nanocomposites. J. Hazard. Mater.. 2021;403
- [CrossRef] [Google Scholar]
- Efficient removal of hazardous benzohydroxamic acid (BHA) contaminants from the industrial beneficiation wastewaters by facile precipitation flotation process. Sep. Purif. Technol.. 2021;279
- [CrossRef] [Google Scholar]
- High surface area and mesoporous activated carbon from KOH-activated Dragon fruit peels for methylene blue dye adsorption: optimization and mechanism study. Chinese J. Chem. Eng.. 2020;32(4):281-290.
- [CrossRef] [Google Scholar]
- Insights into the modeling, characterization and adsorption performance of mesoporous activated carbon from corn cob residue via microwave- assisted H3PO4 activation. Surf. Interfaces 2020
- [CrossRef] [Google Scholar]
- Plasma-catalytic destruction of xylene over Ag-Mn mixed oxides in a pulsed sliding discharge reactor. J. Hazard Mater.. 2019;369:611-620.
- [CrossRef] [Google Scholar]
- Plasma-assisted catalysis decomposition of BPA over graphene-CdS nanocomposites in pulsed gas-liquid hybrid discharge: photocorrosion inhibition and synergistic mechanism analysis. Chem. Eng. J.. 2021;412
- [CrossRef] [Google Scholar]
- Antioxidant and free radical scavenging activity of iron chelators. Toxicol. Rep.. 2015;2:721-728.
- [CrossRef] [Google Scholar]
- A review of the beneficiation of rare earth element bearing minerals. Miner. Eng.. 2013;41:97-114.
- [CrossRef] [Google Scholar]
- High frequency discharge plasma induced plasticizer elimination in water: removal performance and residual toxicity. J. Hazard. Mater. 2020;383:121185.1.
- [CrossRef] [Google Scholar]
- Enhanced degradation of residual potassium ethyl xanthate in mineral separation wastewater by dielectric barrier discharge plasma and peroxymonosulfate. Sep. Purif. Technol. 2022;282
- [CrossRef] [Google Scholar]
- Knudsen Degradation of three typical hydroxamic acids collectors via UVA-B activated H2O2 and persulfate: kinetics, transformation pathway, DFT calculation and toxicity evaluation. Chem. Eng. J.. 2023;451:138639.
- [CrossRef] [Google Scholar]
- Flotation and surface behavior of cassiterite with salicylhydroxamic. Ind. Eng. Chem. Res.. 2011;50(18):10778-10783.
- [CrossRef] [Google Scholar]
- Parametric optimization by Box-Behnken design for synthesis of magnetic chitosan-benzil/ZnO/Fe3O4 nanocomposite and textile dye removal. J. Environ. Chem. Eng. 2021;9(13)
- [CrossRef] [Google Scholar]
- Synergistic degradation of trans-ferulic acid by water falling film DBD plasma coupled with cobalt oxyhydroxide: performance and mechanisms. Chem. Eng. J.. 2019;372:321-331.
- [CrossRef] [Google Scholar]
- Degradation of trans-ferulic acid in aqueous solution by a water falling film DBD reactor: Degradation performance, response surface methodology, reactive species analysis and toxicity evaluation. Sep. Purif. Technol. 2020;235
- [CrossRef] [Google Scholar]
- Degradation of caffeic acid by dielectric barrier discharge plasma combined with ce doped CoOOH catalyst. J. Hazard. Mater.. 2021;402
- [CrossRef] [Google Scholar]
- Degradation of aniline in aqueous solution by dielectric barrier discharge plasma: Mechanism and degradation pathways. Chemosphere. 2019;223:416-424.
- [CrossRef] [Google Scholar]
- Degradation of contaminants in plasma technology: an overview. J. Hazard. Mater. 2022;424:127390.1-127390.20.
- [CrossRef] [Google Scholar]
- Successive treatment of benzene and derived byproducts by a novel plasma catalysis-adsorption process. J. Environ. Chem. Eng.. 2021;9
- [CrossRef] [Google Scholar]
- Minerals selective flotation of cassiterite from calcite with salicylhydroxamic acid collector and carboxymethyl cellulose depressant. Minerals 2019:5-15.
- [CrossRef] [Google Scholar]
- Evaluation of the potentials of humic acid removal in water by gas phase surface discharge plasma. Water Res.. 2016;89:28-38.
- [CrossRef] [Google Scholar]
- Efficient degradation of 4-fluorophenol under dielectric barrier discharge plasma treatment using Cu/Fe-AO-PAN catalyst: role of H2O2 production. Chem. Eng. J.. 2021;420
- [CrossRef] [Google Scholar]
- Photolytic reaction mechanism and impacts of coexisting substances on photodegradation of bisphenol A by Bi2WO6 in water. Water Res.. 2012;46:845-853.
- [CrossRef] [Google Scholar]
- Removal of alachlor in water by non-thermal plasma: reactive species and pathways in batch and continuous process. Water Res.. 2019;161:549-559.
- [CrossRef] [Google Scholar]
- Removal of alachlor in water by non-thermal plasma: Reactive species and pathways in batch and continuous process. Water Res.. 2019;161:549-559.
- [CrossRef] [Google Scholar]
- Surface modification of phosphoric acid activated carbon by using non-thermal plasma for enhancement of Cu(II) adsorption from aqueous solutions. Sep. Purif. Technol.. 2018;17:S1383.
- [CrossRef] [Google Scholar]
- Surface interaction mechanisms in mineral flotation: Fundamentals, measurements, and perspectives. Adv. Colloid Interface Sci.. 2021;295
- [CrossRef] [Google Scholar]
- Degradation of triclosan in aqueous solution by dielectric barrier discharge plasma combined with activated carbon fibers. Chemosphere. 2016;144:855-863.
- [CrossRef] [Google Scholar]
- Degradation effect and mechanism of gas-liquid phase dielectric barrier discharge on norfloxacin combined with H2O2 or Fe2+. Sep. Purif. Technol.. 2020;230:115862.
- [CrossRef] [Google Scholar]
- Degradation of microcystin-LR in water by glow discharge plasma oxidation at the gas–solution interface and its safety evaluation. Water Res.. 2012;46(19):6554-6562.
- [CrossRef] [Google Scholar]
- A visualization method for studying the adsorption of lead species in salicylhydroxamic acid flotation of hemimorphite. Miner. Eng.. 2020;154:106434.
- [CrossRef] [Google Scholar]
- Photo-Fenton degradation of ammonia via a manganese-iron double-active component catalyst of graphene-manganese ferrite under visible light. Chem. Eng. J.. 2016;283:266-275.
- [CrossRef] [Google Scholar]
Appendix A
Supplementary material
Supplementary data to this article can be found online at https://doi.org/10.1016/j.arabjc.2023.105048.
Appendix A
Supplementary material
The following are the Supplementary data to this article:Supplementary data 1
Supplementary data 1


