

Translate this page into:
Design and evaluation of piperidine carboxamide derivatives as potent ALK inhibitors through 3D-QSAR modeling, artificial neural network and computational analysis
⁎Corresponding authors. jianbotong@aliyun.com (Jian-Bo Tong), yrong1992@163.com (Yan-Rong Zeng)
-
Received: ,
Accepted: ,
This article was originally published by Elsevier and was migrated to Scientific Scholar after the change of Publisher.
Abstract
Tumor stands as one of the principal contributors to global mortality. As research into tumor treatments advances, tumor inhibitors emerge as pivotal milestones in tumor therapy. Among these inhibitors, Anaplastic Lymphoma Kinase (ALK), a receptor tyrosine kinase, is critical owing to its close association with tumor cell proliferation and growth, which renders it a critical therapeutic target. This work systematically explores the relationship between the chemical structures of 36 piperidine carboxamide derivatives and their efficacy in inhibiting Karpas-299 tumor cell activity by employing a rigorous 3D-QSAR modeling approach. A robust Topomer CoMFA model was generated and was meticulously validated through ANN neural network analysis (q2 = 0.597, r2 = 0.939, F = 84.401, N = 4, SEE = 0.268). Based on the model, 60 new compounds with desirable inhibitory activities were successfully designed. Combined with Lipinski’s rule and ADMET criteria alongside molecular docking and dynamics simulations, a lead compound with high inhibitory activity and good drug-likeness was selected. Further computational analyses, encompassing free energy landscape and binding free energy calculations, provided compelling evidence of the stable binding conformation of the lead compound and the superior affinity with the target protein at the active site, underscoring its potential therapeutic utility. In summary, this investigation offers valuable insights and methodological guidance for advancing tumor therapy and underscores the promise of piperidine carboxamide derivatives as prospective ALK inhibitors.
Keywords
Tumor
QSAR
Artificial neural network
Piperidine carboxamide derivatives
ALK inhibitors

1 Introduction
ALK (Anaplastic Lymphoma Kinase) a receptor tyrosine kinase, plays a pivotal role in embryonic and neural development (Haratake et al., 2021; Mizuta et al., 2021; Cooper et al., 2022). However, mutations, rearrangements or aberrant activation of the ALK gene frequently induce hyperactivation of the ALK protein (Schneider et al., 2023; Rothenstein and Chooback, 2018; Iannantuono et al., 2022), thereby exacerbating cellular pathogenesis and degeneration. In tumor cells, the aberrantly active ALK protein participates in cellular proliferation, growth and metabolic processes through signaling pathways including RAS-MAPK (Hrustanovic and Bivona, 2015), PI3K-AKT and JAK-STAT (Guan et al., 2023; Jang et al., 2017; Dong et al., 2016), resulting in uncontrolled tumor cell growth and dissemination. Therefore, the inhibition of ALK protein and its associated signaling pathways has emerged as a critical therapeutic strategy across various types of tumor therapy.
With the widespread adoption of various ALK inhibitors such as Crizotinib (Du et al., 2018), Alectinib and Lorlatinib (Mizuta et al., 2021; van Erp et al., 2017; Tucker et al., 2017), there is growing interest in organic synthetic compounds as potential ALK inhibitors. Among these, piperidine carboxamide derivatives characterized by a piperidine ring and a carboxamide group, exhibit diverse biological activities owing to their unique chemical structures (Park et al., 2021; Eşme et al., 2024; Stylianakis et al., 2023). Bryan et al successfully synthesized a range of piperidine carboxamide derivatives (Bryan et al., 2012); that demonstrate significant anti-tumor activity in the Karpas-299 cell model, which indicates that they have good potential as ALK inhibitors. Despite the preliminary validation of the anti-tumor activity of these compounds, the anti-tumor mechanisms remain elusive. Hence, there is a pressing need to comprehensively elucidate their mechanisms of action to unlock further potential as ALK inhibitors and broaden their applications in tumor therapy.
As illustrated in Scheme 1, a 3D-QSAR model was constructed utilizing the Topomer CoMFA method to gain insight into the relationship between piperidine carboxamide derivatives chemical structures and inhibition of tumor cell activity, in order to identify key features of ALK inhibitors. The accuracy and robustness of the model were ensured through internal and external validation, as well as verification using an artificial neural network model. Based on this model, 60 novel compounds with desirable inhibitory activity were successfully designed through adjustment and optimization of substituent fragments. Combining Lipinski's rule with computational drug design techniques including ADMET evaluation, molecular docking and molecular electrostatic potential, one lead compound (Compound N55) that exhibits high inhibitory activity and favorable drug-like properties was identified. Molecular dynamics simulations, free energy landscapes and binding free energies were performed on compound N55 to elucidate potential ligand conformations and interaction patterns at the active site. This work aims to provide avenues for the development of future ALK inhibitors and the development of novel anti-tumor drugs.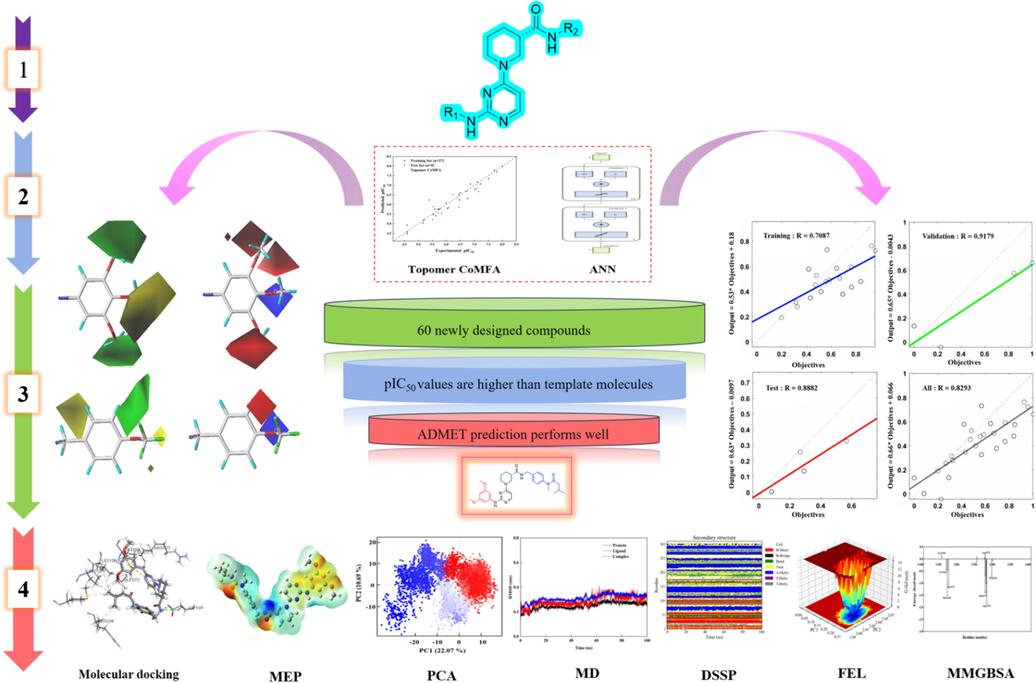
Compounds design and screening process.
2 Materials and methods
2.1 The compound structure and inhibitory activity
The test results for compounds and anti-tumor cell (Karpas-299 cells) activity can be found in Table S1.
2.2 Preprocessing of compound structures and dataset partitioning refinement
Prior to dataset partitioning, compound conformations within the dataset were optimized using the MMFF94 force field in Chem 3D (Plett et al., 2024; Lee et al., 2024). Subsequently, 27 compounds were randomly allocated to the training set (75 %), while 9 compounds were designated for the testing set (25 %). To ensure balanced model prediction performance, both sets encompassed samples with high, medium and low activity levels, distributed approximately equally across various ranges of biological activity.
2.3 Topomer CoMFA
Topomer CoMFA (Topomer Comparative Molecular Field Analysis) is a method dedicated to exploring how internal molecular conformational changes influence biological activity (Sepehri et al., 2021; Kovatcheva et al., 2005). By modeling the three-dimensional field effects of Topomers, it quantifies the impact of structural variances on biological activity, thereby elucidating the intricate relationship between conformational changes and biological responses (Abdizadeh et al., 2020). This method furnishes a more sophisticated and comprehensive approach to predicting biological activity, thereby enhancing the precision and depth of compound design strategies.
2.4 Partial least squares regression and external model validation
Partial least squares (PLS) are a multivariate statistical method commonly employed in handling datasets comprising multiple independent and response variables (Beyaztas and Shang, 2020; Abdizadeh et al., 2021). In this study, PLS regression was utilized to construct QSAR models by optimizing the relationship between descriptors derived from the Topomer CoMFA model and activity values, thereby facilitating accurate predictions of activity levels within the dataset. Furthermore, to ensure the reliability of the model, various parameters including the cross-validated correlation coefficient q2, optimal number of components (ONC), non-cross-validated correlation coefficient r2, standard error of estimation SEE and F-test values were computed to validate the accuracy and robustness of the model results (Golbraikh et al., 2014; Dörgő et al., 2020; Xie and Feng, X.a., Li, L., Chen, X. , 2022), as depicted by equations (1) and (2).
An ideal QSAR model should exhibit strong performance not only during internal validation but also when subjected to external validation, ensuring the reliability of its predictive capabilities. Employing an independent test dataset for external validation is crucial to establish the credibility of the model. The external validation parameter for assessing the model's predictive ability, denoted as r2pred, is defined by formula (3).
SD represents the sum of squared deviations between the inhibitory activity of compounds in the test set and the average inhibitory activity of compounds in the training set, while PRESS represents the sum of squared deviations between the predicted activity and the experimental activity of compounds in the test set.
The calculation of other relevant validation parameters follows the method introduced by Golbraikh-Tropsha and Roy (Liu et al., 2023; Yang et al., 2023). The formulas for
and
are as shown in equations (4)-(9).
Additionally, the performance of the model was further assessed utilizing root mean square error (RMSE), mean absolute error (MAE) and concordance correlation coefficient (CCC). The pertinent validation parameters are delineated by equations (10) through (12).
2.5 Application domain and Y randomization test
The assessment of the application domain (AD) for QSAR models is a critical step in ensuring their reliability, especially when dealing with structurally similar compounds, where the model's applicability needs to be rigorously evaluated. In this context, AD is defined using the leverage method in conjunction with standardized techniques to guarantee the accuracy of model predictions (Tandon et al., 2019), as depicted by formula (13).
represents the leverage value for the -th compound, signifies the standardized molecular descriptor vector for compound , and denotes the entire domain matrix.
Leverage value is a statistical metric frequently employed to evaluate the influence of individual samples on a model, particularly in the realm of quantitative structure–activity relationship (QSAR) modeling (Dörgő et al., 2020). Elevated leverage values suggest that these samples exhibit distinctive or outlier characteristics in elucidating the structure–activity relationship of compounds, potentially exerting a substantial impact on model construction and prediction. By contrasting leverage values against a predefined threshold, the stability of the model within this domain and the trustworthiness of the predictions can be appraised. The calculation formula for the threshold is delineated in equation (14).
In this equation, represents the descriptor value plus one, and represents the number of samples in the training set.
Moreover, to enhance the model's robustness and mitigate the risk of fortuitous correlations, a Y-randomization test was performed to substantiate the non-random nature of the model's outcomes.
2.6 Artificial neural network model
Artificial neural network (ANN) is a non-linear modeling approach consisting of input, hidden, and output layers (Yang and Zhao, 2023; Herzog et al., 2020; Sherfey et al., 2018). In QSAR research, it models the structural features of compounds in the dataset to effectively capture the relationship between molecular structure and biological activity. This study verifies the accuracy of activity prediction of compounds generated by the Topomer CoMFA model using a feedforward neural network model (Sherfey et al., 2018). By iteratively testing different numbers of hidden layer neurons, we aimed to find the optimal predictive performance to ensure the reliability of the Topomer CoMFA model results. The built-in function “newff” in MATLAB was utilized as the activation function for the hidden and output layers and the dataset was trained using the scaled conjugate gradient algorithm (Yekeen et al., 2023). Furthermore, the fragment contribution of R1 and R2, experimental pIC50 values, and Topomer CoMFA model-predicted pIC50 values were designated as input layer nodes, while the validation pIC50 values were designated as output layer nodes.
The number of nodes in the hidden layer plays a critical role in maintaining the model's balance. Excessive nodes can lead to overfitting, while insufficient nodes can compromise the model's robustness and generalization capability. Based on Kolmogorov's theorem and the complexity of this model (Chernov, 2020), a single hidden layer neural network is sufficient to map the overall model relationship. Therefore, the structure of the hidden layer is set to 1. Furthermore, through iterative adjustments of the number of hidden layer neurons and the iteration count during training, the model undergoes continual refinement and optimization, thus ensuring the robustness of the final model.
2.7 Molecular design and activity prediction
In the Topomer Search module of SYBYL 2.0, compounds' physicochemical properties are utilized to screen R1 and R2 fragments in the Zinc15 database (bioactive subset) based on similarity. High-activity contributing fragments are selected and combined theoretically to obtain new compounds with high inhibitory activity. During this process, the molecular fragments of the new compounds must meet the criteria of a topological distance close to 185 (Tong et al., 2021), and the contribution value of the R group should be close to or greater than the corresponding contribution value of the R group in the Topomer CoMFA model. In addition, the Topomer CoMFA model was used to forecast the activity of newly formulated compounds for assessing the rationality of the design outcomes.
2.8 ADMET prediction
As a commonly employed tool in pharmaceutical research, the assessment of a candidate compound's absorption, distribution, metabolism, excretion, and toxicity (ADMET) properties serves to ascertain its potential pharmaceutical value and safety (Dong et al., 2018). This approach markedly diminishes experimental costs and time, thereby offering guidance for the optimization and refinement of subsequent compounds. In this study, the ADMET Lab online server was employed to predict the ADMET properties of the newly designed compounds (Ferreira and Andricopulo, 2019).
2.9 Molecular docking
Molecular docking, serving as a computational approach for simulating and predicting the binding interactions and affinity between small molecules and target proteins, plays a pivotal role in drug design and discovery (Hou et al., 2013; Johnson and Snow, 2016; Krause et al., 2023). This method adeptly elucidates the interactions between drugs and target proteins, thereby forecasting the mode and intensity of drug-protein binding. In this research, the receptor protein is human anaplastic lymphoma kinase, a protein closely associated with embryonic development and neuronal differentiation, with PDB ID: 4DCE (Bryan et al., 2012). Autodock Vina was selected as the docking tool, and the root-mean-square deviation (RMSD) between the docking results of homologous ligands and re-docked ligands was used to ensure the reliability of the docking method.
Initially, gradient optimization and the Lamarckian genetic algorithm were applied to globally search for conformations of the ligands and receptors (Neumann et al., 2024; Cuadra et al., 2016), obtaining their lowest energy conformations which underwent energy minimization. Concurrently, redundant water molecules were eliminated. The Powell method was employed for ligand and protein optimization, with the ligand force field set as Tripos, a non-bonded cutoff value of 9.0, and a dielectric constant of 2 (Wang et al., 2023). The protein force field was set as Kollman, with a non-bonded cutoff value of 9.0 and a dielectric constant of 4 (Kawamoto et al., 2022; Xu et al., 2024). The dimensions of the protein's active site box were as follows: X = 70, Y = 70, Z = 70, with a grid spacing of 0.375 Å. The center coordinates were x = 6.93, y = 12.70, z = 37.15. Finally, hydrogen bonds and hydrophobic interactions at the ligand and protein active sites were visualized using Discovery Studio Visualizer 2019.
2.10 Molecular electrostatic potential
To delve deeper into the intra-molecular interactions and predict their involvement and reactivity in chemical reactions, a computational analysis on the molecular electrostatic potential (MEP) of the compound was conducted (Zhao et al., 2023). Density functional theory (DFT) was utilized for structure optimization and frequency calculations of the compound at the B3LYP/6-31G(d) level. The absence of imaginary frequencies in the optimized structures indicates the attainment of energetically stable conformations (Fedorov et al., 2019). All computations were performed using the Gaussian 16 program.
2.11 Molecular dynamics simulation
Molecular dynamics simulation is a computational technique specialized in modeling the interactions among biomolecules. Its primary objective is to simulate the binding process and dynamic behaviors of biomolecules, aiming to gain deeper insights into their interaction mechanisms (Jeyaram et al., 2019). Through this simulation approach, intricate details of biomolecular interactions, including dynamic behavior during binding and the stability of binding sites, can be elucidated, contributing to a more comprehensive understanding of biomolecular interactions.
MD simulations were performed using the Gromacs software, with the CHARMM36-Jul2021 force field, for a protein–ligand complex (Abraham et al., 2015; Aho et al., 2022). Initially, the system was placed under periodic boundary conditions (PBC) within a 12-faced box composed of a water model (Tip3p) (Hammoudi et al., 2020). The system's charge was neutralized by adding an appropriate number of Na+ and Cl- ions. Subsequently, atomic interactions were computed using the Lorentz-Berthelot rule and the particle mesh Ewald (PME) method (Vora et al., 2020), and energy minimization was conducted using the steepest descent and conjugate gradient algorithms over 50,000 steps. Following energy minimization, the system underwent equilibration in the isochoric-isothermal (NVT) and isobaric-isothermal (NPT) ensembles for 200 ps each (Ogawa et al., 2023). The simulation environment was set at constant temperature (300 K) and pressure (1 atm) (Yousef et al., 2022). Individual simulations for each complex were carried out for 100 ns, with a time step of 2 fs (Tong et al., 2021). After completion of the simulations, trajectory analysis was performed using tools available in the Gromacs suite. Various parameters were computed, including principal component analysis (PCA), root mean square deviation (RMSD), root mean square fluctuation (RMSF), radius of gyration (Rg), solvent-accessible surface area (SASA), number of hydrogen bonds, dictionary of secondary structure of proteins (DSSP) and free energy landscape, among others.
2.12 Binding free energy and amino acid decomposition binding free energy
The binding free energy serves as a pivotal parameter in evaluating the strength of intermolecular interactions and the stability of complexes (Sheng et al., 2021), especially in assessing the stability of ligand-receptor binding (Sun et al., 2024). Conversely, amino acid decomposition binding free energy refers to the energy released or absorbed when each amino acid residue interacts with the ligand (Ebrahimi and Hénin, 2022). Through the computation of individual amino acid residues' energy contributions, their respective roles and significance during the binding process can be elucidated, facilitating the identification of pivotal residues that play critical roles in protein–ligand interactions (Zhou et al., 2023). Binding free energy (MMGBSA) was calculated according to the following formulas (15)-(17):
Here, ΔEvdW, ΔEele, ΔEpolar, ΔEnonpolar, ΔGgas, ΔGsolv and ΔGMMGBSA represents van der Waals forces, electrostatic energy, polar solvation energy, nonpolar solvation energy, meteorological chemical energy, solvation energy and total energy (Ebrahimi and Hénin, 2022).
3 Results and discussion
3.1 Topomer CoMFA model results
The accuracy of the Topomer CoMFA model heavily relies on the methodology used to fragment the molecules in the training set. In this research, the most potent compound 24 was selected as the template molecule and it was fragmented based on the skeleton illustrated in Fig. 1. The contributions of the resulting fragments varied, which indicates diverse impacts on the inhibitory activity of the compounds. The statistical parameters of the model for the optimal fragmentation method are summarized in Table 1, with q2 = 0.597, r2 = 0.939, F = 84.401, N = 4, and SEE = 0.268.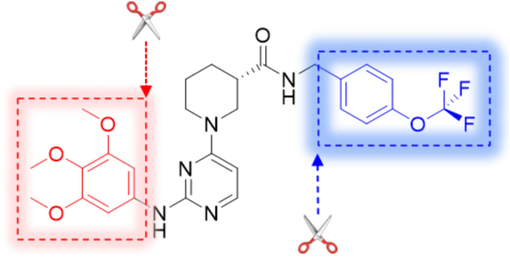
The optimal fragmentation method of the Topomer CoMFA model.
PLS statistic
Criterion
Topomer CoMFA
q2
q2 > 0.5
0.597
r2
r2 > 0.6
0.939
F
84.401
SEE
0.2680
N
4
r2pred
r2pred > 0.6
0.6422
R2
(R2- R02) / R2 < 0.1
0.7721
R02
(R2- R02) / R2 < 0.1
0.6980
R'02
(R2- R02) / R2 < 0.1
0.6180
k
0.85 ≤ k ≤ 1.15
0.9995
k'
0.85 ≤ k' ≤ 1.15
1.0017
rm 2
rm 2 > 0.5
0.5618
rm 2
rm 2 < 0.2
0.0928
RMSE
Close to 0
0.351
MAE
0.305
CCC
CCC > 0.8
0.817
3.2 The internal and external validation results of the Topomer CoMFA model
The model's strong internal predictive capability is evident from its q2 value. However, to ensure the model's robustness, an independent test set was utilized for external validation of the Topomer CoMFA model. The results of the corresponding evaluation parameters are detailed in Table 1.
3.3 The applicability domain and Y-randomization test results
The results of the model's applicability domain are shown in Fig. 2. It can be observed that the leverage values for the majority of compounds fall within the specified threshold, which indicates that the established Topomer CoMFA model has a broad applicability domain and can be used to predict the biological activity of new compounds. However, it is worth noting that one compound in the training set displays an applicability domain detection exceeding the predefined threshold. Consequently, a thorough investigation of its characteristics and contributions is warranted to ensure the continued reliability of the model under specific conditions.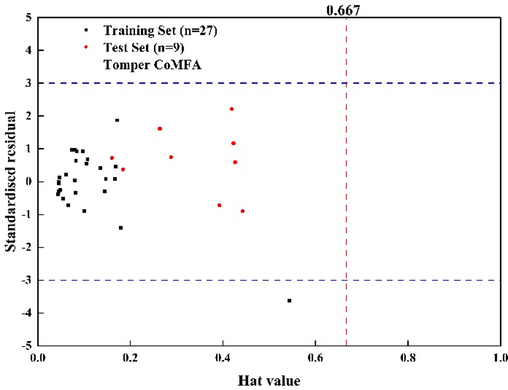
The applicability domain detection of the Topomer CoMFA model.
Furthermore, the results of the Y-randomization test can be found in Table 2. All test outcomes demonstrate minimal q2 and r2 values, which indicates that the performance of the model is not merely due to chance correlations within the training set.
Model
Topomer CoMFA
q2
r2
Original
0.597
0.939
1
−0.526
0.089
2
−0.122
0.190
3
−0.171
0.107
4
−0.050
0.191
5
−0.191
0.094
6
−0.311
0.112
7
−0.322
0.091
8
−0.177
0.086
9
−0.075
0.142
10
−0.182
0.097
3.4 The prediction results of the optimal Topomer CoMFA model
Under the optimal Topomer CoMFA model, the inhibitory activity of compounds in the dataset was predicted. The prediction results and the contribution values of R-group fragments are presented in Table 3. The results demonstrate that the predicted pIC50 values for all compounds are within a reasonable range, along with the associated linear errors and fitting relationships, as depicted in Fig. 3.
NO
pIC50
Topomer CoMFA
Fragment contribution
Pred
Error
R1
R2
1
6.76
6.32
0.44
1.78
0.21
2
4.60
4.58
0.02
0.03
0.21
3
5.63
5.41
0.22
0.86
0.21
4
4.60
4.49
0.11
−0.05
0.21
5*
5.70
5.55
0.15
1.01
0.21
6
5.20
5.19
0.01
0.65
0.21
7
5.99
6.08
−0.09
1.54
0.21
8*
5.51
5.21
0.30
0.65
0.21
9
6.04
5.81
0.23
1.26
0.21
10
4.60
4.93
−0.33
0.39
0.21
11
5.76
5.77
−0.01
1.23
0.21
12*
5.83
5.54
0.29
0.99
0.21
13
6.49
6.61
−0.12
2.06
0.21
14*
6.08
5.83
0.25
1.78
−0.38
15
6.44
6.51
−0.07
1.78
0.40
16*
6.45
5.86
0.59
1.78
−0.35
17
5.17
5.04
0.13
1.78
−0.35
18*
5.53
5.89
−0.36
1.78
−0.19
19
5.59
5.76
−0.17
1.78
−0.35
20
5.70
5.76
−0.06
1.78
−0.35
21
6.47
6.24
0.23
1.78
0.13
22*
7.08
6.84
0.24
1.78
0.73
23
7.80
7.70
0.10
1.78
1.59
24
8.00
7.98
0.02
1.78
1.87
25*
6.23
6.52
−0.29
1.78
0.45
26
7.10
7.18
−0.08
1.78
1.07
27
7.02
6.80
0.22
1.78
0.70
28*
7.15
6.68
0.47
1.78
0.57
29
5.53
5.48
0.05
1.78
−0.63
30
7.22
7.07
0.15
1.78
0.96
31
5.77
5.77
0.00
1.78
−0.33
32
7.72
7.79
−0.07
1.78
1.69
33
6.86
7.07
−0.21
1.78
0.96
34
6.72
6.69
0.03
1.78
0.58
35
7.51
7.35
0.16
1.78
1.24
36
5.39
6.24
−0.85
1.78
0.21
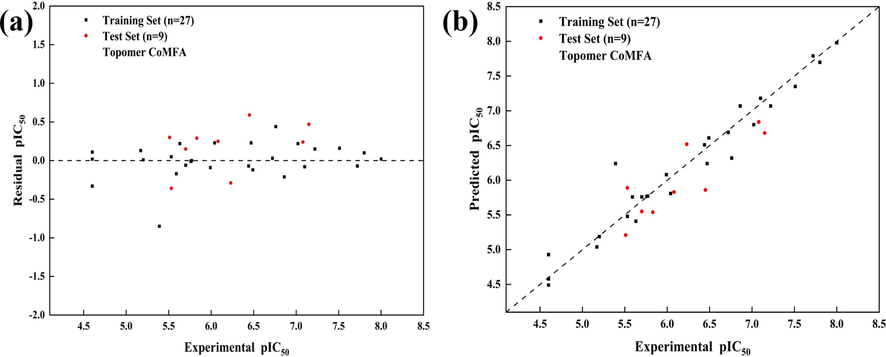
The prediction errors of the results (a); The linear regression fitting of the predicted results (b).
3.5 The validation results of the artificial neural network model
In MATLAB, a neural network was employed to train the predictive results of the Topomer CoMFA model, aiming to bolster its reliability. The training process adhered to the outlined procedure in Fig. 4 (a). Furthermore, to ascertain the optimal training circles, the early stopping technique was implemented to monitor the validation set error. Training was promptly terminated once consecutive rounds indicated no further reduction in validation set error, thereby preempting overfitting and conserving computational resources. Ultimately, the optimal training circle was determined to be 2, with a corresponding validation set error of 0.016. The outcomes of the optimal training circles are delineated in Fig. 4 (b).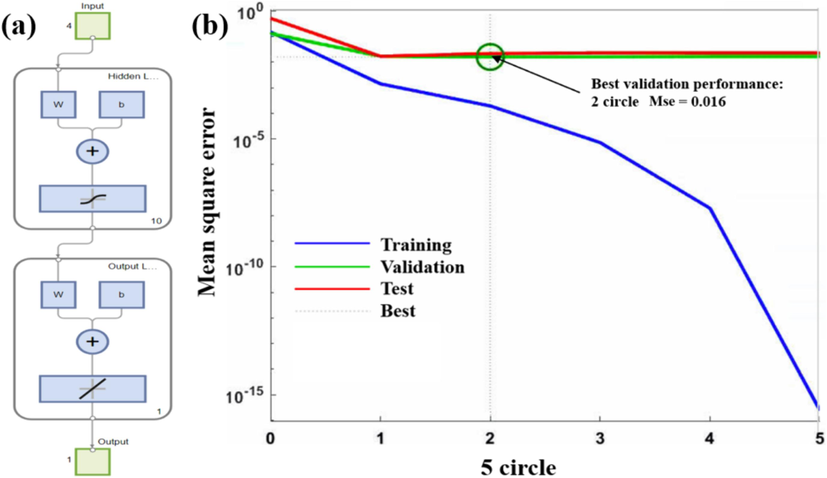
The neural network training model process (a); The optimal training circles (b).
In this neural network model, that leverages multiple error metrics analysis, 75 % of the dataset was allocated for network training, while the remaining 25 % was reserved for network testing. Basic network parameters were set, including 1000 training epochs, a learning rate of 0.1, a minimum training target error of 0.0001, a momentum factor of 0.01 and a minimum performance gradient of 1 × 10⁻⁶. Under these specified conditions, continual adjustments were made to the artificial network activation functions and training functions, enabling the comprehensive tuning of the model to achieve optimal performance. The resulting model equation was determined to be Y = 0.66X + 0.066, with a minimum root mean square error of 0.1763, a minimum mean absolute percentage error of 2.8687 % and a minimum mean absolute error of 0.1708. Furthermore, as the mean square error decreases and the coefficient R approaches 1, it signifies an enhanced fit of the model (Rister and Rubin, 2017). The corresponding model equations are depicted in Fig. 5.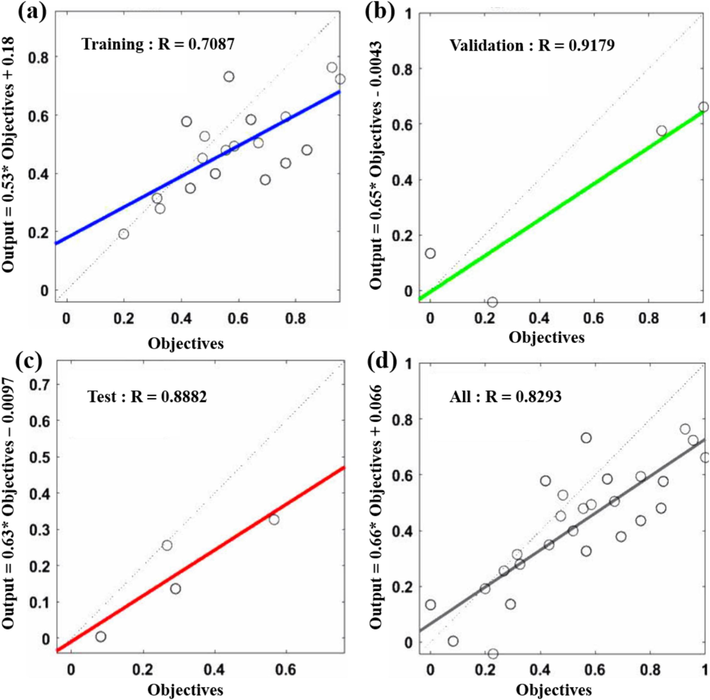
Optimal training model (a); Optimal validation model (b); Optimal test model (c); Optimal neural network model (d).
Under the optimal Topomer CoMFA model and ANN model, activity prediction and validation of compounds in the test set were conducted. The specific fitting results are depicted in Fig. 6.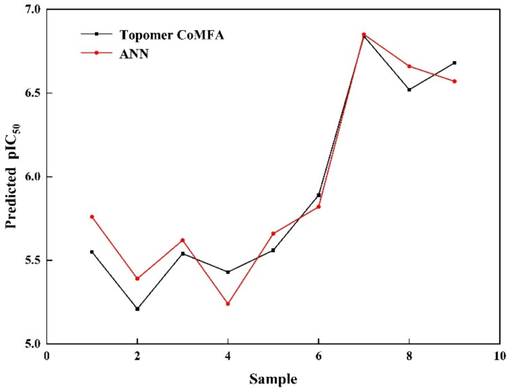
The fitting results of the Topomer CoMFA model and ANN model.
3.6 Contour map analysis of the Topomer CoMFA model
In the contour maps of the Topomer CoMFA steric field, the green region represents larger volume substituents contributing significantly to activity, while the yellow region indicates smaller volume groups making a high contribution to activity (Tong et al., 2023). In the electrostatic field contour maps, the red region signifies favorable activity for negatively charged groups, whereas the blue region suggests favorable activity for positively charged groups (Zhang et al., 2019). In this context, compound 24 (pIC50 = 8), which shows the highest activity, was chosen as the template compound for specific analysis of compounds in the dataset.
As depicted in Fig. 7 (a), the C-3 and C-5 positions of the R1 fragment are enclosed by green regions, suggesting that increasing the volume of substituents at these positions can enhance the compound's inhibitory activity. Consequently, compounds 5, 7 and 9 bearing Cl, OMe and Et substitutions, respectively, at the C-3 position, exhibit significantly higher pIC50 values compared to compound 3 without any substitutions. Moreover, compound 13, featuring OMe substitutions at both the C-3 and C-5 positions, demonstrates notably higher pIC50 value than compound 7, which has OMe substitution solely at the C-3 position. Notably, a yellow region is observed at the C-4 position, which indicates that increasing the volume of substituents at this position is detrimental to enhancing inhibitory activity. Thus, compounds 6, 8 and 10 with Cl, OMe and Et substitutions, respectively, at the C-4 position, exhibit markedly lower pIC50 values compared to compound 3 without any substitutions.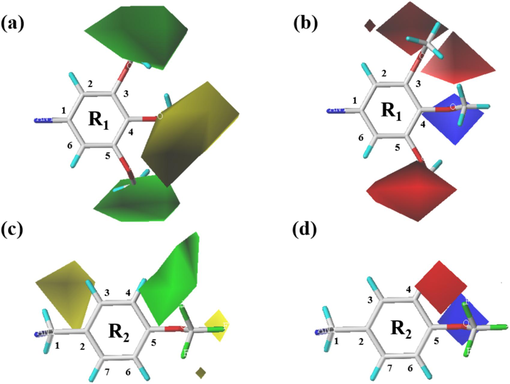
The Topomer CoMFA model contour map of compound 24; (a and b) steric contour map and electrostatic contour map around the R1 fragment; (c and d) steric contour map and electrostatic contour map around R2 fragment.
In Fig. 7 (b), the C-3 and C-5 positions of the R1 fragment are surrounded by red regions, implying that enhancing the electronegativity of substituents at these positions contributes to increasing the compound's inhibitory activity. Consequently, compounds 5 and 7 with Cl and OMe substitutions, respectively, at the C-3 position, exhibit significantly higher inhibitory activity compared to compound 3 without any substitutions. It is noteworthy that due to the higher electronegativity of OMe relative to Cl, compound 7 with OMe substitution demonstrates a more pronounced increase in inhibitory activity compared to compound 5. Additionally, compound 13, featuring OMe substitutions at both the C-3 and C-5 positions, shows a substantially higher pIC50 value than compound 7, which has OMe substitution only at the C-3 position. Moreover, a blue region adjacent to the C-4 position suggests that increasing the electronegativity of substituents at this position is detrimental to enhancing compound activity. Consequently, compounds 6 and 8 with Cl and OMe substitutions, respectively, at the C-4 position, exhibit markedly lower pIC50 values compared to compound 3 without any substitutions.
The stereoisomer contour map of the R2 fragment, as illustrated in Fig. 7 (c), reveals that the C-4 position is proximate to a green region, indicating that augmenting the substituent volume at this position enhances the compound's inhibitory potential. Consequently, compounds 22, 23 26, 28, 29, 32, 34 and 35, featuring Me, OCF3, Cl, NO2, CO2Me, Ph, OPh and morpholine substitutions at the C-4 position, respectively, display significantly higher pIC50 values than compound 15 devoid of any substitutions. Additionally, a yellow region is observed at the C-3 position, suggesting that enlarging the substituent volume at this position hampers the improvement of inhibitory activity. Due to the larger volume of the Ph group compared to Cl, compound 33 with Ph substitution at the C-3 position exhibits markedly lower pIC50 value than compound 27 with Cl substitution. Furthermore, compound 31, featuring CO2Me substitution at the C-3 position, also demonstrates notably lower pIC50 value than compound 15 without any substitutions.
In Fig. 7 (d), the C-4 position of the R2 fragment is encompassed by a red region, suggesting that enhancing the electronegativity of substituents at these positions contributes to increasing the inhibitory activity of the compound. Due to the higher electronegativity of F compared to Cl and Me, compounds 24 and 26 with OCF3 and Cl substitutions, respectively, at the C-4 position demonstrate significantly higher inhibitory activity than compound 22 with Me substitution. When the C-4 position has no substitutions, the pIC50 value is minimized. Additionally, a blue region is observed at the C-5 position, which indicates that introducing highly electronegative groups at this position is detrimental to enhancing compound activity. Therefore, compounds 29 and 31 with NO2 and CO2Me substitutions at the C-5 position exhibit substantially lower inhibitory activity compared to compound 15 without any substitutions.
3.7 Molecular design and activity prediction results
Using the Topomer CoMFA model, fragment contribution descriptor values were computed to selectively screen compounds within the ZINC15 database (bioactive subset), retaining those featuring high-contribution R1 and R2 fragments. These selected fragments were subsequently amalgamated with a common scaffold, which leads to the successful design of 60 novel compounds demonstrating potent inhibitory activity. Details regarding the structures of the newly designed compounds and their activity predictions are presented in Table S2, while the schematic representation of the molecular design process can be found in Fig. 8.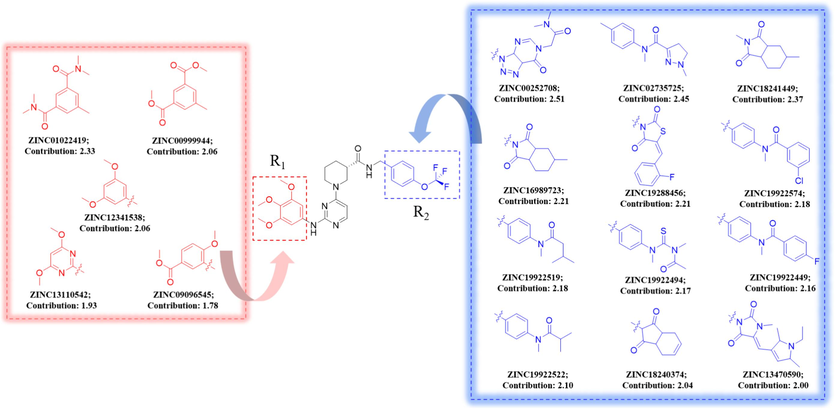
Molecular design scheme.
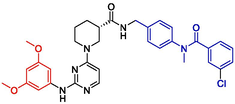
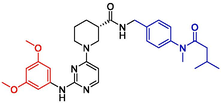
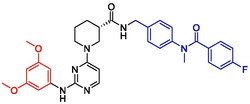
Additionally, the newly designed compounds were subjected to Lipinski's principles of drug design to ascertain their potential as drug candidates (Menche, 2021; Chen et al., 2020). Leveraging the SwissADME online platform, an array of physicochemical properties of the compounds were analyzed, complemented by the activity predictions derived from the Topomer CoMFA model. Consequently, four compounds demonstrating potential pharmaceutical value were identified through this screening process. Detailed information regarding the chemical structures of these compounds and their predicted activity outcomes are summarized in Table 4.
NO
Structures
Fragment contribution
pIC50
R1
R2
Pred
N54
2.06
1.66
8.05
N55
2.06
1.74
8.14
N57
2.06
1.66
8.06
N58
2.06
1.81
8.20
3.8 ADMET prediction results
Based on the ADMET property predictions from Table 5, the newly designed compounds demonstrate favorable human intestinal absorption (HIA), blood–brain barrier (BBB) permeability and volume distribution (VD). In terms of inhibition capacity, the compounds exhibit weaker inhibition of CYP2D6 compared to CYP3A4. Predictions of drug clearance rates indicate that, except for compound N55, the clearance rates of other compounds are relatively low (<5 ml min−1 kg−1). Additionally, toxicity prediction results reveal low toxicity of all compounds in terms of acute oral toxicity in rats (ROA), which is a positive characteristic for drug development. Taking all factors into consideration, compound N55 has been selected for further investigation to uncover its specific potential pharmacological value.
NO
Distribution
Metabolism
Excretion
Toxicity
HIV
BBB
VD
CYP2D6
CYP3A4
CL
ROA
N54
0.006
0.005
0.801
0.691
0.976
2.627
0.372
N55
0.008
0.013
0.970
0.601
0.968
6.053
0.350
N57
0.007
0.006
0.869
0.447
0.961
2.400
0.265
N58
0.008
0.013
0.913
0.630
0.976
3.591
0.223
3.9 Molecular docking results
Through extraction of the homologous ligand from the receptor protein and subsequent re-docking using Autodock Vina, the root-mean-square deviation (RMSD) between the homologous ligand and the re-docked ligand was utilized as a metric to assess the reliability of the docking process. The docking results, as depicted in Fig. 9, reveal that the re-docked ligand closely aligns with the homologous ligand, exhibiting an RMSD value of 1.210 Å. This signifies the robustness and feasibility of the docking approach employed in this investigation, and demonstrates the capability of the docking approach to accurately replicate the binding conformation between the ligand and the protein.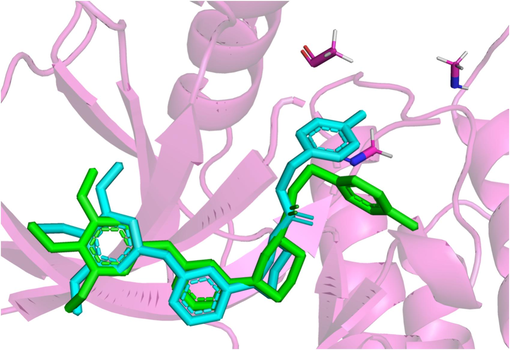
Redocking ligand and homologous ligand congruence conformation; Homologous ligand (Green), re-docked ligand (blue). (For interpretation of the references to color in this figure legend, the reader is referred to the web version of this article.)
In addition, molecular docking was conducted for the newly designed compound N55, and the results, along with the interaction details, are illustrated in Fig. 10. It was observed that compound N55 forms two hydrogen bonds with the amino acid residues Ala1274 and Asp1163 at the active site. Additionally, it engages in multiple C/Pi hydrogen bonds with the amino acid residues Arg1275, Cys1288, and Gly1272. Furthermore, compound N55 exhibits pronounced hydrophobic interactions with the amino acid residues Ile1170, Leu1291, Met1166, Met1290, Phe1271, and Pro1292. These interactions contribute to a firm binding of compound N55 with the target protein at the active site, yielding a total docking score of −9.47 kcal mol−1, which indicates remarkable binding affinity. Notably, all ligand–protein interactions are localized on the newly designed fragment. This provides further validation of the reliability of the fragment-based virtual screening approach.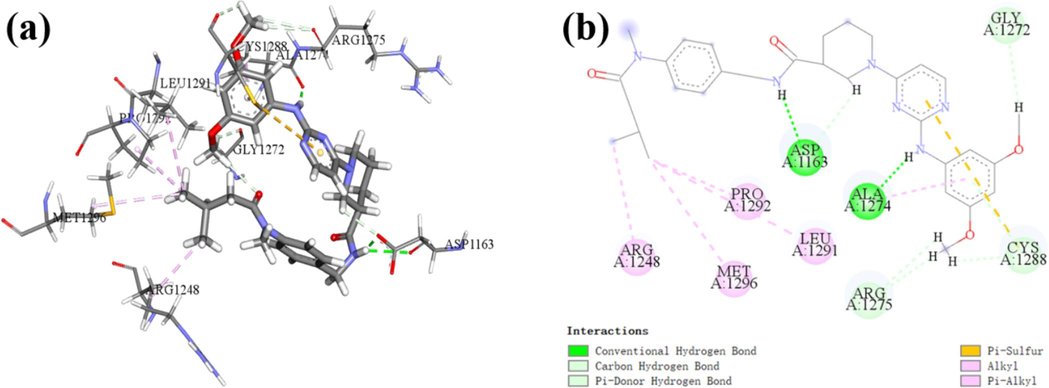
The molecular docking results of the newly designed compound N55, PDB ID: 4DCE; (a) 3D docking results; (b) 2D docking results.
3.10 Molecular electrostatic potential results
Computational analysis of molecular electrostatic potential (MEP) enables the prediction of active sites within compound molecules, and can elucidate interactions with receptor proteins and can unveil the relationship between chemical structure and pharmacological activity. The MEP of compound N55 was computed at the B3LYP/6-31G(d) level, as depicted in Fig. 11. Variations in MEP mapping around compound N55 signify the strength of binding to receptor active sites. Negative MEP regions (dark areas) are localized around carbonyl and ether bonds, while positive MEP regions (light areas) are observed over benzene rings and saturated fatty chains. These regions are indicative of active sites capable of interacting with receptor proteins. This conclusion is consistent with molecular docking results.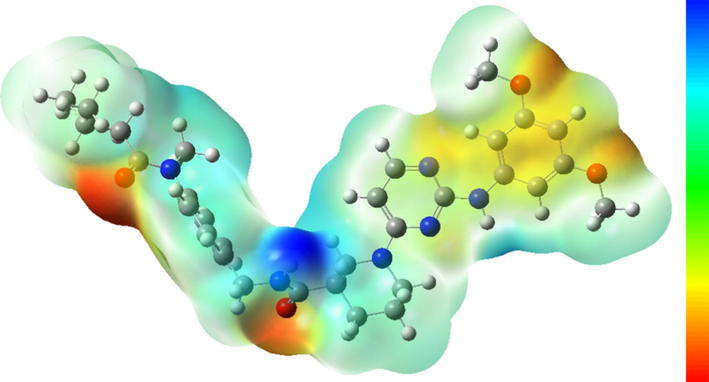
The molecular electrostatic potential of compound N55; The dark regions correspond to negative electrostatic potential areas indicative of active sites for electrophilic reactions; The light regions denote positive electrostatic potential areas serving as active sites for nucleophilic reactions.
3.11 Molecular dynamics simulation results
For an in-depth investigation of the molecular docking outcomes, a 100 ns molecular dynamics simulation was carried out on the complex formed by the newly designed compound N55 and the receptor protein (PDB ID:4DCE). Comprehensive analysis of trajectory and coordinate files was conducted using the built-in tools in Gromacs, to reveal the stability of the ligand-receptor complex.
As shown in Fig. 12 (a), the first two principal components can only explain 32.76 % of the overall motion, indicating that the internal dynamic patterns of the system are highly dispersed, with large-scale conformational changes being suppressed. This finding further supports the notion of a high stability in the ligand–protein complex, suggesting a tightly bound interaction between the compound and the protein. Furthermore, as illustrated in Fig. 12 (b), the first 20 principal components (collectively representing 75.8 % of the variance) also fail to explain the majority (90 %) of the variance. This provides additional evidence that the system maintained its structural integrity throughout the entire simulation without undergoing significant conformational alterations.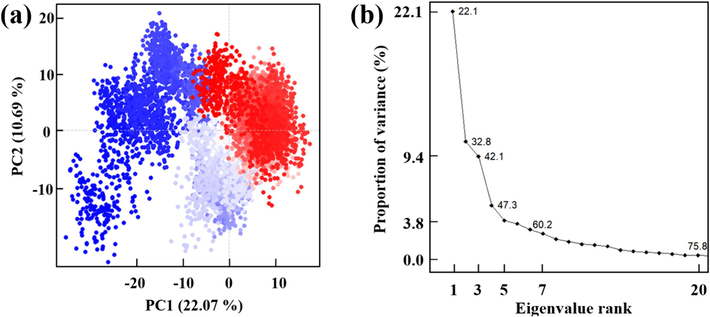
Results of PCA analysis, (a) The first two principal components analysis; (b) The contribution of the top 20 principal components.
The RMSD serves as a critical metric for assessing protein structural changes. As depicted in Fig. 13 (a), during the initial phase of simulation, discernible fluctuations in RMSD among the protein, ligand and complex are observed. This phenomenon is attributed to the influence of the small ligand molecule on the conformational dynamics of amino acid residues surrounding the active pocket upon its binding to the protein receptor. Over the course of simulation, RMSD fluctuations gradually attenuate, which indicates convergence towards stability. Specifically, the average RMSD values for the protein receptor and the complex are 0.24 Å and 0.32 Å. Moreover, the RMSD of the ligand molecule exhibits relative stability with fluctuations confined within 0.2 Å. Overall, RMSD fluctuations for the protein, ligand and complex remain in a narrow range. By the 70 ns mark, the system achieves a state of relative equilibrium and continued simulation leads to eventual convergence to a dynamically stable state.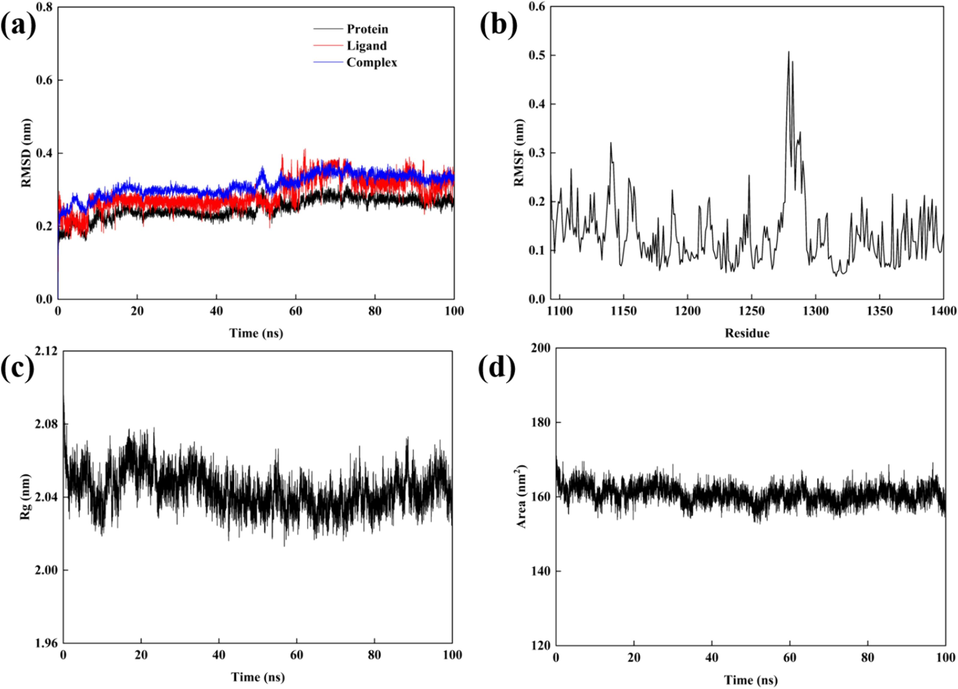
Results of a 100 ns molecular dynamics simulation, (a) RMSD of proteins, ligands and complex; (b) The RMSF values of complex; (c) The Rg values of complex; (d) The SASA values of complex.
RMSF serves as a pivotal parameter for characterizing the dynamic behavior of proteins. Elevated RMSF values are indicative of regions within the protein structure exhibiting heightened flexibility, whereas diminished RMSF values suggest relative rigidity with amino acid residues maintaining stable conformations (Tong et al., 2023). In Fig. 13 (b), the RMSF profiles delineate the fluctuations between the ligand and receptor protein (PDB ID:4DCE). The findings elucidate that the majority of amino acid residues manifest RMSF values below 0.3 nm, signifying the stability of the complex throughout the simulation. Notably, residues 1160–1188 and 1290–1300 within the binding site evince notably reduced RMSF values. Conversely, residues 1270–1280 exhibit heightened RMSF values indicative of heightened fluctuations. Intriguingly, despite these fluctuations, molecular docking analysis reveals the presence of hydrogen bonds. This observation underscores the influence of the surrounding milieu and interactions on hydrogen bond formation and stability. Notwithstanding dynamic structural alterations during simulation, certain residues may retain the capacity to engage in hydrogen bonding with the ligand. Ligand binding by constraining residue mobility can facilitate hydrogen bond formation and stabilization. Thus, elevated RMSF values primarily reflect the global flexibility and dynamism of the molecule.
Rg serves as a pivotal metric for assessing the stability and compactness of the conformational changes in the target protein upon ligand binding (Zhang et al., 2019). A diminished Rg value signifies a tighter molecular arrangement, indicative of either a spherical or densely packed conformation, whereas an augmented Rg value suggests a more extended molecular configuration, with the protein adopting a looser state (Rana and Nguyen, 2023). In Fig. 13 (c), a consistent trend of stable curves and reduced Rg values is observed throughout the simulation duration, which signifies a robust binding affinity between the constituents of the complex. However, during the initial 20 ns, fluctuations in Rg values are noted, attributed to the dynamic process of ligand–protein interaction, which prompts alterations of the internal milieu of the protein. With the progression of the simulation, after 40 ns, Rg values stabilize, which indicates that a quasi-equilibrium state in the conformational landscape is reached. Notably, the ligand–protein complex can adapt to the novel environment and can exhibit favorable mutual interactions, as evidenced by an average Rg value of 2.042 ± 0.011 nm.
The SASA of a protein, indicates the hydrophobicity of its amino acid residues when exposed to the solvent. Throughout the simulation process, as depicted in Fig. 13 (d), the SASA values of the ligand-receptor complex consistently hovered within the range of 158–165 nm2, and exhibit a sustained plateau indicative of structural stability within the protein.
Hydrogen bonds play a pivotal role in preserving the structural stability of proteins. Through an analysis of the hydrogen bond count, length and energy between ligand molecules and proteins, a more comprehensive assessment of the complex's stability can be attained. As illustrated in Fig. 14, over the course of a 100 ns simulation, the average number of hydrogen bonds between ligand small molecules and proteins remains relatively constant. During pivotal stages there are constant 4–5 hydrogen bonds. These interactions are indispensable for maintaining the stability of the complex.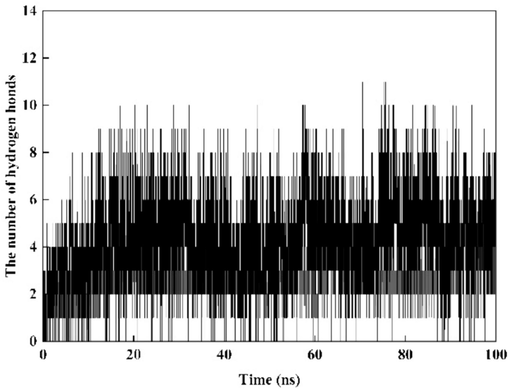
The hydrogen bond count between the ligand and the protein.
3.12 Secondary structure analysis
Throughout the 100 ns duration of molecular dynamics simulation, the composition of the protein's secondary structure exhibited minimal variation, maintaining its initial structural features with little discernible conformational change or transition (as depicted in Fig. 15). This finding shows the relative stability of the complex formed by the binding of the compound with the protein, which indicates an optimal binding affinity. Moreover, this observation serves as indirect evidence for the robust stability of the simulation system under the prescribed conditions.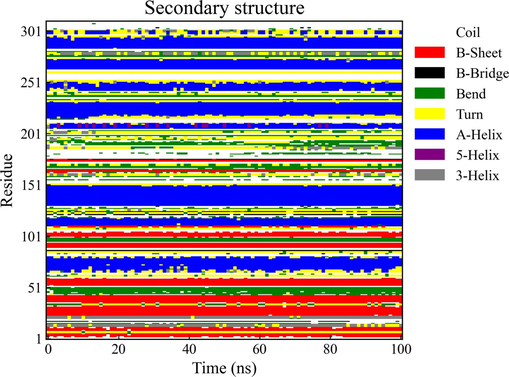
Analysis of protein secondary structure dynamics over a 100 ns Simulation.
3.13 The analysis results of the free energy landscape
The Free Energy Landscape (FEL) is a graphical representation that utilizes color gradients and contour lines to illustrate the intermolecular interactions and energy distribution within a system (Ishida and Kono, 2022). This visualization method provides an intuitive understanding of features such as molecular interactions, conformations and stability. In the FEL, regions with lower free energy (depicted in blue) typically correspond to thermodynamically stable conformations, whereas regions with higher free energy correspond to less stable conformations. Weak or unstable interactions between ligands and receptor proteins may manifest as multiple minima in the free energy landscape, resulting in multiple energy clusters. Conversely, in cases of strong and stable interactions, the free energy distribution may display predominantly a single conformational cluster (Wang and Servis, 2024).
Fig. 16 (a) presents the free energy landscape of the 100 ns complex. The PC1 fluctuation range of the free energy basin for compound N55 and receptor protein (PDB ID:4DCE) is from 0.20 to 0.26, while the PC2 fluctuation range is from 2.00 to 2.03. The variation in free energy ranges from 0 to 13 kJ mol−1. These results indicate that the complex maintains a relatively stable binding conformation throughout the simulation. Moreover, a single, broad blue region observed in the free energy landscape suggests an extended residence time of the complex, indicative of a robust and stable binding conformation. As shown in Fig. 16 (b), comparison of the extraction of the lowest energy conformations with molecular docking results reveals no significant differences in binding modes and interaction types.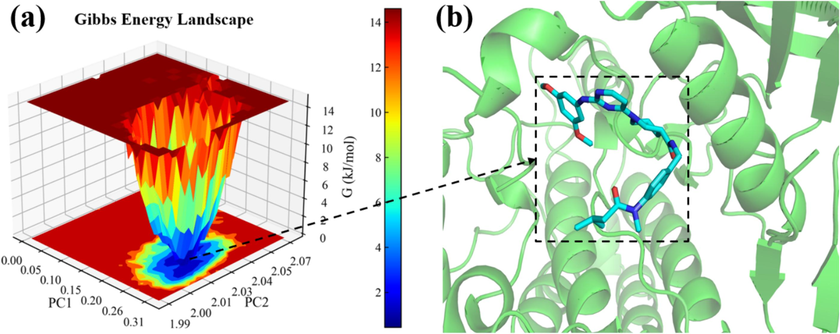
The free energy landscape of the complex; (a) Free energy landscape 3D result map; (c) Results of the lowest energy conformational interaction.
3.14 Calculation results of binding free energy and amino acid decomposition binding free energy
The calculation results are shown in Table 6, where negative values indicate favorable binding interactions, while positive values denote unfavorable interactions. Through compositional analysis, van der Waals forces and meteorological chemical energy predominantly influence the binding process, whereas polar solvation effects contribute to a reduction in the binding free energy. Furthermore, the overall binding free energy of the complex is determined to be −26.31 kJ mol−1, which indicates that the binding is a favorable. SD, Standard deviation; SEM, Standard error of mean.
Energy Component
Average (kJ/mol)
SD
SEM
ΔEvdW
−47.72
0.28
1.20
ΔEele
−4.71
0.56
1.18
ΔEpolar
31.72
0.49
1.36
ΔEnonpolar
−5.60
0.07
0.15
ΔGgas
−52.43
0.63
1.53
ΔGsolv
26.12
0.49
1.35
ΔGMMGBSA
−26.31
0.80
1.36
Fig. 17 presents the calculated results of amino acid decomposition binding free energy. It is observed that residues including Lys1163, Met1166, Ile1170, Asp1275, Asp1276 and Pro1292 play critical roles in the binding process between the ligand and the protein. Specifically, residues Lys1163 and Asp1275 release energy and form hydrogen bonds upon ligand binding, which demonstrates favorable negative binding energies, that are essential for maintaining the stability of the complex.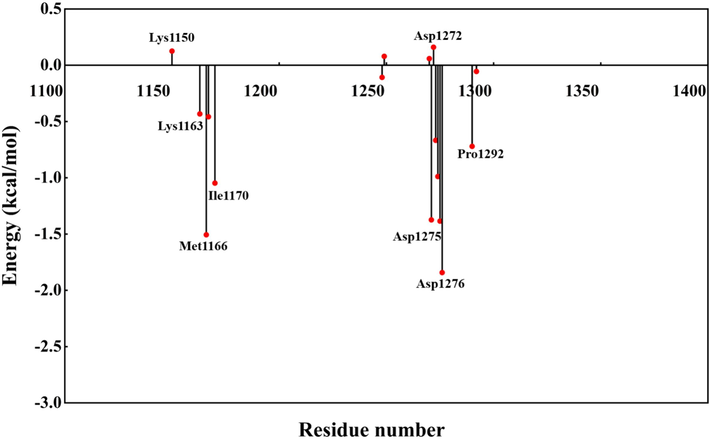
Amino acid decomposition binding free energy.
4 Conclusion
Herein, the 3D-QSAR method was employed to systematically explore the relationship between the chemical structure of piperidine carboxamide derivatives and their inhibitory activity against Karpas-299 tumor cells. The results indicate that they have potential application in tumor therapy and as ALK inhibitors. Using a robust Topomer CoMFA model validated by ANN neural networks (q2 = 0.597, r2 = 0.939), 60 novel compounds with theoretical inhibitory activity were successfully designed. Through a series of computer-aided drug design methods including ADMET, molecular docking and molecular dynamics, one lead compound (compound N55) with high inhibitory activity and favorable drug-like properties was identified. The analysis of the free energy landscape, protein secondary structure and binding free energy calculations provide additional evidence supporting the stable binding conformation of the compound with the protein complex and its favorable binding affinity (−26.31 kJ mol−1), indicating its promising pharmacological prospects. These findings present new opportunities and potential for piperidine carboxamide derivatives as potential ALK inhibitors and in tumor therapy.
CRediT authorship contribution statement
Ya-Kun Zhang: Writing – original draft. Jian-Bo Tong: Writing – review & editing. Mu-Xuan Luo: Software. Xiao-Yu Xing: Validation. Yu-Lu Yang: Visualization. Zhi-Peng Qing: Data curation. Ze-Lei Chang: Methodology. Yan-Rong Zeng: Writing – review & editing.
Acknowledgment
This research was financially supported by the National Natural Science Foundation of China (NSFC) (Grant No:22373062), the Graduate Innovation Fund of Shaanxi University of Science and Technology, the Scientific Research Project of Ordinary Undergraduate Colleges and Universities of Guizhou Provincial Department of Education (Qian Jiao Ji [2022] No. 142) and the research Fund of Guizhou Minzu University GZMZZK [2022] YB15.
Additionally, gratitude is extended to Zhejiang University for providing Gaussian copyright support, which enabled the seamless completion of this manuscript.
Declaration of competing interest
The authors declare that they have no known competing financial interests or personal relationships that could have appeared to influence the work reported in this paper.
References
- QSAR analysis of coumarin-based benzamides as histone deacetylase inhibitors using CoMFA, CoMSIA and HQSAR methods. J. Mol. Struct.. 2020;1199
- [Google Scholar]
- Structural investigation of isatin-based benzenesulfonamides as carbonic anhydrase isoform IX inhibitors endowed with anticancer activity using molecular modeling approaches. J. Mol. Struct.. 2021;1229
- [Google Scholar]
- GROMACS: High performance molecular simulations through multi-level parallelism from laptops to supercomputers. SoftwareX.. 2015;1–2:19-25.
- [Google Scholar]
- Scalable Constant pH Molecular Dynamics in GROMACS. J. Chem. Theory Comput.. 2022;18:6148-6160.
- [Google Scholar]
- On function-on-function regression: partial least squares approach. Environ. Ecol. Stat.. 2020;27:95-114.
- [Google Scholar]
- Rapid development of piperidine carboxamides as potent and selective anaplastic lymphoma kinase inhibitors. J. Med. Chem.. 2012;55:1698-1705.
- [Google Scholar]
- Analysis of the physicochemical properties of acaricides based on lipinski's rule of five. J. Comput. Biol.. 2020;27:1397-1406.
- [Google Scholar]
- Gaussian functions combined with kolmogorov’s theorem as applied to approximation of functions of several variables. Comput. Math. Math. Phys.. 2020;60:766-782.
- [Google Scholar]
- Third-generation EGFR and ALK inhibitors: mechanisms of resistance and management. Nat. Rev. Clin. Oncol.. 2022;19:499-514.
- [Google Scholar]
- A Lamarckian hybrid grouping genetic algorithm with repair heuristics for resource assignment in WCDMA networks. Appl. Soft Comput.. 2016;43:619-632.
- [Google Scholar]
- Elucidation of resistance mechanisms to second-generation ALK inhibitors alectinib and ceritinib in non-small cell lung cancer cells. Neoplasia. 2016;18:162-171.
- [Google Scholar]
- ADMETlab: a platform for systematic ADMET evaluation based on a comprehensively collected ADMET database. J. Cheminf.. 2018;10
- [Google Scholar]
- Mixtures of QSAR models: Learning application domains of pK predicto rs. J. Chemom.. 2020;34
- [Google Scholar]
- CMTR1-ALK: an ALK fusion in a patient with no response to ALK inhibitor crizotinib. Cancer Biol. Ther.. 2018;19:962-966.
- [Google Scholar]
- Symmetry-Adapted Restraints for Binding Free Energy Calculations. J. Chem. Theory Comput.. 2022;18:2494-2502.
- [Google Scholar]
- Solvent effects on spectroscopic, electronic, and topological analyses, Hirshfeld surface, ADME, and molecular docking studies on antiviral pyridine carboxamide derivatives. J. Mol. Liq.. 2024;396
- [Google Scholar]
- Molecular electrostatic potential and electron density of large systems in solution computed with the fragment molecular orbital method. J. Phys. Chem. A.. 2019;123:6281-6290.
- [Google Scholar]
- ADMET modeling approaches in drug discovery. Drug Discov. Today. 2019;24:1157-1165.
- [Google Scholar]
- IGF1R contributes to cell proliferation in ALK-mutated neuroblastoma with preference for activating the PI3K-AKT signaling pathway. Cancers (basel).. 2023;15
- [Google Scholar]
- In silico drug discovery of IKK-β inhibitors from 2-amino-3-cyano-4-alkyl-6-(2-hydroxyphenyl) pyridine derivatives based on QSAR, docking, molecular dynamics and drug-likeness evaluation studies. J. Biomol. Struct. Dyn.. 2020;40:886-902.
- [Google Scholar]
- The mechanisms of resistance to second- and third-generation ALK inhibitors and strategies to overcome such resistance. Expert Rev. Anticancer Ther.. 2021;21:975-988.
- [Google Scholar]
- How to improve docking accuracy of autodock4.2: a case study using different electrostatic potentials. J. Chem. Inf. Model.. 2013;53:188-200.
- [Google Scholar]
- Activity of ALK inhibitors in renal cancer with ALK alterations: a systematic review. Int. J. Mol. Sci.. 2022;23
- [Google Scholar]
- Free energy landscape of H2A–H2B displacement from nucleosome. J. Mol. Biol.. 2022;434:167707
- [Google Scholar]
- Discovery of a potent dual ALK and EGFR T790M inhibitor. Eur. J. Med. Chem.. 2017;136:497-510.
- [Google Scholar]
- Molecular dynamics simulation studies on influenza A virus H5N1 complexed with sialic acid and fluorinated sialic acid. J. Biomol. Struct. Dyn.. 2019;37:4813-4824.
- [Google Scholar]
- Molecular dynamics simulations of cellulase homologs in aqueous 1-ethyl-3-methylimidazolium chloride. J. Biomol. Struct. Dyn.. 2016;35:1990-2002.
- [Google Scholar]
- SPICA Force Field for Proteins and Peptides. J. Chem. Theory Comput.. 2022;18:3204-3217.
- [Google Scholar]
- QSAR modeling of datasets with enantioselective compounds using chirality sensitive molecular descriptors. SAR QSAR Environ. Res.. 2005;16:93-102.
- [Google Scholar]
- ReverseDock: a web server for blind docking of a single ligand to multiple protein targets using AutoDock Vina. Front. Mol. Biosci.. 2023;10
- [Google Scholar]
- Python-based algorithm for estimating the parameters of physical property models for substances not available in database. ACS Omega. 2024;9:11895-11909.
- [Google Scholar]
- Application of QSAR models for acute toxicity of tetrazole compounds administrated orally and intraperitoneally in rat and mouse. Toxicology. 2023;500:153679
- [Google Scholar]
- Design and Synthesis of Simplified Polyketide Analogs: New Modalities beyond the Rule of 5. ChemMedChem. 2021;16:2068-2074.
- [Google Scholar]
- Gilteritinib overcomes lorlatinib resistance in ALK-rearranged cancer. Nat. Commun.. 2021;12:1261.
- [Google Scholar]
- Integrated planning and scheduling of engineer-to-order projects using a lamarckian layered genetic algorithm. Int. J. Prod. Econ.. 2024;267
- [Google Scholar]
- Conformational selectivity of ITK inhibitors: insights from molecular dynamics simulations. J. Chem. Inf. Model.. 2023;63:7860-7872.
- [Google Scholar]
- Discovery and biological evaluation of N-methyl-pyrrolo[2,3-b]pyridine-5-carboxamide derivatives as JAK1-selective inhibitors. J. Med. Chem.. 2021;64:958-979.
- [Google Scholar]
- Conformational energies of biomolecules in solution: extending the MPCONF196 benchmark with explicit water molecules. J. Comput. Chem.. 2024;45:419-429.
- [Google Scholar]
- Geometric graph learning with extended atom-types features for protein-ligand binding affinity prediction. Comput. Biol. Med.. 2023;164
- [Google Scholar]
- ALK inhibitors, resistance development, clinical trials. Curr. Oncol.. 2018;25:S59-S67.
- [Google Scholar]
- High predictive QSAR models for predicting the SARS coronavirus main protease inhibition activity of ketone-based covalent inhibitors. J. Iran. Chem. Soc.. 2021;19:1865-1876.
- [Google Scholar]
- Improving the Performance of MM/PBSA in Protein-Protein Interactions via the Screening Electrostatic Energy. J. Chem. Inf. Model.. 2021;61:2454-2462.
- [Google Scholar]
- DynaSim: a MATLAB toolbox for neural modeling and simulation. Front. Neuroinf.. 2018;12:10.
- [Google Scholar]
- Conformational energies of reference organic molecules: benchmarking of common efficient computational methods against coupled cluster theory. J. Comput. Aided Mol. Des.. 2023;37:607-656.
- [Google Scholar]
- Molecular mechanism of Yi-Qi-Yang-Yin-Ye against obesity in rats using network pharmacology, molecular docking, and molecular dynamics simulations. Arab. J. Chem.. 2024;17
- [Google Scholar]
- A model of atomic compressibility and its application in QSAR domain for toxicological property prediction. J. Mol. Model.. 2019;25:303.
- [Google Scholar]
- 6-amide-2-aryl benzoxazole/benzimidazole derivatives as VEFGR-2 inhibitors in two-and three-dimensional QSAR studies: topomer CoMFA and HQSAR. Chem. Pap.. 2021;75:3551-3562.
- [Google Scholar]
- A computational approach for designing novel SARS-CoV-2 Mpro inhibitors: combined QSAR, molecular docking, and molecular dynamics simulation techniques. New J. Chem.. 2021;45:11512-11529.
- [Google Scholar]
- Discovery of novel BRD4-BD2 inhibitors via in silico approaches: QSAR techniques, molecular docking, and molecular dynamics simulations. Mol. Divers. 2023
- [Google Scholar]
- Immunoassays for the quantification of ALK and phosphorylated ALK support the evaluation of on-target ALK inhibitors in neuroblastoma. Mol. Oncol.. 2017;11:996-1006.
- [Google Scholar]
- Targeting anaplastic lymphoma kinase (ALK) in rhabdomyosarcoma (RMS) with the second-generation ALK inhibitor ceritinib. Target. Oncol.. 2017;12:815-826.
- [Google Scholar]
- Binding insight of anti-HIV phytocompounds with prime targets of HIV: a molecular dynamics simulation analysis. Curr. HIV Res.. 2020;18:132-141.
- [Google Scholar]
- Using metadynamics to reveal extractant conformational free energy landscapes. J. Phys. Chem. B.. 2024;128:263-272.
- [Google Scholar]
- Exploring the mechanism of Suanzaoren decoction in treatment of insomnia based on network pharmacology and molecular docking. Front. Pharmacol.. 2023;14
- [Google Scholar]
- Computational screening of potential bromodomain-containing protein 2 inhibitors for blocking SARS-CoV-2 infection through pharmacophore modeling, molecular docking and molecular dynamics simulation. Arab. J. Chem.. 2024;17
- [Google Scholar]
- Structural insights on Hyp-Gly-containing peptides as antiplatelet compounds through Topomer CoMFA and CoMSIA analysis. Foods.. 2023;12
- [Google Scholar]
- A novel parallel merge neural network with streams of spiking neural network and artificial neural network. Inf. Sci.. 2023;642
- [Google Scholar]
- CHAPERONg: A tool for automated GROMACS-based molecular dynamics simulations and trajectory analyses. Comput. Struct. Biotechnol. J.. 2023;21:4849-4858.
- [Google Scholar]
- Discovery of new nicotinamides as apoptotic VEGFR-2 inhibitors: virtual screening, synthesis, anti-proliferative, immunomodulatory, ADMET, toxicity, and molecular dynamic simulation studies. J. Enzyme Inhib. Med. Chem.. 2022;37:1389-1403.
- [Google Scholar]
- 3D-QSAR study of the phenylsulfamic acid derivatives as HPTPβ inhibitors. J. Mol. Struct.. 2019;1186:11-22.
- [Google Scholar]
- Protein–ligand interaction-guided discovery of novel VEGFR-2 inhibitors. J. Biomol. Struct. Dyn.. 2019;38:2559-2574.
- [Google Scholar]
- Molecular electrostatic potential and volume-aided drug design based on the isoindolinone-containing cyclopeptide S-PK6. New J. Chem.. 2023;47:9806-9818.
- [Google Scholar]
- Binding Thermodynamics of Fourth-Generation EGFR Inhibitors Revealed by Absolute Binding Free Energy Calculations. J. Chem. Inf. Model.. 2023;63:7837-7846.
- [Google Scholar]
Appendix A
Supplementary material
Supplementary data to this article can be found online at https://doi.org/10.1016/j.arabjc.2024.105863.
Appendix A
Supplementary material
The following are the Supplementary data to this article:Supplementary Data 1
Supplementary Data 1


