

Translate this page into:
Design of new α-glucosidase inhibitors through a combination of 3D-QSAR, ADMET screening, molecular docking, molecular dynamics simulations and quantum studies
⁎Corresponding authors. a.khaldan@edu.umi.ac.ma (Ayoub Khaldan), a.sbai@umi.ac.ma (Abdelouahid Sbai)
-
Received: ,
Accepted: ,
This article was originally published by Elsevier and was migrated to Scientific Scholar after the change of Publisher.
Abstract
Diabetes mellitus is a chronic and non-infectious metabolic disorder caused by insufficient insulin secretion. This study investigated a set of thirty-one 4-amino-1,2,4-triazole derivatives, experimentally evaluated for their α-glucosidase activity against diabetes mellitus, using the three-dimensional quantitative structure–activity relationship (3D-QSAR) approach. The recommended CoMFA and CoMSIA/EHA models showed good predictive ability, manifested by high R2 values and important Q2 values. The molecular structural features offered by the CoMFA and CoMSIA/EHA contour maps had a significant impact on the determination of appropriate groups to enhance activity. Hence, four new 4-amino-1,2,4-triazole inhibitors were proposed and designed with good predicted α-glucosidase activity. The pharmacological and ADME-Tox properties of the four recommended molecules were predicted and examined. Molecular docking studied the interaction modes between the targeted receptor and 4-amino-1,2,4-triazole derivatives; it showed good stability for the new title molecule M1. Furthermore, molecular dynamics simulation at 100 ns and MM/PBSA approach results demonstrated an acceptable stability and the interactive force of the compound M1. Finally, the most nucleophilic and electrophilic centers of the compounds C25 and M1 were determined using quantum analysis. The current work encourages further experimental and scientific research on M1 molecule as a potent α-glucosidase inhibitor.
Keywords
3D-QSAR, ADMET
α-glucosidase
Diabetes
Molecular docking
Molecular dynamic simulation

1 Introduction
Diabetes mellitus (DM) is a chronic metabolic syndrome disease caused by a pancreatic malfunction leading to insulin secretion interruption or poor insulin production (Costa and Coutinho, 2018; Kerner and Brückel, 2014; Taha et al., 2015; Taha et al., 2019a). There are two forms of DM, type 1 and type 2, however type 2 is 90 % more prevalent (Harreiter and Roden, 2019; Cunha et al., 2015; DIAMOND Project Group, 2006; Gothai et al., 2016). Previous research indicated that this disease is caused by weakening pancreatic function, where the proper insulin amount decreases to the blood glucose level. Hence, the strategy to control this disease is to control postprandial hyperglycemia (American Diabetes Association, 2019). One of the most important strategies is to inhibit α-glucosidase enzyme since previous research revealed that α-glucosidase enzyme is a potential method for managing type 2 DM (T2DM) (Iqbal et al., 2017; Taha et al., 2019a,b). The inhibition of α-glucosidase enzyme causes a lag in carbohydrate breakdown and monosaccharide absorption, leading to lowered postprandial plasma glucose levels and hyperglycemia (American Diabetes Association, 2019; Iqbal et al., 2017; Taha et al., 2019a,b; Joshi et al., 2015). Several α-glucosidase inhibitors, including acarbose, voglibose, and miglitol, have been used clinically to treat T2DM (Fig. 1) (Khaldan et al., 2022a-d). Acarbose is a frequently used α-glucosidase inhibitor prescribed to treat T2DM and prediabetes in certain regions (Nyambe-Silavwe et al., 2015; Zhang et al., 2017). Acarbose works by slowing down the digestion of dietary carbohydrates and subsequent glucose absorption, leading to a reduced and more controlled rise in blood sugar levels after meals (Dong et al., 2022). Nevertheless, clinical studies have indicated that acarbose often has adverse effects, such as flatulence, diarrhea, abdominal bloating, and nausea (Taha et al., 2019a,b). Voglibose is another α-glucosidase inhibitor, similar to acarbose, and it is used to manage T2DM. Like acarbose, voglibose works by inhibiting the action of α-glucosidase enzymes in the small intestine, which slows the digestion and absorption of carbohydrates (Durga Priyadharshini et al., 2022). It helps to reduce post-meal blood sugar spikes in individuals with T2DM. Common side effects of voglibose are similar to those of acarbose and may include gastrointestinal symptoms such as flatulence, diarrhea, and abdominal discomfort. These side effects are usually dose-dependent and tend to improve with time (Nowrouzi-Sohrabi et al., 2020). Miglitol is an oral medication used in the management of T2DM. Like acarbose and voglibose, miglitol has the exact mechanism of action and the same side effects. Faced with these side effects of α-glucosidase inhibitors, searching for new drugs with significant α-glucosidase activity and few undesirable complications is a challenge that is not yet complete (Hollander, 1999; Campbell et al., 2000; Nathan et al., 2006).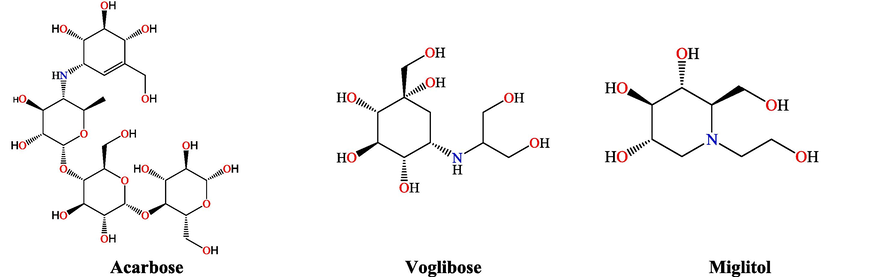
Chemical structure of acarbose, voglibose, and miglitol α-glucosidase inhibitors.
This study investigates the potential of triazole compounds as α-glucosidase inhibitors by using computational methods. Triazole is a five-member ring of N-heterocyclics with a great interest in drug discovery and design. Triazole is an organic compound with two isomeric forms: 1,2,3-triazole and 1,2,4-triazole, each with a five-membered ring consisting of three nitrogen atoms and two carbon atoms (Fig. 2). The 1,2,4-triazoles are molded by a specific arrangement of the two carbon atoms and the three nitrogen atoms, which gives unique features such low interactions, basicity, and various coordination modes (Sumangala et al., 2013; Ram et al., 2019). The 1,2,4-triazole compounds have a wide range of pharmacological properties, including antitubercular (Li et al., 2012; Xu et al., 2017), anticancer (Pragathi et al., 2021; Grytsai et al., 2020), and antimalarial (Thakkar et al., 2017; Fan et al., 2018) activities, which may be due to their ability to exercise a variety of non-covalent interactions that increase solubility and the capacity to bind to bimolecular targets.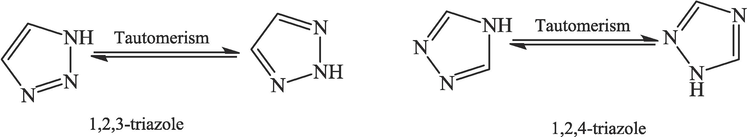
1,2,3-triazole and 1,2,4-triazole molecules chemical structure.
Computational chemistry has a crucial impact on the process of developing new drugs; where three-dimensional quantitative structure–activity relationship (3D-QSAR) method has become available and extensively used to forecast the activity of the molecules, especially for drug design targets (Balupuri et al., 2020). It uses various statistical techniques to establish an association between the chemical structural characteristics of substances and their biological activities (Khaldan et al., 2021a-d; Li et al., 2022; Khaldan et al., 2022a-d). That makes it beneficial in developing new therapeutics since they help the costs and time reduction required to produce medicinally active substances (Wang et al., 2022; Jawarkar et al., 2022; Khaldan et al., 2021). Other computational approaches are molecular docking and molecular dynamics (MD) simulations that are executed to determine the specific binding conformation and critical amino acid residues engaged in the binding process.
The current research aims to propose effective α-glucosidase inhibitors using computational drug design methods. First, a 3D-QSAR study was conducted to investigate the relationship between thirty-one 4-amino-1,2,4-triazole molecules and α-glucosidase activity and thus propose reliable 3D-QSAR models. Second, the contour maps created by the established models were examined and analyzed to propose new 4-amino-1,2,4-triazole inhibitors with good predicted activity. Third, the ADMET (absorption, distribution, metabolism, excretion, and toxicity) properties of the title molecules were determined and compared to the more active molecule in the dataset (compound C25). Then, molecular docking was conducted to predict and study the binding mode between 4-amino-1,2,4-triazole ligands and α-glucosidase protein. Fifth, MD simulation at 100 ns was applied to test the stability of the binding mode. Finally, the most electrophilic and nucleophilic sites of 4-amino-1,2,4-triazole molecules were identified by a quantum analysis.
2 Material and methods
2.1 Selection of dataset
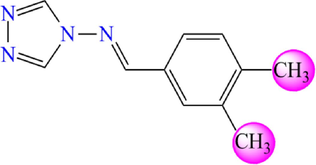
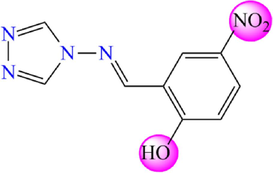
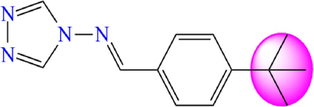
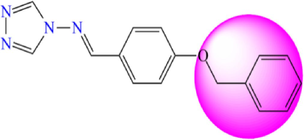
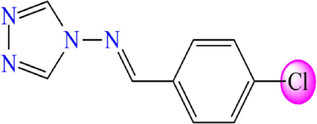
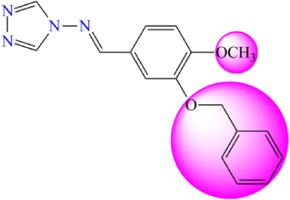
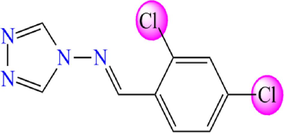
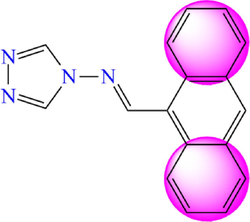
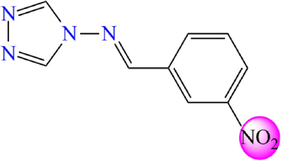
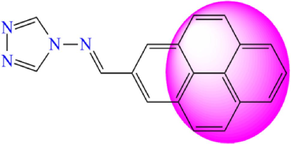
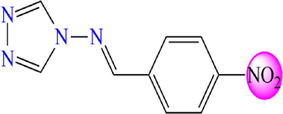
Based on previous research, thirty-one molecules of 4-amino-1,2,4-triazole have a potent and selective α-glucosidase inhibitory activity selected to investigate the bioactivity against DM diseases by theoretical methods (Yeye et al., 2020). The target derivatives were subjected to a 3D-QSAR analysis. They were divided into two groups: twenty-five molecules were randomly selected with their activity as a training set to create a quantitative model. At the same time, six molecules were retained as a test set to check the efficiency of the recommended models. The chemical structures of the selected molecules and their corresponding pIC50 values (pIC50 = − log IC50), where IC50 shows how much medication is needed to inhibit a biological process by half, are shown in Fig. 3 and Table 1.
4-amino-1,2,4-triazole analogues structure (1–31).
N°
Structure
pIC50
N°
Structure
pIC50
1a
5.582
17
5.198
2
5.264
18
5.276
3
5.264
19
5.485
4
5.270
20

5.599
5
5.241
21a
5.625
6
5.369
22a
5.258
7
5.368
23a
5.461
8

5.263
24a
5.633
9
5.271
25a
5.644
10

5.262
26
5.360
11
5.370
27
5.636
12
5.196
28
5.264
13
5.369
29
5.184
14
5.604
30
5.267
15
5.270
31
5.201
16
5.607
aTest set compounds
2.2 Geometry minimization and molecular alignment
This paper carefully sketched the derivatives of 31 4-amino-1,2,4-triazole molecules by using SYBYL-X 2.0 package. Next, they have been optimized by utilizing the Tripos force field (Clark et al., 1989) with gradient convergence criteria of 0.01 kcal/mol (Purcell and Singer, 1967). The Gasteiger-Hückel atomic partial charges were calculated and added to the 31 targeted molecules using Powell's approach (Tsai et al., 2010). Molecular alignment is a pivotal step employed to implement the 3D-QSAR models. It was done using a common core and compound C25, the database's more active molecule, as a reference structure. The ALIGN DATABASE algorithms (Bouamrane et al., 2022a) reachable in SYBYL-X 2.0 package was used for the alignment of the 31 molecules under study.
2.3 CoMFA and CoMSIA studies
The CoMFA and CoMSIA approaches were conducted primarily to create a 3D QSAR model that might be employed to estimate the α-glucosidase activity of new proposed inhibitors. Both techniques are built on the concept of fields surrounding aligned molecules (Khaldan et al., 2022a-d). First, the CoMFA method focuses on calculating steric (S) and electrostatic (E) energies by using a carbon atom hybridized sp3 and a net charge of + 1.0, with an energy cutoff computation default value of 30 kcal/mol (Cramer et al., 1988). Second, the CoMSIA technique was performed to complement the CoMFA technique by calculating more physicochemical fields as hydrophobic (H), hydrogen bond donor (D), and acceptor (A), as well as electrostatic and steric fields (Klebe el al., 1994) and keeping the same parameters as those used in CoMFA. During the computation of CoMFA and CoMSIA techniques, the column filtering was fixed at 2.0 kcal/mol, and the correction factor was set at 0.3, the default value (Ståhle and Wold, 1988).
2.4 3D-QSAR models production
The 3D-QSAR models were set up using Partial Least Squares (PLS) (Wold, 1991) technique. Numerous statistical parameters that characterize the models were identified using leave-one-out (LOO) cross-validation and non-cross-validation techniques available in PLS approach. The LOO cross-validation technique was conducted to yield the cross-validation correlation (Q2) and the optimal number of components (N) parameters. On the other hand, the non-cross-validation technique was done to produce the correlation coefficient (R2), F-test value (F), standard error of estimate (SEE), as well as the five fields. The values of Q2 (>0.5) and R2 (>0.6), as well as the lower value of SEE, helped to identify the optimal CoMFA and CoMSIA models. Moreover, the external validation of selected models was executed to assess their proficiency and predictive power using six 4-amino-1,2,4-triazole molecules as a test set (Bouamrane et al., 2022b; Khaldan et al., 2021a-d; Bhatia et al., 2017).
2.5 Validation of 3D-QSAR models
One of the main purposes of using a 3D-QSAR model is to forecast the α-glucosidase activity of non-synthetic molecules evaluated by their robustness and predictive ability. For this reason, the recommended models have been submitted to additional validation. Six compounds have been employed in the external validation approach as test set molecules. Similarly to the training set, these molecules were sketched and optimized by the same method. The α-glucosidase activity of the six studied molecules used in the validation process was calculated using the recommended models. The prediction capacity of the elaborated models was investigated by determining the external validation coefficient (r2pred) that computed using the equation (1) (Golbraikh and Tropsha, 2002):
Where PRESS is the quadratic difference between the actual and estimated activity values of the compounds in the test set, and SD is the total of the squared deviations between the activity values in the test set and the mean activity values of the training set. Furthermore, Golbraikh and Tropsha (Golbraikh and Tropsha, 2002) calculated additional statistical parameters such as coefficients
and
, slope k and k' to ensure the strength of the established models using the equations (2), (3), (4) and (5), respectively:
Where and are squared correlation coefficient values of estimated vs actual, and actual versus estimated activity for the test set compounds at zero intercept, respectively.
k and k' are the slopes of the estimated against observed and observed vs estimated activity plots at zero intercepts for the test set, respectively.
A study by Roy (Roy, 2007) has recently demonstrated that it is necessary to compute the parameters
and
, which are the difference between
is and
values, and
and
values, respectively. The model satisfied Roy's criteria can be considered as a robust model and might be applied to estimate the activity of the new suggested inhibitors. The parameters
and
are calculated by applying equations (6) and (7), respectively:
2.6 Y-randomization test
The Y-randomization test (Rücker et al., 2007) is another validation approach used to evaluate the capabilities of the recommended models and to obviate the problem of overfitting in the training set. Indeed, the approach randomly permuted the pIC50 values in the training set. Thus, a new model was elaborated after each permutation. After the Y-randomization test, the smaller Q2 and R2 values show the power of the original models, while the higher values show the fragility of the models.
2.7 Design of novel 4-amino-1,2,4-triazole inhibitors and prediction of their α-glucosidase activity
3D-QSAR contours created by the recommended models were studied to determine the regions of the molecule responsible for bioactivity as α-glucosidase inhibitors. Thus, the original molecule can be fully or partially modified to obtain a better activity. This process was done by applying the SYBYL-X 2.0 software. Then, the new molecules were subjected to the same methodology in executing the 31 proposed molecules, such as sketching, minimization and alignment. Finally, α-glucosidase activity of the new targeted inhibitors was predicted using the recommended 3D-QSAR models.
2.8 In silico pharmacokinetics ADME/Tox and drug likeness prediction
The proposed 4-amino-1,2,4-triazole molecules were subjected to further in-depth study using ADME-Tox analysis and drug-likeness prediction, to assess the bioavailability and drug potency. Several pharmacokinetics parameters such as absorption, skin permeation, blood–brain barrier penetration, cytochromes P450 (CYP), toxicity, and synthetic accessibility, as well as a drug-likeness prediction as Lipinski, Veber, and Ghose rules were determined using SwissADME (Daina et al., 2017) and pkCSM (Pires et al., 2015) online servers.
2.9 Molecular docking simulation
Molecular docking methodology is conducted to obtain a greater comprehension of the binding modes and make educated guesses about how a ligand and receptor interact (Shi et al., 2022; Piekus ́-Słomka et al., 2022; Khaldan et al., 2020). In this investigation, molecular docking was carried out by means of two programs; Autodock Vina (Trott and Olson, 2010) and Autodock tools 1.5.6 (Hunter et al., 2001). The crystal structure of isomaltase from Saccharomyces cerevisiae was downloaded from the protein data bank (PDB ID: 3a4a) (Khaldan et al., 2022a; Rahim et al., 2015) with a resolution of 1.60 Å. Using the software Discovery Studio 2016 (Dassault Systèmes BIOVIA, 2016), the retrieved receptor was created by eliminating all of the molecules of water and introducing the polar hydrogen atoms. The active site has been identified, and its coordinates are as follows: x = 21.595, y = -7.436 and z = 24.042. Within the 3a4a receptor's pocket, a grid box with the coordinates x = 30, y = 30, and z = 30 was made, with a 1 Å space between grid points. An extended PDB format, named PDBQT, is applied to coordinate files that include atom types and atomic partial charges using the Autodock 1.5.6 tools. The non-bonded rotation and flexible ligands are assigned using torsion angles. The DFT approach was used to optimize the C25 and M1 derivatives, which are the subject of a molecular docking study, with the B3LYP/6–311++G (d,p) level and employing the Gaussian G09 software (Frisch, 2009). Then, they are docked in the active site of the targeted receptor. Finally, the derived findings were evaluated using the tools PyMol (DeLano, 2002) and Discovery Studio 2016 (Dassault Systèmes BIOVIA, 2016).
2.10 Molecular dynamics (MD) simulations
In this approach, the web-based CHARMM-GUI was executed to build the system (Jo et al., 2008; Brooks et al., 2009; Lee et al., 2016) interface with the CHARMM36 force field (Best et al., 2012). The NAMD 2.13 (Phillips et al., 2005) package was executed to achieve all MD simulations. The periodic boundary and the TIP3P explicit solvation model were used (Jorgensen et al., 1983). It was built on the basis of web-based technology. With a dimension of the dimensions, conditions were fixed at 118.76 Å, 147.65 Å, and 133.50 Å in x, y, and z, respectively. The CHARMM general force field was executed to generate the parameters for the best docking findings (Yu et al., 2012). Then, the system used was neutralized with 9Na+ ions. The minimization, equilibration, and production strategies were part of the molecular dynamic strategies. The present MD simulations were run with an integration time step of 2 fs. The isothermal-isobaric (NPT) ensemble was employed for the generation, whereas the canonical (NVT) ensemble was applied for the equilibration. Throughout the entirety of the MD simulation's 100 ns, the Nose'-Hoover Langevin piston barostat (Nosé and Klein, 1983; Nosé, 1984) was applied to set the pressure to 1 atm, with a period of 0.1 ps and a Langevin piston decay of 0.05 ps. The Langevin thermostat (Grest and Kremer, 1986) set temperature at 298.15 K. With pair list misbehaviors 16 and a distance cutoff of 12.0, nonbonded interactions across short distances were smoothly truncated, while Lennard Jones interactions were easily shortened at 8.0. The particle-mesh Ewald (PME) approach (Darden et al., 1993; Essmann et al., 1995) was utilized to address long-range electrostatic interactions. Grid spacing of 1.0 was applied to arrange all simulation cells. The SHAKE technique was implemented to limit all covalent bonds that contained hydrogen atoms (Ryckaert et al., 1977). Lastly, the same process was adopted for all MD simulations to maintain uniformity.
2.11 Binding energy computations
The relative binding energy computations were executed using the one-average molecular mechanics generalized Born surface area (MM/GBSA) (Genheden et al., 2012; Wang et al., 2019) technique implemented in the MOLAICAL code (Bai et al., 2021), where the ligand (L) links to the receptor (R) to create the complex (RL) according to the equation (8):
This can be expressed by several interactions' contributions,
Where the following gas-phase molecular mechanics changes , solvation Gibbs energy , and conformational entropy are calculated according to the equation (9): is the total alteration of the electrostatic energies , the internal energies (bonded interactions), and the van der Waals energies ; is the combined of both the polar solvation (determined by the generalized Born model) and the nonpolar solvation (determined by the solvent-accessible surface area) and is derived by the standard mode investigation, however, since we are only concerned with relative binding energies, this part was left out to reduce the computational cost. During the MM/GBSA computations, the surface tension constant of 0.03012 kJ mol-1Å2 was used.
2.12 Global indices of the 4-amino-1,2,4-triazole molecules using DFT approach
The minimum-energy geometries of the investigated compounds were achieved using the Density Functional Theory (DFT) technique and the Gaussian G09 package (Frisch, 2009) by using B3LYP/6–311++G (d,p) basis set. The chemical potential (μ), chemical softness (S), global electrophilicity (ω), chemical hardness (η), and global nucleophilicity (N), called global reactivity indices, were calculated for the new reported inhibitors. They were used to figure out the most nucleophilic and electrophilic inhibitors for the compounds under study. Practically, μ index was derived according to the frontier molecular orbital LUMO and HOMO by using the equation (9). The chemical softness (S) and chemical hardness (η) were computed using the expressions (10) and (11) (Pearson and Songstad, 1967), respectively. The global electrophilicity (ω) (Parr et al., 1999) and global nucleophilicity (N) (Domingo et al., 2008) were determined by means the equations (12) and (13), respectively.
Since it has a lower HOMO energy value, tetracyanoethylene (TCE) was chosen as a computation reference(Domingo et al., 2008; Domingo and Pérez, 2011).
2.13 Conceptual density Functional (CDFT) approach
Conceptual Density Functional Theory (CDFT) and backing of the DFT are frequently used to investigate compounds' local reactivity (Berk et al., 2022). The Parr functions P(r) which contain the nucleophilic
and electrophilic
are valuable tools for determining local reactivity of organic compounds. They were calculated using the equations (14) and (15), respectively:
Where is the radical cation's atomic spin density (ASD) at the r atom of a particular chemical, and is the radical anion's ASD at the r atom.
The local nucleophilic and electrophilic Parr functions for the neutral compound are provided by each ASD collected at different atoms of the radical anion and radical cation, respectively.
The local electrophilicity
and local nucleophilicity
indices were recalculated using the equations (16) and (17), respectively, based on the notions of
and
Parr functions:
Where the N and were obtained by the equations (4) and (5), respectively.
3 Results and discussion
3.1 Molecular alignment
Thirty-one of the 4-amino-1,2,4-triazole inhibitors were aligned using a common core, where compound 25 is the most active in databases. The superposed structures are presented in Fig. 4.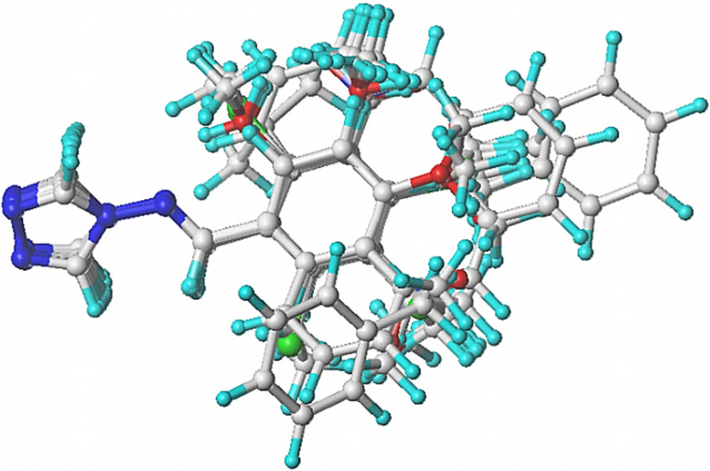
Overlay and alignment of thirty-one of the proposed 4-amino-1,2,4-triazoles.
3.2 3D-QSAR models results
A value of cross-validated Q2 ˃ 0.50 hinted at the acceptable internal predictive capability as well as the strength of the model (Ouabane et al., 2023; Khaldan et al., 2021), but it is not absolute proof. The best method for evaluating a model's predictive ability is to assess it using test set molecules, which is namely external validation and characterized by r2pred which must be ˃ 0.60 (Golbraikh and Tropsha, 2002).
Combinations between steric and electrostatic fields resulted in a CoMFA model. In contrast, the combinations between five fields, electrostatic (E), steric (S), H-bond donor (D), H-bond acceptor (A), and hydrophobic (H), led to the construction of 31 CoMSIA models, as presented in supplementary Fig. 5. The PLS statistical indicators of the CoMFA and CoMSIA models are listed in Table 2. Regarding the CoMFA model, Table 2 indicates that this model has an essential Q2 value of 0.504, a significant R2 value of 0.911, F value of 51.248, four optimum numbers of components, and a standard error of estimate (SEE) value of 0.046. The CoMFA model's steric and electrostatic contributions were 0.558 and 0.442, respectively, showing that the steric contribution is more significant than the electrostatic one. The external capacity of the CoMFA model was verified by an external validation characterized by the
parameter. Its value was 0.710, i.e. higher than 0.6, which proves the high sturdiness of the CoMFA model. In the case of the CoMSIA model, many models were developed by combining five fields. The highest values of Q2, R2,
, and the smallest value of SEE were considered for choosing the optimal CoMSIA model. The results in Table 2 show that the CoMSIA model with the electrostatic (E), Hydrophobic (H), and H-bond acceptor (A) fields is the best. So, the CoMSIA/EHA model present a correlation coefficient R2 value of 0.938, cross-validated coefficient Q2 value of 0.66, SEE value of 0.038, and F value of 75.805 in addition to four optimum number of components. Additionally, the CoMSIA/EHA model has been externally validated; the
value was 0.781; indicating the high strength of the CoMSIA/EHA model. Furthermore, the electrostatic, hydrophobic, and H-bond acceptor contributions of the CoMSIA/EHA model were 0.330, 0.349, and 0.320, respectively, demonstrating that all three fields will have the same impact on the model. The observed α-glucosidase activity of the 31 4-amino-1,2,4-triazole molecules and their calculated pIC50 using the advised models are clarified in Table 3. The residual between the two activities is less than 1, indicating a strong correlation between them (Table 3 and Fig. 6). Q2: Non-cross-validated correlation coefficient, R2: Cross-validated correlation coefficient, SEE: Standard error of the estimate, F: F-test value, N: Optimum number of components,
: External validation correlation coefficient.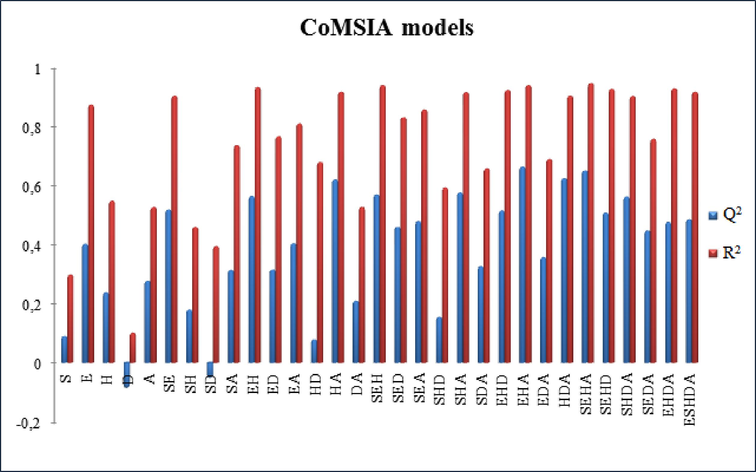
Q2 and R2 values of the 31 potential combinations fields of CoMSIA model (S: steric, E: electrostatic, H: hydrophobic, D: H-bond donor, A: H-bond acceptor).
Model
Q2
R2
SEE
F
N
Fractions
Ster
Elec
Hyd
Acc
Don
CoMFA
0.504
0.911
0.046
51.248
4
0.710
0.558
0.442
–
–
CoMSIA/SE
0.517
0.902
0.048
46.202
4
0.763
0.229
0.771
–
–
–
CoMSIA/EH
0.563
0.931
0.040
67.873
4
0.838
–
0.594
0.406
–
–
CoMSIA/HA
0.619
0.915
0.045
53.640
4
0.757
–
–
0.487
0.513
–
CoMSIA/SEH
0.568
0.938
0.038
75.329
4
0.824
0.137
0.545
0.318
–
–
CoMSIA/SHA
0.575
0.914
0.045
53.114
4
0.755
0.115
–
0.388
0.497
–
CoMSIA/EHD
0.514
0.921
0.043
58.091
4
0.678
–
0.440
0.349
–
0.212
CoMSIA/EHA
0.663
0.938
0.038
75.805
4
0.781
–
0.330
0.349
0.320
–
CoMSIA/HDA
0.623
0.902
0.048
45.936
4
0.711
–
–
0.442
0.356
0.202
CoMSIA/SEHA
0.649
0.944
0.036
83.576
4
0.777
0.093
0.309
0.292
0.307
–
CoMSIA/SEHD
0.507
0.925
0.042
61.875
0.684
0.107
0.413
0.285
–
0.195
CoMSIA/SHDA
0.561
0.901
0.048
45.639
4
0.523
0.117
–
0.348
0.331
0.204
No
pIC50(obs)
CoMFA
CoMSIA/EHA
pIC50(pred)
Residuals
pIC50(pred)
Residuals
1 a
5.582
5.635
−0.053
5.635
−0.053
2
5.264
5.263
0.001
5.270
−0.006
3
5.264
5.239
0.025
5.276
−0.012
4
5.270
5.292
−0.022
5.293
−0.023
5
5.241
5.261
−0.020
5.194
0.047
6
5.369
5.386
−0.017
5.300
0.069
7
5.368
5.360
0.008
5.377
−0.009
8
5.263
5.294
−0.031
5.331
−0.068
9
5.271
5.293
−0.022
5.276
−0.005
10
5.262
5.253
0.009
5.279
−0.017
11
5.370
5.373
−0.003
5.296
0.074
12
5.196
5.202
−0.006
5.201
−0.005
13
5.369
5.429
−0.060
5.410
−0.041
14
5.604
5.530
0.074
5.564
0.040
15
5.270
5.261
0.009
5.264
0.006
16
5.607
5.635
−0.028
5.591
0.016
17
5.198
5.194
0.004
5.232
−0.034
18
5.276
5.273
0.003
5.351
−0.075
19
5.485
5.497
−0.012
5.446
0.039
20
5.599
5.601
−0.002
5.593
0.006
21a
5.625
5.62
0.005
5.664
−0.039
22 a
5.258
5.357
−0.099
5.348
−0.090
23 a
5.461
5.419
0.042
5.388
0.073
24 a
5.633
5.663
−0.030
5.605
0.028
25 a
5.644
5.511
0.133
5.564
0.080
26
5.360
5.379
−0.019
5.414
−0.054
27
5.636
5.623
0.013
5.634
0.002
28
5.264
5.273
−0.009
5.211
0.053
29
5.184
5.171
0.013
5.179
0.005
30
5.267
5.273
−0.006
5.257
0.010
31
5.201
5.220
−0.019
5.218
−0.017
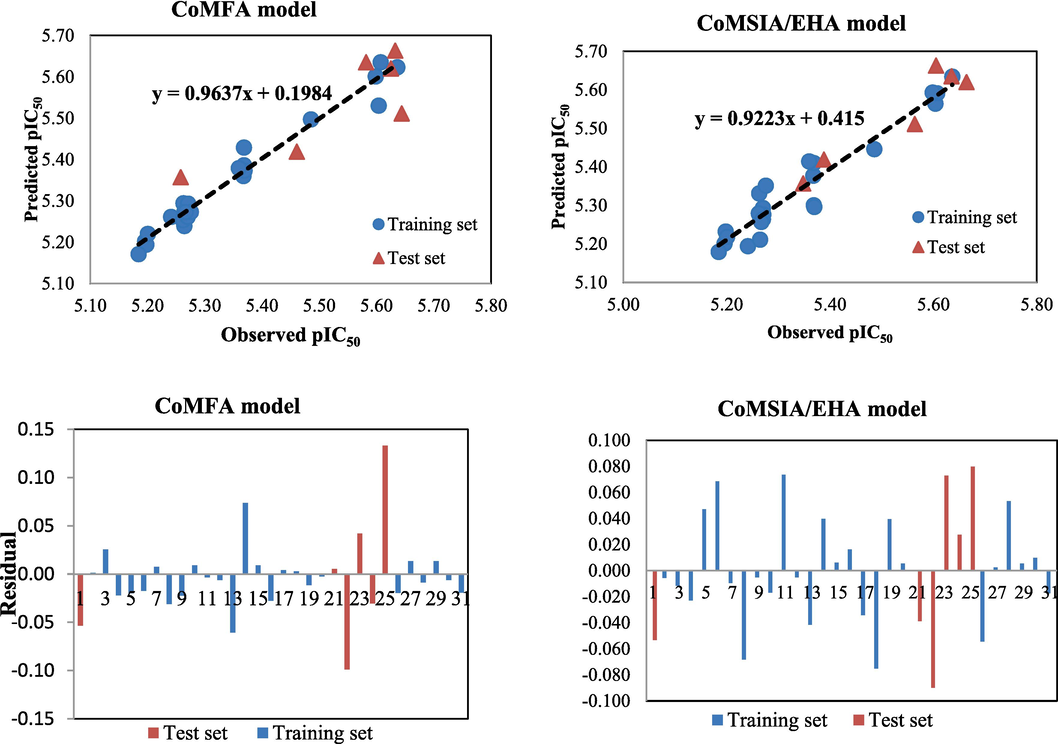
Predicted and observed pIC50 plots of the investigated molecules along with their residuals using the CoMFA and CoMSIA/ EHA models.
The graphs of the actual and calculated α-glucosidase activity values of the all molecules involved in creating the CoMFA and CoMSIA/EHA models are exhibited in Fig. 6. The training set molecules are denoted by blue circles, while red triangles represent the test set compounds. Fig. 6 shows that the solid points of the blue circles and red triangles are near to the Y = X line, advising that the observed and calculated α-glucosidase inhibitory activity of the 31 studied inhibitors exhibit a strong linear relationship.
3.3 CoMFA and CoMSIA/EHA models validation
The established CoMFA and CoMSIA/EHA models were subjected to further external validations using Golbraikh, Tropsha, and Roy criteria, as well as six compounds to evaluate the molded models' predictability and dependability power. The obtained outcomes are registered in Table 4.
Golbraikh, Tropsha,
and Roy parameterValidation Criteria
CoMFA
CoMSIA/EHA
> 0.5
0.504
0.663
> 0.5
0.945
0.950
> 0.5
0.968
0.966
pred
> 0.6
0.710
0.781
k
0.85 ≤ k ≤ 1.15
0.995
0.994
< 0.1
−0.343
−0.216
0.85 ≤ k ≤ 1.15
1.004
1.004
< 0.1
−0.362
−0.236
> 0.5
0.359
0.460
> 0.5
0.349
0.445
< 0.2
−0.009
−0.014
< 0.3
−0.014
−0.016
The Golbraikh and Tropsha test outcomes show that CoMFA and CoMSIA/EHA models had and values of 0.945, 0.950, and 0.968, 0.966, respectively (Table 4). They also have a pred value of 0.710 and 0.781, respectively. The plot slope values and of the elaborated models are in the reliable range. The gap between and values divided by is too a criterion of Golbraikh and Tropsha, and its value was found of −0.343 for CoMFA and −0.216 for CoMSIA/EHA models. The identical procedure was again repeated by changing the value to the value and the generated results were still in a reliable range (<0.1). Therefore, the Golbraikh and Tropsha results demonstrated the good quality of the recommended CoMFA and CoMSIA/EHA models. On the other side, the recommended CoMFA and CoMSIA/EHA models met some Roy criteria, and the proposed CoMSIA/EHA model remains the best (Table 4). The derived outcomes confirm the good stability and predictability of the CoMSIA/EHA model for predicting the novel α-glucosidase activity of the proposed 4-amino-1,2,4-triazole inhibitors.
3.4 Randomization approach result
The Y-randomization approach was implemented to assess the models' strength and capability to predict the α-glucosidase activity of innovative 4-amino-1,2,4-triazole compounds. Table 5 demonstrates that, after applying the Y-randomization method, the Q2 and R2 values for the CoMFA and CoMSIA/EHA models are significantly lower than the original models, proving that the advised models are trustworthy and could be approved to predict the α-glucosidase activity of new title inhibitors.
Iteration
CoMFA
CoMSIA/EHA
Q2
R2
Q2
R2
1
−0.397
0.631
−0.456
0.643
2
−0.501
0.665
−0.497
0.685
3
−0.263
0.746
−0.443
0.765
4
−0.334
0.756
−0.242
0.770
5
−0.286
0.692
−0.463
0.702
6
−0.225
0.732
−0.423
0.756
7
−0.365
0.789
−0.416
0.817
8
−0.428
0.804
−0.156
0.823
9
0.106
0.835
0.119
0.845
10
0.332
0.826
−0.298
0.839
Original
0.504
0.911
0.663
0.938
3.5 3D-QSAR contour maps
CoMFA and CoMSIA/EHA contour plots were created to describe and identify the impact of electrostatic, steric, hydrophobic, acceptor and donor hydrogen bonds on α-glucosidase activity of the investigated compounds. Therefore, identify the activity's preferable and unfavorable substitutes. The obtained outcomes are displayed in Figs. 7 and 8.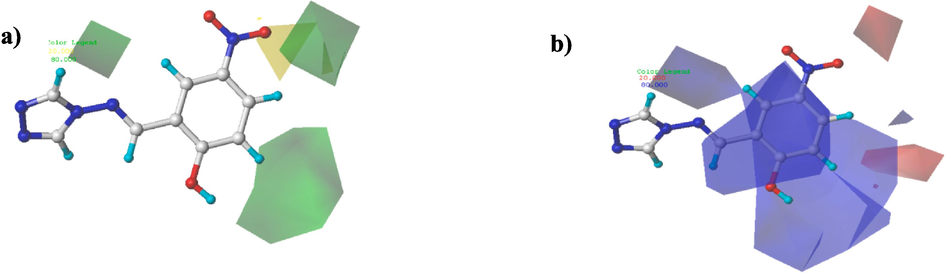
Contour maps results of the CoMFA elaborated model. Steric (a), Electrostatic (b).
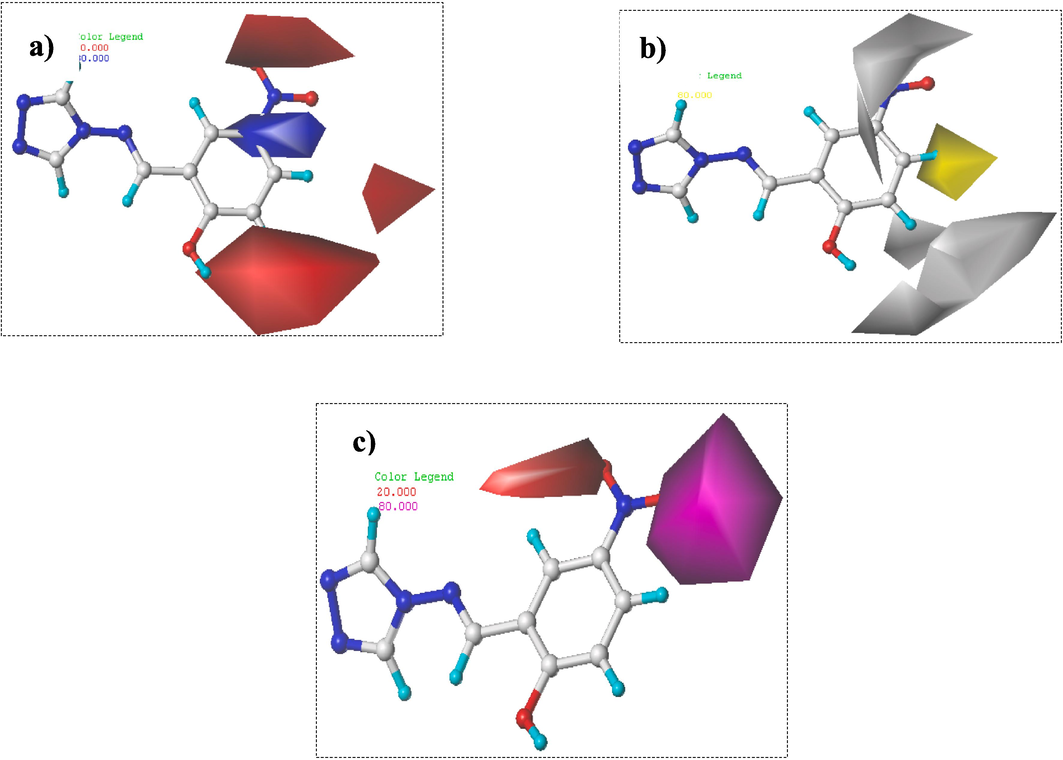
Contour maps results of CoMSIA/EHA model. Electrostatic (a), Hydrophobic (b), and H-bond acceptor (c).
3.6 CoMFA contour maps results
In CoMFA steric contour plots (Fig. 7a), the green outlines were found around phenyl’s meta and para positions and near the 1,2,4-triazole moiety, suggesting the bulky groups were favored in these regions. Both structures of molecule C10 (pIC50 = 5.260) and molecule C26 (pIC50 = 5.360) have bulky substituents at meta position of the phenyl moiety. On the other side, the smaller yellow contour around the oxygen atom of nitrogen dioxide moiety hints that tiny moieties enable amelioration of the activity of the molecules.
Regarding the CoMFA electrostatic contour maps (Fig. 7b), the large blue contours covering the phenyl and imine groups near the 12,4-triazole moiety indicate that the electro-donating substituents in these places are preferred to achieve improved activity of the molecules. The molecule C14 (pIC50 = 5.604) and molecule C25 (pIC50 = 5.644) that possess electron-donating moieties (Cl and OCH3) at ortho, meta and para sites of phenyls group are two examples that can explain this observation. Whereas the tiny red contour near oxygen atom of nitro group clearly showed that electron-withdrawing groups at this position would be beneficial for α-glucosidase activity.
3.7 CoMSIA/EHA contour maps results
The results of CoMSIA electrostatic contour plots are depicted in Fig. 8a, where red color (20 % contribution) indicates the positions where electro-attracting groups are favored. However, blue color (80 % contribution) indicates the positions favored by the electro-donor groups. Hence, red-colored portions around ortho, meta, and para positions of phenyl groups and the (–NO2) group demonstrated that introducing electro-attracting groups could ameliorate the α-glucosidase activity. Blue-colored portion situated in the phenyl moiety's meta position demonstrates that this site is exclusively available to electro-donor groups to increase the potency of 4-amino-1,2,4-triazole compounds (Fig. 8a).
CoMSIA hydrophobic contour maps (depicted by yellow (80 % contribution) and gray (20 % contribution)) were displayed in Fig. 8b. The yellow outlines indicate the regions of the preferred hydrophobic substituents and gray colored contours shown the regions where hydrophobic moieties are unpreferred. Back to the results of Fig. 8b, a yellow contour was observed around para position of phenyl group, which indicates significance of hydrophobic groups on α-glucosidase activity in this region. Similarly, gray contours around (–NO2) group and meta position of phenyls group demonstrate that hydrophilic entities are needed to improve α-glucosidase activity (Fig. 8b).
CoMSIA of H-bond acceptor contour plots are displayed in Fig. 8c, where magenta-colored contour (80 % contribution) of oxygen atom of the nitrogen dioxide moiety shows that the use of H-bond acceptor substituents is required to enhance the potency of the new title molecules. On the contrary, a red contour (20 % contribution) near ortho position of phenyl groups and oxygen atom of (–NO2) group suggested that hydrogen bond accepting moieties in these positions are unfavored (Fig. 8c).
3.8 CoMFA and CoMSIA/EHA contour maps summary
The structural features removed from CoMFA and CoMSIA/EHA contour cards were investigated to determine the structural necessities for each position and the specifications for a chemical group to increase the bioactivity of proposed compounds as α-glucosidase inhibitors, as shown in Fig. 9. A bulky and electro-donating substituent such as halogens groups (Cl, Br, and F), substituted alkanes (isopropyl, isobutyl) or amines groups (methanamine, dimethylamine, and trimethylamine) is required for the R1 position in order to ameliorate α-glucosidase inhibitory activity. The R2 group is requested only to be small, electron-withdrawing, hydrophilic and H-bond donor moieties as nitrile group (–CN) or nitrosyl hydride (NHO). Bulky, electro-donating/electron-withdrawing, and hydrophilic groups such as nitrogen dioxide (–NO2), formaldehyde (–CH2O) or formamide (–CONH2) are beneficial for the R3 moiety (Fig. 9). Therefore, all these recommendations will guide to introduce the correct group in the proper position to design new potent α-glucosidase inhibitors with good predicted activity.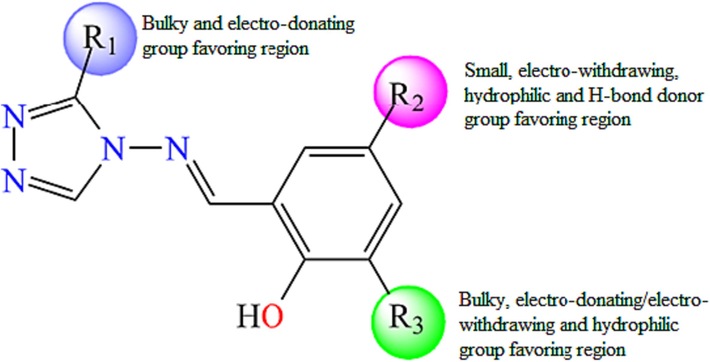
Structure-activity relationship representation.
3.9 Design of novel 4-amino-1,2,4-triazole inhibitors
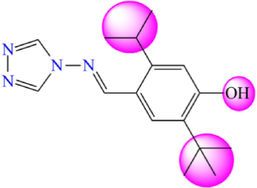
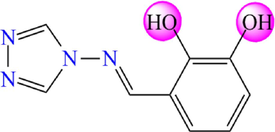
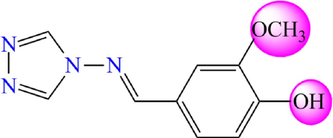
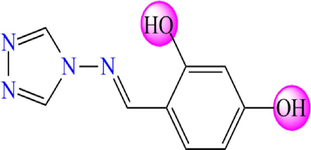
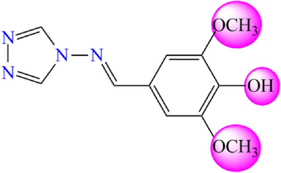
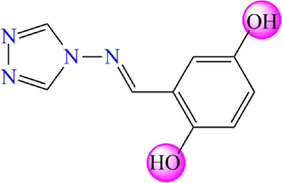
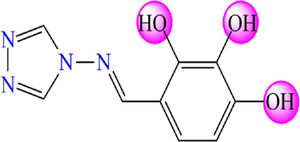
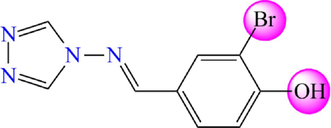
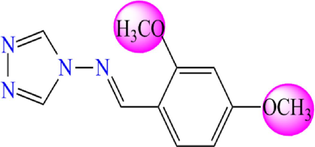
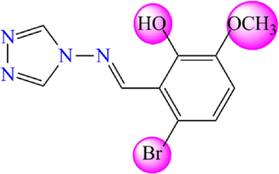
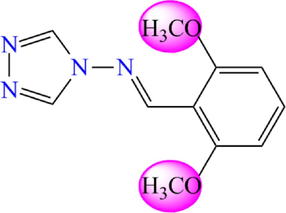
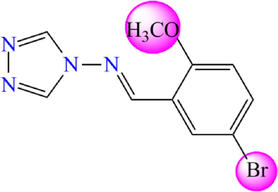
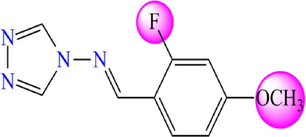
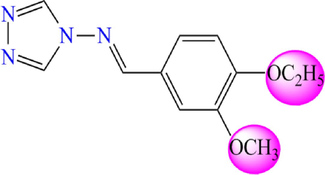
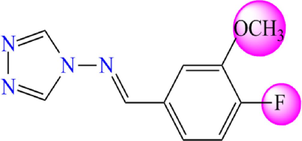
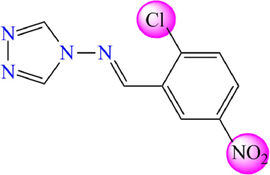
The current study aims to design new α-glucosidase inhibitors by investing the different structural features extracted from the recommended CoMFA and CoMSIA/EHA models. In fact, we substituted the nitro group (–NO2) by nitric oxide (–NO) group in R2 position and we added the proper substituents in R1 and R3 positions according to the contour maps (Fig. 10). Hence, four new α-glucosidase inhibitors were suggested and their α-glucosidase activity were computed by using the proposed CoMFA and CoMSIA/EHA models as displayed in Table 6. Returning to Table 6 findings, the α-glucosidase activity of the recommended new molecules was better than that of the reported 4-amino-1,2,4-triazole analogues. Fig. 10 shows the chemical structures of the new proposed compounds.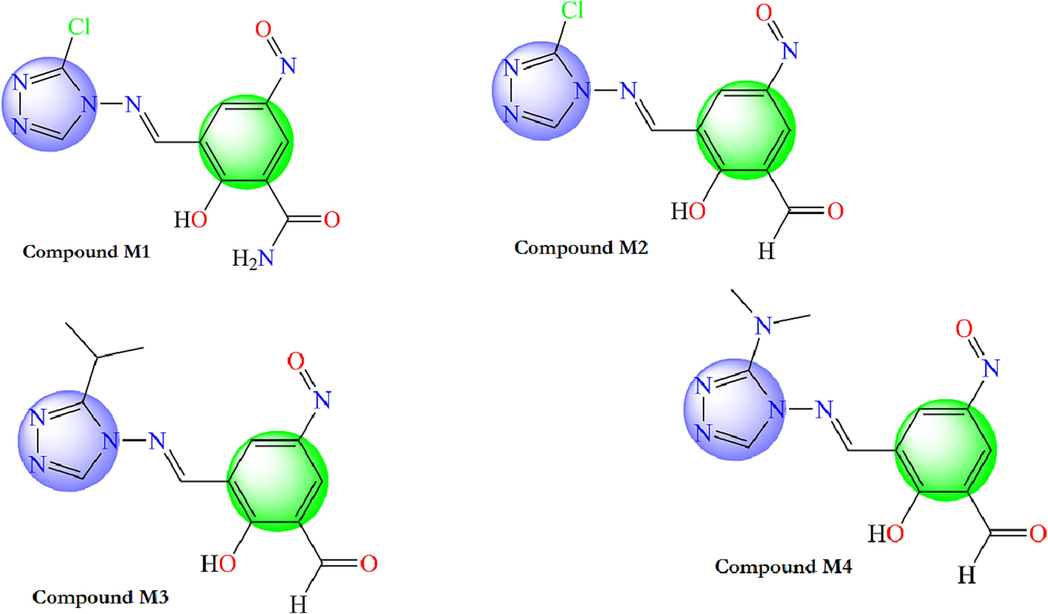
Chemical structures of the new proposed 4-amino-1,2,4-triazole molecules.
Compound
Predicted pIC50
Compound C25
CoMFA
CoMSIA/EHA
Observed pIC50
M1
5.760
5.722
5.644
M2
5.755
5.653
M3
5.752
5.640
M4
5.745
5.638
C25
5.511
5.564
3.10 Pharmacokinetic properties and ADMET results of the new proposed α-glucosidase inhibitors
Drug likeness is described as a complex equilibrium of numerous molecular properties and structural characteristics that decide if a scaffold is a medication or not (Zaki et al., 2018; El-mernissi et al., 2023). Lipinski’s rule of five is probably the most commonly used method, which suggests that molecules with logP < 5, hydrogen bond acceptor number < 10, molecular weight < 500, and hydrogen bond donor number < 5 are deemed the best oral absorption and permeation (Lipinski et al., 1997). In this direction, we calculated numerous molecular properties of the four new proposed molecules using SwissADME (Daina et al., 2017) and pkCSM (Pires et al., 2015) online servers, as clarified in Table 7. The obtained outcomes demonstrate that the title inhibitors have acceptable oral absorption and permeation. Continuously, excellent bioavailability and increased flexibility for effective interaction with a specific binding pocket are both characteristics of a molecule with a total polar surface area (TPSA) of less than 140 Å2 and a number of rotatable bonds (nrotb) of less than 10 (El-mernissi et al., 2021).
N°
Property
Formula
MW
HBD
HBA
nrotb
LogP
TPSA
LogS
SA
CSp3
Lead-likeness
M1
294.65
2
5
8
1.01
135.82
4.13
2.54
0.00
Yes
M2
279.64
1
5
8
1.72
109.80
−5.43
2.55
0.00
No
M3
287.27
1
5
8
2.19
109.80
−4.24
2.96
0.00
Yes
M4
288.64
1
5
9
1.14
113.04
−4.79
2.94
0.00
No
C25
220.20
0
5
3
1.308
52.30
−1.93
2.20
0.10
No
Abbrevi-ations
MW: Molecular Weight, HBD: number of hydrogen bonds donors, LogP: logarithm of partition coefficient of molecule between water and n-octanol, HBA: number of hydrogen bonds acceptors, nrotb: number of rotatable bonds, SA: Synthetic Accessibility, TPSA: Topological Polar Surface Area.
Interestingly, the four new proposed molecules present good bioavailability and are more flexible (Table 7). On the other hand, the new proposed 4-amino-1,2,4-triazole inhibitors were screened for their synthetic accessibility to identify the ease with which these compounds can be synthesized. Table 7 reveals that all the compounds under study have synthetic accessibility (SA) values near 1 and below 10, indicating that they are all capable of being synthesized (Hasan et al., 2022). Further pharmacokinetic properties of the recommended scaffolds, ADMET properties were determined using SwissADME (Daina et al., 2017) online server. The findings are displayed in Tables 8, 9, 10 and supplementary Fig. 11.
Compound
GI Absorption
BBB Permeable
Log Kp (Cm/S)
M1
High
No
−7.70
M2
High
No
−7.19
M3
High
No
−7.09
M4
High
No
−7.60
C25
High
Yes
−6.77
Models
Inhibitor
M1
M2
M3
M4
C25
Absorption (A)
Water solubility
Numeric (Log mol/L)
−3.80
−3.94
−3.83
−3.79
−2.52
Caco-2 permeability
Numeric (log Papp in 10-6 cm/s)
−0.08
−0.07
0.89
−0.04
1.29
Intestinal absorption (human)
Numeric (% Absorbed)
76.35
84.36
85.83
80.76
91.28
P-glycoprotein substrate
Categorical (Yes/No)
No
No
No
No
No
P-glycoprotein inhibitor
No
No
No
No
No
Distribution (D)
Blood-brain barrier (logBB)
Numeric (log BB)
−1.30
−1.19
−1.03
−1.17
−0.18
Metabolism (M)
CYP1A2 inhibitor
Categorical (Yes/No)
No
Yes
Yes
Yes
Yes
CYP2C19 inhibitor
No
No
Yes
No
No
CYP2C9 inhibitor
No
No
No
No
No
CYP2D6 inhibitor
No
No
No
No
No
CYP3A4 inhibitor
No
No
No
No
No
CYP2D6 substrate
No
No
No
No
No
CYP3A4 substrate
No
No
No
No
No
Excretion (E)
Total Clearance
Numeric (log ml/min/kg)
0.03
0.17
0.13
0.48
0.48
Toxicity (T)
AMES toxicity
Categorical (Yes/No)
No
Yes
No
Yes
No
Hepatotoxicity
No
Yes
Yes
Yes
No
Skin sensitisation
No
No
No
No
No
hERG I inhibitor
No
No
No
No
No
Oral Rat Acute Toxicity (LD50)
Numeric (mol/kg)
2.263
2.428
2.336
2.378
2.437
Compound
Lipinski
Ghose
Veber
M1
Yes
Yes
Yes
M2
Yes
Yes
Yes
M3
Yes
Yes
Yes
M4
Yes
Yes
Yes
C25
Yes
Yes
Yes
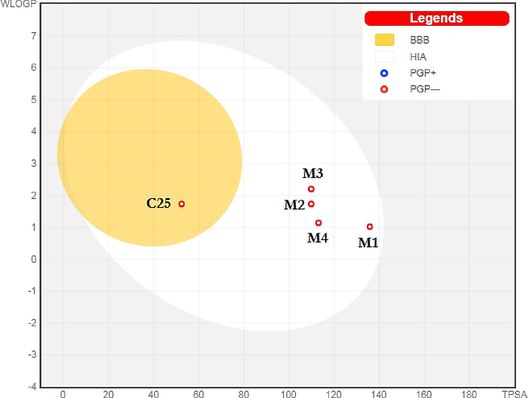
BOILED-Egg model.
3.10.1 Absorption and distribution
Topical and systemic therapies alike will benefit from transdermal delivery systems. The skin barrier, which protects the body from physical and chemical harm, nevertheless prevents the delivery of the required drug dosage to a target organ through the skin (Prausnitz and Langer, 2008; Naz et al., 2020). Moreover; the blood–brain barrier (BBB) is an extra membrane between the extracellular space of the brain and circulating blood. So, a compound with logBB value ˃ 0.3 easily crosses the BBB. Results of (Tables 8 and 9) hint that the new title compounds are high absorption, poorly distributed in the brain, unlike compound C25, the dataset's more active molecule (supplementary Fig. 11), inadequately permeable to the skin, and have logKp negative values. Furthermore, water solubility is a key property that specifies the efficacy of solubility of a drug in water. The outcomes listed in Table 8 point out all new 4-amino-12,4-triazole molecules are soluble. As regards the Caco-2 permeability, Table 9 shows that the new suggested inhibitors cannot enter Caco-2 since their high permeability would result in a predicted value greater than 0.9. Findings of Table 9 demonstrate also that the proposed new α-glucosidase inhibitors are neither a substrate nor an inhibitor for P-glycoprotein.
3.10.2 Metabolism
The aptitude of substances to inhibit cytochrome P450 (CYP) enzymes must be investigated to determine their potential drug interactions and toxicity (Belhassan et al., 2022). All pharmacological compounds are substrates of five main isoforms (CYP2C19, CYP1A2, CYP2D6, CYP2C9, and CYP3A4) (Ghous et al., 2023). These enzymes have a significant role in drug metabolism. The compound M1, the best-suggested inhibitor, inhibits the five cytochrome P450 subtypes and found no substrate for CYP2D6 and CYP3A4 (Table 9). Molecules M2 and M4 inhibit the four isoforms (CYP2C9, CYP2D6, CYP2C19, and CYP3A4) and are no substrate for CYP2D6 and CYP3A4. Compound M3 inhibits three cytochrome P450 subtypes; CYP2C9, CYP2D6, and CYP3A4, and not substrates for CYP2D6 and CYP3A4 (Table 9).
3.10.3 Excretion
Clearance is a factor that describes the ratio between the body's concentration of the drug and its degree of removal (Khaldan et al., 2022a-d). The lower the clearance rate, the greater the retention of the drug in the organism. The obtained findings demonstrate that the recommended molecules have a lower value of clearance index than compound C25, proving that these compounds can stay in the human body, mainly the M1 (Table 9).
3.10.4 Toxicity
Ames mutagenicity was employed in the early phases of medication development to assess possible teratogenicity and genotoxicity (Daoui et al., 2023; Nour et al., 2022). According to the outcomes listed in Table 9, the proposed molecules M1 and M3 exhibited no toxicity according to the Ames test. The hepatotoxicity is another toxicity test that has been determined. From Table 9, we can see that the new inhibitor M1 is not hepatotoxic. In a similar vein, obtained outcomes hint that the four new 4-amino-1,2,4-triazole compounds do not have skin sensitization and do not inhibit the hERG channel. Table 9 shows that the LD50 values are low, which means that these inhibitors are not fatal (Only at very high dosages are the molecules lethal). In conclusion, the four suggested α-glucosidase inhibitors present pharmacokinetics properties better than the reported molecule C25 and fulfill Lipinski, Ghose, and Viber rules (Table 10), proposing that these molecules could be adopted as candidates for the development of new inhibitors against diabetes mellitus.
3.11 Molecular docking results
The molecular docking method defined intermolecular interactions between 4-amino-1,2,4-triazole ligands and target 3a4a receptor. The crystal structure of the studied receptor (PDB: 3a4a) is shown in Fig. 12. In this study, the active pocket of the 3a4a receptor was docked with compound M1, voglibose (α-glucosidase inhibitor used in clinics), and the best-recommended molecule. The results indicate that molecule C25 is the most potent inhibitor in the database. These findings suggest that C25 has the potential to be developed as a novel therapeutic agent for diseases associated with 3a4a receptor inhibition. The binding affinities of the studied molecules, obtained from Autodock Vina program, are listed in Table 11. The summary of inter-molecular interactions between C25/M1, and voglibose molecules with the target protein are shown in Table 12, Figs. 13, 14, and 15, respectively. Autodock Vina results provided nine different poses; the affinity value for the best binding modes for C25, M1, and voglibose molecules were obtained as 6.600, −7.600, and −6.400 kcal/mol, respectively, as shown in Table 11. Hence, M1 molecule might have more diabetes mellitus inhibitory potential than C25 and voglibose molecules. Additionally, M1 compound provided a lower inhibition constant (Ki) than the other studied compounds, demonstrating that a smaller amount of the M1 inhibitor can inhibit diabetes mellitus (Table 11). Whereas, the docking result of C25 compound interactions, a conventional hydrogen bonding interaction was formed between (N) atom of the Arg442 residue and (N) atom of the imine group. The distance for this interaction was obtained as 3.14 Å with ≡N ···N notation. Similarly, a carbon-hydrogen bond was established between = O atom of the Asp352 residue and the aromatic CH of 1,2,4-triazole ring with = O···C–H notation at 3.64 Å value of distance. The Pi-Pi-T –shaped interactions was observed between π electrons of the phenyl group in residues Tyr72 and Tyr158 with π electrons of 1,2,4-triazole group at 4.69 and 4.93 Å values of distances, respectively. The compound C25 provided a pi-anion interaction between = O atom in residue Asp69 and π electrons of 1,2,4-triazole group at a distance of 3.89 Å. On the other hand, the docking interactions of voglibose show more conventional hydrogen bonds with different residues and distances, making it more stable in the active site of protein 3a4a. In the case of molecular docking outcomes of M1 Compound showed a pi-alkyl and five conventional hydrogen bond interactions. These critical interactions make the compound M1 pharmacologically very important compared to the molecule C25 since hydrogen bonding significantly impacts the pharmacological action of ligands. In more detail, a pi-alkyl interaction was observed between Alkyl group in residue Arg315 and π electrons of phenyl group at 4.12 Å value of distance. Two conventional hydrogen bond interactions were made between ≡N atom in residue Asn415 and = O atom of amide group with ≡N···O = notation at 2.92 Å value of distance, and = O atom in the same residue and (–NH) group of amide with = O ···HN notation at 2.77 Å value of distance, respectively. Additionally, the hydroxyl (–OH) group situated at ortho site of phenyl group formed a conventional hydrogen bonding interaction with Tyr158 residue at 1.87 Å value of distance. Two other conventional hydrogen bonding interactions were formed between ≡N atom of the Arg315 residue and = O atom of (NO) with the notation ≡N···O = at a distance value of 3.00 Å, and the = O atom of the Pro312 residue and the = O atom of nitric oxide with the notation = O···O = at a distance value of 3.40 Å, respectively.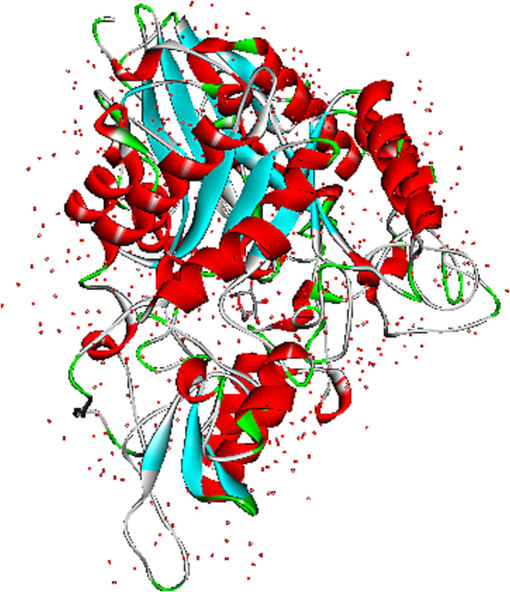
The crystal structure of the studied receptor (PDB: 3a4a).
Inhibitor
Binding energy (Kcal/mol)
Inhibition constant (µM)
C25
−6.600
14.34
Voglibose
−6.400
20.11
M1
−7.600
2.64
Residues
Ligand groups
Distances (Å)
Interaction species
C25 protein complex
≡N atom in Arg442
N atom in imine group
3.14
Conventional hydrogen bond
=O atom in Asp352
Aromatic CH of 1,2,4-triazole group
3.64
Carbon hydrogen bond
=O atom in Asp69
π electrons of 1,2,4-triazole group
3.89
Pi-anion
π electrons of the phenyl group in Tyr72
π electrons of 1,2,4-triazole group
4.69
Pi-Pi-T -shaped
π electrons of the phenyl group in Tyr158
π electrons of the phenyl group
4.93
Pi-Pi-T -shaped
Voglibose protein complex
=O atom in Asp242
–OH group in phenyl
1.96
Conventional hydrogen bond
=O atom in Asp242
–NH group of amine
2.41
Conventional hydrogen bond
=O atom in Asp242
=O atom of methanol group
2.42
Conventional hydrogen bond
=O atom in Ser240
–NH group of amine
2.32
Conventional hydrogen bond
=O atom in Ser240
=O atom of methanol group
2.21
Conventional hydrogen bond
=O atom in Ser241
=O atom of methanol group
2.94
Conventional hydrogen bond
=O atom in Pro312
–OH group in phenyl
2.36
Conventional hydrogen bond
=O atom in Lys156
C atom of methanol group
3.61
Carbon hydrogen bond
=O atom in Pro312
C atom of methanol group
3.63
Carbon hydrogen bond
M1 protein complex
=O atom in Tyr158
–OH group in phenyl
1.87
Conventional hydrogen bond
≡N atom in Asn415
=O atom of amide group
2.92
Conventional hydrogen bond
=O atom in Asn415
–NH group of amide
2.77
Conventional hydrogen bond
≡N atom in Arg315
=O atom of nitric oxide
3.00
Conventional hydrogen bond
=O atom in Pro312
=O atom of nitric oxide
3.40
Conventional hydrogen bond
Alkyl group in Arg315
π electrons of the phenyl group
4.12
Pi-alkyl
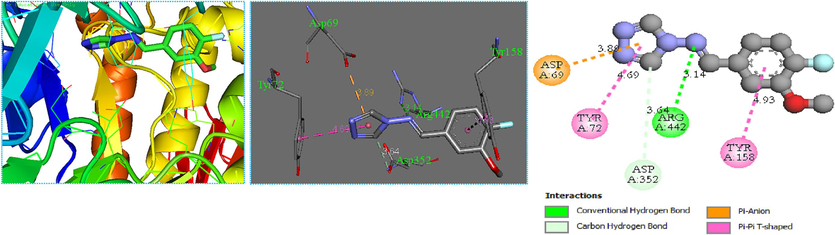
Representation of the 3D (left) and 2D (right) interactions of the molecule C25 with 3a4a receptor.
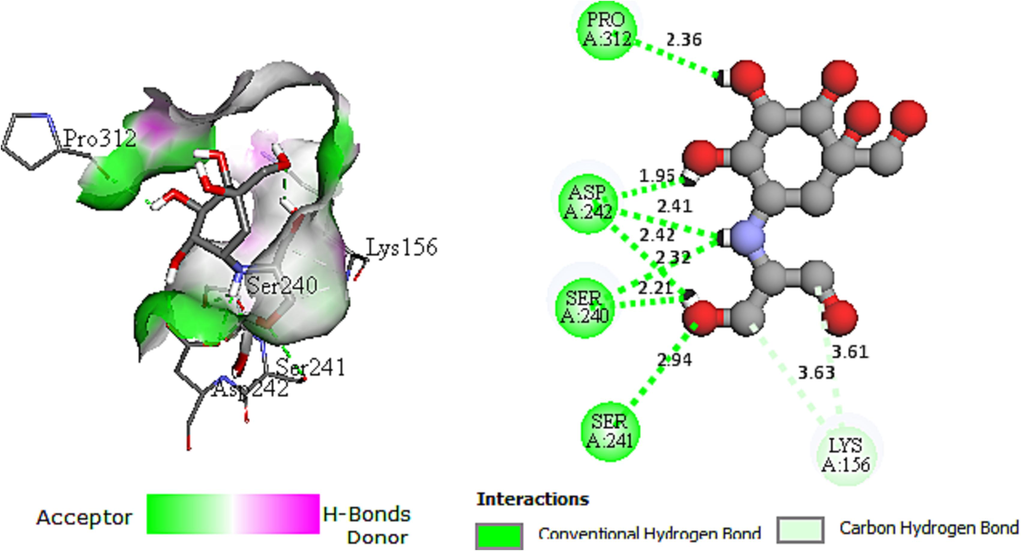
Representation of the 3D (left) and 2D (right) interactions of the voglibose drug with 3a4a receptor.
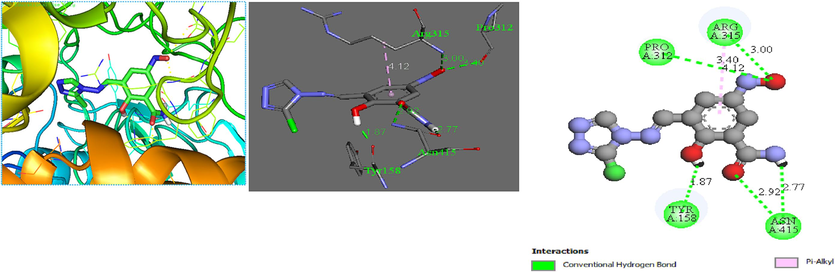
Representation of the 3D (left) and 2D (right) interactions of the molecule M1 with 3a4a receptor.
The reliability and effectiveness of molecular docking procedures have been confirmed through the re-docking process. As shown in Fig. 16, the re-docked conformation (in magenta) overlaps with the original ligand (in red) with an RMSD (Root Mean Square Deviation) value of 0.35 Å, which lies within the satisfactory range of 2 Å (Kramer et al., 1999). The successful superimposition of the two compounds and the RMSD value below 2 Å confirm the Autodock Vina algorithms' capability to conduct molecular docking protocols with confidence. Additionally, Fig. 16 also displays the result of the original ligand's molecular docking to the active site of the 3a4a receptor. The original ligand formed multiple interactions with varying distance values, including six conventional hydrogen bond interactions, validating its stability in the active pocket of the receptor ().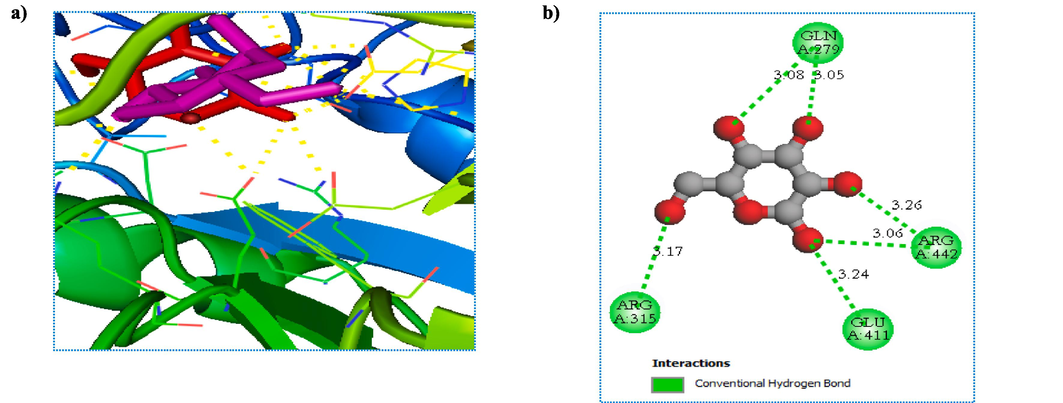
A) re-docking pose with the rmsd value of 0.35 Å (Red = Original, Magenta = Docked), b) Docking interactions of the co-crystalized ligand.
3.12 MD simulations results
3.12.1 RMSD
RMSD was identified for the complex on the basis of 'Backbone' atoms by means of the VMD software. The average RMSD value for C25 and M1 complexes are 4.252 ± 0.9477 Å and 1.856 ± 0.326 Å. The protein complex's RMSD graph demonstrates that, with slight fluctuation in the range of ∼ 1 Å, the structure remained constant during the simulation time, which is a usual behavior of globular protein (Fig. 17). The ligand's RMSD was computed using the VMD algorithm on the basis of the atoms of the ligand. The average RMSD value for C25 and M1 ligands are 1.1616 ± 0.360 Å and 1.8491 ± 0.323 Å. The ligand's RMSD of C25 remained below 2 Å at all times. The fluctuations of amino acids in the protein, both in the presence and absence of the ligand, were indistinguishable until the 42 ns mark. Beyond 42 ns, it was observed that the ligand changed its position or conformation within the same active site, explaining the increased vibrational intensity of the complex up to 85 ns. After this point, the ligand's conformation remained stable but converged to around 4 Å RMSD. Generally, the complex's RMSD exceeded 2 Å, indicating the conformational destabilization of the ligand throughout the dynamic simulation. On the other hand, RMSD of M1 fluctuated until 62 ns, it stabilized at 2 Å, M1 ligand remained bound throughout the simulation (Fig. 17).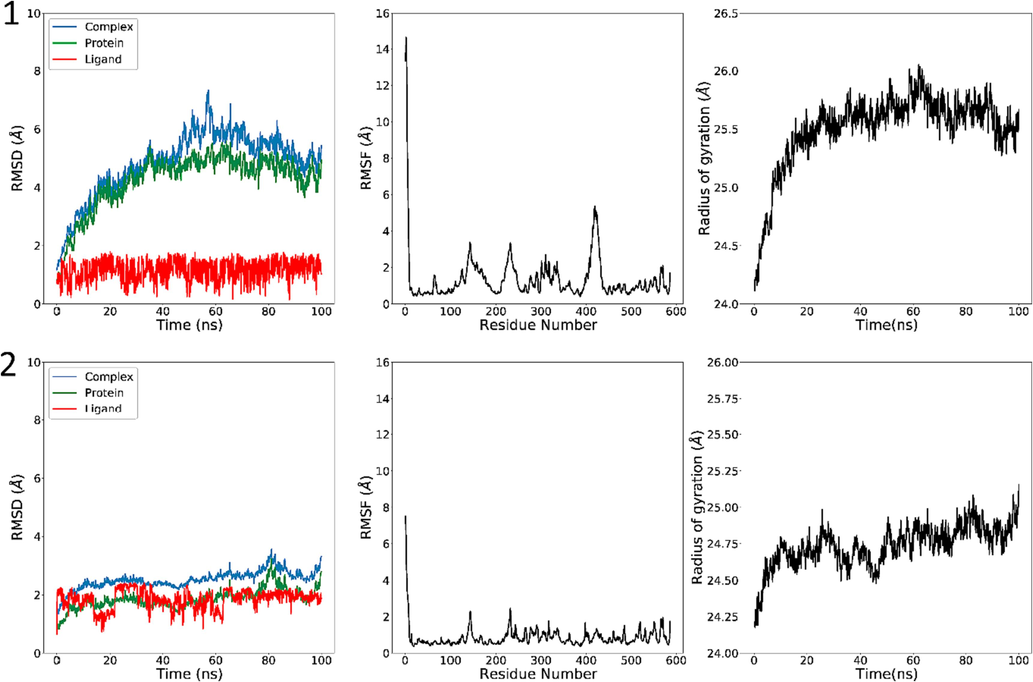
RMSD (left), RMSF (middle) and Rg (right) of the investigated complexes in a MD simulation time of 100 ns. C25 (top) and M1 (bottom).
3.12.2 RMSF
The RMSF was determined for the protein complex 3a4a using 'C-alpha' atoms with the VMD software. Based on the analysis of RMSD of the amino acids in the protein 3a4a, Fig. 17 shows that most amino acids exhibit fluctuations of less than 2 Å. It is known that the ligand C25 has formed conventional hydrogen bonds with the amino acids Gln279 and Arg315 with fluctuations less than 2 Å. However, the two amino acids that formed the same type of bonds with Gln411 and Arg442 exceeded 2 Å in fluctuation, confirming the divergence in the RMSD of the complex. In contrast, the fluctuation strength remains RMSF below 2.5 Å, except for residues 1 to 7 for the ligand M1 (Fig. 17).
3.12.3 Radius of gyration (Rog)
The Rog was determined for the targeted complex based on ‘Backbone’ atoms using VMD software. Fig. 17 shows the mean ROG value for C25 and M1 are 25.50 ± 0.328 Å and 24.736 ± 0.142 Å. The small fluctuation inside the 1 Å Rog value throughout the simulation time’s 100 ns reveals a very modest entering and shutting of the N and C terminal areas.
3.12.4 Protein-ligand hydrogen bonds
The total number of hydrogen bonds established between C25 and M1 ligands and 3a4a receptor throughout the simulation time’s 100 ns is depicted in Fig. 18. C25 and M1 ligands exhibit a consistent changing number of H-bonds with the protein and remains in bound form. The fluctuations show that the conformation of the C25 and M1 ligands inside the pocket is changing (Fig. 18). Hydrogen bond occupancy values for each 3a4a-C25/M1 complex are shown in Table 13. Hydrogen bond occupancy is the ratio of conformations where a particular residue engages in hydrogen bonds over of 1000 conformations of the 3a4a-C25/M1 complex. Each complex's 1000 conformations were computed using the 100 ns molecular dynamics pathway. The residues with the highest hydrogen bonding interactions are shown in Table 13.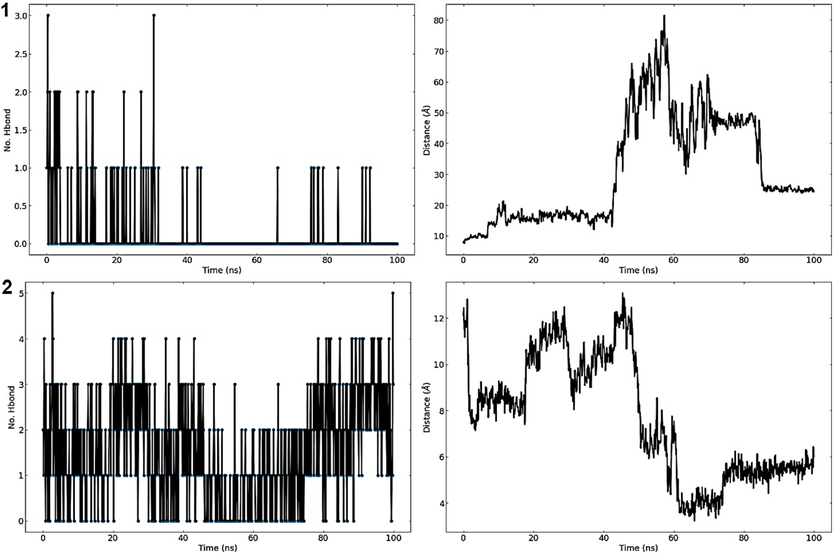
Protein-ligand hydrogen bonds (left) and average distance between protein and ligand (right) of the complexes studied during the 100 ns simulation. C25 (top) and M1 (bottom).
Complex 3a4a-C25
Complex 3a4a-M1
Donor
Acceptor
Occupancy (%)
Donor
Acceptor
Occupancy (%)
ARG213-Side-NH1
UNK0-Side-N1
1.00 %
ARG442-Side-NH1
UNK0-Side-N2
8.80 %
ARG213-Side-NH2
UNK0-Side-N2
1.40 %
UNK0-Side-N20
SER311-Main-O
7.20 %
GLN279-Side-NE2
UNK0-Side-O15
1.70 %
THR306-Side-OG1
UNK0-Side-O17
16.50 %
HSD280-Main-N
UNK0-Side-O15
1.00 %
UNK0-Side-N20
GLN353-Side-OE1
9.70 %
ARG213-Side-NH1
UNK0-Side-N2
0.80 %
UNK0-Side-O15
ASP307-Side-OD2
8.50 %
ASN414-Side-ND2
UNK0-Side-N2
0.90 %
UNK0-Side-O15
ASP307-Side-OD1
9.90 %
LYS156-Side-NZ
UNK0-Side-N2
0.70 %
UNK0-Side-O15
SER311-Main-O
7.60 %
LYS156-Side-NZ
UNK0-Side-N1
0.60 %
UNK0-Side-N20
PHE303-Main-O
7.90 %
GLN171-Side-NE2
UNK0-Side-O15
0.40 %
ARG442-Side-NH1
UNK0-Side-N1
15.10 %
LYS503-Side-NZ
UNK0-Side-O15
0.30 %
UNK0-Side-N14
THR306-Side-OG1
19.20 %
3.12.5 Average Center-of-Mass distance
Average Center-of-Mass Distance between C25 and M1 ligands and 3a4a protein throughout 100 ns of the simulation time. The mean distances for C25 and M1 complexes are 31.235 ± 17.659 Å and 7.626 ± 2.6106 Å. The plots indicate that C25 ligand exhibits close interactions with 3a4a receptor until 42 ns, and later it moves far from the center of the mass of the 3a4a receptor and unbinds from it. In contrast, M1 ligand remains stable and bound to the 3a4a protein throughout the simulation and experiences a shift in its COM distance between 40 ns and 60 ns to become more stable on the 3a4a receptor with an average distance of 5 Å after 80 ns as shown in (Fig. 18).
3.12.6 Contact frequency (CF) analysis
A contact frequency (CF) study was conducted using the contactFreq.tcl module in VMD with a cutoff of 4 to further examine the binding between 3a4a and the C25 and M1 ligands tested; the findings are shown in Fig. 19. The residues with higher CF throughout the simulation time for C25 were Tyr72, Arg213, PHE303, Asp107, Glu277, Gln279 and Ser304. While for M1, the residues were Phe303, Thr306, Gln353, Tyr158, Asp307, Arg315, Tyr347 and Asn350.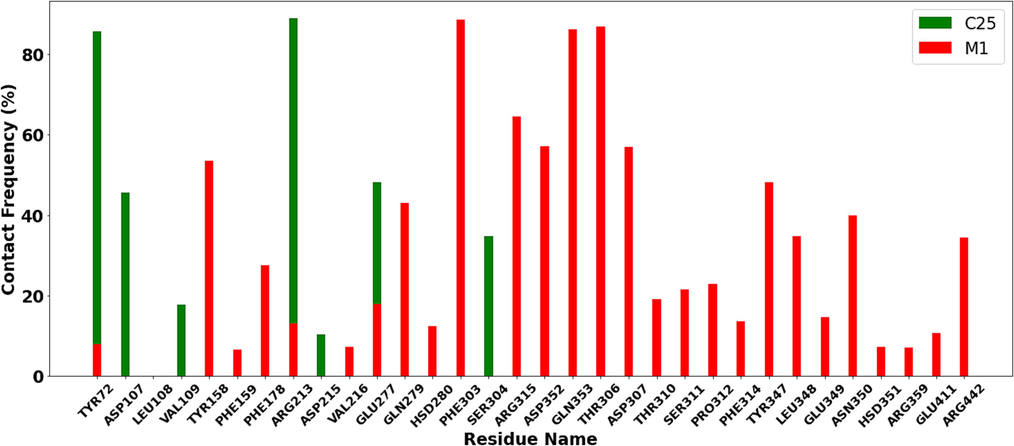
Contact frequency (CF) analysis.
3.12.7 Principal component analysis (PCA)
PCA of 3a4a-C25/M1 complex was computed using Bio3D software in R as shown in Fig. 20. All three PCs captured 70.1 % for C25 and 47 % for M1 of the structural variance in 3a4a protein.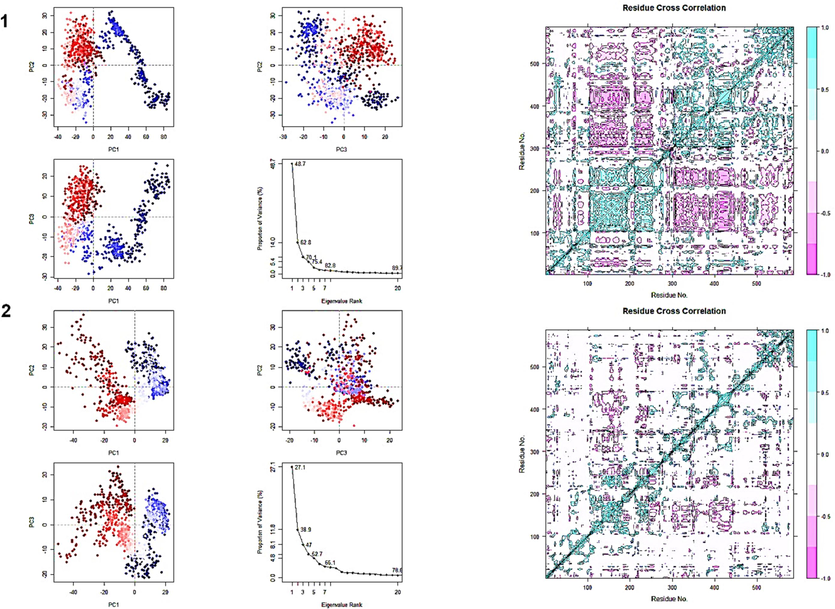
PCA (left) and DCCM (right) of the compounds C25 (top) and M1 (bottom).
3.12.8 Dynamic Cross-Correlation matrix (DCCM) analysis
The dynamic cross-correlated movements of protein residues for the complex were determined using R's Bio 3D software, as shown in Fig. 20. The correlation movement's intensity is illustrated by the color, with pink indicating a negative correlation, white indicating no association, and blue denoting a good association motion between residues.
3.12.9 Temperature, pressure and potential energy
The NAMD log files were used to generate the temperature, pressure and potential energy of the system throughout the MD simulation time, as shown in Fig. 21. The graph shows converged potential energy, pressure, and temperature.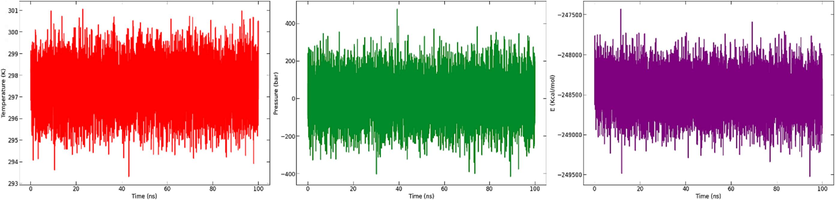
Temperature (A), pressure (B) and potential energy (C) throughout the entire simulation of 100 ns.
3.13 MM/GBSA binding energy
The MM/GBSA approach was put into practice to reevaluate the complexes because it is the quickest force field-based technique to identify free energy in comparison to other methods for calculating free energy, as the thermodynamic integration (TI) or energy perturbation (FEP) approaches. Comparative investigations revealed that the MM/GBSA technique performed better than the MM/PBSA (Molecular Mechanics/Poisson Boltzmann Surface Area) (Hou et al., 2011). MM/GBSA computations were put into effect using MolAICal program (Bai et al., 2021). Exploiting the results of MD simulations performed by the NAMD software, MolAICal provides a convenient way for computing MM/GBSA (Phillips et al., 2005). Table 14 illustrates the computed binding free energies. Table 15 shows the MD outcomes and MMGBSA relative binding energies for the leading docking molecules.
Complex
3a4a-C25
−7.6554 +/- 0.1763
−0.0002
3.8275
−11.4827
3a4a-M1
−13.3654 +/- 0.136
0
13.7981
−27.1635
Inhibitor
MD structure stability
MMGBSA binding energy (kJ/mol)
C25
Unstable
–32 +/- 0.74
M1
Stable
−56 +/- 0.57
3.14 Global properties of 4-amino-1,2,4-triazole molecules
The global reactivity indices of C25 and M1 molecules were determined as shown in Table 16 to determine the electrophilic and nucleophilic compounds. The electrophilicity ω index and nucleophilicity N index values of molecule C25 are 2.532 and 2.498, respectively. They are both electrophiles and nucleophiles of sufficient strength. On the other side, the electrophilicity index ω and nucleophilicity index N of compound M1 are 4.118 and 2.622, respectively, demonstrating that this compound is considered as a strong electrophile according to the electrophilic scale (Jaramillo et al., 2008) and a good nucleophile according to the nucleophilicity scale (Domingo et al., 2002). Therefore, the title compound M1 is favored over compound C25 concerning reactivity.
Molecule
Global indices
HOMO (ev)
LUMO (ev)
µ (ev)
η (ev)
S (ev)
ω (ev)
N (ev)
C25
−6.870
−2.519
−4.694
4.351
0.229
2.532
2.498
M1
−6.746
−3.537
−5.141
3.209
0.311
4.118
2.622
Furthermore, the Frontier Molecular Orbitals (FMOs) of molecules C25 and M1 have been analyzed at B3LYP/6–311++G (d,p) level. Fig. 22 shows the FMOs' corresponding energy levels for the compounds investigated. Because it accounts for the final charge transfer interaction in the compound, the HOMO-LUMO energy gap is crucial in determining molecular electrical transport properties (Miar et al., 2021). A compound with a large frontier orbital gap (HOMO-LUMO energy gap), also known as the
, has low chemical reactivity since it is energetically inefficient to add an electron to the high-lying LUMO to get an electron from the low-lying HOMO (Aihara, 1999; Ruiz-Morales, 2002). The derived values of
indicated significant chemical reactivity of M1 title molecule.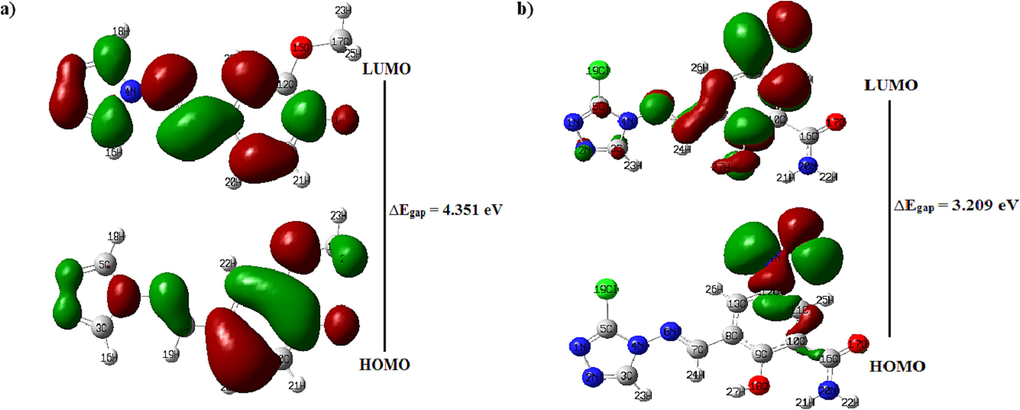
The geometries of the HOMO and LUMO orbitals, along with the value of the energy gap values. a) compound C25, b) compound M1.
3.15 Molecular electrostatic potential (MEP)
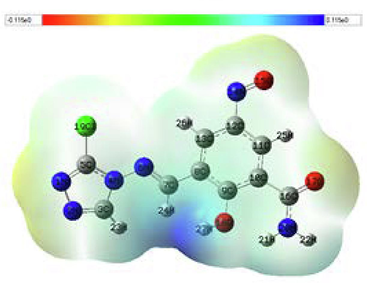
MEP maps are logically used to obtain information about the areas of nucleophilic and electrophilic reactivity of a molecule. The charge distributions of the molecules were viewed in three dimensions using the MEP surface. Additionally, the binding of a molecule to a receptor's active site highly depends on the three-dimensional distribution of the electrostatic potential (Han et al., 2005). The B3LYP/6–311++G (d,p) basis in the Gaussian software was used to create the MEP surfaces of the investigated compounds. Table 17 displays the MEP maps of the compounds C25 and M1. In MEP contours, the blue color shows the positive (electron-poor) region; the light blue indicates the slightly electron-deficient region, the neutral region is denoted by green, and the red color demonstrates the negative (electron-rich) part, and the yellow color represents the part slightly rich in electrons. Table 17 shows that compound C25 has a high negative potential (red color) at the level of the N1 and N2 nitrogen atoms of the 1,2,4-triazole group and a low negative potential (yellowish color) at the same level. As a result, the overall electron density of compound C25 is localized on the N1 and N2 atoms, which have the highest negative potential and hence are the most attractive targets for electrophilic attack. On the other hand, the compound M1 presents an acceptable positive potential (light blue color) at the level of the atoms C11 and C13 of the phenyl group, indicating that these centers are the most attractive targets for nucleophilic attack.
N°
Optimized structure
Electrostatic potential surface
C25

M1
3.16 Local properties of 4-amino-1,2,4-triazole inhibitors
The and Parr functions for the compounds C25 and M1 were calculated to find out which centers are the most nucleophilic and electrophilic. The outcomes are shown in supplementary Table S18.
Study of the electrophilic Parr function of the molecule C25 shows that the C8 and C9 atoms are the most electrophilic centers because they have the highest local electrophilicity index values ( ). On the other side, the result of the nucleophilic Parr functions of the same molecule illustrates that N1 and N2 are centers considered as the most electrophilic due to their the highest local nucleophilicity index values ( ). In the case of the title molecule M1, the C11 and C13 atoms with the largest local electrophilicity index values ( ) were identified as the most electrophilic centers based on the electrophile Parr function analysis. While the investigation of nucleophilic Parr function of the molecule M1 shows that N14 and O15 atoms are the most electrophilic centers since they have the highest nucleophilicity index values ( ).
The most favoured two-center electrophilic/ nucleophilic interaction will therefore occur between the C8 and C9 atoms of compound C25, as well as C11 and C13 atoms of compound M1, and the most nucleophilic centers of the α-glucosidase receptor site.
4 Conclusion
3D-QSAR analysis, ADMET profiling, molecular docking, MD simulation, and quantum analysis were performed to characterize the title molecules and assess their possible use against diabetes mellitus type 2. The established CoMFA and CoMSIA/EHA models showed promising statistical findings. The recommendations provided by 3D-QSAR contour maps identify four suggested 4-amino-1,2,4-triazole inhibitors with important α-glucosidase activity. The four proposed inhibitors confirmed the rules of Lipinski, Veber, and Ghose. Compounds M1 and M3 were found to be lead-like drugs and ADME results showed good absorption and no penetration into the brain for the new targeted molecules. Similarly, the compounds M1 and M3 were found to be non-toxic, according to the Ames test. In the process of molecular docking, it was observed that compound M1 exhibited a more favorable interaction with the target receptor as compared to compound C25. A stronger binding energy and conventional hydrogen bonds marked this interaction. Further, the 100 ns MD simulation results indicated that compound M1 remained stable within the receptor's active pocket, with only minor fluctuations while maintaining good binding energy, thus corroborating the findings of the molecular docking. Conversely, compound C25 demonstrated less stability during the simulation. Finally, a quantum method calculation using global and local properties was performed on the compound M1. The results showed that the O19, N18, C16, and N5 atoms are the most electrophilic centers, and Cl27, O24, C8, and N7 are the most nucleophilic centers for the compound M1. Therefore, the results obtained clearly show that the title molecule M1 has a great chance of becoming an α-glucosidase inhibitor.
CRediT authorship contribution statement
Ayoub Khaldan: Data curation, Writing – original draft. Soukaina Bouamrane: Writing – review & editing. Reda El-mernissi: review & editing. Mohammed Ouabane: Writing – review & editing. Marwa Alaqarbeh: Writing – review & editing. Hamid Maghat: Investigation, Validation. Mohammed Aziz Ajana: Investigation, Validation. Chakib Sekkat: Investigation, Validation. Mohammed Bouachrine: Conceptualization, Methodology, Investigation, Validation. Tahar Lakhlifi: Investigation, Validation, Supervision. Abdelouahid Sbai: Validation, Visualization, Software, Supervision, Project administration.
Acknowledgments
We dedicate this work to the “Moroccan Association of Theoretical Chemists” (MATC) for its pertinent help concerning the programs.
Declaration of competing interest
The authors declare that they have no known competing financial interests or personal relationships that could have appeared to influence the work reported in this paper.
References
- Reduced HOMO−LUMO Gap as an Index of Kinetic Stability for Polycyclic Aromatic Hydrocarbons. Chem. A Eur. J.. 1999;103(37):7487-7495.
- [CrossRef] [Google Scholar]
- 2. Classification and Diagnosis of Diabetes: Standards of Medical Care in Diabetesd 2019. Diabetes Care. 2019;42:S13-S28.
- [CrossRef] [Google Scholar]
- MolAICal: a soft tool for 3D drug design of protein targets by artificial intelligence and classical algorithm. Brief. Bioinform.. 2021;22(3):bbaa161.
- [CrossRef] [Google Scholar]
- 3D-QSAR, docking, molecular dynamics simulation and free energy calculation studies of some pyrimidine derivatives as novel JAK3 inhibitors. Arab. J. Chem.. 2020;13(1):1052-1078.
- [CrossRef] [Google Scholar]
- In silico detection of potential inhibitors from vitamins and their derivatives compounds against SARS-CoV-2 main protease by using molecular docking, molecular dynamic simulation and ADMET profiling. J. Mol. Struct.. 2022;1258:132652
- [CrossRef] [Google Scholar]
- A comprehensive and current review on the role of flavonoids in lung cancer-Experimental and theoretical approaches. Phytomedicine. 2022;98:153938
- [CrossRef] [Google Scholar]
- Optimization of the additive CHARMM all-atom protein force field targeting improved sampling of the backbone φ, ψ and side-chain χ(1) and χ(2) dihedral angles. J. Chem. Theory Comput.. 2012;8(9):3257-3273.
- [CrossRef] [Google Scholar]
- Pharmacophore modeling and 3D QSAR studies of aryl amine derivatives as potential lumazine synthase inhibitors. Arab. J. Chem.. 2017;10(1):S100-S104.
- [CrossRef] [Google Scholar]
- In silico identification of 1,2,4-triazoles as potential Candida Albicans inhibitors using 3D-QSAR, molecular docking, molecular dynamics simulations, and ADMET profiling. Mol. Divers. 2022
- [CrossRef] [Google Scholar]
- 3D-QSAR, molecular docking, molecular dynamic simulation, and ADMET study of bioactive compounds against candida albicans, Moroccan. J. Chem.. 2022;10(3):523-541.
- [CrossRef] [Google Scholar]
- CHARMM: the biomolecular simulation program. J. Comput. Chem.. 2009;30(10):1545-1614.
- [CrossRef] [Google Scholar]
- Miglitol: assessment of its role in the treatment of patients with diabetes mellitus. Ann. Pharmacother.. 2000;11:1291-1301.
- [CrossRef] [Google Scholar]
- Validation of the general purpose tripos 5.2 force field. J. Comput. Chem.. 1989;10:982-1012.
- [CrossRef] [Google Scholar]
- Costa F.G., Coutinho M.P.L., 2018. Diabetes mellitus and treatment: a study of social representations. MOJ Gerontology and Geriatrics, 3, 305-310. 10.15406/mojgg.2018.03.00138.
- Comparative molecular field analysis (CoMFA). 1. Effect of shape on binding of steroids to carrier proteins. J. Am. Chem. Soc.. 1988;110:5959-5967.
- [CrossRef] [Google Scholar]
- Empowerment and adherence to the therapeutic regimen in people with diabetes. Procedia. Soc. Behav. Sci.. 2015;171:289-293.
- [CrossRef] [Google Scholar]
- SwissADME: a free web tool to evaluate pharmacokinetics, drug-likeness and medicinal chemistry friendliness of small molecules. Sci. Rep.. 2017;7:42717.
- [CrossRef] [Google Scholar]
- A computer-aided drug design approach to explore novel type II inhibitors of c-Met receptor tyrosine kinase for cancer therapy: QSAR, molecular docking, ADMET and molecular dynamics simulations. J. Biomol. Struct. Dyn.. 2023;41:7768-7785.
- [CrossRef] [Google Scholar]
- Particle mesh Ewald: An N⋅log(N) method for Ewald sums in large systems. J. Chem. Phys.. 1993;98:10089-10092.
- [CrossRef] [Google Scholar]
- Discovery studio modeling environment. Dassault Systèmes; 2016.
- The PyMOL molecular graphics system. DeLano Scientific; 2002.
- Incidence and trends of childhood Type 1 diabetes worldwide 1990–1999. Diabet. Med.. 2006;23:857-866.
- [CrossRef] [Google Scholar]
- The nucleophilicity N index in organic chemistry. Org. Biomol. Chem.. 2011;9(20):7168-7175.
- [CrossRef] [Google Scholar]
- Quantitative characterization of the global electrophilicity power of common diene/dienophile pairs in Diels-Alder reactions. Tetrahedron. 2002;58(22):4417-4423.
- [CrossRef] [Google Scholar]
- Understanding the reactivity of captodative ethylenes in polar cycloaddition reactions. A theoretical study. J. Org. Chem.. 2008;73(12):4615-4624.
- [CrossRef] [Google Scholar]
- Reducing the intestinal side effects of acarbose by baicalein through the regulation of gut microbiota: An in vitro study. Food Chem.. 2022;394:133561
- [CrossRef] [Google Scholar]
- Spectroscopic and theoretical evidences for the surface binding of voglibose drug with DNA. Spectrochim. Acta A Mol. Biomol. Spectrosc.. 2022;271:120888
- [CrossRef] [Google Scholar]
- Design of new 3, 5-disubstituted indole as hematological anticancer agents using 3D-QSAR, molecular docking and drug-likeness studies. Mater. Today:. Proc.. 2021;45:7608-7614.
- [CrossRef] [Google Scholar]
- 3D-QSAR, molecular docking, simulation dynamic and ADMET studies on new quinolines derivatives against colorectal carcinoma activity. Biomolecular Structure and Dynamics. 2023;1–18
- [CrossRef] [Google Scholar]
- A smooth particle mesh Ewald method. J. Chem. Phys.. 1995;103:8577-8593.
- [CrossRef] [Google Scholar]
- Antiplasmodial and antimalarial activities of quinolone derivatives: An overview. Eur. J. Med. Chem.. 2018;146:1-14.
- [CrossRef] [Google Scholar]
- Frisch, M., 2009. GAUSSIAN 09. Revision E. 01, Gaussian Inc.
- Synthesis, in-Silico investigations, molecular docking, ADMET, and anti-lung cancer activity studies of 1,2,4,5-tetraazaspiro[5.5] undecane-3-thione. Chem. Phys.. 2023;574:112053
- [CrossRef] [Google Scholar]
- Natural Phyto-Bioactive Compounds for the Treatment of Type 2 Diabetes: Inflammation as a Target. Nutrients. 2016;8:461.
- [CrossRef] [Google Scholar]
- Molecular dynamics simulation for polymers in the presence of a heat bath. Physical Review a: General Physics. 1986;33(5):3628-3631.
- [CrossRef] [Google Scholar]
- Synthesis and biological evaluation of 3-amino-1,2,4-triazole derivatives as potential anticancer compounds. Bioorg. Chem.. 2020;104:104271
- [CrossRef] [Google Scholar]
- Molecular structures and properties of the complete series of bromophenols: Density functional theory calculations. Chem. A Eur. J.. 2005;109:5186-5192.
- [CrossRef] [Google Scholar]
- Diabetes mellitus-Definition, classification, diagnosis, screening and prevention. Wien. Klin. Wochenschr.. 2019;131:6-15.
- [CrossRef] [Google Scholar]
- Novel thiophene Chalcones-Coumarin as acetylcholinesterase inhibitors: Design, synthesis, biological evaluation, molecular docking, ADMET prediction and molecular dynamics simulation. Bioorg. Chem.. 2022;119:105572
- [CrossRef] [Google Scholar]
- Safety profile of acarbose, an alpha-glucosidase inhibitor. Drugs. 1999;3:47-53.
- [CrossRef] [Google Scholar]
- Assessing the performance of the molecular mechanics/Poisson Boltzmann surface area and molecular mechanics/generalized Born surface area methods. II. The accuracy of ranking poses generated from docking. J. Comput. Chem.. 2011;32(5):866-877.
- [CrossRef] [Google Scholar]
- Aromatic interactions. J. Chem. Soc., Perkin Transactions. 2001;2:651-669.
- [CrossRef] [Google Scholar]
- New carbazole linked 1,2,3-triazoles as highly potent non-sugar α-glucosidase inhibitors. Bioorg. Med. Chem.. 2017;74:72-81.
- [CrossRef] [Google Scholar]
- A further exploration of a nucleophilicity index based on the gas-phase ionization potentials. J. Mol. Struct. (Thoechem). 2008;865(1–3):68-72.
- [CrossRef] [Google Scholar]
- QSAR based virtual screening derived identification of a novel hit as a SARS CoV-229E 3CLpro Inhibitor: GA-MLR QSAR modeling supported by molecular Docking, molecular dynamics simulation and MMGBSA calculation approaches. Arab. J. Chem.. 2022;15(1):103499
- [CrossRef] [Google Scholar]
- CHARMM-GUI: a web-based graphical user interface for CHARMM. J. Comput. Chem.. 2008;29(11):1859-1865.
- [CrossRef] [Google Scholar]
- Comparison of simple potential functions for simulating liquid water. J. Chem. Phys.. 1983;79:926-935.
- [CrossRef] [Google Scholar]
- Therapeutic potential of α-glucosidase inhibitors in type 2 diabetes mellitus: an evidence-based review. Expert Opin. Pharmacother.. 2015;16:1959-1981.
- [CrossRef] [Google Scholar]
- Definition, classification and diagnosis of diabetes mellitus. Exp. Clin. Endocrinol. Diabetes. 2014;122:384-386.
- [CrossRef] [Google Scholar]
- Khaldan, A., El khatabi, K., El-mernissi, R., Hmamouchi, R., Sbai, A., Bouachrine, M., Lakhlifi, T., 2020. 3D-QSAR Modeling and Molecular Docking Studies of novel triazoles-quinine derivatives as antimalarial agents. Journal of Materials and Environmental Science, 11(3), 429-443.
- QSAR Study of α-Glucosidase Inhibitors for Benzimidazole Bearing Bis-Schiff Bases Using CoMFA, CoMSIA, and Molecular docking. International Journal of Quantitative Structure-Property Relationships. 2021;6:9-24.
- [CrossRef] [Google Scholar]
- 3D-QSAR modeling, molecular docking and ADMET properties of benzothiazole derivatives as a-glucosidase inhibitors. Mater. Today:. Proc.. 2021;45:7643-7652.
- [CrossRef] [Google Scholar]
- Identification of potential α-glucosidase inhibitors: 3D-QSAR modeling, molecular docking approach. Rhazes: Green and Applied. Chemistry. 2021;12:60-75.
- [CrossRef] [Google Scholar]
- Prediction of potential inhibitors of SARS-CoV-2 using 3D-QSAR, molecular docking modeling and ADMET properties. Heliyon. 2021;7:e06603.
- [Google Scholar]
- Computational study of quinoline-based thiadiazole compounds as potential antileishmanial inhibitors. New J. Chem.. 2022;46:17554.
- [CrossRef] [Google Scholar]
- In Silico Study of 2,4,5-trisubstituted Thiazoles as Inhibitors of Tuberculosis Using 3D-QSAR, Molecular Docking, and ADMET Analysis. El-Cezeri Fen Ve Mühendislik Dergisi. 2022;9:452-468.
- [CrossRef] [Google Scholar]
- In silico design of new α-glucosidase inhibitors through 3D-QSAR study, molecular docking modeling and ADMET analysis. Moroccan. J. Chem.. 2022;10(1):22-36.
- [CrossRef] [Google Scholar]
- Molecular Docking, ADMET Prediction, and Quantum Computational on 2-Methoxy Benzoyl Hydrazone Compounds as Potential Antileishmanial Inhibitors. Biointerface Research in Applied Chemistry. 2022;13:302.
- [CrossRef] [Google Scholar]
- Molecular similarity indices in a comparative analysis (CoMSIA) of drug molecules to correlate and predict their biological activity. J. Med. Chem.. 1994;37:4130-4146.
- [CrossRef] [Google Scholar]
- Evaluation of the FLEXX incremental construction algorithm for protein-ligand docking. Proteins. 1999;37(2):228-241.
- [CrossRef] [Google Scholar]
- CHARMM-GUI Input Generator for NAMD, GROMACS, AMBER, OpenMM, and CHARMM/OpenMM Simulations Using the CHARMM36 Additive Force Field. J. Chem. Theory Comput.. 2016;12(1):405-413.
- [CrossRef] [Google Scholar]
- Synthesis and evaluation of antitumor activities of novel chiral 1,2,4-triazole Schiff bases bearing γ-butenolide moiety. Org. Med. Chem. Lett.. 2012;2:26.
- [CrossRef] [Google Scholar]
- Identify promising IKK-b inhibitors: A docking-based 3D-QSAR study combining molecular design and molecular dynamics simulation. Arab. J. Chem.. 2022;15:103786
- [CrossRef] [Google Scholar]
- Experimental and computational approaches to estimate solubility and permeability in drug discovery and development settings. Adv. Drug Deliv. Rev.. 1997;23(1–3):3-25.
- [CrossRef] [Google Scholar]
- Theoretical investigations on the HOMO–LUMO gap and global reactivity descriptor studies, natural bond orbital, and nucleus-independent chemical shifts analyses of 3-phenylbenzo[d]thiazole-2(3H)-imine and its para-substituted derivatives: Solvent and substituent effects. J. Chem. Res.. 2021;2021:147-158.
- [CrossRef] [Google Scholar]
- Management of hyperglycaemia in type 2 diabetes: a consensus algorithm for the initiation and adjustment of therapy. A consensus statement from the American Diabetes Association and the European Association for the Study of Diabetes. Diabetologia. 2006;49:1711-1721.
- [CrossRef] [Google Scholar]
- Degradation kinetics of fluvoxamine in buffer solutions: In silico ADMET profiling and identification of degradation products by LC-MS/ESI. Arab. J. Chem.. 2020;13:4134-4146.
- [CrossRef] [Google Scholar]
- A molecular dynamics method for simulations in the canonical ensemble. Mol. Phys.. 1984;52(2):255-268.
- [CrossRef] [Google Scholar]
- Constant pressure molecular dynamics for molecular systems. Mol. Phys.. 1983;50(5):1055-1076.
- [CrossRef] [Google Scholar]
- Combined computational approaches for developing new anti-Alzheimer drug candidates: 3D-QSAR, molecular docking and molecular dynamics studies of liquiritigenin derivatives. Heliyon. 2022;8:e11991.
- [Google Scholar]
- The effect of voglibose on metabolic profiles in patients with type 2 diabetes mellitus: A systematic review and meta-analysis of clinical trials. Pharmacol. Res.. 2020;159:104988
- [CrossRef] [Google Scholar]
- Inhibition of human α-amylase by dietary polyphenols. J. Funct. Foods. 2015;19:723-732.
- [CrossRef] [Google Scholar]
- Structure-odor relationship in pyrazines and derivatives: A physicochemical study using 3D-QSPR, HQSPR, Monte Carlo, molecular docking, ADME-Tox and molecular dynamics. Arab. J. Chem.. 2023;16:105207
- [CrossRef] [Google Scholar]
- Application of the Principle of Hard and Soft Acids and Bases to Organic Chemistry. J. Am. Chem. Soc.. 1967;89(8):1827-1836.
- [CrossRef] [Google Scholar]
- Scalable molecular dynamics with NAMD. J. Comput. Chem.. 2005;26(16):1781-1802.
- [CrossRef] [Google Scholar]
- Methoxy and methylthio-substituted trans-stilbene derivatives as CYP1B1 inhibitors – QSAR study with detailed interpretation of molecular descriptors. Arab. J. Chem.. 2022;15:104204
- [CrossRef] [Google Scholar]
- pkCSM: Predicting smallmolecule pharmacokinetic and toxicity properties using graph-based signatures. J. Med. Chem.. 2015;58(9):4066-4072.
- [CrossRef] [Google Scholar]
- Design, Synthesis, and Biological Evaluation of 1,2,4-Thiadiazole-1,2,4-Triazole Derivatives Bearing Amide Functionality as Anticancer Agents. Arab. J. Sci. Eng.. 2021;46:225-232.
- [CrossRef] [Google Scholar]
- A brief review and table of semiempirical parameters used in the Hueckel molecular orbital method. J. Chem. Eng. Data. 1967;12:235-246.
- [CrossRef] [Google Scholar]
- Synthesis, in vitro evaluation and molecular docking studies of thiazole derivatives as new inhibitors of α-glucosidase. Bioorg. Chem.. 2015;62:15-21.
- [CrossRef] [Google Scholar]
- Nomenclature and Chemistry of Three-to-Five Membered Heterocycles. The Chemistry of Heterocycles. 2019;149–478
- [CrossRef] [Google Scholar]
- On some aspects of validation of predictive quantitative structure–activity relationship models. Expert Opin. Drug Discov.. 2007;2:1567-1577.
- [CrossRef] [Google Scholar]
- Y-randomization and its variants in QSPR/QSAR. J. Chem. Inf. Model.. 2007;47:2345-2357.
- [CrossRef] [Google Scholar]
- HOMO−LUMO Gap as an Index of Molecular Size and Structure for Polycyclic Aromatic Hydrocarbons (PAHs) and Asphaltenes: A Theoretical Study. Chem. A Eur. J.. 2002;106(46):11283-11308.
- [CrossRef] [Google Scholar]
- Numerical integration of the cartesian equations of motion of a system with constraints: molecular dynamics of n-alkanes. J. Comput. Phys.. 1977;23(3):327-341.
- [CrossRef] [Google Scholar]
- The novel 4-hydroxyphenylpyruvate dioxygenase inhibitors in vivo and in silico approach: 3D-QSAR analysis, molecular docking, bioassay and molecular dynamics. Arab. J. Chem.. 2022;15:103786
- [CrossRef] [Google Scholar]
- Multivariate data analysis and experimental design in biomedical research. Prog. Med. Chem.. 1988;25:291-338.
- [CrossRef] [Google Scholar]
- Synthesis and biological evaluation of some Schiff bases of 4-amino-5-(4-methylsulfonyl)benzyl-2,4-dihydro-3H-[1,2,4]-triazole-3-thione. Med. Chem. Res.. 2013;2013(22):2921-2928.
- [CrossRef] [Google Scholar]
- Novel quinoline derivatives as potent in vitro α-glucosidase inhibitors: in silico studies and SAR predictions. MedChemComm. 2015;6:1826-1836.
- [CrossRef] [Google Scholar]
- Synthesis of Novel Triazinoindole-Based Thiourea Hybrid: A Study on α-Glucosidase Inhibitors and Their Molecular Docking. Molecules. 2019;2019(24):3819.
- [CrossRef] [Google Scholar]
- Synthesis of quinoline derivatives as diabetic II inhibitors and molecular docking studies. Bioorg. Med. Chem.. 2019;27:4081-4088.
- [CrossRef] [Google Scholar]
- 1,2,4-Triazole and 1,3,4-oxadiazole analogues: Synthesis, MO studies, in silico molecular docking studies, antimalarial as DHFR inhibitor and antimicrobial activities. Bioorg. Med. Chem.. 2017;25:4064-4075.
- [CrossRef] [Google Scholar]
- AutoDock Vina: improving the speed and accuracy of docking with a new scoring function, efficient optimization, and multithreading. J. Comput. Chem.. 2010;3(2):455-461.
- [CrossRef] [Google Scholar]
- A comparison of different electrostatic potentials on prediction accuracy in CoMFA and CoMSIA studies. Eur. J. Med. Chem.. 2010;45:1544-1551.
- [CrossRef] [Google Scholar]
- End-Point Binding Free Energy Calculation with MM/PBSA and MM/GBSA: Strategies and Applications in Drug Design. Chem. Rev.. 2019;119(16):9478-9508.
- [CrossRef] [Google Scholar]
- Studies on the antibacterial activities and molecular mechanism of GyrB inhibitors by 3D-QSAR, molecular docking and molecular dynamics simulation. Arab. J. Chem.. 2022;15:103872
- [CrossRef] [Google Scholar]
- Validation of QSAR’s. Quantitative Structure Activity Relation. 1991;10:191-193.
- [CrossRef] [Google Scholar]
- Azide-alkyne cycloaddition towards 1H–1,2,3-triazole-tethered gatifloxacin and isatin conjugates: Design, synthesis and in vitro anti-mycobacterial evaluation. Eur. J. Med. Chem.. 2017;138:66-71.
- [CrossRef] [Google Scholar]
- Syntheses, in vitro α-amylase and α-glucosidase dual inhibitory activities of 4-amino-1,2,4-triazole derivatives their molecular docking and kinetic studies. Bioorg. Med. Chem.. 2020;28:115467
- [CrossRef] [Google Scholar]
- Extension of the CHARMM General Force Field to sulfonyl-containing compounds and its utility in biomolecular simulations. J. Comput. Chem.. 2012;33(31):2451-2468.
- [CrossRef] [Google Scholar]
- Antibacterial study of 3-(2-amino-6-phenylpyrimidin-4-yl)-N-cyclopropyl-1-methyl-1Hindole-2-carboxamide derivatives: CoMFA, CoMSIA analyses, molecular docking and ADMET properties prediction. J. Mol. Struct.. 2018;1177:275-285.
- [CrossRef] [Google Scholar]
- Effects of acarbose on the gut microbiota of prediabetic patients: A randomized, double-blind, controlled crossover trial. Diabetes Therapy. 2017;8(2):293-307.
- [CrossRef] [Google Scholar]
Appendix A
Supplementary data
Supplementary data to this article can be found online at https://doi.org/10.1016/j.arabjc.2024.105656.
Appendix A
Supplementary data
The following are the Supplementary data to this article:Supplementary data 1
Supplementary data 1


