

Translate this page into:
Design, synthesis, and biological evaluation of benzenesulfonyl chloride-substituted evodiamine derivatives as potential PGAM1 inhibitors
⁎Corresponding authors. guohui@sntcm.edu.cn (Hui Guo), wangyw09@gmail.com (Yuwei Wang), yupingtang@sntcm.edu.cn (Yuping Tang)
-
Received: ,
Accepted: ,
This article was originally published by Elsevier and was migrated to Scientific Scholar after the change of Publisher.
Abstract
Evodiamine (EVO) is a quinazoline carboline alkaloid isolated from the fruits of the traditional Chinese herb Evodiae fructus. In the present study, we synthesized thirty EVO derivatives (9–38) with various benzenesulfonyl groups by sulfonylation of the amino group of 3-NH-EVO and thirty benzenesulfonyl chloride substituents. The results of the MTT assay showed that most of the compounds had good antitumor activity on H460, PC9, PC9/GR, H1299 and SW620 cancer cells as well as on normal LO2 cells. Among them, compounds 9, 18 and 28 were more potent than other compounds on H460 cell lines with an IC50 value of 9.1 M, 10.5 M and 9.5 M, respectively, even more potent than the positive PGMI-004A with one IC50 of 31.1 M. The enzymatic activity of representative compounds was further evaluated against phosphoglycerate mutase 1 (PGAM1). The results showed that compound 11 with an IC50 of 0.062 μM and compound 34 with an IC50 of 0.059 μM were similar to the positive drug’s IC50 of 0.052 μM. These results indicated that these compounds could be developed into potential PGAM1 inhibitors. In addition, compounds 9, 18, and 28 could induce apoptosis, block the cell cycle at the G2/M stage, lead to bursting of reactive oxygen species, and induce mitochondrial dysfunction. Overall, the present work showed that the benzenesulfonyl chloride-substituted evodiamine derivatives have good antitumor activity against tumor cells and show promise as anticancer agents.
Keywords
Benzenesulfonyl chloride
Evodiamine
Phosphoglycerate mutase 1 inhibitor
Structure-activity relationship

1 Introduction
According to Global Cancer Statistics 2020, the number of new cancer cases reached 19.3 million worldwide, and nearly 10 million people died from these diseases in 2020 (Sung et al., 2021). There are four conventional treatments for cancer: surgery, radiation, chemotherapy, and targeted therapy. As the metabolism of tumor cells r the Achilles' heel of cancer (Romero-Garcia et al., 2011), it is now at the center of anticancer drug development. Previous studies have reported on small molecule targeting to isocitrate dehydrogenase (IDH) (Tang et al., 2014), pyruvate kinase M2 (PKM2) (Anastasiou et al., 2012), mammalian target of rapamycin (mTOR) (Abou Daher et al., 2022; Zhang et al., 2021), and PGAM1 (Liu et al., 2022). Therefore, the modulation of tumor cell metabolism is possibly a novel approach in cancer therapy. More recently, other small molecules that target PGAM1 have been identified (Shen et al., 2019).
PGAM1 is a key enzyme in the eighth step of glycolysis, converting 3-phosphoglycerate (3-PG) to 2-phosphoglycerate (2-PG) (Huang et al., 2019). As PGAM1 regulates glycolysis and biosynthesis, inhibitors targeting it could block both catabolism and anabolism in tumor cells (Chaneton and Gottlieb, 2012). PGAM1 is upregulated in various tumors and its expression correlates with cancer prognosis (Liu et al., 2018; Li et al., 2015; Peng et al., 2016). Posttranslational PGAM1 modulations such as Y26 phosphorylation and K100 deacetylation have also been described (Xu et al., 2014). These transformations could promote cancer cell proliferation and tumor growth, activate homologous recombination repair by regulating the deoxyribonucleotide triphosphate nucleoside (dNTP) pool (Qu et al., 2017), and facilitate cancer cells migration independent of their metabolic functions (Zhang et al., 2017). The findings suggest that PGAM1 is a promising target during cancer treatment.
As PGAM1 is overexpressed in many types of cancers and mediates the processes of tumor growth, migration, and invasion, it is now considered to be a potential target for cancer therapy. Currently, dozens of PGAM1 inhibitors have been developed for cancer therapy (Fareed et al., 2021). According to chemical composition and mode of action, these inhibitors were classified into five subcategories (Fig. 1): spiroepoxides, alizarin derivatives, xanthone derivatives, mangostin derivatives, and miscellaneous inhibitors (Yang et al., 2022a). The anthraquinone derivative 2(PGMI-004A), 3(HKB99) (Chow and Khan, 2022) and the xanthone derivative 4 (Zhuang et al., 2017) containing sulfonamide substituents exhibit moderate inhibitory activity against both PGAM1 and proliferation of cancer cells. As sulfonamides are broad-spectrum antibacterial drugs with the advantages of low price, ease of use, rapid oral absorption, relative stability, low spoilage, large yield, and a wide variety of products, so sulfonamide compounds have a wide range of antibacterial, anti-tumor, anti-inflammatory, antiviral and other biological activities (Awakawa et al., 2021; Azevedo-Barbosa et al., 2019). According to relevant data, many sulfonamides have shown anticancer activity (Han et al., 2017). The structure can be optimized by assembling the sulfonamide part with heterocyclic or other related pharmacodynamics groups (Hitosugi et al., 2012).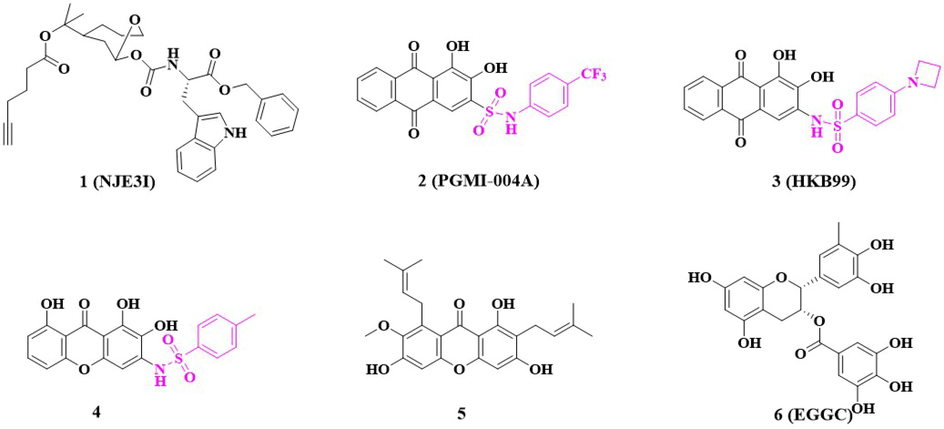
Reported phosphoglycerate mutase 1(PGAM1) inhibitors.
EVO is the main alkaloid in the traditional Chinese medicine preparation dogwood (Zhang et al., 2013), which promotes catecholamine secretion (Zhao et al., 2010), exhibits anti-inflammatory properties (Liao et al., 2011), functions as an analgesic (Zhang et al., 2020), acts as an antitumor agent (Hu et al., 2017), and regulates body temperature and uterine contractions. Pharmacological studies have demonstrated that EVO has a strong antiproliferative efficacy against lung, colon, and breast cancers (Luo et al., 2021; Xu et al., 2012). Our research team synthesized several EVO derivatives with substituents such as –OCH3, –OH, and –NH and found that substituting –OH and –NH at the 3-NH position of EVO-generated derivatives resulted in the most potent inhibitory efficacy against breast, colon, and lung cancer cell lines (Yang et al., 2022b; Liang et al., 2022). Therefore, combining EVO with a benzosulfonamide fragment, a key component of PGAM1 inhibitors, may result in potent cytotoxicity and effective targeting of the PGAM1 enzyme. In this study, we designed and synthesized a series of PGAM1 inhibitors by introducing various benzenesulfonyl chloride substitutions into 3-NH-EVO.
2 Results and discussion
2.1 Synthetic chemistry
The process by which the EVO derivatives were prepared is delineated in Scheme 1. First, 3-NH-EVO (compound 7; 100 mg; 1 mmol) and anhydrous pyridine (3 mL) were added to a 10 mL reaction flask. The mixture was stirred until dissolved. Then 4-trifluoromethylbenzenesulfonly chloride (compound 8; 115.22 mg; 1.5 mmol) was added, the mixture was stirred at room temperature (25 ℃) for 4 h, and the reaction was monitored by thin-layer chromatography (TLC). Then 20% (v/v) hydrochloric acid (HCl; 20 mL) and 20 mL ethyl acetate were added and the mixture was extracted three times until the pyridine was completely removed. Anhydrous sodium sulfate was then added to the mixture to dry it. The dehydrated mixture was vacuum-distilled and purified by chromatography using 80:1 (v/v) CH2Cl2:CH3OH solvent mixture, and a light yellow solid was obtained. The final yield was 97.6%. All other compounds (9–38) were synthesized using the foregoing procedure.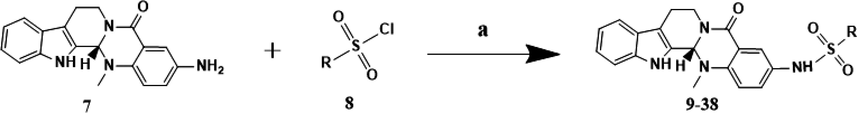
Synthesis of compounds 9–38. Reagents and conditions: (a) anhydrous pyridine, rt, 25 ℃.
2.2 PGAM1 inhibition activity of target compounds
The inhibiting effect of the target compounds against PGAM1 was assessed, and PGMI-004A was used as the positive control. Table 1 shows that the enzymatic activity of the target compounds was further evaluated against PGAM1, most compounds exhibited good to excellent inhibitory efficacy against PGAM1 and the IC50 was in the range of 0.059–3.43 μM. Of particular note, compound 11 with IC50 of 0.062 μM and compound 34 with IC50 of 0.059 μM had enzymatic activity comparable to that of a positive drug with IC50 of 0.052 μM. These results indicate that these compounds have a certain inhibitory effect on PGAM1.
Comp-ounds
R
IC50 (µM) a
SI b
PGAM1
H460
PC9
PC9/GR
H1299
SW620
LO2
9

1.99 ± 0.10
9.1 ± 0.9
11.6 ± 1.1
24.6 ± 1.4
22.3 ± 1.4
16.1 ± 1.2
211.3 ± 3.4
23.2
10

3.06 ± 0.18
30.1 ± 1.5
>40
32.4 ± 1.5
>40
13.8 ± 1.1
91.1 ± 2.1
3.0
11

0.062 ± 0.001
29.6 ± 1.5
12.9 ± 1.1
31.7 ± 1.5
>40
27.4 ± 1.4
162.7 ± 1.8
5.5
12

0.12 ± 0.02
15.9 ± 1.2
13.9 ± 1.1
37.3 ± 1.6
>40
27.9 ± 1.5
138.9 ± 1.5
8.7
13

3.25 ± 0.15
>40
>40
>40
>40
35.4 ± 1.6
191.7 ± 2.2
<4.8
14

>10
>40
>40
>40
>40
>40
106.1 ± 1.2
<2.7
15

>10
23.5 ± 1.4
11.1 ± 1.0
>40
>40
30.2 ± 1.5
91.65 ± 1.7
3.9
16

0.19 ± 0.01
>40
>40
>40
>40
30.1 ± 1.5
108.4 ± 1.9
<2.7
17

0.17 ± 0.01
>40
28.7 ± 1.5
>40
>40
23.9 ± 1.4
99.7 ± 1.4
<2.5
18

0.14 ± 0.01
10.5 ± 1.0
15.5 ± 1.2
19.3 ± 1.3
>40
16.6 ± 1.2
226.3 ± 3.2
21.6
19

0.14 ± 0.01
>40
>40
>40
>40
>40
161.3 ± 1.5
<4.0
20

2.86 ± 0.16
>40
>40
>40
>40
>40
117.5 ± 1.2
<2.9
21

>10
>40
>40
>40
>40
>40
127.3 ± 1.2
<3.2
22

>10
11.4 ± 1.1
10.5 ± 1.0
21.1 ± 1.3
19.4 ± 1.3
17.2 ± 1.2
180.6 ± 5.5
15.8
23

0.19 ± 0.01
>40
>40
>40
>40
>40
93.61 ± 1.4
<2.3
24

1.30 ± 0.09
>40
>40
>40
>40
>40
288.4 ± 2.6
<7.2
25

0.28 ± 0.02
>40
16.2 ± 1.2
>40
>40
>40
210.6 ± 2.0
<5.3
26

>10
29.1 ± 1.5
28.6 ± 1.5
>40
>40
27.8 ± 1.4
99.6 ± 1.4
3.4
27

3.43 ± 0.15
>40
>40
>40
>40
>40
80.5 ± 1.3
<2.0
28

0.17 ± 0.01
9.5 ± 0.9
10.6 ± 1.0
19.6 ± 1.3
25.4 ± 1.4
13.0 ± 1.1
174.7 ± 2.1
18.4
29

0.18 ± 0.02
14.7 ± 1.2
11.3 ± 1.1
29.1 ± 1.5
22.5 ± 1.4
33.9 ± 1.9
114.2 ± 2.2
7.8
30

>10
28.9 ± 1.5
16.3 ± 1.2
37.4 ± 1.6
>40
36.1 ± 1.6
108.5 ± 1.9
3.7
31

0.59 ± 0.04
>40
>40
>40
>40
31.4 ± 1.5
37.7 ± 1.0
<0.9
32

>10
33.2 ± 1.5
34.6 ± 1.5
>40
>40
31.9 ± 1.5
65.0 ± 1.8
2.0
33

>10
29.8 ± 1.5
5.4 ± 0.7
29.2 ± 1.5
>40
>40
119.7 ± 2.0
4.0
34

0.059 ± 0.001
>40
>40
>40
>40
35.9 ± 1.6
76.5 ± 1.6
<1.9
35

>10
30.5 ± 1.5
18.0 ± 1.3
33.9 ± 1.5
>40
16.7 ± 1.2
72.9 ± 2.1
2.4
36

0.41 ± 0.06
>40
>40
>40
>40
>40
66.7 ± 1.5
<1.7
37

>10
22.2 ± 1.4
7.1 ± 0.9
21.4 ± 1.3
>40
11.9 ± 1.1
88.8 ± 1.5
4
38

>10
>40
>40
>40
>40
>40
166.7 ± 2.6
<4.2
PGMI-004A
–
0.052 ± 0.10
31.1 ± 0.2
27.2 ± 0.3
33.3 ± 0.4
24.0 ± 0.5
>40
163.9 ± 2.9
5.3
2.3 Relative efficacies of various compounds at inhibiting cancer cell proliferation
Antiproliferative activity of all target compounds against five human solid cancer cell lines, including H460, PC9, PC9/GR, H1299, and SW620, and one human normal liver cell line, LO2, for 72 h were studied by MTT assays. PGMI-004A was employed as the positive control. As shown in Table 1, most of the compounds had an antitumor efficacy on these cancer cells with IC50 ranging from 9.1 to 37.4 µM, in which compounds 9, 18 and 28 on H460 cell lines and PC9 cell lines were more effective than other compounds. On H460 cells, the IC50 of 9.1 µM, 10.5 µM and 9.5 µM, respectively, even more than the positive PGMI-004A with IC50 of 31.1 µM. On PC9 cells, the IC50 of 11.6 µM, 15.5 µM and 10.6 µM, respectively, even more than the positive PGMI-004A with IC50 of 27.2 µM. Upon further observation, it was found that compounds 9, 18 and 28 containes the substituent Fluoride. And Fluoride can significantly improve the lipophilicity of the drug because of its electronegativity, thereby increasing the bioavailability and permeability of the drug on various biofilms, thus enabling the drug to bind to its respective targets, such as cellular receptors, proteins and enzymes (Müller et al., 2007). The replacement of the Fluoride with other substituents (Cl, Br, I, NO2, Me, OMe, etc) resulted in a slight decrease in antiproliferative activity. Furthermore, it can be observed that the number and position of the same substituent on the benzene ring have an impact on cell activity. For example, the greater the number of fluorine substituents, the stronger the activity. The fluorine substituent exhibits the highest activity at the para position, followed by the meta position, and the ortho position shows the weakest activity.
In particular, not only compounds 9, 18 and 28 showed a potent antiproliferative effect in cancer cells, but also their selectivity significantly increased (Table 1). The selectivity index (SI), defined as the ratio of the IC50 value in normal liver cells LO2 to that in H460 cells, was 5.3 for PGMI-004A, and the SI value of compounds 9, 18 and 28 were increased to 23.2 (4.4 fold), 21.6 (4.1 fold) and 18.4 (3.5 fold), respectively. Compounds 9, 18 and 28 exhibited weak cytotoxicity on LO2 cells which was shown that these compounds kill cancer cells selectively over normal cells. Compounds 9, 18, and 28 demonstrate good cellular activity, but their activity against PGAM1 enzyme is moderate. This could be attributed to the possibility that these compounds may have other targets besides PGAM1 enzyme.
2.4 The partition coefficient and water solubility of the target compounds were calculated
In general, the calculated partition coefficient (clogP) value is a good index in estimating the distribution of drugs within the cells. We calculated clogP values of target compounds (Table 2), almost all of which are less than 5, the results indicated that target compounds would enhance its lipophilicity and yield much favorable transmembrane permeability. The ESOL model is a QSPR model establishing the linear relationship between log S and five molecular parameters, the model is predicting log S values, which is also translated within SwissADME into solubility in mg/mL. Finally a qualitative estimation of the solubility class is given according to the following log S scale: insoluble < -10 < poorly < -6 < moderately < -4 < soluble < -2 < very < 0 < highly (Daina et al., 2017). Most compounds have moderate or poor water solubility (Table 2). This could be due to the presence of hydrophobic groups in the molecular structure, making it difficult to dissolve in water.
Compounds
clogP a
Water Solubility b
Log S
Solubility (μg/mL)
Class
9
4.04
−5.4
0.00188
Moderately soluble
10
3.34
−6.1
0.000417
Poorly soluble
11
3.52
−5.38
0.000724
Moderately soluble
12
3.62
−6.15
0.000378
Poorly soluble
13
2.79
−5.19
0.00314
Moderately soluble
14
3.69
−6.15
0.000378
Poorly soluble
15
3.64
−6.15
0.000378
Poorly soluble
16
2.42
−5.3
0.00251
Moderately soluble
17
3.66
−6.41
0.000226
Poorly soluble
18
3.89
−5.4
0.00188
Moderately soluble
19
4.57
−7.03
0.0000526
Poorly soluble
20
4.14
−6.43
0.000196
Poorly soluble
21
4.05
−6.43
0.000196
Poorly soluble
22
3.31
−6.31
0.000264
Poorly soluble
23
4.01
−6.31
0.000264
Poorly soluble
24
3.03
−5.54
0.00159
Moderately soluble
25
5.7
−7.85
0.00000827
Poorly soluble
26
4.23
−6.53
0.000153
Poorly soluble
27
4.94
−7.31
0.000028
Poorly soluble
28
3.94
−5.32
0.00235
Moderately soluble
29
4.31
−6.27
0.000296
Poorly soluble
30
3.4
−5.54
0.00135
Moderately soluble
31
3.93
−6.36
0.00022
Poorly soluble
32
4.4
−6.71
0.000104
Poorly soluble
33
2.91
−6.31
0.000264
Poorly soluble
34
4.8
−7.21
0.0000335
Poorly soluble
35
3.34
−5.4
0.00188
Moderately soluble
36
2.86
−5.39
0.00209
Moderately soluble
37
3.03
−5.21
0.00294
Moderately soluble
38
3.63
−5.56
0.00135
Moderately soluble
PGMI-004A
3.35
−5.81
0.000722
Moderately soluble
2.5 Compounds 9, 18, and 28 induced apoptosis in H460 and PC9 cells
Flow cytometry analysis and Annexin V-FITC/Propidium Iodide (PI) assay were conducted to investigate tumor cell apoptosis of compounds 9, 18, 28 and the positive PGMI-004A. H460 and PC9 cells were incubated with compounds 9, 18, 28 and positive PGMI-004A at the concentrations of 2.5, 5 and 10 μM, respectively. As shown in Fig. 2, compounds 9, 18, 28 and positive PGMI-004A effectively induced the apoptosis in H460 and PC9 cell lines in a concentration-dependent manner. At the concentration of 2.5 μM, the percentages of apoptotic H460 cells induced by compounds 9, 18, 28 and positive PGMI-004A were 17.78%, 15.75%, 14.71% and 5.19%, respectively. The percentages of apoptotic PC9 cells induced by compounds 9, 18, 28 and positive PGMI-004A were 6.35%, 6.20%, 6.52% and 4,56%, respectively. When the concentration was increased to 10 μM, the percentages of apoptotic H460 cells of compounds 9, 18, 28 and positive PGMI-004A were increased accordingly to 43.65%, 44.70%, 33.48% and 7.89%, respectively. The percentages of apoptotic PC9 cells of compounds 9, 18, 28 and positive PGMI-004A were increased accordingly to 19.29%, 22.67%, 21.40% and 11.12%, respectively. The results indicated that compounds 9, 18 and 28 could effectively induce cell apoptosis, which is more potent than PGAM1 inhibitor PGMI-004A. In addition, H460 cells were more sensitive by comparing apoptosis rates.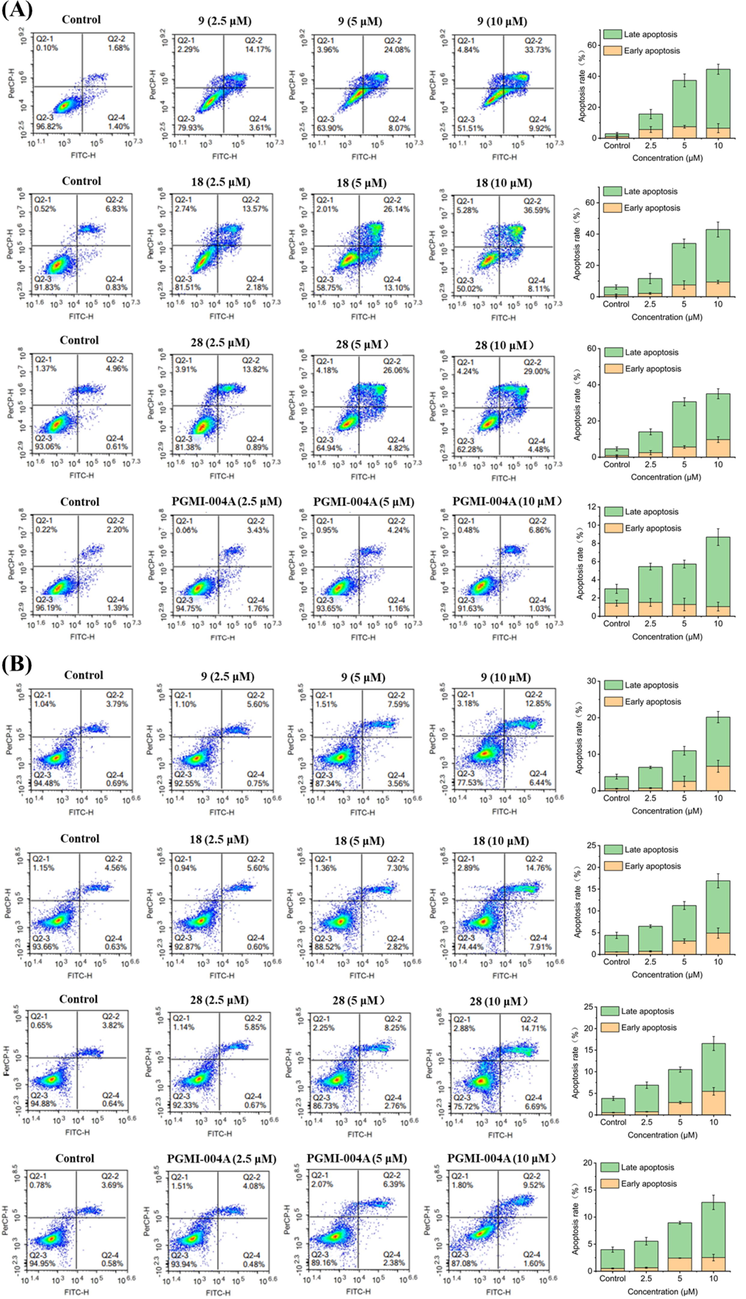
Effects of compounds on cell apoptosis. (A) H460 cells were treated with compounds 9, 18, 28 and positive PGMI-004A for 48 h. (B) PC9 cells were treated with compounds 9, 18, 28 and positive PGMI-004A for 48 h. At least three independent experiments were done for each condition.
2.6 Compounds 9, 18, and 28 arrested the H460 and PC9 cells cycle at the G2 phase
Flow cytometry was used to investigate the effects of compounds 9, 18, 28 on H460 and PC9 cell cycle progression (Fig. 3). PGMI-004A was used as positive control. H460 cells were treated with compounds at the concentration of 2.5 μM, 5 μM, and 10 μM for 48 h, respectively. The results revealed that the cell proportion of G2 phase changed dramatically in a concentration-dependent manner (9: 18.96%, 45.74%, and 48.97%, respectively; 18: 25.57%, 45.97%, and 51.95%, respectively; 28: 13.98%, 18.17%, and 51.17%, respectively). Moreover, the ratio of cells exposed to PGMI-004A at the G2 phase was 17.04%, 18.60%, and 23.60%, respectively. PC9 cells were treated with compounds at the concentration of 2.5 μM, 5 μM, and 10 μM for 48 h, respectively. The results revealed that the cell proportion of G2 phase changed dramatically in a concentration-dependent manner (9: 55.45%, 72.78%, and 81.68%, respectively; 18: 52.06%, 66.81%, and 74.23%, respectively; 28: 17.39%, 34.00%, and 76.63%, respectively). Moreover, the ratio of cells exposed to PGMI-004A at the G2 phase was 19.03%, 18.98%, and 17.33%, respectively. The initial results suggest that all three compounds exhibited antiproliferative activity through arrested H460 and PC9 cells at G2 phase. In addition, PC9 cells were more sensitive to cycle arrest in comparison.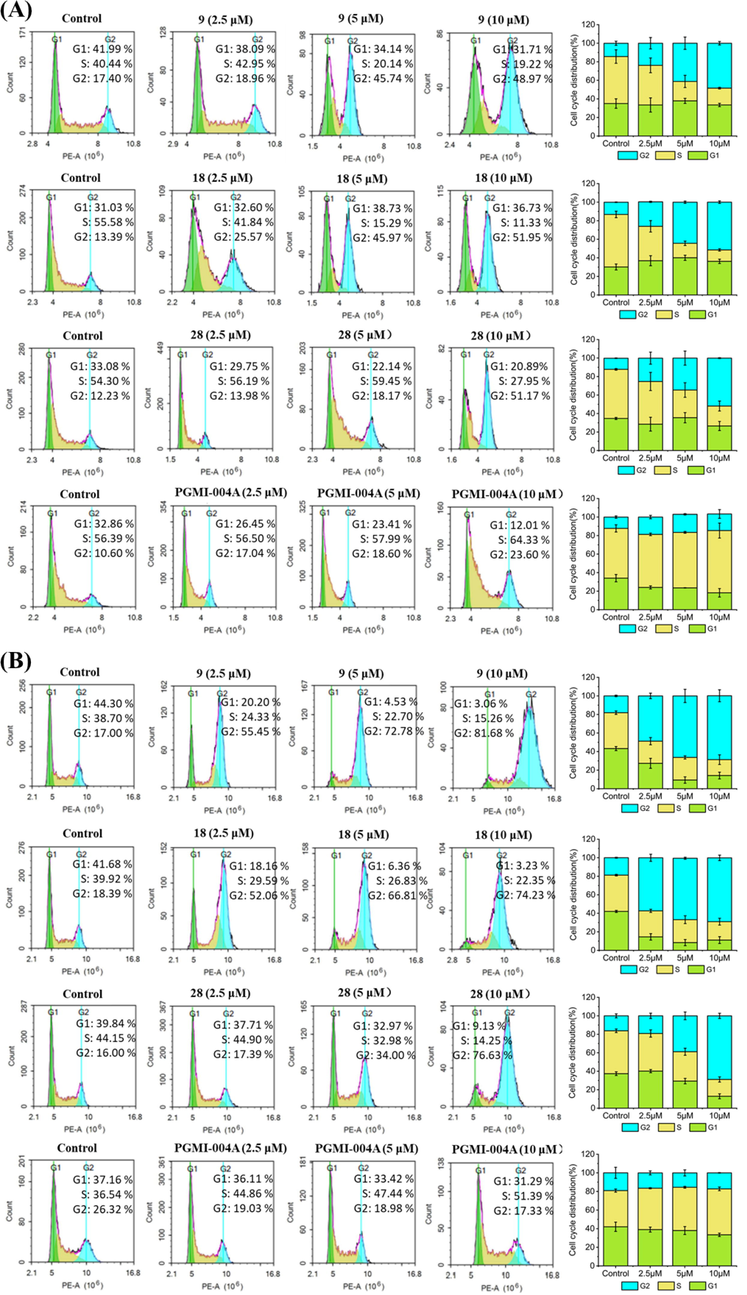
Effects of compounds on cell cycle. (A) H460 cells were treated with compounds 9, 18 and 28 for 48 h. (B) PC9 cells were treated with compounds 9, 18 and 28 for 48 h. At least three independent experiments were done for each condition.
2.7 Compounds 5, 14 and 24 caused ROS burst in H460 and PC9 cells
At low concentrations, reactive oxygen species (ROS) act as signal molecules that drive and accelerate tumor proliferation and progression. Specific chemotherapeutic agents enhance oxidative stress and are selectively cytotoxic to tumor cells (Fig. 4). Thus, triggering ROS bursts may feasibly initiate apoptosis in tumor cells. We used a 2′,7′-dichlorodihydrofluorescein diacetate (DCFH-DA) fluorescence probe to detect ROS levels in cancer cells subjected to compounds 9, 18, and 28. Fig. 4 shows that H460 and PC9 cells were treated at 2.5 μM, 5 μM and 10 μM for 48 h, respectively, all three compounds exhibited antiproliferative activity through stimulate ROS production in H460 and PC9 cells, and the proportions increased in a concentration-dependent manner.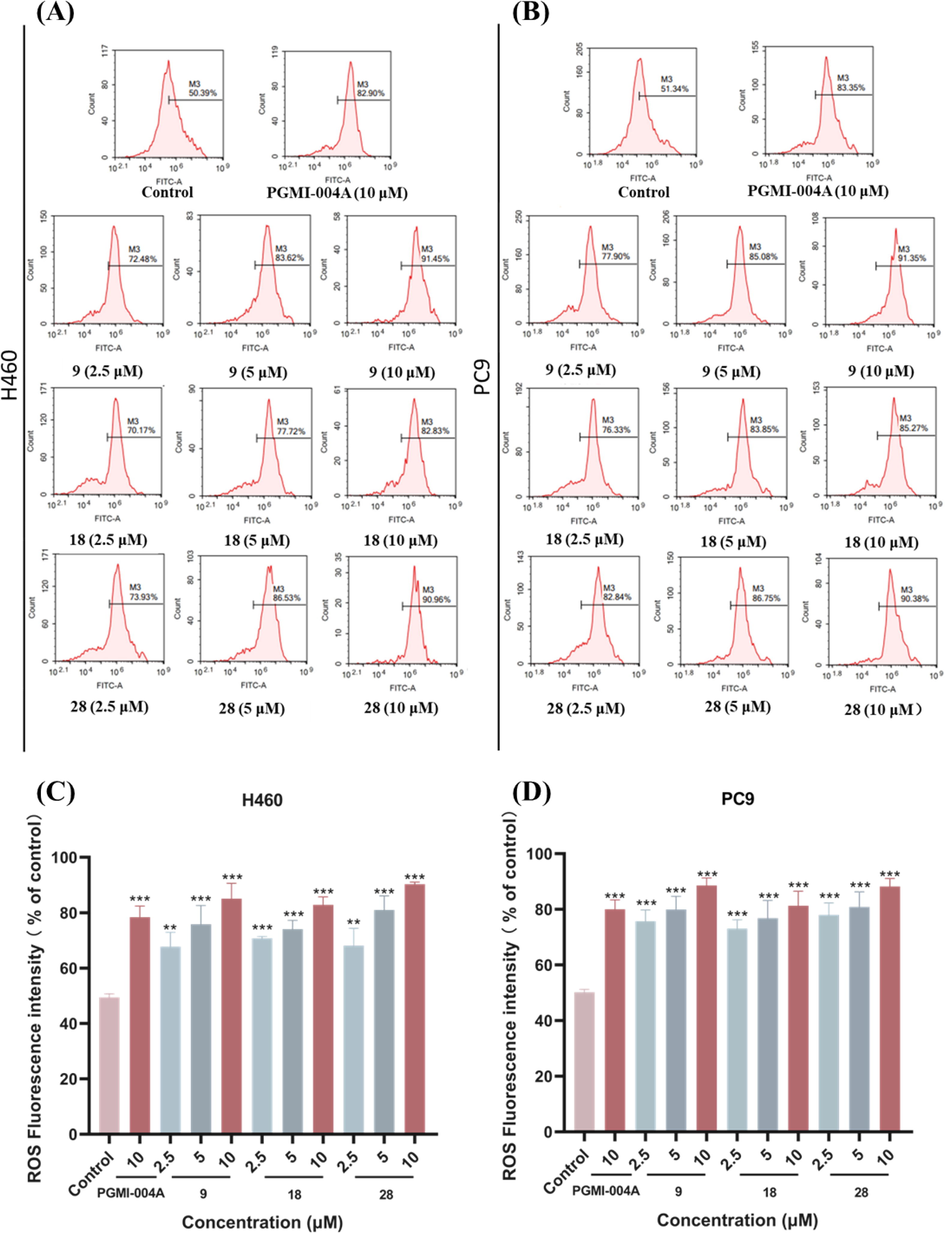
Effects of compounds on ROS. (A) H460 cells were treated with compounds 9, 18 and 28 for 48 h. (B) PC9 cells were treated with compounds 9, 18 and 28 for 48 h. Data were expressed as mean ± SD (n = 3). ***P < 0.001, determined with Student’s t test. At least three independent experiments were done for each condition.
2.8 Compounds 9, 18 and 28 caused mitochondrial damage in H460 and PC9 cells
Mitochondria regulate various cellular functions. Mitochondrial dysfunction may be implicated in apoptosis. The fluorescent probe JC-1 was used to measure mitochondrial membrane potentials and determine whether the induction of apoptosis by compounds 9, 18, and 28 were associated with the disruption of mitochondrial membrane integrity in cancer cells. H460 and PC9 cells were incubated with different concentrations (2.5, 5 and 10 μM) of compounds 9, 18, and 28 for 48 h prior to staining with JC-1 (Fig. 5). Flow cytometry was used to enumerate cells with green fluorescence indicating collapsed mitochondrial mem brane potentials. H460 cells were treated with compounds at the concentration of 2.5 μM, 5 μM, and 10 μM for 48 h, respectively. The assay disclosed that the proportion of mitochondrial membrane potential collapse increased with the increase of the concentration (9: 9.09%, 19.38% and 27.02%, respectively; 18: 9.41%, 23.07% and 38.70%, respectively; 28: 12.93%, 19.32% and 36.26%, respectively). The mitochondrial membrane potential collapse rate in H460 cells was 25.68% under 10 μM PGMI-004A treatment. PC9 cells were treated with compounds at the concentration of 2.5 μM, 5 μM, and 10 μM for 48 h, respectively. The results revealed that the proportion of mitochondrial membrane potential collapse increased with the increase of the concentration (9: 10.46%, 19.71% and 28.06%, respectively; 18: 9.10%, 18.98% and 29.96%, respectively; 28: 7.60%, 18.00% and 34.14%, respectively). Under the treatment of 10 μM PGMI-004A, the mitochondrial membrane potential collapse ratio in PC9 cells was 23.00%. These results indicated that the number of cells with mitochondrial dysfunction gradually increased in a concentration-dependent manner. It can induce apoptosis and inhibit the proliferation of tumor cells.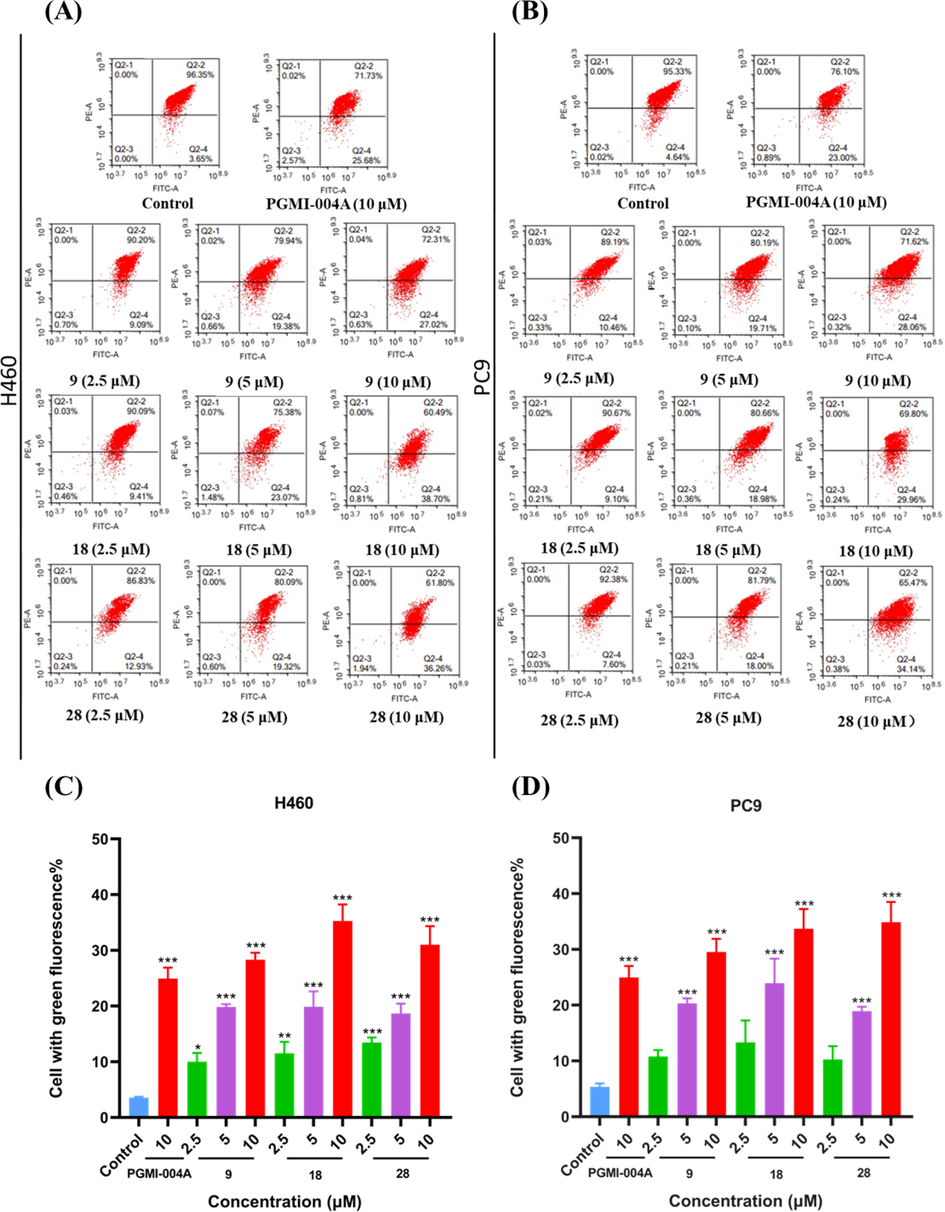
Effects of compounds on Mitochondria. (A) H460 cells were treated with compounds 9, 18 and 28 for 48 h. (B) PC9 cells were treated with compounds 9, 18 and 28 for 48 h. Data were expressed as mean ± SD (n = 3). ***P < 0.001, determined with Student’s t test. At least three independent experiments were done for each condition.
2.9 Inhibition Binding modes of compounds 9, 11, 18, 28 and 34 with PGAM1
Since the compound 3-NH-EVO has a chiral center, we measured the optical rotation of our synthesized 3-NH-EVO and the new compounds using an automatic polarimeter. The results showed that both 3-NH-EVO and these compounds exhibited an optical rotation of 0, indicating that they are racemic mixtures. In Table 3, the molecular docking scores of the enantiomers of the target compounds were carried out, and it was found that the R and S configurations of all the compounds were non-zero, which indicated that these compounds were racemes, this is consistent with the experimental results of racemes.
Compounds
Docking Score (kcal/mol)
Compounds
Docking Score (kcal/mol)
R
S
R
S
9
−6.164
−6.362
25
−5.705
−6.386
10
−5.982
−6.209
26
−6.223
−6.058
11
−5.989
−5.114
27
−6.77
−6.063
12
−5.569
−6.438
28
−5.926
−4.81
13
−6.118
−6.222
29
−6.054
−5.148
14
−5.751
−4.952
30
−6.069
−5.749
15
−5.484
−5.563
31
−5.807
−5.115
16
−6.105
−6.306
32
−6.464
−6.846
17
−6.077
−6.18
33
−5.539
−5.709
18
−6.247
−3.418
34
−6.275
−6.275
19
−5.728
−5.258
35
−5.97
−6.073
20
−5.72
−5.324
36
−6.278
−5.331
21
−5.944
−5.472
37
−5.973
−5.315
22
−4.132
−3.324
38
−5.56
−5.442
23
−5.876
−6.131
PGMI-004A
−6.923
24
−6.68
−6.315
To better understand the binding modes of compounds 9, 11, 18, 28 and 34 with PGAM1 (PDB ID:5Y2I), molecular docking of 9, 11, 18, 28 and 34 were investigated by Schrödinger. The sulfonamide group of compound 9 formed a hydrogen bond with Arg10 (Fig. 6A), and the docking score was −6.362 kcal•mol−1. The indole NH of compound 11 formed a hydrogen bond with Glu19 (Fig. 6B), and the docking score was −5.989 kcal•mol−1. For compound 18 three hydrogen bonds were formed between the side-chain NH with Asn209 and between the carbonyl group of the Dring with Arg191 (Fig. 6C), and the docking score was −6.247 kcal•mol−1. The evodiamine skeleton of compound 28 formed π-π interactions with Phe22 base pair, which enhanced the base stacking at the active site of PGAM1(Fig. 6D), and the docking score was −5.926 kcal•mol−1. The sulfonamide group of compound 34 formed two hydrogen bond with Arg191 (Fig. 6E), and the docking score was −6.275 kcal•mol−1. PGMI-004A was employed as the positive control, the carbonyl group on biphenyls and sulfonamide group contacted with polar residues (including Phe22 and Lys100) through hydrogen bonds directly (Fig. 6F), and the docking score was −6.923 kcal•mol−1. These results indicate that five new compounds can interact with different residues of PGAM1. The results of this study seem very promising because these compounds may be used as potential inhibitors of PGAM1.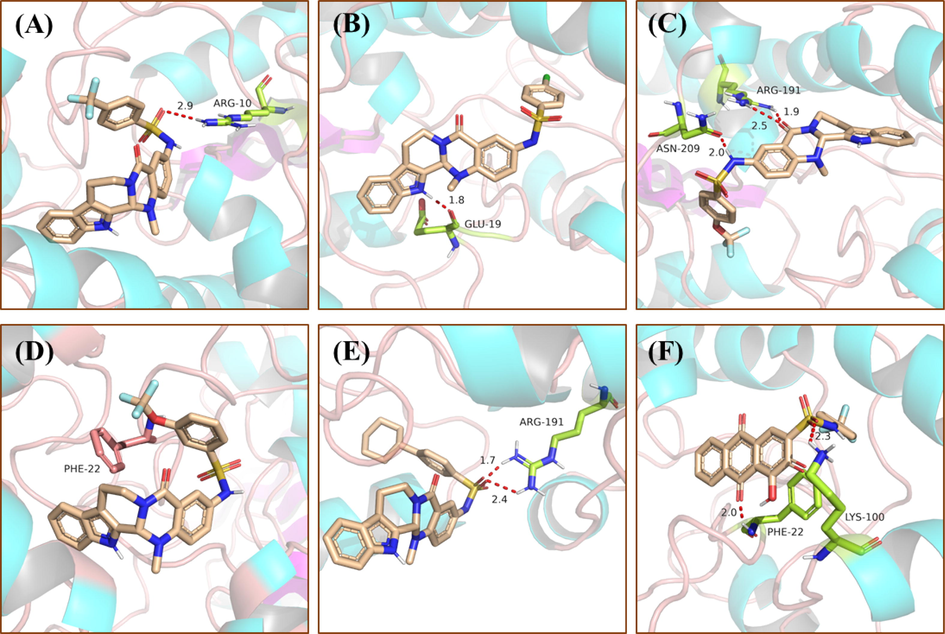
Binding models of PGAM1 with compound 9 (A), 11 (B), 18 (C), 28 (D), 34 (E) and PGMI-004A (F), respectively. The hydrogen bonds are indicated with red dashed lines. The carbons of compounds 9, 11, 18, 28 and 34 are colored in purple. The oxygen atoms are colored in red, nitrogen atoms in dark blue, and sulfur atoms in yellow. The figure was generated using Pymol.
3 Materials and methods
3.1 Chemistry
3.1.1 General procedures
The 3-NH-EVO were synthesized according to the literature (Yang et al., 2022b), and others were purchased commercially. The solvent was dried using a 4 Å molecular sieve. 1H and 13C NMR raw data were collected by a Bruker AVANCE400 and AVANCE500 spectrometer and spectrums were exported through MestReNova software. Deuterated solvent included DMSO‑d6, CDCl3 and D2O, and tetramethylsilane used as an internal standard. The chemical shifts (δ) are reported in parts per million (ppm) and the coupling constant (J) unit is Hz. ESI mass spectra were performed on an Agilent 7250&JEOL-JMS-T100LP AccuTOF. TLC analysis was carried out on silica gel plates GF254 (Qingdao Haiyang Chemical, China). Silica gel column chromatography was performed with Silica gel 60 G (Qingdao Haiyang Chemical, China). Commercial solvents were used without any pretreatment.
3.2 General experimental procedure for the synthesis of target compounds
3.2.1 General Procedure for the Synthesis of Compounds 5–34 Synthesis of N-(14-methyl-5-oxo-5,7,8,13,13b,14-hexahydroindolo[2′,3′:3,4] pyrido[2,1-b]quinazolin-3-yl)-4-(trifluoromethyl)benzenesulfonamide (9)
The 3-NH-EVO (100 mg; 1 mmol)) was placed in a 10 mL reaction flask to which anhydrous pyridine (3 mL) was added. The mixture was stirred until completely dissolved. Then 4-trifluoromethylbenzenesulfonyl chloride (115.22 mg; 1.5 mmol) was added to it and the mixture was magnetically stirred for 4 h. The reaction process was monitored by TLC. Then 20% (v/v) hydrochloric acid (HCl; 20 mL) and ethyl acetate (20 mL) were added and the mixture was extracted thrice. The supernatants were pooled and anhydrous sodium sulfate was added to dry them. The dehydrated mixture was filtered and distilled under reduced pressure until a light yellow solid was obtained. The final yield was 97.6%. All other compounds were synthesized in the same manner as described above. 1H NMR (400 MHz, DMSO‑d6) δ 10.83 (s, 1H), 10.14 (s, 1H), 7.70 (s, 1H), 7.68 (s, 1H), 7.27 (s, 1H), 7.23 (d, J = 7.7 Hz, 1H), 7.11 (d, J = 8.1 Hz, 1H), 6.98 (d, J = 8.7 Hz, 1H), 6.87 (t, J = 7.2 Hz, 1H), 6.77 (d, J = 8.7 Hz, 1H), 5.81 (s, 1H), 4.32 (s, 1H), 2.91 (s, 1H), 2.57 (s, 2H), 2.26 (s, 2H).13C NMR (101 MHz, DMSO)δ163.24, 146.11, 143.19, 136.29, 129.81, 129.58, 127.40, 127.24, 126.36, 125.63, 121.70, 121.02, 119.86, 118.89, 118.68, 118.05, 111.42, 111.31, 36.12, 19.27. ESI-MS (m/z): 527.136 [M + H]+.
3.2.2 Synthesis of 2-fluoro-N-(14-methyl-5-oxo-5,7,8,13,13b,14-hexahydroindolo [2′,3′:3,4]pyrido[2,1-b]quinazolin-3-yl)benzenesulfonamide (10)
Brown solid (51 mg), yield: 44.8%. 1H NMR (400 MHz, DMSO‑d6) δ 10.91 (s, 1H), 10.29 (s, 1H), 7.57 (s, 1H), 7.46 (s, 1H), 7.39 (s, 1H), 7.27 (s, 1H), 7.16 (s, 1H), 6.92 (s, 1H), 6.82 (s, 1H), 5.83 (s, 1H), 4.38 (s, 1H), 3.26 – 2.87 (m, 2H), 2.61 (s, 2H).13C NMR(101 MHz, DMSO) δ 163.23, 145.93, 136.32, 135.65, 130.04, 129.89, 129.72, 126.57, 125.63, 124.74, 121.68, 120.30, 120.07, 119.10, 118.67, 118.05, 117.14, 111.41, 69.09, 40.28, 36.12,19.29. ESI-MS (m/z): 477.139 [M + H]+.
3.2.3 Synthesis of 4-chloro-N-(14-methyl-5-oxo-5,7,8,13,13b,14-hexahydroindolo [2′,3′:3,4]pyrido[2,1-b]quinazolin-3-yl)benzenesulfonamide (11)
Yellow solid, yield: 38.8%. 1H NMR (400 MHz, DMSO‑d6) δ 10.86 (s, 1H), 9.99 (s, 1H), 7.48 (s, 1H), 7.46 (s, 1H), 7.39 (s, 1H), 7.37 (s, 1H), 7.30 (s, 1H), 7.24 (d, J = 7.7 Hz, 1H), 7.13 (d, J = 8.1 Hz, 1H), 7.00 (d, J = 8.5 Hz, 1H), 6.88 (t, J = 7.2 Hz, 1H), 6.80 (s, 1H), 6.78 (s, 1H), 5.82 (s, 1H), 3.14 (s, 1H), 3.02 – 2.88 (m, 2H), 2.59 (s, 2H).13C NMR (101 MHz, DMSO) δ 163.68, 146.46, 138.50, 137.92, 136.73, 130.39, 130.19, 129.60, 128.76, 127.66, 127.57, 126.05, 122.11, 121.34, 120.39, 119.40, 119.09, 118.47, 111.83, 111.74, 69.56, 36.54. ESI-MS (m/z): 493.109 [M + H]+.
3.2.4 Synthesis of 3-bromo-N-(14-methyl-5-oxo-5,7,8,13,13b,14-hexahydroindolo [2′,3′:3,4]pyrido[2,1-b]quinazolin-3-yl)benzenesulfonamide (12)
Yellow solid, yield: 98%. 1H NMR (400 MHz, DMSO‑d6) δ 11.08 (s, 1H), 10.21 (s, 1H), 7.82 (s, 1H), 7.67 (d, J = 6.8 Hz, 1H), 7.50 (s, 1H), 7.34 (s, 1H), 7.24 (s, 1H), 7.11 (s, 1H), 7.02 (d, J = 7.9 Hz, 1H), 6.06 (s, 1H), 3.35 (s, 1H), 3.15 (s, 1H), 2.81 (s, 2H), 2.74 (s, 2H).13C NMR(101 MHz, DMSO) δ 163.92, 146.81, 141.79, 136.98, 136.17, 131.96, 130.49, 130.38, 129.45, 128.04, 126.33, 126.10, 122.52, 122.35, 121.80, 120.52, 119.56, 119.34, 118.72, 112.09, 111.98, 36.81, 19.95. ESI-MS (m/z): 539.055 [M + H]+.
3.2.5 Synthesis of 3-bromo-N-(14-methyl-5-oxo-5,7,8,13,13b,14-hexahydroindolo [2′,3′:3,4]pyrido[2,1-b]quinazolin-3-yl)benzenesulfonamide (13)
Yellow solid, yield: 53.4%. 1H NMR (400 MHz, DMSO‑d6) δ 11.07 (s, 1H), 10.39 (s, 1H), 8.02 (s, 1H), 8.00 (s, 1H), 7.86 (s, 1H), 7.84 (s, 1H), 7.50 (s, 1H), 7.36 (d, J = 8.1 Hz, 1H), 7.22 (d, J = 6.8 Hz, 1H), 7.11 (t, J = 7.4 Hz, 1H), 7.00 (d, J = 8.5 Hz, 2H), 6.06 (s, 1H), 4.58 (dd, J = 12.7, 4.8 Hz, 1H), 3.36 (s, 2H), 3.16 (s, 1H), 2.83 (d, J = 23.2 Hz, 2H).13C NMR(101 MHz, DMSO) δ 163.64, 146.56, 143.69, 136.70, 133.62, 130.28, 129.75, 127.84, 127.58, 126.05, 122.11, 121.61, 120.14, 119.15, 118.46, 117.75, 115.49, 111.83, 111.72, 69.65, 40.89, 36.54, 19.67. ESI-MS (m/z): 484.144 [M + H]+.
3.2.6 Synthesis of 2-bromo-N-(14-methyl-5-oxo-5,7,8,13,13b,14-hexahydroindolo [2′,3′:3,4]pyrido[2,1-b]quinazolin-3-yl)benzenesulfonamide (14)
Yellow solid, yield: 56.3%. 1H NMR (400 MHz, DMSO‑d6) δ 11.09 (s, 1H), 10.49 (s, 1H), 8.58 (s, 2H), 8.01 (s, 1H), 7.80 (s, 1H), 7.78 (s, 1H), 7.59 (s, 1H), 7.34 (s, 1H), 7.25 (s, 1H), 7.12 (d, J = 7.2 Hz, 1H), 7.02 – 6.99 (m, 1H), 6.01 (s, 1H), 3.13 (s, 1H), 2.81 (d, J = 5.3 Hz, 2H), 2.66 (s, 2H).13C NMR(101 MHz, DMSO) δ 163.61, 146.15, 138.57, 136.75, 136.39, 135.62, 134.70, 131.73, 130.41, 130.06, 128.44, 126.35, 126.02, 124.11, 122.09, 120.69, 120.18, 119.76, 119.40, 119.07, 118.47, 111.82, 69.44, 69.44, 36.55,19.72.ESI-MS (m/z): 539.057[M + H]+.
3.2.7 Synthesis of 4-bromo-N-(14-methyl-5-oxo-5,7,8,13,13b,14-hexahydroindolo [2′,3′:3,4]pyrido[2,1-b]quinazolin-3-yl)benzenesulfonamide (15)
Yellow solid, yield: 71.1%. 1H NMR (400 MHz, DMSO‑d6) δ 10.86 (s, 1H), 10.00 (s, 1H), 7.54 (s, 1H), 7.52 (s, 1H), 7.40 (s, 1H), 7.38 (s, 1H), 7.29 (s, 1H), 7.25 (d, J = 7.8 Hz, 1H), 7.13 (d, J = 8.0 Hz, 1H), 6.99 (d, J = 8.6 Hz, 1H), 6.89 (t, J = 7.4 Hz, 1H), 6.80 (s, 1H), 6.78 (s, 1H), 5.82 (s, 1H), 3.13 (s, 1H), 2.64 – 2.57 (m, 2H), 2.28 (s, 2H).13C NMR(101 MHz, DMSO) δ 163.67, 146.45, 138.92, 136.72, 132.55, 130.39, 130.17, 128.82, 127.52, 126.91, 126.04, 122.11, 121.28, 120.40, 119.43, 119.09, 118.48, 111.74, 69.54, 40.76, 36.53, 19.70. ESI-MS (m/z): 539.057 [M + H]+.
3.2.8 Synthesis of N-(14-methyl-5-oxo-5,7,8,13,13b,14-hexahydroindolo[2′,3′:3,4] pyrido[2,1-b]quinazolin-3-yl)-4-nitrobenzenesulfonamide (16)
Reddish brown solid, yield: 70.8%. 1H NMR (400 MHz, DMSO‑d6) δ 10.86 (s, 1H), 10.00 (s, 1H), 7.54 (s, 1H), 7.52 (s, 1H), 7.40 (s, 1H), 7.38 (s, 1H), 7.29 (s, 1H), 7.24 (s, 1H), 7.12 (s, 1H), 6.98 (s, 1H), 6.89 (s, 1H), 6.80 (s, 1H), 6.78 (s, 1H), 5.82 (s, 1H), 4.35 (s, 1H), 3.13 (s, 2H), 2.59 (s, 2H).13C NMR(101 MHz, DMSO) δ 163.89, 150.25, 150.05, 146.82, 145.39, 136.96, 130.56, 129.93, 128.70, 128.10, 126.32, 124.35, 122.38, 121.88, 120.36, 119.38, 118.72, 112.10, 111.98, 69.94, 41.17, 36.82, 19.94. ESI-MS (m/z): 503.126 [M + H]+.
3.2.9 Synthesis of 4-iodo-N-(14-methyl-5-oxo-5,7,8,13,13b,14-hexahydroindolo [2′,3′:3,4] pyrido[2,1-b]quinazolin-3-yl)benzenesulfonamide (17)
Yellow solid, yield: 70.8%. 1H NMR (400 MHz, DMSO‑d6) δ 10.87 (s, 1H), 10.00 (s, 1H), 7.71 (s, 1H), 7.69 (s, 1H), 7.31 (s, 1H), 7.27 (s, 1H), 7.25 (s, 1H), 7.23 (s, 1H), 7.14 (s, 1H), 7.00 (s, 1H), 6.90 (s, 1H), 6.81 (s, 1H), 5.83 (s, 1H), 4.37 (d, J = 9.7 Hz, 1H), 3.17 (s, 1H), 2.93 (s, 1H), 2.60 (s, 2H), 2.29 (s, 1H).13C NMR(101 MHz, DMSO) δ 163.95, 146.69, 139.57, 138.61, 137.01, 130.78, 130.42, 128.76, 127.66, 126.31, 122.38, 121.42, 120.75, 119.78, 119.36, 118.75, 112.02, 101.55, 69.79, 41.01, 19.99. ESI-MS (m/z): 599.269 [M + H]+.
3.2.10 Synthesis of N-(14-methyl-5-oxo-5,7,8,13,13b,14-hexahydroindolo[2′,3′:3,4] pyrido[2,1-b]quinazolin-3-yl)-4-(trifluoromethoxy)benzenesulfonamide (18)
Yellow solid, yield: 70.5%. 1H NMR (400 MHz, DMSO‑d6) δ 10.85 (s, 1H), 10.05 (s, 1H), 7.62 (s, 1H), 7.60 (s, 1H), 7.30 (s, 1H), 7.28 (s, 1H), 7.23 (d, J = 7.6 Hz, 1H), 7.12 (s, 1H), 7.00 (s, 1H), 6.87 (s, 1H), 6.78 (d, J = 8.2 Hz, 1H), 5.81 (s, 1H), 4.35 (d, J = 9.4 Hz, 1H), 2.93 (d, J = 11.3 Hz, 1H), 2.65 – 2.55 (m, 2H).13C NMR(101 MHz, DMSO) δ 163.90, 151.43, 146.69, 138.84, 136.96, 130.56, 129.68, 127.79, 126.28, 122.32, 121.80, 121.59, 120.59, 119.57, 119.31, 118.67, 112.06, 111.96, 69.82, 41.02, 36.75, 19.92. ESI-MS (m/z): 543.129 [M + H]+.
3.2.11 Synthesis of 2,4,6-trichloro-N-(14-methyl-5-oxo-5,7,8,13,13b,14- hexahydroindolo [2′,3′:3,4]pyrido[2,1-b]quinazolin-3-yl)benzenesulfonamide (19)
Orange colored solid, yield: 75.5%. 1H NMR (400 MHz, DMSO‑d6) δ 11.08 (s, 1H), 10.76 (s, 1H), 7.81 (s, 1H), 7.58 (s, 1H), 7.48 (s, 1H), 7.39 (s, 1H), 7.35 (d, J = 8.0 Hz, 1H), 7.26 (s, 1H), 7.11 (s, 1H), 7.02 (s, 1H), 6.04 (s, 1H), 3.36 (s, 1H), 3.15 (s, 1H), 2.81 (s, 2H), 2.70 (s, 2H).13C NMR(101 MHz, DMSO) δ 163.59, 149.78, 146.35, 137.89, 136.73, 136.31, 135.57, 133.47, 130.10, 129.66, 126.13, 126.03, 124.08, 122.09, 120.59, 120.05, 119.61, 119.07, 118.46, 111.82, 111.73, 40.73, 36.51, 19.71. ESI-MS (m/z): 561.032 [M + H]+.
3.2.12 Synthesis of 2,6-dichloro-N-(14-methyl-5-oxo-5,7,8,13,13b,14-hexahydroindolo [2′,3′:3,4]pyrido[2,1-b]quinazolin-3-yl)benzenesulfonamide (20)
Brown solid, yield: 67.6%. 1H NMR (400 MHz, DMSO‑d6) δ 10.92 (s, 1H), 10.51 (s, 1H), 8.40 (d, J = 4.0 Hz, 1H), 7.43 (s, 2H), 7.40 (s, 1H), 7.18 (d, J = 7.9 Hz, 1H), 7.11 (d, J = 8.7 Hz, 1H), 6.93 (t, J = 7.4 Hz, 1H), 6.86 (d, J = 8.6 Hz, 1H), 6.83 (s, 1H), 5.84 (s, 1H), 4.41 (d, J = 12.0 Hz, 1H), 3.85 (q, J = 7.1 Hz, 1H), 2.97 (s, 2H), 2.64 (s, 2H).13C NMR(101 MHz, DMSO) δ 163.59, 149.71, 146.24, 136.76, 134.60, 134.16, 132.02, 130.05, 126.03, 125.84, 124.12, 122.09, 120.73, 119.72, 119.07, 118.47, 111.83, 111.74, 69.45, 59.95, 36.51. ESI-MS (m/z): 527.069 [M + H]+.
3.2.13 Synthesis of 2,4-dichloro-N-(14-methyl-5-oxo-5,7,8,13,13b,14-hexahydroindolo [2′,3′:3,4]pyrido[2,1-b]quinazolin-3-yl)benzenesulfonamide (21)
Orange colored solid, yield: 24.2%. 1H NMR (400 MHz, DMSO‑d6) δ 11.07 (s, 1H), 10.56 (s, 1H), 7.93 (s, 1H), 7.85 (s, 1H), 7.59 (s, 1H), 7.56 (s, 2H), 7.46 (s, 1H), 7.34 (s, 1H), 7.23 (s, 1H), 7.11 (s, 1H), 7.02 (s, 1H), 6.03 (s, 1H), 3.14 (s, 1H), 2.81 (s, 2H), 2.70 (s, 2H).13C NMR(101 MHz, DMSO) δ 163.60, 146.34, 138.73, 136.73, 135.89, 132.89, 132.18, 131.57, 130.12, 129.86, 128.17, 126.78, 126.03, 122.10, 120.59, 119.57, 119.08, 118.47, 111.83, 111.72, 69.50, 36.53, 19.71. ESI-MS (m/z): 527.070 [M + H]+.
3.2.14 Synthesis of 4-fluoro-N-(14-methyl-5-oxo-5,7,8,13,13b,14-hexahydroindolo [2′,3′:3,4]pyrido[2,1-b]quinazolin-3-yl)benzenesulfonamide (22)
Yellow solid, yield: 30.7%. 1H NMR (400 MHz, DMSO‑d6) δ 11.09 (s, 1H), 10.16 (s, 1H), 7.76 (s, 1H), 7.52 (s, 1H), 7.46 (s, 1H), 7.39 (s, 1H), 7.37 (s, 1H), 7.35 (s, 1H), 7.23 (d, J = 8.7 Hz, 1H), 7.11 (s, 1H), 7.02 (s, 1H), 6.04 (s, 1H), 4.58 (d, J = 9.8 Hz, 1H), 3.15 (d, J = 3.5 Hz, 1H), 2.81 (s, 2H), 2.72 (s, 2H).13C NMR(101 MHz, DMSO) δ 163.89, 146.62, 136.94, 130.77, 130.39, 130.13, 130.03, 127.75, 126.25, 122.32, 121.50, 120.61, 119.62, 119.30, 118.68, 116.96, 116.73, 112.04, 69.76, 40.96, 36.75, 19.92. ESI-MS (m/z): 477.139 [M + H]+.
3.2.15 Synthesis of N-(14-methyl-5-oxo-5,7,8,13,13b,14-hexahydroindolo[2′,3′:3,4] pyrido[2,1-b]quinazolin-3-yl)-2-(trifluoromethoxy)benzenesulfonamide (23)
Brownish yellow solid, yield: 61.5%. 1H NMR (400 MHz, DMSO‑d6) δ 11.10 (s, 1H), 10.40 (s, 1H), 7.91 (s, 1H), 7.73 (s, 1H), 7.55 (s, 1H), 7.48 (s, 2H), 7.35 (s, 1H), 7.24 (s, 1H), 7.11 (s, 1H), 7.01 (s, 1H), 6.02 (s, 1H), 3.37 (s, 1H), 3.15 (s, 1H), 2.81 (s, 2H), 2.69 (s, 2H).13C NMR(101 MHz, DMSO) δ 163.65, 146.38, 145.29, 136.77, 135.53, 131.82, 131.00, 130.41, 130.11, 127.66, 127.05, 126.05, 122.10, 121.17, 120.80, 120.58, 119.61, 119.08, 118.47, 111.83, 40.68, 40.35, 36.56, 19.72. ESI-MS (m/z): 543.129 [M + H]+.
3.2.16 Synthesis of methyl4-(chloromethyl)-5-(N-(14-methyl-5-oxo-5,7,8,13,13b,14-hexahydroindolo[2′,3′:3,4]pyrido[2,1-b]quinazolin-3-yl)sulfamoyl)furan-2- carboxylate (24)
Yellow solid, yield: 90.0%. 1H NMR (400 MHz, DMSO‑d6) δ 11.08 (s, 1H), 9.74 (s, 1H), 7.46 (s, 1H), 7.34 (s, 1H), 7.23 (s, 1H), 7.11 (s, 1H), 6.98 (d, J = 8.6 Hz, 2H), 6.64 (s, 1H), 6.56 (s, 1H), 5.99 (s, 1H), 4.60 (s, 2H), 3.86 (s, 3H), 3.78 (s, 3H), 3.34 (s, 2H), 2.84 – 2.79 (m, 2H). 13C NMR (101 MHz, DMSO) δ 164.38, 163.50, 157.90, 145.65, 136.55, 131.72, 129.80, 126.03, 125.78, 121.83, 120.64, 119.83, 119.57, 118.78, 118.22, 111.50, 104.96, 99.13, 69.15, 56.09, 55.66, 36.35, 19.53. ESI-MS (m/z): 556.240 [M + H]+.
3.2.17 Synthesis of 2,4,6-triisopropyl-N-(14-methyl-5-oxo-5,7,8,13,13b,14- hexahydroindolo [2′,3′:3,4]pyrido[2,1-b]quinazolin-3-yl)benzenesulfonamide (25)
Reddish brown solid, yield: 55.0%. 1H NMR (400 MHz, DMSO‑d6) δ 11.07 (s, 1H), 9.92 (s, 1H), 7.52 (s, 1H), 7.45 (s, 1H), 7.33 (s, 1H), 7.15 (s, 1H), 7.10 (s, 1H), 7.02 (s, 1H), 6.01 (s, 1H), 3.86 (s, 1H), 3.78 (s, 1H), 3.16 (d, J = 11.2 Hz, 2H), 2.84 (d, J = 23.4 Hz, 2H), 2.70 (s, 3H), 1.17 (s, 3H), 1.15 (s, 3H), 1.11 (s, 2H), 1.09 (s, 2H), 1.08 (s, 2H), 1.06 (s, 3H), 1.05 (s, 2H). 13C NMR (101 MHz, DMSO‑d6) δ 163.70, 152.33, 150.13, 146.96, 146.50, 136.75, 133.20, 130.53, 130.11, 126.01, 123.77, 121.97, 121.48, 120.68, 119.60, 118.98, 118.36, 111.77, 111.67, 33.34, 29.16, 28.19, 24.99, 24.73, 24.68, 24.00, 23.48. ESI-MS (m/z): 585.069 [M + H]+.
3.2.18 Synthesis of 4-(tert-butyl)-N-(14-methyl-5-oxo-5,7,8,13,13b,14- hexahydroindolo [2′,3′:3,4]pyrido[2,1-b]quinazolin-3-yl)benzenesulfonamide (26)
Yellow solid, yield: 30.4%. 1H NMR (400 MHz, DMSO‑d6) δ 11.07 (s, 1H), 10.13 (s, 1H), 7.67 (s, 1H), 7.65 (s, 1H), 7.56 (s, 1H), 7.54 (s, 1H), 7.48 (s, 1H), 7.36 (s, 1H), 7.25 (s, 1H), 7.11 (s, 1H), 7.00 (s, 1H), 6.02 (s, 1H), 3.15 (d, J = 6.2 Hz, 2H), 2.82 (s, 2H), 2.68 (s, 2H), 1.25 (s, 9H). 13C NMR (101 MHz, DMSO‑d6) δ 155.93, 146.06, 137.13, 131.27, 130.05, 126.62, 126.54, 126.24, 126.00, 122.04, 120.31, 119.69, 119.03, 118.42, 111.77, 111.70, 40.60, 36.54, 35.00, 30.88, 19.70. ESI-MS (m/z): 515.235 [M + H]+.
3.2.19 Synthesis of 4′-chloro-N-(14-methyl-5-oxo-5,7,8,13,13b,14-hexahydroindolo [2′,3′:3,4]pyrido[2,1-b]quinazolin-3-yl)-[1,1′-biphenyl]-4-sulfonamide (27)
Yellow solid, yield: 35.2%. 1H NMR (400 MHz, DMSO‑d6) δ 11.06 (s, 1H), 10.22 (s, 1H), 7.83 (s, 1H), 7.80 (s, 1H), 7.74 (s, 1H), 7.72 (s, 1H), 7.58 (s, 1H), 7.55 (s, 1H), 7.53 (s, 1H), 7.45 (s, 1H), 7.34 (s, 1H), 7.28 (d, J = 8.7 Hz, 1H), 7.10 (t, J = 7.6 Hz, 1H), 7.03 (s, 1H), 7.00 (s, 1H), 3.36 (s, 2H), 3.14 (s, 1H), 2.81 (s, 2H), 2.70 (s, 2H). 13C NMR (101 MHz, DMSO‑d6) δ 163.65, 146.25, 142.97, 138.87, 137.21, 136.71, 133.69, 130.87, 130.10, 129.21, 129.21, 129.00, 127.53, 127.50, 127.04, 126.00, 122.06, 120.79, 120.53, 119.56, 119.04, 111.79, 111.70, 40.66, 36.53, 19.68. ESI-MS (m/z): 569.236 [M + H]+.
3.2.20 Synthesis of N-(14-methyl-5-oxo-5,7,8,13,13b,14-hexahydroindolo[2′,3′:3,4] pyrido[2,1-b]quinazolin-3-yl)-3-(trifluoromethoxy)benzenesulfonamide (28)
Brownish yellow solid, yield: 50.4%. 1H NMR (400 MHz, DMSO‑d6) δ 11.08 (s, 1H), 10.28 (s, 1H), 7.70 (s, 1H), 7.62 (s, 1H), 7.51 (s, 1H), 7.36 (s, 1H), 7.23 (s, 1H), 7.11 (s, 1H), 7.01 (s, 1H), 6.04 (s, 1H), 4.58 (s, 1H), 3.34 (s, 2H), 3.15 (s,2H), 2.74 (s, 2H). 13C NMR (101 MHz, DMSO‑d6) δ 163.57, 148.33, 146.63, 141.55, 136.72, 131.92, 130.16, 130.00, 127.90, 126.03, 125.89, 125.70, 122.05, 121.74, 120.27, 119.23, 119.04, 119.04, 118.40, 111.80, 111.70, 69.60, 40.79, 36.50, 19.66. ESI-MS (m/z): 543.368 [M + H]+.
3.2.21 Synthesis of 4-fluoro-N-(14-methyl-5-oxo-5,7,8,13,13b,14-hexahydroindolo [2′,3′:3,4] pyrido[2,1-b]quinazolin-3-yl)-3-(trifluoromethyl)benzenesulfonamide (29)
Brown solid, yield: 71.1%. 1H NMR (400 MHz, DMSO‑d6) δ 11.06 (s, 1H), 10.26 (s, 1H), 8.02 (s, 1H), 8.01 (s, 1H), 7.68 (s, 1H), 7.49 (s, 1H), 7.46 (s, 1H), 7.35 (s, 1H), 7.22 (d, J = 8.7 Hz, 1H), 7.11 (s, 1H), 7.03 (s, 1H), 7.01 (s, 1H), 6.05 (s, 1H), 4.58 (d, J = 8.8 Hz, 1H), 3.16 (t, J = 9.4 Hz, 1H), 2.83 (d, J = 22.3 Hz, 2H), 2.77 (s, 3H). 13C NMR (101 MHz, DMSO‑d6) δ 163.58, 146.75, 136.71, 136.50, 134.31, 134.21, 130.22, 129.65, 128.24, 126.05, 122.05, 120.12, 119.12, 119.06, 118.92, 118.42, 111.81, 111.72, 40.88, 40.35, 36.51, 30.19. ESI-MS (m/z): 545.185 [M + H]+.
3.2.22 Synthesis of 4-methyl-N-(14-methyl-5-oxo-5,7,8,13,13b,14-hexahydroindolo [2′,3′:3,4]pyrido[2,1-b]quinazolin-3-yl)benzenesulfonamide (30)
Yellow solid, yield: 30.0%. 1H NMR (400 MHz, DMSO‑d6) δ 11.08 (s, 1H), 10.07 (s, 1H), 7.61 (s, 1H), 7.59 (s, 1H), 7.54 (s, 1H), 7.46 (s, 1H), 7.36 (d, J = 8.1 Hz, 1H), 7.31 (s, 1H), 7.29 (s, 1H), 7.24 (d, J = 8.7 Hz, 1H), 7.11 (s, 1H), 7.01 (s, 2H), 6.02 (s, 1H), 3.36 (s, 1H), 3.14 (s, 1H), 2.82 (s, 2H), 2.69 (s, 3H). 13C NMR (101 MHz, DMSO‑d6) δ 146.16, 136.88, 129.80, 120.71, 119.55, 40.65, 40.35, 40.15, 36.55, 21.10, 19.70. ESI-MS (m/z): 473.107 [M + H]+.
3.2.23 Synthesis of N-(14-methyl-5-oxo-5,7,8,13,13b,14-hexahydroindolo[2′,3′:3,4] pyrido[2,1-b]quinazolin-3-yl)naphthalene-1-sulfonamide (31)
Yellow solid, yield: 50.2%. 1H NMR (400 MHz, DMSO‑d6) δ 10.21 (s, 1H), 9.65 (s, 1H), 7.83 (s, 1H), 7.35 (s, 1H), 7.30 (s, 1H), 7.21 (s, 1H), 6.67 (s, 1H), 6.49 (s, 1H), 6.31 (s, 1H), 6.15 (s, 1H), 6.09 (s, 1H), 5.72 (s, 2H), 5.12 (s, 1H), 3.51 (s, 2H). 13C NMR (101 MHz, DMSO‑d6) δ 163.16, 145.62, 145.30, 136.33, 134.35, 133.50, 130.51, 129.64, 129.33, 128.77, 127.76, 127.26, 126.68, 125.89, 125.61, 124.22, 124.12, 121.64, 120.24, 119.73, 119.29, 118.62, 118.17, 118.01, 116.48, 115.53, 112.89, 111.38, 111.28, 90.37, 40.17, 36.12, 34.87, 19.26. ESI-MS (m/z): 509.058 [M + H]+.
3.2.24 Synthesis of N-(14-methyl-5-oxo-5,7,8,13,13b,14-hexahydroindolo[2′,3′:3,4] pyrido[2,1-b]quinazolin-3-yl)-[1,1′-biphenyl]-4-sulfonamide (32)
Yellow solid, yield: 63.6%. 1H NMR (400 MHz, DMSO‑d6) δ 10.89 (s, 1H), 9.91 (s, 1H), 7.45 (s, 1H), 7.43 (s, 1H), 7.36 (d, J = 2.3 Hz, 1H), 7.28 (d, J = 7.8 Hz, 1H), 7.17 (s, 1H), 7.07 (d, J = 8.7 Hz, 1H), 6.92 (s, 1H), 6.83 (s, 1H), 6.82 (s, 1H), 5.83 (s, 1H), 4.41 (s, 1H), 2.62 (s, 2H), 2.31 (s, 2H). 13C NMR (101 MHz, DMSO‑d6) δ 163.72, 152.80, 146.11, 137.35, 136.75, 131.22, 130.12, 127.64, 126.88, 126.77, 126.03, 122.06, 120.62, 120.53, 119.62, 119.05, 118.44, 111.80, 111.72, 43.65, 40.67, 36.56, 33.60, 26.31, 25.60, 19.71, 19.71. ESI-MS (m/z): 535.175 [M + H]+.
3.2.25 Synthesis of 4-methoxy-N-(14-methyl-5-oxo-5,7,8,13,13b,14-hexahydroindolo [2′,3′:3,4]pyrido[2,1-b]quinazolin-3-yl)benzenesulfonamide (33)
Yellow solid, yield: 40.6%. 1H NMR (400 MHz, DMSO‑d6) δ 10.90 (s, 1H), 9.82 (s, 1H), 7.48 (s, 1H), 7.45 (s, 1H), 7.36 (s, 1H), 7.30 (s, 1H), 7.16 (s, 1H), 7.05 (d, J = 8.7 Hz, 1H), 6.93 (s, 1H), 6.87 (s, 1H), 6.85 (s, 1H), 6.83 (s, 1H), 6.81 (s, 1H), 5.84 (s, 1H), 3.60 (s, 3H), 2.64 (s, 2H), 2.32 (s, 2H). 13C NMR (101 MHz, DMSO‑d6) δ 163.90, 162.74, 146.36, 136.96, 131.59, 131.52, 130.29, 129.19, 127.13, 126.23, 122.29, 120.87, 119.87, 119.27, 118.66, 114.75, 112.01, 111.93, 55.99, 36.77, 19.93, 19.93. ESI-MS (m/z): 489.240 [M + H]+.
3.2.26 Synthesis of 4-cyclohexyl-N-(14-methyl-5-oxo-5,7,8,13,13b,14-hexahydroindolo [2′,3′:3,4]pyrido[2,1-b]quinazolin-3-yl)benzenesulfonamide (34)
Yellow solid, yield: 70.5%. 1H NMR (400 MHz, DMSO‑d6) δ 11.06 (s, 1H), 10.20 (s, 1H), 7.85 (s, 1H), 7.83 (s, 1H), 7.80 (s, 1H), 7.78 (s, 1H), 7.70 (s, 1H), 7.69 (s, 1H), 7.58 (s, 1H), 7.48 (s, 1H), 7.44 (s, 1H), 7.34 (d, J = 8.1 Hz, 1H), 7.28 (d, J = 8.7 Hz, 1H), 7.10 (s, 1H), 7.03 (s, 1H), 7.01 (s, 1H), 6.03 (s, 1H), 3.14 (s, 1H), 2.81 (s, 2H), 2.69 (s, 2H), 1.23 (s, 1H). 13C NMR (101 MHz, DMSO‑d6) δ 163.26, 145.84, 143.93, 138.13, 137.99, 136.31, 130.54, 129.68, 128.85, 128.85, 128.33, 127.11, 127.06, 126.80, 126.61, 125.60, 120.37, 120.17, 119.20, 118.64, 118.03, 111.38, 40.24, 36.12, 19.28. ESI-MS (m/z): 541.157 [M + H]+.
3.2.27 Synthesis of 2-fluoro-N-(14-methyl-5-oxo-5,7,8,13,13b,14-hexahydroindolo [2′,3′:3,4] pyrido[2,1-b]quinazolin-3-yl)benzenesulfonamide (35)
Brownish yellow solid, yield: 27.0%. 1H NMR (400 MHz, DMSO‑d6) δ 11.04 (s, 1H), 10.44 (s, 1H), 7.75 (s, 1H), 7.65 (s, 1H), 7.55 (s, 1H), 7.46 (d, J = 7.8 Hz, 1H), 7.40 (d, J = 9.4 Hz, 1H), 7.36 (s, 1H), 7.34 (s, 1H), 7.31 (s, 1H), 7.24 (d, J = 8.7 Hz, 1H), 7.11 (s, 1H), 7.00 (s, 1H), 6.01 (s, 1H), 2.80 (s, 2H), 2.71 (s, 2H). 13C NMR (101 MHz, DMSO‑d6) δ 163.46, 159.29, 156.76, 146.05, 136.44, 135.82, 135.74, 130.15, 129.94, 129.82, 126.95, 125.79, 124.93, 124.89, 121.87, 120.60, 119.93, 118.99, 118.87, 118.20, 117.26, 117.06, 111.58, 111.48, 40.57, 36.27, 19.41. ESI-MS (m/z): 477.369 [M + H]+.
3.2.28 Synthesis of 3,4-dimethoxy-N-(14-methyl-5-oxo-5,7,8,13,13b,14- hexahydroindolo [2′,3′:3,4]pyrido[2,1-b]quinazolin-3-yl)benzenesulfonamide (36)
Yellow crystalline, yield: 37.4%. 1H NMR (400 MHz, DMSO‑d6) δ 11.07 (s, 1H), 9.95 (s, 1H), 7.58 (s, 1H), 7.48 (s, 1H), 7.35 (s, 1H), 7.27 (s, 1H), 7.23 (s, 1H), 7.17 (s, 1H), 7.11 (s, 1H), 7.02 (s, 1H), 7.01 (s, 1H), 6.03 (s, 1H), 3.77 (s, 3H), 3.65 (s, 3H), 3.34 (s, 3H), 3.15 (s, 1H), 2.81 (s, 2H), 2.71 (s, 2H). 13C NMR (101 MHz, DMSO‑d6) δ 170.77, 164.04, 152.55, 148.90, 146.46, 137.03, 131.52, 131.44, 130.51, 127.63, 126.34, 122.35, 121.28, 120.87, 120.70, 119.70, 119.34, 118.71, 112.09, 111.99, 111.59, 109.92, 56.22, 41.03, 21.20, 19.98. ESI-MS (m/z): 519.547 [M + H]+.
3.2.29 Synthesis of N-(14-methyl-5-oxo-5,7,8,13,13b,14-hexahydroindolo[2′,3′:3,4] pyrido[2,1-b]quinazolin-3-yl)-1-phenylmethanesulfonamide (37)
Brownish yellow solid, yield: 38.0%. 1H NMR (400 MHz, DMSO‑d6) δ 10.92 (s, 1H), 9.51 (s, 1H), 7.49 (s, 1H), 7.43 (d, J = 3.8 Hz, 1H), 7.27 (s, 1H), 7.25 (s, 1H), 7.18 (s, 1H), 7.16 (s, 1H), 7.08 (s, 1H), 6.99 (s, 1H), 6.87 (s, 1H), 6.78 (s, 1H), 6.04 (s, 1H), 4.15 (s, 2H), 3.46 (s, 1H), 3.10 (s, 3H), 2.62 (s, 2H). 13C NMR (101 MHz, DMSO‑d6) δ 163.79, 136.79, 131.66, 131.04, 130.36, 130.20, 129.67, 128.81, 128.64, 128.49, 128.30, 127.58, 126.27, 126.14, 126.04, 123.63, 122.90, 122.05, 121.53, 121.34, 120.97, 120.01, 119.87, 119.04, 118.43, 113.49, 111.71, 107.97, 67.69, 40.64, 36.72. ESI-MS (m/z): 473.144 [M + H]+.
3.2.30 Synthesis of 3,5-difluoro-N-(14-methyl-5-oxo-5,7,8,13,13b,14- hexahydroindolo [2′,3′:3,4]pyrido[2,1-b]quinazolin-3-yl)benzenesulfonamide (38)
Yellow solid, yield: 64.0%. 1H NMR (400 MHz, DMSO‑d6) δ 11.06 (s, 1H), 10.62 (s, 1H), 7.85 (s, 1H), 7.71 (s, 1H), 7.54 (s, 1H), 7.46 (s, 1H), 7.34 (s, 1H), 7.25 (d, J = 8.7 Hz, 1H), 7.11 (s, 1H), 7.03 (s, 1H), 7.00 (s, 1H), 6.04 (s, 1H), 3.15 (s, 1H), 2.83 (d, J = 17.2 Hz, 2H), 2.74 (s, 3H). 13C NMR (101 MHz, DMSO‑d6) δ 163.60, 154.92, 152.37, 146.52, 136.71, 130.18, 129.63, 129.22, 127.40, 126.04, 122.07, 121.12, 120.27, 119.29, 119.06, 118.43, 111.81, 111.71, 36.51, 30.19, 19.67. ESI-MS (m/z): 495.864 [M + H]+.
3.3 PGAM1 inhibition
PGAM1 was purchased from Jiangsu Sumeike Biological Technology Co. Ltd. (No. MK530295A). The reagents, samples, and standards were prepared and incubated at 37 ℃ for 30 min. The plate was washed five times, subjected to the enzyme-labeled reagent, incubated at 37 ℃ for 30 min, and washed five times. Color-developing agents A and B (50 μL each) were then added to each well. The plate was gently shaken and stored in the dark at 37 ℃ for 10 min to allow the color to develop. Then 50 μL termination solution was added to each well and the blue color turned to yellow. The OD450 of each well was measured within 15 min of adding the termination solution.
3.4 Cell viability assays
H460, PC9, PC9/GR, H1299, SW620 and LO2 cell lines were acquired from Procell Life Science & Technology Co. Ltd. (Wuhan, China). The H460, PC9, H1299 and LO2 cells were maintained in Roswell Park Memorial Institute (RPMI)-1640 medium. The PC9/GR and SW620 cells were maintained in Dulbecco’s modified Eagle’s medium (DMEM) containing 10% (v/v) fetal bovine serum (FBS), 100 U/mL penicillin, and 100 mg/mL streptomycin. For the viability assays, 2,000 H1299, SW620, LO2 or PC9 cells or 1,000 H460 or PC9/GR cells were seeded in each well of a 96-well plate. The cells were allowed to attach for 12–24 h, subjected to the indicated inhibitors for 72 h, and incubated with 0.5 mg/mL MTT for 4 h. Cell viability was then determined from OD492. All experiments were performed in triplicate.
3.5 Lipid-water distribution coefficient and water solubility were calculated
Through the SwissADME web tool (https://www.swissadme.ch), we can access the physical–chemical properties, pharmacokinetics, drug-likeness, and other related information of compounds for free. This tool provides data such as the lipid-water partition coefficient and water solubility for the compounds we need.
3.6 Apoptosis detection assay
H460 and PC9 cells (1.5 × 10⁵/ well) were seeded in six-well plates for 12–24 h. After adhesion, the cells were subjected to 2.5 μM, 5 μM, and 10 μM of compounds 5, 14, and 24 for 48 h, trypsinized, and washed twice with cold phosphate-buffered saline (PBS). The cells were then centrifuged and their supernatants were removed. The washed cells were resuspended in 1 × binding buffer (500 μL), subjected to Annexin V-FITC (5 μL), and incubated at room temperature for 5 min. The cells were then subjected to propidium iodide (PI; 10 μL) and incubated in the dark at room temperature for 5 min. The stained cells were analyzed by flow cytometry (NovoCyte; Agilent Technologies, Santa Clara, CA, USA).
3.7 Cell cycle assay
H460 and PC9 cells (1.5 × 10⁵/ well) were seeded in six-well plates for 12–24 h. After adhesion, the cells were subjected to 2.5 μM, 5 μM, and 10 μM of compounds 5, 14 and 24 for 48 h, harvested by trypsinization, and washed with cold PBS. The cells were then centrifuged and their supernatants were removed. Then 1 mL ice was used to pre-cool 70% (v/v) ethanol and the latter was used to fix the cells at 4 ℃ for > 2 h. Staining buffer (0.5 mL), propidium iodide (PI) staining solution (20X; 25 μL), and RNase A (50X; 10 μL) were added to the cells and they were incubated in the dark at room temperature for 30 min. The stained cells were analyzed by flow cytometry. (NovoCyte; Agilent Technologies, Santa Clara, CA, USA).
3.8 ROS Burst Assay
H460 or PC9 cells (1.5 × 10⁵/ well) were inoculated into six-well plates and attached overnight before treatment with diverse concentrations of specified compounds for 48 h. Then, the cell culture medium was discarded and cells were dyed with 1 mmol/L JC-1 dye for another 30 min at 37 °C. Next, labeled cells were cleaned using PBS three times. Eventually, the cells were resuspended with 500 μL of PBS before using flow cytometry. (NovoCyte; Agilent Technologies, Santa Clara, CA, USA).
3.9 Mitochondrial member potential assay
H460 or PC9 cells (1.5 × 10⁵/ well) were inoculated into six-well plates and attached overnight before treatment with diverse concentrations of specified compounds for 48 h. Then, the cell culture medium was discarded and cells were dyed with 10 μM DCFH-DA dye for another 30 min at 37 °C. Next, labeled cells were cleaned using PBS three times. Eventually, the cells were resuspended with 500 μL of PBS before using flow cytometry. (NovoCyte; Agilent Technologies, Santa Clara, CA, USA).
3.10 Molecular docking
The crystal structure of PGAM1 (PDB: 5Y2I) was obtained from a protein database. The protein preparation tool in Maestro ver. 11.5 was used for docking. Ligands and water were removed from the structure and hydrogens were added to it. Staged minimization was performed using the default setting. All docking studies were conducted in Maestro ver. 11.5. The image representing the best pose was prepared with PyMol (https://www.pymol.org/).
3.11 Statistical analysis
Data are means ± standard deviation (SD) for three independent experiments. Student’s t-test was used to identify statistically significant differences among cells exposed to the various target compounds and control drugs. GraphPad Prism ver. 8.0.2 (GraphPad Software, Inc., La Jolla, CA, USA) was utilized for all statistical analyses and graph plotting. Differences were considered statistically significant at p < 0.05.
4 Conclusions
Based on earlier investigations of PGAM1 inhibitors (Hitosugi et al., 2012), we introduced sulfonamide substituents in 3-NH-EVO, synthesized various derivatives, designated compounds 9–38, and analyzed their structures by 1H and 13C NMR spectroscopy. These compounds have specific antitumor efficacy on PGAM1. Compounds 9, 18, and 28 exhibited the highest anticancer efficacy, and the strongest derivatives contained fluoride substituents. Fluoride is highly electronegative and potentiates and stabilizes different drugs. It also markedly improves lipophilicity, bioavailability, and permeability and facilitates the binding of various drugs to their respective receptor, protein, and enzyme targets (Sharma et al., 2017). Fluorinated anticancer agents also have superior antitumor activity because of their strong target specificity and selectivity. Certain fluorinated derivatives demonstrated high antitumor and chemosensitizing activity (Bellani et al., 2016). In addition, compounds 9, 18 and 28 could induce apoptosis, block the cell cycle at the G2/M stage, lead to bursting of reactive oxygen species, and induce mitochondrial dysfunction. In this study, we designed a series of compounds with good anti-tumor activity, but some compounds have poor targeting. In the subsequent study, we will strive to improve the targeting of compounds. Furthermore, the compounds synthesized in this work are racemic mixtures. Future studies will focus on investigating the antitumor activity of compounds with different chirality. Overall, the present work demonstrated that the benzenesulfonyl chloride-substituted evodiamine derivatives havegood antitumor efficacy against tumor cells and show promise as anticancer agents.
Authors' contributions
J.J.M and H.G conceived and designed the experiments; B.B.W and Y.Y.Z performed the experiments; W.Z.C,Y.W.W, W.T.Z and D.Y.G analyzed the data; Y.P.T contributed reagents/materials/analysis tools; B.B.W and H.G wrote the paper.
Acknowledgements
This research was financially supported by the National Natural Science Foundation of China (82003653, 81001669), Nature Science Foundation of Shaanxi Province (2020JZ-55), Key Laboratory Research Project of Shaanxi Province (20J5035) and Subject Innovation Team of Shaanxi University of Chinese Medicine (2019-PY02). Shaanxi Provincial Health Research Fund project (2022A018). Quality Improvement Project for Postgraduates of Shaanxi University of Chinese Medicine (JGCX006). Nature Science Foundation of Shaanxi University of Chinese Medicine (2023GP06).
Declaration of competing interest
The authors declare that they have no known competing financial interests or personal relationships that could have appeared to influence the work reported in this paper.
References
- Translational aspects of the mammalian target of rapamycin complexes in diabetic nephropathy. Antioxid. Redox Signal.. 2022;37:802-819.
- [CrossRef] [Google Scholar]
- Pyruvate kinase M2 activators promote tetramer formation and suppress tumorigenesis. Nat. Chem. Biol.. 2012;8:839-847.
- [CrossRef] [Google Scholar]
- Biosynthesis of sulfonamide and sulfamate antibiotics in actinomycete. J. Ind. Microbiol. Biotechnol.. 2021;48:kuab001
- [CrossRef] [Google Scholar]
- Phenylpropanoid-based sulfonamide promotes cyclin D1 and cyclin E down-regulation and induces cell cycle arrest at G1/S transition in estrogen positive MCF-7 cell line. Toxicol. In Vitro. 2019;59:150-160.
- [CrossRef] [Google Scholar]
- Epidemiology, patterns of care, and mortality for patients with acute respiratory distress syndrome in intensive care units in 50 countries. J. Am. Med. Assoc.. 2016;315:788-800.
- [CrossRef] [Google Scholar]
- PGAMgnam style: a glycolytic switch controls biosynthesis. Cancer Cell. 2012;22:565-566.
- [CrossRef] [Google Scholar]
- Sulfonamide Hypersensitivity. Clin. Rev. Allergy Immunol.. 2022;62:400-412.
- [CrossRef] [Google Scholar]
- SwissADME: a free web tool to evaluate pharmacokinetics, drug-likeness and medicinal chemistry friendliness of small molecules. Sci. Rep.. 2017;7:42717.
- [CrossRef] [Google Scholar]
- In silico drug screening analysis against the overexpression of PGAM1 gene in different cancer treatments. Biomed Res. Int.. 2021;2021:5515692.
- [CrossRef] [Google Scholar]
- Anticancer sulfonamides target splicing by inducing RBM39 degradation via recruitment to DCAF15. Science. 2017;356:eaal3755.
- [CrossRef] [Google Scholar]
- Phosphoglycerate mutase 1 coordinates glycolysis and biosynthesis to promote tumor growth. Cancer Cell. 2012;22:585-600.
- [CrossRef] [Google Scholar]
- Evodiamine exerts an anti-hepatocellular carcinoma activity through a WWOX-dependent pathway. Molecules. 2017;22:1175.
- [CrossRef] [Google Scholar]
- Development of Anthraquinone analogues as phosphoglycerate mutase 1 inhibitors. Molecules. 2019;24:845.
- [CrossRef] [Google Scholar]
- Expression of PGAM1 in renal clear cell carcinoma and its clinical significance. Int. J. Clin. Exp. Path.. 2015;8:9410-9415.
- [Google Scholar]
- Design, synthesis and bioactivity evaluation of novel evodiamine derivatives with excellent potency against gastric cancer. Eur. J. Med. Chem.. 2022;228:113960
- [CrossRef] [Google Scholar]
- Anti-inflammatory and anti-infectious effects of Evodia rutaecarpa (Wuzhuyu) and its major bioactive components. Chin. Med.. 2011;6:6.
- [CrossRef] [Google Scholar]
- PGAM1 regulation of ASS1 contributes to the progression of breast cancer through the cAMP/AMPK/CEBPB pathway. Mol. Oncol.. 2022;16:2843-2860.
- [CrossRef] [Google Scholar]
- Phosphoglycerate mutase 1 (PGAM1) promotes pancreatic ductal adenocarcinoma (PDAC) metastasis by acting as a novel downstream target of the PI3K/Akt/mTOR pathway. Oncol. Res.. 2018;26:1123-1131.
- [CrossRef] [Google Scholar]
- Research progress on evodiamine, a bioactive alkaloid of Evodiae fructus: focus on its anti-cancer activity and bioavailability (review) Exp. Ther. Med.. 2021;22:1327.
- [CrossRef] [Google Scholar]
- Fluorine in pharmaceuticals: looking beyond intuition. Science. 2007;317:1881-1886.
- [CrossRef] [Google Scholar]
- Proteomics identification of PGAM1 as a potential therapeutic target for urothelial bladder cancer. J. Proteomics. 2016;132:85-92.
- [CrossRef] [Google Scholar]
- Phosphoglycerate mutase 1 regulates dNTP pool and promotes homologous recombination repair in cancer cells. J. Cell Biol.. 2017;216:409-424.
- [CrossRef] [Google Scholar]
- Tumor cell metabolism: an integral view. Cancer Biol. Ther.. 2011;12:939-948.
- [CrossRef] [Google Scholar]
- Fluoride: a review of pre-clinical and clinical studies. Environ. Toxicol. Pharmacol.. 2017;56:297-313.
- [CrossRef] [Google Scholar]
- S1P/S1PR3 axis promotes aerobic glycolysis by YAP/c-MYC/PGAM1 axis in osteosarcoma. EBioMedicine. 2019;40:210-223.
- [CrossRef] [Google Scholar]
- Global cancer statistics 2020: GLOBOCAN estimates of incidence and mortality worldwide for 36 cancers IN 185 countries. CA Cancer J. Clin.. 2021;71:209-249.
- [CrossRef] [Google Scholar]
- A joint analysis of metabolomics and genetics of breast cancer. Breast Cancer Res.. 2014;16:415.
- [CrossRef] [Google Scholar]
- Oxidative stress activates SIRT2 to deacetylate and stimulate phosphoglycerate mutase. Cancer Res.. 2014;74:3630-3642.
- [CrossRef] [Google Scholar]
- Pharmacokinetic comparisons of rutaecarpine and evodiamine after oral administration of Wu-Chu-Yu extracts with different purities to rats. J. Ethnopharmacol.. 2012;139:395-400.
- [CrossRef] [Google Scholar]
- Synthesis and antitumor activity of evodiamine derivatives with nitro, amino, and methoxy groups. Nat. Prod. Commun.. 2022;17:1934578X211059645
- [CrossRef] [Google Scholar]
- Targeting PGAM1 in cancer: an emerging therapeutic opportunity. Eur. J. Med. Chem.. 2022;244:114798
- [CrossRef] [Google Scholar]
- Evodiamine reduced peripheral hypersensitivity on the mouse with nerve injury or inflammation. Mol. Pain.. 2020;16:174480692090256
- [CrossRef] [Google Scholar]
- Phosphoglycerate mutase 1 promotes cancer cell migration independent of its metabolic activity. Oncogene. 2017;36:2900-2909.
- [CrossRef] [Google Scholar]
- Simultaneous Quantification of limonin, two indolequinazoline alkaloids, and four quinolone alkaloids in Evodia rutaecarpa (Juss.) benth by HPLC-DAD method. J. Anal. Methods Chem.. 2013;2013:827361
- [CrossRef] [Google Scholar]
- Docosahexaenoic acid supresses breast cancer cell proliferation and migration by promoting the expression of miR-99a and targeting mTOR signaling. Arab. J. Chem.. 2021;14:103298
- [CrossRef] [Google Scholar]
- Antagonistic effects of two herbs in Zuojin Wan, a traditional Chinese medicine formula, on catecholamine secretion in bovine adrenal medullary cells. Phytomedicine. 2010;17:659-668.
- [CrossRef] [Google Scholar]
- Chalcone: a privileged structure in medicinal chemistry. Chem. Rev.. 2017;117:7762-7810.
- [CrossRef] [Google Scholar]
Appendix A
Supplementary data
Supplementary data to this article can be found online at https://doi.org/10.1016/j.arabjc.2023.105295.
Appendix A
Supplementary data
The following are the Supplementary data to this article:Supplementary data 1
Supplementary data 1


