

Translate this page into:
Design, synthesis and evaluation of novel dehydroabietic acid-dithiocarbamate hybrids as potential multi-targeted compounds for tumor cytotoxicity
⁎Corresponding authors. 59449273@qq.com (Ping Dai), Jianmingwu@swmu.edu.cn (Jianming Wu), lifangyao2006@163.com (Fangyao Li)
-
Received: ,
Accepted: ,
This article was originally published by Elsevier and was migrated to Scientific Scholar after the change of Publisher.
Abstract
In the present study, novel representatives of the important group of biologically-active, dehydroabietic acid-bearing dithiocarbamate moiety, were synthesized and characterized by 1H NMR, 13C NMR, HR-MS. The in vitro antiproliferative activity evaluation (MTT) indicated that these compounds exhibited potent inhibitory activities in various cancer cell lines (HepG-2, MCF-7, HeLa, T-24, MGC-803). Particularly, compound III-b possessed extraordinary cytotoxicity with low micromolar IC50 values ranging from 4.07 to 38.84 µM against tested cancer cell lines, while displayed weak cytotoxicity on two normal cell lines (LO-2 and HEK 293 T). Subsequently, the potential mechanisms of representative compound III-b were elementarily investigated by Transwell experiment, which showed III-b can inhibit cancer cells migration. Annexin-V/PI dual staining showed that the compound can induce HepG-2 cells apoptosis in a dose-dependent manner. Meanwhile this apoptosis may be related to the upregulated protein expression of cleaved-caspase 3, cleaved-caspase 9, Bax and downregulated of Bcl-2 indicated by Western Blot. Later study further confirmed that ROS levels in HepG-2 cells increased significantly with the rise of concentrations. In addition, through the network pharmacology data analyzing, the core targets and signaling pathways of compound III-b for treatment of liver neoplasms were forecasted. Molecular docking model showed that compound III-b had high affinity with hub targets (CASP3, EGFR, HSP90AA1, MAPK1, ERBB2, MDM2), suggesting that compound III-b might target the hub protein to modulate signaling activity. Taken together, these data indicated that dehydroabietic acid structural modification following the “Molecular hybridization” principle is a feasible way to discover the potential multi-targeted antitumor compounds.
Keywords
Dehydroabietic Acid
Dithiocarbamate
Synthesis
Antitumor activity
Molecular docking

- DHA
-
Dehydroabietic acid
- HR-MS
-
High Resolution Mass Spectrometry
- TPSA
-
Topological Polar Surface Area
- iLOGP
-
Lipophilicity, Log Po/w.
- ABS
-
Abbott Bioavailability Score.
- CASP3
-
A gene encodes the protein of caspase-3 (Cysteine-aspartic Acid Protease).
- EGFR
-
A gene encodes the protein of EGFR (The epidermal growth factor receptor, a tyrosine kinase).
- HSP90AA1
-
A gene encodes the protein of Hsp90α (Heat shock protein 90α).
- MAPK1
-
A gene encodes the protein of MAPK1 (Mitogen-Activated Protein Kinase 1).
- ERBB2
-
A gene encodes the protein of ERBB2 namely, HER2 (Epidermal Growth Factor Receptor 2).
- MDM2
-
A gene encodes the protein of MDM2 (Mouse Double Minute 2)
Abbreviations
1 Introduction
Nowadays, cancer is among the leading causes of death globally, which is a multifaceted and multi-mechanistic disease (Dadashpour and Emami 2018, An et al., 2021). Chemotherapy, as one of the most common treatments for cancer, is now facing the drawbacks of cytotoxicity on non-malignant tissues and the developing resistance of cancer cells (Ma et al., 2019), which cause the pressing need for novel compounds and therapies with higher efficacy, selectivity to tumor cells (Kerru et al., 2017). Natural products with a wile structural diversity and pleiotropic effects (Omar et al., 2021), which have been considered a productive source and lead molecules (Mishra and Tiwari 2011, Mondal et al., 2012). Significantly, terpenoids as natural molecular with potent pharmaceutical activities have demonstrated extensive potentials for the treatment of various disease (Newman et al., 2003).
Rosin is a kind of natural and renewable biological resource (Yuan et al., 2020), with China the largest production country in the world (Hou et al., 2017, Kugler et al., 2019). Dehydroabietic acid (Fig. 1, (A)) is a natural tricyclic diterpenoid resin acid extracted from rosin with a yield of about 50 % by disproportionation reaction, which possess the stable properties, strong antioxidant capacity, fabulous biocompatibility and biodegradability (Huang et al., 2015, Zhang et al., 2017). Dithiocarbamate (Fig. 1, (B)) is an organic molecule widely existed in nature. Its functional groups and heteroatoms, with strong metal bonding ability, can effectively chelate heavy metals and remove NO free radicals in vivo, showing various pharmacological activities such as antitumor, antibacterial, antioxidant and anti-inflammatory (Alagarsamy et al., 2006, Ajiboye et al., 2022). A variety of researches have been reported that dithiocarbamates (DTCs) with potential pharmacological activities, which is extensively being incorporated into antitumor compounds (Li et al., 2015, Xie et al., 2018, Yang et al., 2018). For instance, novel coumarin-bearing dithiocarbamate moiety exhibited potent tumor cytotoxicity as well as induced apoptosis and G2/M phase arrest in human colorectal cancer cell lined SW620 and SW480 (Zhu et al., 2021).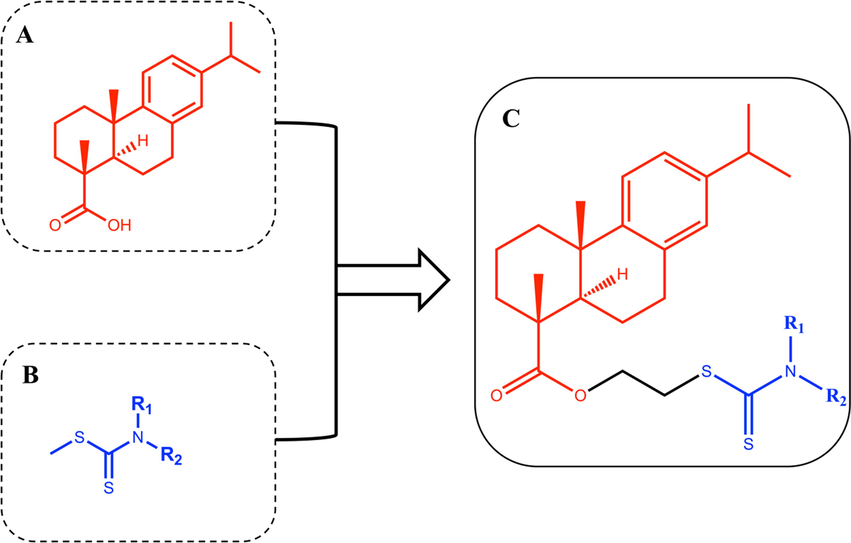
(A) Structure of dehydroabietic acid (DHA). (B) Structure of Dithiocarbamates (DTCs). (C) Structure of hybrids of dehydroabietic acid bearing dithiocarbamate moiety.
“Molecular hybridization” is a molecular modification method with high efficacy to acquire multi-ligands/compounds which possessed pharmacokinetic advantages over concomitant administration of two different drugs (Bosquesi et al., 2011). Hybrid compounds can be constructed by linking pharmacophore subunits directly or with spacer agents. The simple association of two distinct active principles can also be considered a hybrid compound (Morphy et al., 2004). Inspired by this principle, we designed the process of synthesizing the novel hybrids of dehydroabietic acid bearing dithiocarbamate moiety to find compounds with high-performance tumor cytotoxicity (Fig. 1, (C)).
Network pharmacology can provide a feasible way to predict the complex relationship between drugs and diseases by searching and analyzing the data information in a large number of databases (Casas et al., 2019, Luo et al., 2020). Based on disease-gene-drug correlations, network pharmacology can be used to explore potential therapeutic targets of drugs and improve the efficiency and insight of virtual drug screening (Hao da and Xiao 2014, Jiang et al., 2019). In addition, molecular docking simulation is a new strategy in computer-aided drug design based on receptor characteristics and receptor-drug interactions (Saikia and Bordoloi 2019, Santos et al., 2019). Molecular docking’s ability is scored in a variety of ways. Subsequently, core proteins and signaling pathways can be inferred by visualizing interactions between small molecules and target proteins (Kaur et al., 2019, Pinzi and Rastelli 2019, Aucar and Cavasotto 2020). In conclusion, using these two techniques can improve the reliability and insight needed to predict the mechanism of active compounds due to the large number of available data sources.
Although there are a few reports on the synthesis and antitumor activity of dehydroabietic acid derivatives (Wang et al., 2018, Zaki et al., 2021), the complex synthesis conditions and unstable product properties limit the development of intensive research. At the same time, the currently unclear action mechanism and key pathways behind its antitumor biological activity are also rarely reported. Thus, using the “Molecular hybridization” principle, a series of novel dehydroabietic acid-dithiocarbamate hybrids were synthesized, which were characterized by 1H NMR, 13C NMR, HR-MS. Then, the in vitro inhibition activity on five human tumor cell lines was preliminarily evaluated by the trace enzyme reaction colorimetric method of tetramethylazazole salt (MTT). The in vitro toxicity of these compounds was preliminarily evaluated on normal human liver cells (LO-2) and human embryonic kidney cells (HEK-293 T). Furthermore, to find out potentially patent compounds with safety and effectiveness, the physical parameters of active compounds were calculated by using the Lipinski’s Rule of Five, and the optimal representative compounds III-b were selected for further mechanism research. Subsequently, the possible core targets and signaling pathways of compound III-b for the treatment of liver neoplasms were predicted by network pharmacology method, and the affinity ability and binding mode of compound III-b and core targets were predicted by molecular docking technology. All the results suggested that dehydroabietic acid structural modification following the “Molecular hybridization” strategy provided new thoughts and ideas of finding the multi-target oriented antitumor compounds with more safety, stability, and high efficiency, which were deserved for further investigations as potential antitumor agents.
2 Materials and methods
2.1 General
All the commercially available starting materials and solvents were reagent grade and were purchased from Aladdin and used without purification. Dehydroabietic acid were purchased from Guangxi Wuzhou Co., ltd. and its purity was>98 %. The melting point was measured by WRX-4 micromelting point tester. 1H and 13C NMR spectra were determined on AVANCE AV600 NUCLEAR magnetic resonance instrument of Burker. Data were presented as follows: chemical shift, multiplicity (s = singlet, brs = broad singlet, d = doublet, brd = broad doublet, t = triplet, m = multiplet), J = coupling constant in hertz (Hz). Silica gel (200–300 mesh) manufactured by Qingdao Haiyang Chemical Group Co. (China) was used for general chromatography.
2.2 General procedure for dehydroabietic Acid-2′-bromoethyl ester (Compound Ⅱ)
Dehydroabietic acid 30 g (0.0913 mol) and anhydrous potassium carbonate 21.2 g (0.1534 mol) were dissolved in 150 mL DMF and reacted at 40 ℃. Then, 9.5 mL (0.1096 mol) of 1, 2-dibromoethane was added slowly for 4 h. The solution was poured into 250 mL iced water and extracted with ethyl acetate for four times. The organic layer was combined and washed with saturated salt water for several times. Then, the mixture was purified by silica gel chromatography with a mixture of petroleum ether: ethyl acetate (V:V) = 10:1 as eluent to give compound Ⅱ. The yield of 83.3 %. m. p. 50.3℃-51.7℃; 1H NMR (600 MHz, CDCl3) δ 7.22 (d, 1H, J = 8.4 Hz), 7.06 (d, 1H, J = 8.4 Hz), 6.95 (s, 1H), 4.50–4.37 (m, 2H), 3.57–3.54 (t, 2H, J = 6.0 Hz), 3.01–2.97 (m, 1H), 2.94–2.85 (m, 2H), 2.33–2.37 (m, 2H), 1.92–1.71 (m, 5H), 1.47–1.57 (m, 2H), 1.35 (s, 3H), 1.28 (s, 3H), 1.27 (d, 6H, J = 1.8 Hz). 13C NMR (150 MHz, CDCl3) δ 179.56, 148.22, 147.18, 136.13, 128.39, 125.62, 125.40, 65.46, 49.25, 46.08, 39.36, 38.39, 38.09, 34.91, 30.49, 25.46, 23.28, 20.13, 17.98.
2.3 General procedure for the target compounds III-a ∼ III-s.
The general procedure for the synthesis of dehydroabietic acid-dithiocarbamate hybrids is shown in Fig. 2. Briefly, carbon disulfide (0.6000 mmol) and anhydrous tripotassium phosphate (0.9000 mmol) were added in a secondary amine (0.5000 mmol) DMF (6 mL) solution. After stirring at room temperature for 30 min, the compound Ⅱ (0.5000 mmol) was added. The reaction process was monitored by TLC. When the reaction was completed, the reaction solution was washed with iced water (40 mL) to precipitate colloidal insoluble substance, extracted with ethyl acetate 40 mL × 3, combined with organic layer and added anhydrous sodium sulfate to seal and dry overnight. The product was purified by column chromatography with petroleum ether: ethyl acetate (V:V) = 12:1 or dichloromethane: methanol (V:V) = 20:1. The target compound III-a ∼ III-s was obtained and the yield was calculated. The compound structure was characterized by 1H NMR, 13C NMR and HR-MS. The structural characterization data of the obtained compounds are as follows: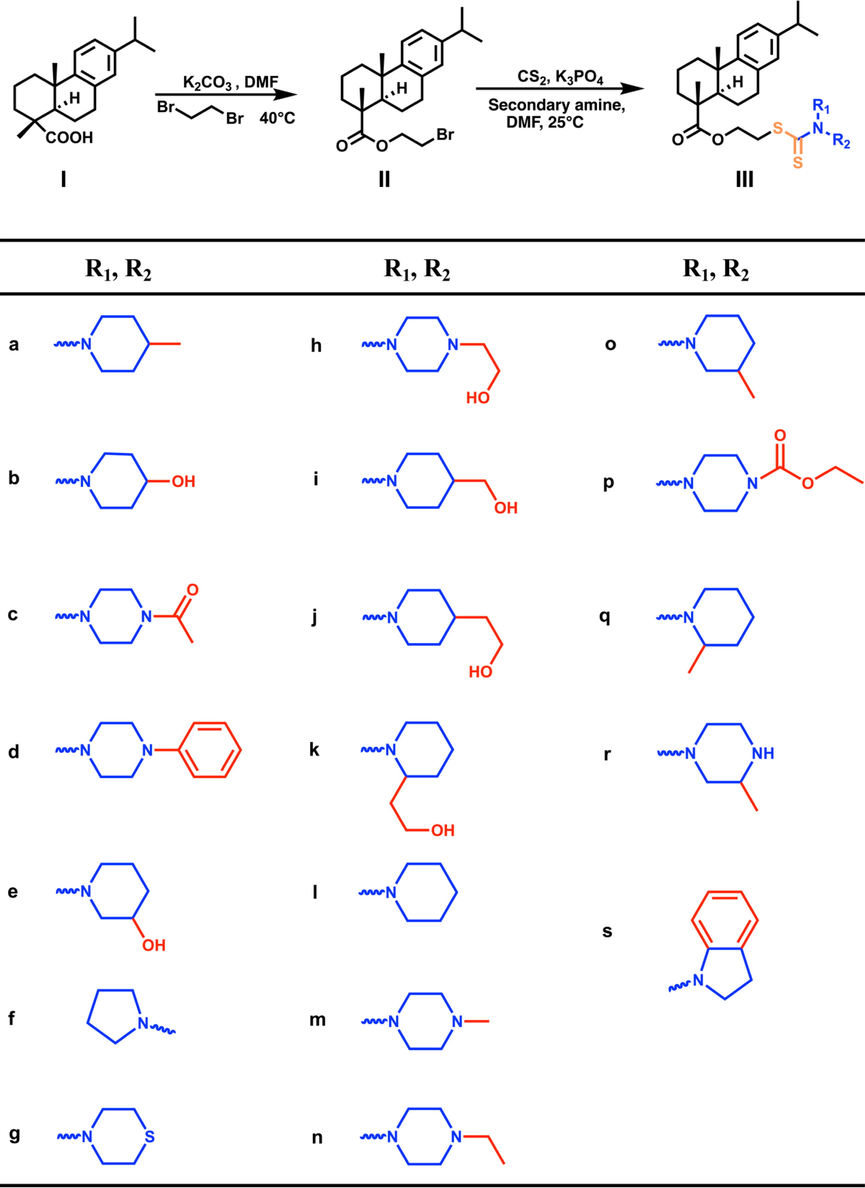
The synthesis route of dehydroabietic acid-dithiocarbamate hybrids (IIIa ∼ IIIs).
2-((4-methylpiperidine-1-carbonothioyl)thio)ethyl (1R,4aS,10aR)-7-isopropyl-1,4a-dimethyl-1,2,3,4,4a,9,10,10a-octahydrophenanthrene-1-carboxylate (III-a). Light yellow jelly, yield 58.43 %. 1H NMR (400 MHz, CDCl3) δ 7.17 (d, J = 8.2 Hz, 1H, aromatic), 7.00 (dd, J = 8.1, 2.3 Hz, 1H, aromatic), 6.87 (d, J = 2.3 Hz, 1H, aromatic), 5.64 – 5.24 (m, 1H, CH2), 4.80 – 4.41 (m, 1H, CH2), 4.40 – 4.23 (m, 2H, CH2), 3.64 – 3.57 (m, 2H, CH2), 3.10 (t, J = 11.4 Hz, 2H, CH2), 3.00 – 2.75 (m, 3H, CH2, CH), 2.34 – 2.20 (m, 2H, CH2), 1.90 – 1.69 (m, 7H, CH2, C10a-H), 1.68 – 1.34 (m, 4H, CH2), 1.31 – 1.26 (m, 4H, CH2, CH3), 1.24 – 1.20 (m, 9H, CH3), 0.97 (d, J = 6.1 Hz, 3H, CH3). 13C NMR (101 MHz, CDCl3) 194.53, 178.26, 146.93, 145.69, 134.72, 126.89, 124.24, 123.95, 62.85, 60.39, 47.72, 44.79, 37.99, 37.00, 36.55, 35.73, 33.48, 30.95, 30.19, 25.25, 24.02, 21.82, 21.28, 21.05, 18.65, 16.55, 14.23. HR-MS(m/z): calcd for C28H43NO2S2 [M + Na]+: 524.2633; found: 524.2639.
2-((4-hydroxypiperidine-1-carbonothioyl)thio)ethyl (1R,4aS,10aR)-7-isopropyl-1,4a-dimethyl-1,2,3,4,4a,9,10,10a-octahydrophenanthrene-1-carboxylate (III-b). Lemon yellow jelly. yield 56.52 %. 1H NMR (600 MHz, CDCl3) δ 7.17 (d, J = 8.1 Hz, 1H, aromatic), 7.00 (dd, J = 8.2, 2.3 Hz, 1H, aromatic), 6.87 (d, J = 2.2 Hz, 1H, aromatic), 4.61 – 4.50 (m, 1H, CH2), 4.36 – 4.26 (m, 2H, CH2), 4.24 – 4.11 (m, 2H, CH2), 4.08 – 4.02 (m, 1H, OH), 3.81 – 3.70 (m, 1H, CH), 3.61 (t, J = 6.2 Hz, 2H, CH2), 2.97 – 2.77 (m, 4H, CH2, CH), 2.33 – 2.22 (m, 2H, CH2), 1.95 – 1.89 (m, 2H, CH2), 1.86 – 1.69 (m, 5H, CH2, C10a-H), 1.68 – 1.62 (m, 2H, CH2), 1.53 – 1.40 (m, 2H, CH2), 1.27 (s, 3H, CH3), 1.23 – 1.19 (m, 9H, CH3). 13C NMR (151 MHz, CDCl3) 195.01, 178.36, 146.90, 145.74, 134.70, 126.90, 124.25, 123.97, 66.07, 62.77, 47.74, 44.77, 37.95, 36.98, 36.53, 35.87, 33.47, 30.17, 25.25, 24.01, 21.81, 18.62, 16.54. HR-MS(m/z): calcd for C28H41NO3S2[M + H]+: 504.2606; found: 504.2602.
2-((4-acetylpiperazine-1-carbonothioyl)thio)ethyl (1R,4aS,10aR)-7-isopropyl-1,4a-dimethyl-1,2,3,4,4a,9,10,10a-octahydrophenanthrene-1-carboxylate (III-c). Light yellow jelly, yield 56.43 %. 1H NMR (600 MHz, CDCl3) δ 7.19 – 7.15 (m, 1H, aromatic), 7.01 (dd, J = 8.2, 2.3 Hz, 1H, aromatic), 6.87 (d, J = 2.2 Hz, 1H, aromatic), 4.39 – 4.30 (m, 2H, CH2), 4.28 – 4.12 (m, 2H, CH2), 3.99 (s, 2H, CH2), 3.78 – 3.68 (m, 2H, CH2), 3.66 – 3.44 (m, 4H, CH2), 2.90 – 2.78 (m, 3H, CH2, CH), 2.32 – 2.22 (m, 2H, CH2), 2.13 (s, 3H, COCH3), 1.87 – 1.69 (m, 5H, CH2, C10a-H), 1.51 – 1.40 (m, 2H, CH2), 1.28 – 1.25 (m, 3H, CH3), 1.23 – 1.19 (m, 9H, CH3). 13C NMR (151 MHz, CDCl3) 178.26, 169.38, 146.87, 145.80, 134.63, 126.88, 124.26, 124.01, 66.27, 62.49, 61.45, 47.74, 45.20, 44.75, 40.57, 37.94, 36.98, 36.54, 35.74, 33.46, 30.16, 30.14, 25.23, 24.00, 21.82, 21.36, 18.60, 16.54. HR-MS(m/z): calcd for C29H42N2O3S2[M + H]+: 531.2715; found: 531.2711.
2-((4-phenylpiperazine-1-carbonothioyl)thio)ethyl (1R,4aS,10aR)-7-isopropyl-1,4a-dimethyl-1,2,3,4,4a,9,10,10a-octahydrophenanthrene-1-carboxylate (III-d). White acicular crystal, yield 58.26 %. 1H NMR (600 MHz, CDCl3) δ 7.32 – 7.28 (m, 2H, aromatic), 7.18 (d, J = 8.3 Hz, 1H, aromatic), 7.01 (dd, J = 8.2, 2.3 Hz, 1H, aromatic), 6.96 – 6.90 (m, 3H, aromatic), 6.88 (d, J = 1.5 Hz, 1H, aromatic), 4.55 – 4.41 (m, 2H, CH2), 4.41 – 4.29 (m, 2H, CH2), 4.17 – 4.00 (m, 2H, CH2), 3.68 – 3.62 (m, 2H, CH2), 3.32 – 3.25 (m, 4H, CH2), 2.95 – 2.80 (m, 3H, CH2, CH), 2.32 – 2.25 (m, 2H, CH2), 1.86 – 1.65 (m, 5H, CH2, C10a-H), 1.53 – 1.41 (m, 2H, CH2), 1.28 (s, 3H, CH3), 1.24 – 1.20 (m, 9H, CH3). 13C NMR (151 MHz, CDCl3) δ 195.98, 178.28, 150.27, 146.91, 145.77, 134.69, 129.35, 126.90, 124.26, 123.98, 120.63, 116.37, 77.26, 77.05, 76.83, 62.64, 48.78, 47.74, 44.77, 37.96, 36.99, 36.54, 35.68, 33.47, 30.19, 25.25, 24.02, 24.00, 21.82, 18.62, 16.55. HR-MS(m/z): calcd for C33H44N2O2S2[M + H]+: 565.2922; found: 565.2914.
2-((3-hydroxypiperidine-1-carbonothioyl)thio)ethyl (1R,4aS,10aR)-7-isopropyl-1,4a-dimethyl-1,2,3,4,4a,9,10,10a-octahydrophenanthrene-1-carboxylate (III-e), Light yellow jelly, yield 51.62 %. 1H NMR (600 MHz, CDCl3) δ 7.17 (s, 1H, aromatic), 7.00 (dd, J = 8.3, 2.2 Hz, 1H, aromatic), 6.88 (d, J = 2.2 Hz, 1H, aromatic), 4.50 (s, 1H, CH2), 4.34 – 4.28 (m, 2H, CH2), 3.93 (s, 1H, CH2), 3.86 (s, 1H, OH), 3.66 – 3.58 (m, 3H, CH2, CH), 2.97 – 2.77 (m, 5H, CH2, CH), 2.30 – 2.23 (m, 2H, CH2), 1.86 – 1.67 (m, 7H, CH2, C10a-H), 1.53 – 1.39 (m, 4H, CH2), 1.28 – 1.26 (m, 3H, CH3), 1.23 – 1.19 (m, 9H, CH3). 13C NMR (151 MHz, CDCl3) δ 178.31, 146.91, 145.73, 134.72, 132.32, 126.89, 124.25, 123.96, 66.61, 65.59, 62.67, 47.73, 44.76, 37.94, 36.98, 36.50, 31.45, 30.58, 30.16, 29.71, 25.23, 24.00, 21.80, 19.20, 18.61, 16.53. HR-MS (m/s): calcd for C28H41NO3S2[M + H]+: 504.2606; found: 504.2600.
2-((pyrrolidine-1-carbonothioyl)thio)ethyl (1R,4aS,10aR)-7-isopropyl-1,4a-dimethyl-1,2,3,4,4a,9,10,10a-octahydrophenanthrene-1-carboxylate (III-f). Semi-transparent glue, yield 61.56 %. 1H NMR (600 MHz, CDCl3) δ 7.17 (d, J = 8.1 Hz, 1H, aromatic), 7.01 (dd, J = 8.2, 2.3 Hz, 1H, aromatic), 6.88 (d, J = 2.2 Hz, 1H, aromatic), 4.38 – 4.26 (m, 2H, CH2), 3.92 (t, J = 6.4 Hz, 2H, CH2), 3.68 – 3.57 (m, 4H, CH2), 2.95 – 2.80 (m, 3H, CH2, CH), 2.33 – 2.24 (m, 2H, CH2), 2.08 – 1.95 (m, 4H, CH2), 1.88 – 1.77 (m, 3H, CH2, C10a-H), 1.72 – 1.62 (m, 2H, CH2), 1.51 – 1.40 (m, 2H, CH2), 1.28 (s, 3H, CH3), 1.23 – 1.20 (m, 9H, CH3). 13C NMR (151 MHz, CDCl3) 191.65, 178.28, 146.92, 145.71, 134.74, 126.89, 124.24, 123.94, 62.88, 55.18, 50.62, 47.72, 44.76, 37.96, 36.98, 36.53, 35.03, 33.47, 30.16, 26.05, 25.24, 24.28, 24.01, 21.80, 18.63, 16.53. HR-MS(m/z): calcd for C27H39NO2S2[M + H]+: 474.2500; found: 474.2510.
2-((thiomorpholine-4-carbonothioyl)thio)ethyl (1R,4aS,10aR)-7-isopropyl-1,4a-dimethyl-1,2,3,4,4a,9,10,10a-octahydrophenanthrene-1-carboxylate (III-g). Light yellow jelly, yield 55.79 %. 1H NMR (600 MHz, CDCl3) δ 7.18 (d, J = 8.3 Hz, 1H, aromatic), 7.01 (dd, J = 8.2, 2.3 Hz, 1H, aromatic), 6.88 (d, J = 2.2 Hz, 1H, aromatic), 4.58 – 4.55 (m, 1H, CH2), 4.37 – 4.26 (m, 2H, CH2), 4.26 – 4.18 (m, 1H, CH2), 3.69 – 3.58 (m, 2H, CH2), 2.94 – 2.81 (m, 3H, CH2, CH), 2.77 – 2.64 (m, 4H, CH2), 2.33 – 2.23 (m, 2H, CH2), 1.88 – 1.71 (m, 4H, CH2, C10a-H), 1.64 (d, J = 11.7 Hz, 2H, CH2), 1.52 – 1.39 (m, 2H, CH2), 1.27 (d, J = 8.3 Hz, 4H, CH2, CH3), 1.24 – 1.20 (m, 9H, CH3). 13C NMR (151 MHz, CDCl3) 195.66, 178.25, 146.90, 145.78, 134.65, 126.89, 124.26, 124.00, 62.56, 60.42, 47.74, 44.76, 37.96, 36.98, 36.50, 35.76, 33.48, 30.17, 25.23, 24.04, 24.02, 21.81, 18.62, 16.54. HR-MS(m/z): calcd for C27H39NO2S3[M + H]+: 506.2221; found: 506.2219.
2-((4-(2-hydroxyethyl)piperazine-1-carbonothioyl)thio)ethyl (1R,4aS,10aR)-7-isopropyl-1,4a-dimethyl-1,2,3,4,4a,9,10,10a-octahydrophenanthrene-1-carboxylate (III-h). Light yellow transparent jelly, yield 56.88 %.1H NMR (600 MHz, CDCl3) δ 7.19 – 7.15 (m, 1H, aromatic), 7.00 (dd, J = 8.1, 2.2 Hz, 1H, aromatic), 6.87 (d, J = 2.2 Hz, 1H, aromatic), 4.39 – 4.25 (m, 2H, CH2), 3.95 (s, 1H, OH), 3.68 – 3.59 (m, 4H, CH2), 2.94 – 2.78 (m, 3H, CH2, CH), 2.64 – 2.57 (m, 6H, CH2), 2.33 – 2.20 (m, 4H, CH2), 1.87 – 1.76 (m, 3H, CH2, C10a-H), 1.75 – 1.57 (m, 3H, CH2), 1.51 – 1.40 (m, 2H, CH2), 1.29 – 1.24 (m, 4H, CH2, CH3), 1.23 – 1.20 (m, 9H, CH3). 13C NMR (151 MHz, CDCl3) 195.87, 178.28, 146.90, 145.75, 134.68, 126.88, 124.26, 123.98, 121.14, 62.66, 59.07, 57.96, 52.33, 47.73, 44.76, 37.95, 36.98, 36.53, 35.68, 33.47, 30.18, 25.24, 24.01,21.81, 18.62, 16.54. HR-MS(m/z): calcd for C29H44N2O3S2[M + H]+: 533.2872; found: 533.2887.
2-((4-(hydroxymethyl)piperidine-1-carbonothioyl)thio)ethyl (1R,4aS,10aR)-7-isopropyl-1,4a-dimethyl-1,2,3,4,4a,9,10,10a-octahydrophenanthrene-1-carboxylate (III-i). Yellowish green jelly, yield 58.42 %. 1H NMR (600 MHz, CDCl3) δ 7.17 (d, J = 8.3 Hz, 1H, aromatic), 7.00 (dd, J = 8.2, 2.3 Hz, 1H, aromatic), 6.87 (d, J = 2.2 Hz, 1H, aromatic), 5.55 (s, 1H, CH2), 4.74 – 4.56 (m, 1H, CH2), 4.37 – 4.25 (m, 2H, CH2), 3.65 – 3.56 (m, 2H, CH2), 3.54 – 3.49 (m, 2H, CH2), 3.25 – 3.00 (m, 2H, CH2), 2.94 – 2.77 (m, 3H, CH2, CH), 2.33 – 2.23 (m, 2H, CH2), 1.90 – 1.71 (m, 8H, CH2, C10a-H), 1.70 – 1.62 (m, 2H, CH2), 1.51 – 1.40 (m, 2H, CH2), 1.28 – 1.25 (m, 4H, CH2, CH3), 1.23 – 1.19 (m, 9H, CH3). 13C NMR (151 MHz, CDCl3) 194.84, 178.35, 146.91, 145.73, 134.72, 126.90, 124.25, 123.95, 66.84, 62.81, 60.44, 47.73, 44.76, 38.51, 37.95, 36.98, 36.53, 35.70, 33.47, 30.17, 25.25, 24.02, 24.01, 21.81, 18.62, 16.53. HR-MS (m/z): calcd for C29H43NO3S2[M + H]+: 518.2763; found: 518.2757.
2-((4-(2-hydroxyethyl)piperidine-1-carbonothioyl)thio)ethyl (1R,4aS,10aR)-7-isopropyl-1,4a-dimethyl-1,2,3,4,4a,9,10,10a-octahydrophenanthrene-1-carboxylate (III-j). Light brownish yellow jelly, yield 58.49 %. 1H NMR (400 MHz, CDCl3) δ 7.17 (dd, J = 8.2 Hz, 1H, aromatic), 7.00 (dd, J = 8.1, 2.3 Hz, 1H, aromatic), 6.87 (d, J = 2.2 Hz, 1H, aromatic), 5.53 (s, 1H, CH2), 4.68 – 4.51 (m, 1H, CH2), 4.31 (dd, J = 15.9, 12.0 Hz, 2H, CH2), 3.71 (t, J = 6.5 Hz, 2H, CH2), 3.66 – 3.55 (m, 2H, CH2), 3.21 – 2.96 (m, 2H, CH2), 2.95 – 2.77 (m, 3H, CH2, CH), 2.32 – 2.23 (m, 2H, CH2), 1.91 – 1.70 (m, 8H, CH2, C10a-H), 1.67 – 1.59 (m, 3H, CH2, CH), 1.50 – 1.38 (m, 2H, CH2), 1.28 – 1.25 (m, 5H, CH2, CH3), 1.24 – 1.20 (m, 9H, CH3). 13C NMR (101 MHz, CDCl3) 194.56, 178.36, 146.90, 145.72, 134.73, 126.90, 124.27, 123.96, 60.46, 60.09, 47.72, 44.74, 38.60, 37.94, 36.97, 36.51, 35.70, 33.47, 32.50, 30.18, 25.26, 24.03, 21.81, 21.10, 18.62, 16.53, 14.22. HR-MS (m/z): calcd for C30H45NO3S2[M + H]+: 532.2919; found: 532.2916.
2-((2-(2-hydroxyethyl)piperidine-1-carbonothioyl)thio)ethyl (1R,4aS,10aR)-7-isopropyl-1,4a-dimethyl-1,2,3,4,4a,9,10,10a-octahydrophenanthrene-1-carboxylate (III-k). Light yellow jelly, yield 65.13 %. 1H NMR (400 MHz, CDCl3) δ 7.17 (d, J = 8.2 Hz, 1H, aromatic), 7.00 (dd, J = 8.1, 2.3 Hz, 1H, aromatic), 6.87 (d, J = 2.1 Hz, 1H, aromatic), 4.52 (d, J = 13.0 Hz, 1H, CH2), 4.42 – 4.28 (m, 2H, CH2), 3.66 – 3.57 (m, 3H, CH2, CH), 3.44 – 3.31 (m, 1H, CH2), 3.15 – 3.04 (m, 1H, CH2), 2.93 – 2.75 (m, 3H, CH2, CH), 2.32 – 2.23 (m, 2H, CH2), 2.22 – 2.06 (m, 2H, CH2), 1.87 – 1.71 (m, 7H, CH2, C10a-H), 1.71 – 1.61 (m, 5H, CH2), 1.51 – 1.37 (m, 2H, CH2), 1.29 – 1.26 (m, 4H, CH2, CH3), 1.24 – 1.20 (m, 9H, CH3). 13C NMR (101 MHz, CDCl3) 178.30, 171.22, 146.88, 145.73, 134.69, 126.89, 124.26, 123.98, 60.44, 58.13, 47.73, 46.04, 44.76, 37.94, 36.98, 36.52, 35.75, 33.47, 33.01, 30.19, 29.38, 25.25, 24.01, 21.83, 21.09, 19.23, 18.61, 16.53, 14.22. HR-MS (m/z): calcd for C30H45NO3S2[M + H]+: 532.2919; found: 532.2927.
2-((piperidine-1-carbonothioyl)thio)ethyl (1R,4aS,10aR)-7-isopropyl-1,4a-dimethyl-1,2,3,4,4a,9,10,10a-octahydrophenanthrene-1-carboxylate (III-l). Lemon yellow solid, yield 56.81 %. 1H NMR (400 MHz, CDCl3) δ 7.18 (d, J = 8.2 Hz, 1H, aromatic), 7.01 (dd, J = 8.1, 2.3 Hz, 1H, aromatic), 6.87 (d, J = 2.2 Hz, 1H, aromatic), 4.39 – 4.23 (m, 4H, CH2), 3.86 (s, 2H, CH2), 3.62 (t, J = 6.3 Hz, 2H, CH2), 2.94 – 2.79 (m, 3H, CH2, CH), 2.33 – 2.24 (m, 2H, CH2), 1.86 – 1.75 (m, 3H, CH2, C10a-H), 1.72 – 1.62 (m, 8H, CH2), 1.53 – 1.39 (m, 2H, CH2), 1.29 – 1.26 (m, 3H, CH3), 1.23 – 1.20 (m, 9H, CH3). 13C NMR (101 MHz, CDCl3) 194.39, 178.32, 146.92, 145.71, 134.74, 126.90, 124.27, 123.96, 62.86, 47.73, 44.75, 37.94, 36.98, 36.50, 35.66, 33.48, 30.19, 25.27, 24.31, 24.02, 21.81, 18.64, 16.54. HR-MS (m/z): calcd for C28H41NO2S2[M + H]+: 488.2657; found: 488.2684.
2-((4-methylpiperazine-1-carbonothioyl)thio)ethyl (1R,4aS,10aR)-7-isopropyl-1,4a-dimethyl-1,2,3,4,4a,9,10,10a-octahydrophenanthrene-1-carboxylate (III-m). Light yellow jelly, yield 57.33 %. 1H NMR (400 MHz, CDCl3) δ 7.17 (d, J = 8.2 Hz, 1H, aromatic), 7.00 (dd, J = 8.2, 2.3 Hz, 1H, aromatic), 6.87 (d, J = 2.2 Hz, 1H, aromatic), 4.38 – 4.25 (m, 4H, CH2), 3.94 (s, 2H, CH2), 3.61 (t, J = 6.2 Hz, 2H, CH2), 2.90 – 2.81 (m, 3H, CH2, CH), 2.52 – 2.45 (m, 4H, CH2), 2.32 (s, 3H, CH2, C10a-H), 1.90 – 1.73 (m, 4H, CH2), 1.72 – 1.61 (m, 2H, CH2), 1.52 – 1.38 (m, 2H, CH2), 1.29 – 1.25 (m, 4H, CH2, CH3), 1.23 – 1.19 (m, 9H, CH3). 13C NMR (101 MHz, CDCl3) 195.77, 178.29, 146.88, 145.74, 134.69, 126.89, 124.26, 123.97, 62.69, 54.35, 47.71, 45.61, 44.73, 37.93, 36.97, 36.52, 35.65, 33.47, 30.19, 25.26, 24.02, 24.01, 21.81, 18.62, 16.53, 14.23. HR-MS (m/z): calcd for C28H42N2O2S2[M + H]+: 503.2766; found: 503.2782.
2-((4-ethylpiperazine-1-carbonothioyl)thio)ethyl (1R,4aS,10aR)--7-isopropyl-1,4a-dimethyl-1,2,3,4,4a,9,10,10a-octahydrophenanthrene-1-carboxylate (III-n). Brown-yellow oily substance, yield 68.5 %. 1H NMR (400 MHz, CDCl3) δ 7.17 (d, J = 8.2 Hz, 1H, aromatic), 7.00 (dd, J = 8.1, 2.4 Hz, 1H, aromatic), 6.87 (d, J = 2.3 Hz, 1H, aromatic), 4.41 – 4.22 (m, 4H, CH2), 3.95 (s, 2H, CH2), 3.62 (t, J = 6.2 Hz, 2H, CH2), 2.94 – 2.77 (m, 3H, CH2, CH), 2.56 – 2.49 (m, 4H, CH2), 2.48 – 2.42 (m, 2H, CH2), 2.34 – 2.22 (m, 2H, CH2), 1.79 – 1.63 (m, 5H, CH2, C10a-H), 1.52 – 1.39 (m, 2H, CH2), 1.28 – 1.26 (m, 3H, CH3), 1.24 – 1.20 (m, 9H, CH3), 1.11 (t, J = 7.2 Hz, 3H, CH3). 13C NMR (101 MHz, CDCl3) δ 195.58, 178.26, 146.90, 145.74, 134.69, 126.88, 124.23, 123.95, 62.71, 52.14, 51.89, 47.72, 44.77, 37.96, 36.98, 36.55, 35.64, 33.47, 30.17, 25.22, 23.98, 21.81, 18.61, 16.52, 11.96. HR-MS(m/z):calcd for C29H44N2O2S2[M + H]+: 517.2921; found: 517.2922.
2-((3-methylpiperidine-1-carbonothioyl)thio)ethyl (1R,4aS,10aR)-7-isopropyl-1,4a-dimethyl-1,2,3,4,4a,9,10,10a-octahydrophenanthrene-1-carboxylate (III-o). Yellow jelly, yield 50.4 %. 1H NMR (600 MHz, CDCl3) δ 7.17 (d, J = 8.3 Hz, 1H, aromatic), 7.00 (dd, J = 8.3, 2.2 Hz, 1H, aromatic), 6.87 (m, 1H, aromatic), 5.32 (s, 1H, CH2), 4.50 (s, 1H, CH2), 4.40 – 4.30 (m, 2H, CH2), 3.69 – 3.57 (m, 2H, CH2), 3.22 – 3.05 (m, 2H, CH2), 2.90 – 2.80 (m, 3H, CH2, CH), 2.32 – 2.25 (m, 2H, CH2), 1.89 – 1.76 (m, 5H, CH2, C10a-H), 1.75 – 1.64 (m, 4H, CH2), 1.51 – 1.42 (m, 2H, CH2), 1.30 – 1.26 (m, 4H, CH2, CH3), 1.24 – 1.20 (m, 9H, CH3), 0.97 – 0.93 (m, 3H, CH3). 13C NMR (151 MHz, CDCl3) δ 194.47, 178.30, 146.91, 145.70, 134.73, 126.89, 124.25, 123.95, 65.58, 62.88, 47.72, 44.75, 37.95, 36.98, 36.52, 35.69, 33.46, 32.88, 31.45, 30.58, 30.14, 29.71, 25.26, 24.00, 23.99, 21.81, 19.20, 18.63, 16.53. HR-MS(m/z):calcd for C29H43NO2S2[M + H]+: 502.2813; found: 502.2818.
Ethyl 4-(((2-(((1R,4aS,10aR)-7-isopropyl-1,4a-dimethyl-1,2,3,4,4a,9,10,10a-octahydrophenanthrene-1-carbonyl)oxy)ethyl)thio)carbonothioyl)piperazine-1-carboxylate (III-p). Light yellow jelly, yield 51.51 %. 1H NMR (600 MHz, CDCl3) δ 7.20 (d, J = 8.3 Hz, 1H, aromatic), 7.03 (dd, J = 8.2, 2.3 Hz, 1H, aromatic), 6.90 (d, J = 2.2 Hz, 1H, aromatic), 4.43 – 4.26 (m, 4H, CH2), 4.20 (dd, J = 7.2, 7.2 Hz, 2H, CH2), 3.97 (s, 2H, CH2), 3.68 – 3.63 (m, 2H, CH2), 3.61 (t, J = 5.9 Hz, 4H, CH2), 2.94 – 2.82 (m, 3H, CH2, CH), 2.34 – 2.26 (m, 2H, CH2), 1.85 – 1.68 (m, 5H, CH2, C10a-H), 1.53 – 1.41 (m, 2H, CH2), 1.31 – 1.28 (m, 6H, CH3), 1.25 – 1.21 (m, 9H, CH3). 13C NMR (151 MHz, CDCl3) δ 178.25, 155.30, 146.88, 145.78, 134.64, 130.93, 126.87, 124.25, 124.00, 62.55, 61.92, 60.41, 47.73, 44.75, 37.94, 36.97, 36.52, 35.72, 33.46, 30.17, 25.23, 24.00, 23.99, 21.81, 18.61, 16.53, 14.64. HR-MS (m/s): calcd for C30H44N2O4S2[M + H]+: 561.2821; found: 561.2823.
2-((2-methylpiperidine-1-carbonothioyl)thio)ethyl (1R,4aS,10aR)-7-isopropyl-1,4a-dimethyl-1,2,3,4,4a,9,10,10a-octahydrophenanthrene-1-carboxylate (III-q). Light yellow oily substance, yield 51.26 %. 1H NMR (600 MHz, CDCl3) δ 7.18 (d, J = 8.3 Hz, 1H, aromatic), 7.01 (dd, J = 8.2, 2.3 Hz, 1H, aromatic), 6.88 (d, J = 2.2 Hz, 1H, aromatic), 6.00 – 5.43 (m, 1H, CH2), 5.14 – 4.81 (m, 1H, CH2), 4.67 – 4.42 (m, 0H, CH2), 4.42 – 4.26 (m, 2H, CH2), 3.67 – 3.59 (m, 2H, CH2), 3.14 (s, 1H, CH2), 2.97 – 2.81 (m, 3H, CH2, CH), 2.34 – 2.25 (m, 2H, CH2), 1.84 – 1.70 (m, 7H, CH2, C10a-H), 1.69 – 1.54 (m, 4H, CH2), 1.52 – 1.41 (m, 2H, CH2), 1.29 – 1.26 (m, 6H, CH2, CH3), 1.24 – 1.20 (m, 9H, CH3). 13C NMR (151 MHz, CDCl3) δ 178.28, 146.91, 145.69, 134.73, 128.86, 126.90, 126.88, 124.26, 123.96, 62.84, 62.81, 60.41, 47.72, 44.78, 44.77, 37.98, 36.99, 36.54, 35.47, 33.48, 30.21, 30.19, 25.27, 25.26, 24.02, 21.83, 18.68, 18.65, 16.55. HR-MS (m/s): calcd for C29H43NO2S2[M + H]+: 502.2813; found: 502.2758.
2-((3-methylpiperazine-1-carbonothioyl)thio)ethyl (1R,4aS,10aR)-7-isopropyl-1,4a-dimethyl-1,2,3,4,4a,9,10,10a-octahydrophenanthrene-1-carboxylate (III-r). Transparent yellow jelly, yield 48.24 %. 1H NMR (400 MHz, CDCl3) δ 7.11 (d, J = 8.2 Hz, 1H, aromatic), 6.94 (dd, J = 8.2, 2.0 Hz, 1H, aromatic), 6.81 (d, J = 1.9 Hz, 1H, aromatic), 5.84 – 5.20 (m, 1H, CH2), 5.11 – 4.76 (m, 1H, CH2), 4.40 – 4.17 (m, 3H, CH2), 3.79 – 3.64 (m, 1H, CH2), 3.64 – 3.50 (m, 3H, CH2), 3.07 – 2.62 (m, 4H, CH2, CH), 2.28 – 2.14 (m, 2H, CH2), 1.83 – 1.71 (m, 2H, CH2), 1.71 – 1.61 (m, 3H, CH2, C10a-H), 1.59 – 1.52 (m, 2H, CH2), 1.46 – 1.33 (m, 2H, CH2), 1.21 – 1.18 (m, 6H, CH2, CH3), 1.17 – 1.12 (m, 9H, CH3). 13C NMR (101 MHz, CDCl3) δ 178.27, 171.22, 146.86, 145.82, 134.62, 126.89, 124.27, 124.03, 62.45, 62.41, 60.44, 47.74, 44.75, 37.93, 36.97, 36.53, 35.84, 35.64, 33.47, 30.20, 30.18, 25.24, 24.03, 21.83, 21.09, 18.61, 16.54, 14.22. calcd for C28H42N2O2S2[M + H]+: 503.2766; found: 503.2770.
2-((indoline-1-carbonothioyl)thio)ethyl (1R,4aS,10aR)-7-isopropyl-1,4a-dimethyl-1,2,3,4,4a,9,10,10a-octahydrophenanthrene-1-carboxylate (III-s). White solid, yield 48.2 %. 1H NMR (600 MHz, CDCl3) δ 7.28 – 7.26 (m, 1H, aromatic), 7.26 – 7.25 (m, 1H, aromatic), 7.23 (t, J = 7.3 Hz, 1H, aromatic), 7.17 (d, J = 8.1 Hz, 1H, aromatic), 7.13 (t, J = 7.4 Hz, 1H, aromatic), 7.00 (dd, J = 8.2, 2.3 Hz, 1H, aromatic), 6.85 (d, J = 2.0 Hz, 1H, aromatic), 4.49 (s, 2H, CH2), 4.43 – 4.39 (m, 1H, CH2), 4.35 – 4.30 (m, 1H, CH2), 3.67 (t, J = 6.3 Hz, 2H, CH2), 3.19 (t, J = 8.2 Hz, 2H, CH2), 2.95 – 2.82 (m, 3H, CH2, CH), 2.32 – 2.26 (m, 2H, CH2), 1.84 – 1.76 (m, 3H, CH2, C10a-H), 1.75 – 1.67 (m, 2H, CH2), 1.51 – 1.43 (m, 2H, CH2), 1.28 (s, 3H, CH3), 1.24 – 1.20 (m, 9H, CH3). 13C NMR (151 MHz, CDCl3) δ 178.30, 146.88, 145.71, 134.71, 126.91, 125.51, 125.33, 124.23, 123.94, 118.73, 62.45, 47.74, 44.78, 37.95, 36.98, 36.56, 33.46, 30.17, 25.24, 24.02, 23.97, 21.83, 18.62, 16.54. HR-MS (m/s): calcd for C31H39NO2S2[M + H]+: 522.2500; found: 522.2571.
2.4 Cell Culture
The hepatoma cell line HepG-2, human breast cancer cell line MCF-7, human cervical cancer cell line HeLa, human bladder cancer cell line T-24, human gastric carcinoma cell line MGC-803, human normal liver cell line LO-2 and human embryonic kidney cell line HEK-293 T were purchased from the China Center for Type Culture Collection (CCTCC, Wuhan, Hubei, China). All the cell lines were cultured in Dulbecco’s Modified Eagle Medium (DMEM, Gibico, Thermo Fisher Scientific, Waltham, MA, USA). Cultures were supplemented with 10 % Foetal Bovine Serum (FBS, CAT: SP10020500, Sperikon Life Science & Biotechnology co.,ltd, Chengdu, China), 100 U/mL penicillin, and 100 μg/mL streptomycin (Beyotime, Sichuan, China) at 37 °C in a humidified incubator with a 5 % CO2 atmosphere.
2.5 MTT assay
The in vitro cytotoxic potency of five human cancer cell lines was evaluated by the trace enzyme reaction colorimetry with tetramethylazazole salt (MTT). The IC50 (μM) values of: HepG-2, MCF-7, HeLa, T-24, MGC-803 cancer cells were calculated. Cisplatin and paclitaxel were used as positive control. The cells were seeded in 96-well plates (100 μL per well at a density of 5 × 10³ cells/well). The next day, the cells were treated with target compounds for various concentrations (100 µM, 50 µM, 25 µM, 12.5 µM, 6.25 µM, 3.125 µM) for 24 h. Next, 20 μL of MTT solution (5 mg/mL) was added to each well. After incubation for 4 h at 37 °C, the medium was then removed, and formazan precipitates were dissolved in 100 μL of DMSO. After shaking at low speed for 10 min at room temperature, the colorimetric reading of the solute mixture was then determined by spectrophotometer at 490 nm. The IC50 values were averaged from three independent experiments performed each in triplicate: confidence interval CI = 95 %.
2.6 Drug-Likeness prediction
Lipinski’s Rule of Five (Zhang and Wilkinson 2007) is a rule of thumb for evaluating whether a compound can be used as a drug, or whether a compound with pharmacological or biological activity can be used as an oral drug (Ru et al., 2014). To screen out potential target compounds for drug development, we calculated and compared several physical parameters related to the target compounds by using a web-based tool: SwissADME server (https://www.swissadme.ch/). Screening was performed with the default parameters.
2.7 Transwell assay on HepG-2 cells
The migration and invasion of tumor cells play a significant role in the development of advanced cancer. Cell migration is a key attribute in the biological process of tumor cells (Kovarikova et al., 2014, Pijuan et al., 2019). HepG-2 cells were incubated with serum for 24 h, and then harvested and washed with PBS. Then, the cells were resuspended in fresh serum-free medium at a concentration of 5 × 10⁵ /mL, then 200 µL cell suspension was added to the Boyden chamber (EMD Millipore), which was coated with 50 µL Matrigel (in 1 mg/mL final concentration). The lower chamber was added with 10 % serum containing medium. After 24 h at 37 °C, the cells on the upper chamber were wiped off to remove the non-invaded cells. The invaded cells were detected by staining with crystal violet and counted by light microscopy under the high-power field (×200).
2.8 HepG-2 cells apoptosis assay
We used different concentrations of III-b to interfere with HepG-2 cells and it were co-stained with PI and Annexin-V/FITC (Wallberg et al., 2016), Briefly, HepG-2 cells were seeded in 6-well plates at a density of 2 × 10⁵ cells/well. The plates were incubated for 8 h, and then treated with virous concentrations of III-b for 24 h. Finally, the cells were harvested for apoptosis detection according to the manufacturer’s instructions. Flow cytometric analysis was then carried out by using a FACSVerse flow cytometer (BD Biosciences, San Jose, CA, USA). Data acquisition and analysis were performed by using the Flowjo software (BD Biosciences, San Jose, CA, USA). Data were obtained from three independent experiments.
2.9 Assay for ROS level in HepG-2 cells
HepG-2 cells were seeded in 6-well plates at the density of 4 × 10⁴ cells/well. Then the plates were incubated for overnight and were treated with compound III-b (2 µM, 4 µM and 6 µM) for 24 h. Then, 10 µM DCFH-DA was added and the plates was placed at 37 °C for 20 min. The cells were observed with fluorescence microscopy.
2.10 Western Blot
HepG-2 cells (2 × 10⁵) were seed into 6-well plates, after 12 h of incubation, the cells were treated with various concentrations of compound III-b (2 µM, 4 µM and 6 µM) and incubated for 48 h at the condition of 37 °C, 5 % CO2 atmosphere. Then, the total proteins were extracted from cells by using 1 × RIPA lysis buffer and separated on SDS-PAGE under reducing condition. The membranes were incubated with the following primary antibodies: anti-Bax, anti-Bcl-2, anti-caspase 3, anti- cleaved caspase 3, anti-caspase 9, anti- cleaved caspase 9, and anti-β-actin (Cell Signaling Technology, Danvers, MA, USA) at 1:1000 in HUVECs. Subsequently, these membranes were washed 3 times and incubated with horseradish peroxidase-labelled secondary antibody. After 1 h of sealing, protein bands in the membranes were visualized using UltraSignalTM ECL western blotting detection reagents (4A Biotech Co., ltd, Beijing, China) and a ChemiDoc MP Imaging System (Bio-Rad, Hercules, CA, United States). The protein band intensity was quantified using Image J (National Institutes of Health, Bethesda, MD, USA). The ratio of the targeted proteins to β-actin was calculated. β-actin was used as a loading control.
2.11 Target prediction
We imported the structural formula of compound III-b into SwissTargetPrediction (https://www.swisstargetprediction.ch/) database to obtain the compound-related targets (Gfeller et al., 2014, Hahnke et al., 2018), and named these gene targets related to the compound as “drug targets” (Forouzesh et al., 2019). Liver neoplasms associated targets were obtained from both databases OMIM (https://omim.org/) and DisGeNET (https://www.disgenet.org/), targets from both databases were consolidated and duplicates were removed, these targets would subsequently be named “disease targets”. Ultimately, the comparison of “drug targets” and “disease targets” led to the shared targets engaging in drug-target-disease interrelations.
2.12 Protein-Protein interaction (PPI) network construction and core target prediction
In order to evaluate the interaction between network prediction targets, the information of drug-disease intersection targets screened out were inputted to STRING_v11.0 (https://string-db.org/) database, and the species information were set as “Homo sapiens” (Szklarczyk et al., 2017). Through STRING network analysis, if the interaction between proteins is reliable, the confidence score should be>0.4. We then input reliable PPI data into Cytoscape_v3.7.1 software for visibility optimization and topology analysis of PPI networks. Three parameters were introduced to determine the core target of compound III-b for the treatment of Liver neoplasms: the value of degree greater than or equal to twice the median value, betweenness centrality and closeness centrality values greater than the corresponding medians.
2.13 Analysis of gene Ontology term (GO) and Kyoto Encyclopedia of genes and Genomes (KEGG) pathway enrichment
For interpreting differentially expressed genes and predict the underlying mechanism of drug molecular action, we used Gene Ontology (GO) term and Kyoto Encyclopedia of Genes and Genomes (KEGG) pathway enrichment analyses. Database for Annotation, Visualization and Integrated Discovery (DAVID)_v6.8 (https://david.ncifcrf.gov/) is a database with GO and KEGG pathway modules, thus, we inputted the gene symbols of the common targets into it to analyze the date. In general, the GO analysis could reflect three categories in which compound III-b takes actions, including biological process (BP), molecular function (MF), and cellular component (CC) categories. KEGG analysis was used to screen target protein-related pathways to discover key mechanisms by which compound III-b inhibits liver neoplasms. Using OmicShare (https://www.omicshare.com/) platform, the results of path enrichment analysis were visualized as bubble diagram (Szklarczyk et al., 2017).
2.14 Molecular docking model prediction
The use of virtual molecular docking can provide a more intuitive understanding of the way and strength of the interaction between a compound and its target protein (Hsin et al., 2016). So, for observation mode of compound III-b to the core targets identified in the PPI network, the following steps were performed: First, 3D structural models and crystal structures of the core targets were obtained from PubChem and RCSB protein databases. Second, we removed any co-crystalline ligands from the six proteins and removed water molecules from the protein structure after evaluating the X-ray diffraction structure. Third, hydrogen atoms are added to the protein structure, where the amino acid side chains are fixed. Finally, for virtual compound III-b protein interaction imaging, Surflex Dock (SFXC) was used as docking mode after protein structure preparation. Surflex Dock score (total) indicates binding affinity.
2.15 Statistical analysis
All the date were reported as the mean ± standard deviation (SD). Difference between groups was analyzed by one-way univariate analysis of various (ANOVA). A p-value<0.05 was considered to be statistically significant (marked as *). Higher significance levels (p < 0.01) were marked **.
3 Results and discussions
3.1 MTT assay
The IC50 (μM) values of: HepG-2, MCF-7, HeLa, T-24, MGC-803 cancer cells were calculated. Cisplatin and paclitaxel were used as positive control. The antitumor activity of dehydroabietic acid monomer was measured to evaluate the changes of cell viability before and after structural modification. The results are shown in Table 1.
Compound
IC 50 (Mean ± S.D., µM)
HepG-2
MCF-7
Hela
T-24
MGC-803
III-a
6.1 ± 1.84
52.35 ± 1.75
33.64 ± 0.82
8.84 ± 0.15
15.27 ± 0.52
III-b
4.07 ± 0.81
4.88 ± 0.15
13.38 ± 1.66
38.84 ± 1.25
7.32 ± 0.25
III-c
5.52 ± 1.26
25.15 ± 0.41
5.24 ± 1.24
27.94 ± 1.68
19.23 ± 0.31
III-d
55.34 ± 1.33
40.32 ± 0.26
>100
61.54 ± 2.33
>100
III-e
8.07 ± 1.72
21.57 ± 0.43
14.87 ± 1.57
8.48 ± 0.18
16.12 ± 0.35
III-f
86.88 ± 0.22
90.10 ± 1.14
>100
83.14 ± 1.30
>100
III-g
50.23 ± 1.28
52.09 ± 1.67
70.09 ± 1.22
39.65 ± 0.58
60.45 ± 0.86
III-h
9.10 ± 0.51
23.77 ± 1.22
6.87 ± 1.44
15.27 ± 0.43
4.59 ± 1.54
III-i
23.56 ± 2.24
7.24 ± 2.31
14.22 ± 1.53
3.09 ± 1.51
6.77 ± 1.63
III-j
13.75 ± 1.39
9.58 ± 1.83
5.03 ± 1.62
14.73 ± 1.01
5.98 ± 1.26
III-k
26.36 ± 1.58
5.87 ± 1.82
4.78 ± 0.27
4.27 ± 1.88
14.25 ± 0.61
III-l
>100
87.58 ± 1.88
91.21 ± 1.14
>100
>100
III-m
45.93 ± 0.19
72.03 ± 0.52
60.29 ± 0.45
48.39 ± 1.54
67. ± 0.64
III-n
49.25 ± 0.45
47.25 ± 1.24
60.74 ± 2.14
55.76 ± 1.18
60.56 ± 1.35
III-o
45.12 ± 1.36
50.26 ± 2.01
60.68 ± 1.51
70.08 ± 1.55
56.09 ± 0.75
III-p
23.64 ± 0.37
38.49 ± 1.22
25.98 ± 0.97
31.65 ± 0.55
30.15 ± 0.85
III-q
45.68 ± 2.21
60.08 ± 0.67
54.62 ± 0.65
59.75 ± 0.80
49.53 ± 0.89
III-r
56.32 ± 1.39
65.76 ± 2.25
58.78 ± 1.05
44.65 ± 1.54
50.24 ± 0.65
III-s
>100
67.84 ± 0.38
87.58 ± 0.42
>100
>100
Cisplatin
36.15 ± 0.11
12.98 ± 0.17
14.34 ± 0.37
29.23 ± 0.41
25.15 ± 1.02
Paclitaxel
8.24 ± 0.06
7.46 ± 0.23
11.75 ± 0.78
13.15 ± 0.37
19.35 ± 0.86
DHA
65.00 ± 1.16
51.57 ± 0.43
37.40 ± 0.64
49.65 ± 1.26
48.46 ± 2.27
As expected, when the dehydroabietic acid was linked by a carbon chain to the dithiocarbamate molecular fragment, the tumor cytotoxicity of most compounds was better to that of parent compound, furthermore, the activity of some compounds was superior to that of two positive controls. It is suggested that the dehydroabietic acid-dithiocarbamate hybrids designed and synthesized based on the “Molecular hybridization” is a potentially feasible strategy for dehydroabietic acid structural modification. It is worth noting that, when there is no substituent on the nitrogen-containing heterocyclic ring such as III-f, III-g, III-l, the tumor cytotoxicity is significantly less than other compounds containing electron-rich substituents. At the same time, the presence of electron-rich substituents in para position of piperidine ring show more active than ortho and meta. Among these compounds containing electron-rich substituents, compounds containing hydroxyl substituents have the best antitumor activity. Therefore, we can infer that when electron rich groups such as methyl and hydroxyl are introduced into nitrogen-containing heterocycles, the toxicity of these compounds to tumor cells will be enhanced, which may be because hydroxyl is conducive to binding with receptors as hydrogen donors. What’s more, the position of electron-rich substituents could also influence the tumor cytotoxicity, which may be the steric-hindrance effect. Therefore, it provides a new idea for the structural transformation of these compounds to improve tumor cytotoxicity. As showed in Fig. 3.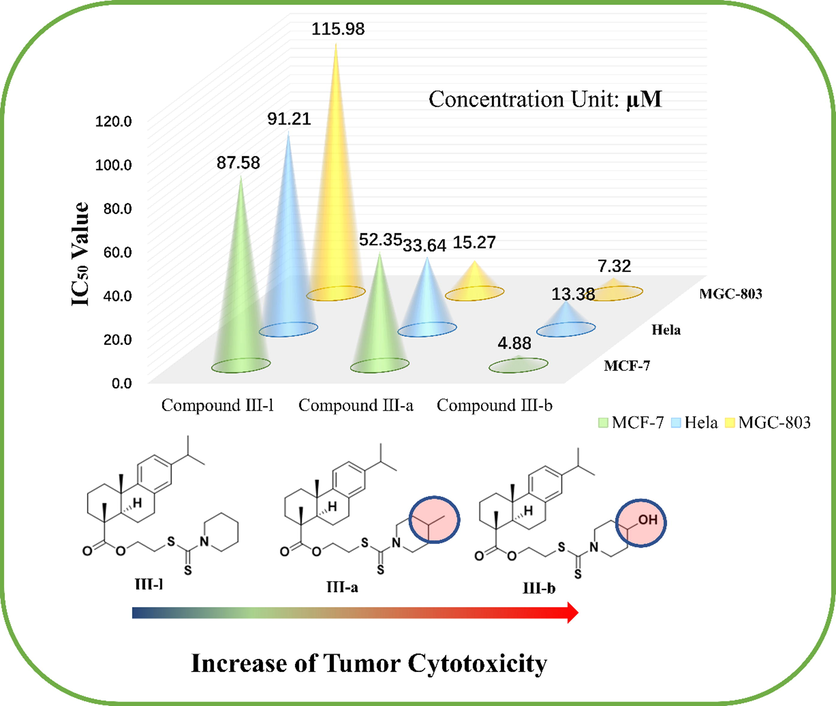
Effect of introduction of electron-rich groups on tumor cytotoxicity (Taking MCF-7, Hela and MGC-803 cell lines as examples).
LO-2 and HEK-293 T cell lines were used to evaluate the in vitro biotoxicity of 8 compounds, which showed compound III-b had weak cytotoxicity on normal cells (compound III-b to LO-2 cells, IC50 = 94.23 ± 1.02 µM; to HEK-293 T cells, IC50 > 100 µM). The results are shown in Table 2.
Compound
IC50(Mean ± S.D., µM)
LO-2
HEK 293 T
III-a
68.75 ± 0.98
86.59 ± 1.47
III-b
94.23 ± 1.02
>100
III-c
78.55 ± 0.72
59.88 ± 0.33
III-e
>100
66.79 ± 0.47
III-h
61.98 ± 0.54
>100
III-i
78.62 ± 0.37
>100
III-j
86.11 ± 1.29
86.79 ± 0.73
III-k
68.44 ± 0.84
76.45 ± 0.11
Cisplatin
>100
86.48 ± 0.87
Paclitaxel
94.15 ± 0.57
>100
DHA
55.49 ± 1.03
>100
3.2 Drug-Likeness prediction
Eight compounds with brilliant biological activity were assessed by their physical properties. Based on Lipinski’s rule of five (Ro5), a compound could be a drug likely meets the requirements respectively: molecular weight<500 Daltons, TPSA(A2)(≤140), and the number of hydrogen-bond donors and acceptors<5 and 10. The date exhibited that compound III-b was fit for Ro5 indicating the compound III-b possessed the promising potential to become a drug, which was selected as a representative for further mechanism investigations. The results are showed in Table S1. Table 3.
Compound
Canonical SMILES
Formula
Molecular
Weight(≤500)Rotatable
Bonds(≤10)H-bond acceptors(≤10)
H-bond donors(≤5)
TPSA(A2)(≤140)
iLOGP(≤5)
ABS
III-a
CC(C)C1 = CC = C2C(CCC3C(C)(CCCC23C)C(=O)OCCSC(=S)N2CCC(C)CC2) = C1
C29H43NO2S2
501.79
8
2
1
86.93
4.53
0.17
III-b
OC1CCN(CC1)C(=S)SCCOC(=O)C1(C)CCCC2(C1CCc1c2ccc(c1)C(C)C)C
C28H41NO3S2
503.76
8
3
1
107.16
4.77
0.55
III-c
S⚌C(N1CCN(CC1)C(=O)C)SCCOC(=O)C1(C)CCCC2(C1CCc1c2ccc(c1)C(C)C)C
C29H42N2O3S2
530.79
9
3
0
107.24
4.73
0.17
III-e
OC1CCCN(C1)C(=S)SCCOC(=O)C1(C)CCCC2(C1CCc1c2ccc(c1)C(C)C)C
C28H41NO3S2
503.76
8
3
1
107.16
4.94
0.17
III-h
OCCN1CCN(CC1)C(=S)SCCOC(=O)C1(C)CCCC2(C1CCc1c2ccc(c1)C(C)C)C
C29H44N2O3S2
532.80
10
4
1
110.40
5.29
0.55
III-i
OCC1CCN(CC1)C(=S)SCCOC(=O)C1(C)CCCC2(C1CCc1c2ccc(c1)C(C)C)C
C29H43NO3S2
517.79
9
3
1
107.16
4.98
0.17
III-j
OCCC1CCN(CC1)C(=S)SCCOC(=O)C1(C)CCCC2(C1CCc1c2ccc(c1)C(C)C)C
C30H45NO3S2
531.81
10
3
1
107.16
4.98
0.17
III-k
OCCC1CCCCN1C(=S)SCCOC(=O)C1(C)CCCC2(C1CCc1c2ccc(c1)C(C)C)C
C30H45NO3S2
531.81
10
3
1
107.16
4.75
0.17
3.3 Transwell assay on HepG-2 cells
HepG-2 cell migration was observed microscopically after treatment with compound III-b (2 µM, 4 µM and 6 µM). It’s obvious that the relation between concentration and the migration inhibition from the result: With the elevate of concentrations from 2 µM to 6 µM, the ability of HepG-2 cells to migrate is gradually reduced (2 µM, 61.0 %; 4 µM, 52.6 % and 6 µM, 35.3 %) compared with control panel 84.3 %. Thus, we can preliminarily draw the conclusion that compound III-b inhibited HepG-2 cell migration. (The results are shown in Fig. 4.).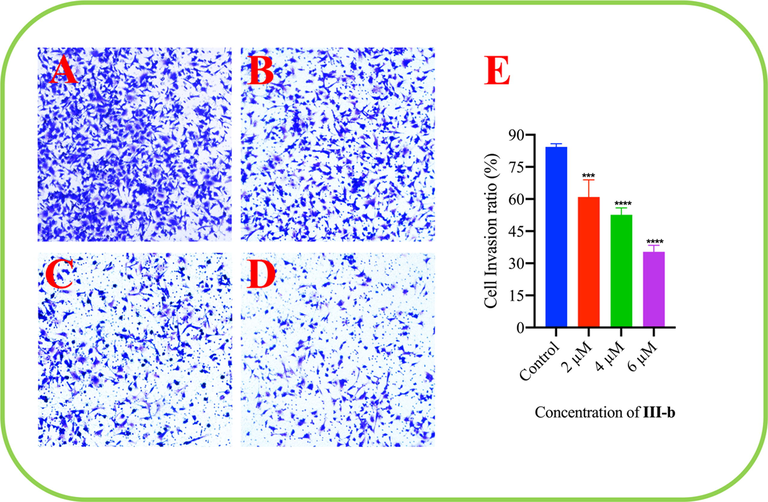
The result of effect of compound III-b on HepG-2 cell migration. (A) Control. (B) At the drug concentrations of 2 μM. (C) At the drug concentrations of 4 μM. (D) At the drug concentrations of 6 μM. (E) The ratio of HepG-2 cells invasion decreased with compound III-b concentration increasing. Note: Compared with the control group, ns P > 0.05, *P < 0.05, **P < 0.01, ***P < 0.001.
3.4 HepG-2 cells apoptosis assay
The number of apoptotic cells was estimated by flow cytometry (Fig. 5). Four quadrant images were observed by flow cytometry analysis: the Q1 region represented damaged cells which appeared during the process of cell collection, the Q2 part showed necrotic cells and later stage apoptotic cells; early apoptotic cells were located in the part of Q3 and Q4 area showed normal cells. A dose-dependent increase in the percentage of apoptotic cells was noted after the cells were treated with compound III-b at the concentrations of 5 µM, 10 µM and 15 µM for 24 h. It is clearly showed in the Fig. 5 that in the control panel, a 7.25 % percentage of apoptotic cells were captured while we can easily find that compound III-b at the concentrations of 5 µM, the percentage rose to 15.04 % after the treatment of compound for 24 h. At the middle concentrations of 10 µM, the percentage of apoptotic cells further increase to 68.3 %, furthermore, the concentrations were increased to 15 µM. It’s obviously exhibited in the result that the percentage has been rose to 96.1 %. From all the discussion above, we can firmly infer that compound III-b can efficaciously induced apoptosis in HepG-2 cells, simultaneously, this apoptotic relationship is in a dose-dependent manner.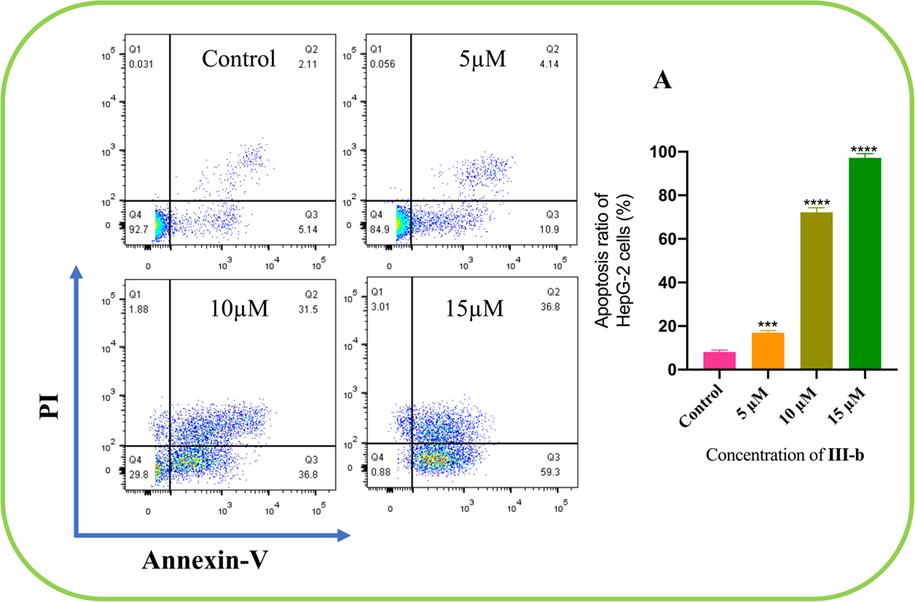
Compound III-b at the concentrations of 5 μM, 10 μM and 15 μM intervene HepG-2 cells for 24 h, using Annexin V-FITC and PI staining to evaluate apoptosis and analyzed by using flow cytometry. (A) The apoptosis ratio of HepG-2 cells increased with concentrations of compound III- b risen. Note: Compared with the control group, ns P > 0.05, *P < 0.05, **P < 0.01, ***P < 0.001.
3.5 Assay for ROS level in HepG-2 cells
ROS in cells can oxidize non-fluorescent DCFH to produce green, fluorescent DCF, thus, the intensity of green fluorescence can reflect the concentration of ROS in cells. As shown in Fig. 6, after compound III-b (2 µM, 4 µM and 6 µM) was used to intervene HepG-2 cells for 24 h, in comparison with the control group (Fluorescence area ratio 1.62 %), the green fluorescence in the compound treated groups were significantly enhanced (2 µM, 5.65 %; 4 µM, 46.125 %; 6 µM, 72.23 %), and the fluorescence intensity increased with the increase of the concentrations of compound III-b. Meanwhile, the fluorescence area ratio in LO-2 cells using compound III-b 6 µM for intervening is 6.11 % compared with control group 2.32 %; in 293 T cells using compound III-b 6 µM for intervening is 4.82 % compared with control group 2.34 %. Therefore, compound III-b can significantly enhance ROS level in HepG-2 cells.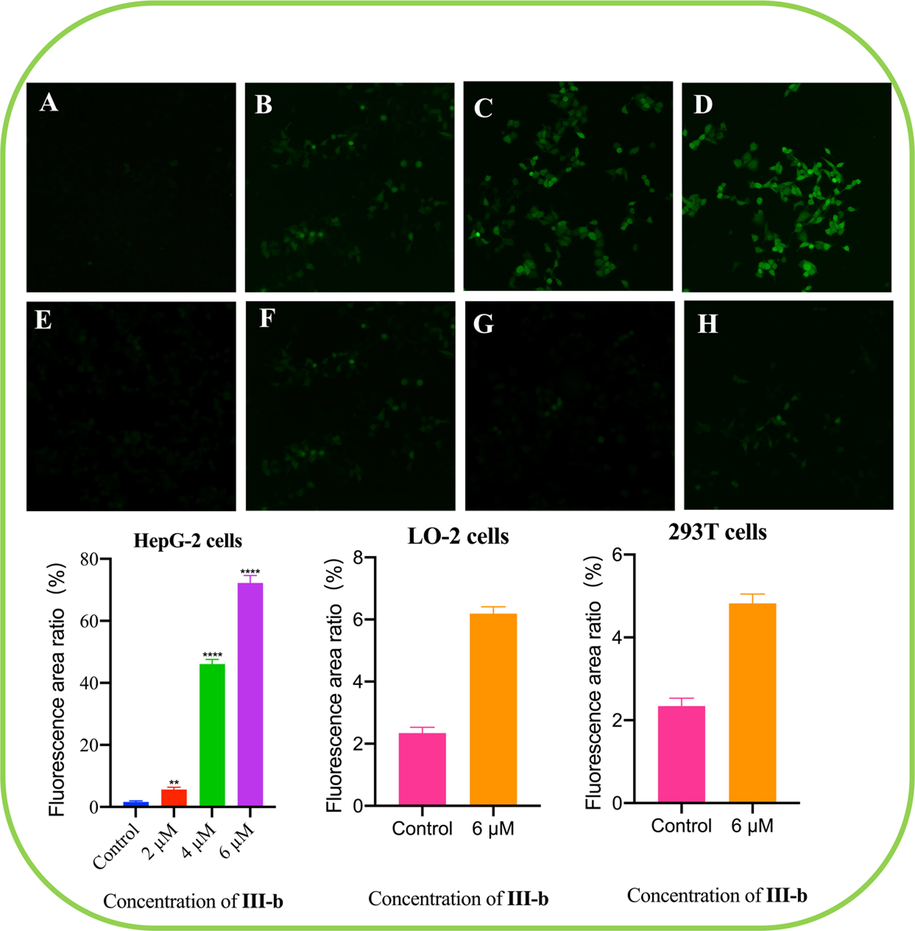
Compound III-b intervened HepG-2 cells for 48 h, using DCFH-DA as probe to detect the ROS level in HepG-2 cells. (A) HepG-2 cells control. (B) Compound III-b at the concentrations of 2 μM for intervening HepG-2 cells. (C) Compound III-b 4 μM for intervening HepG-2 cells. (D) Compound III-b 6 μM for intervening HepG-2 cells. (E) LO-2 cells control. (F) Compound III-b 6 μM for intervening LO-2 cells. (G) 293 T cells control. (H) Compound III-b 6 μM for intervening 293 T cells. Note: Compared with the control group, ns P > 0.05, *P < 0.05, **P < 0.01, ***P < 0.001.
3.6 Western Blot assay
We further evaluated the effect of compound III-b on the protein expression of Bcl-2, Bax, caspase-3, cleaved-caspase-3, caspase-9 as well as cleaved-caspase-9 by Western Blotting analysis. The results are shown in Fig. 7, compound III-b significantly inhibited the protein expression of Bcl-2 and increased the protein expression of Bax and cleaved-caspase-3, cleaved-caspase-9. These results suggested that compound III-b induced HepG-2 cells apoptosis via upregulation of Bax, activation of caspase-3, caspase-9, and downregulation of Bcl-2. The results are shown in Fig. 7.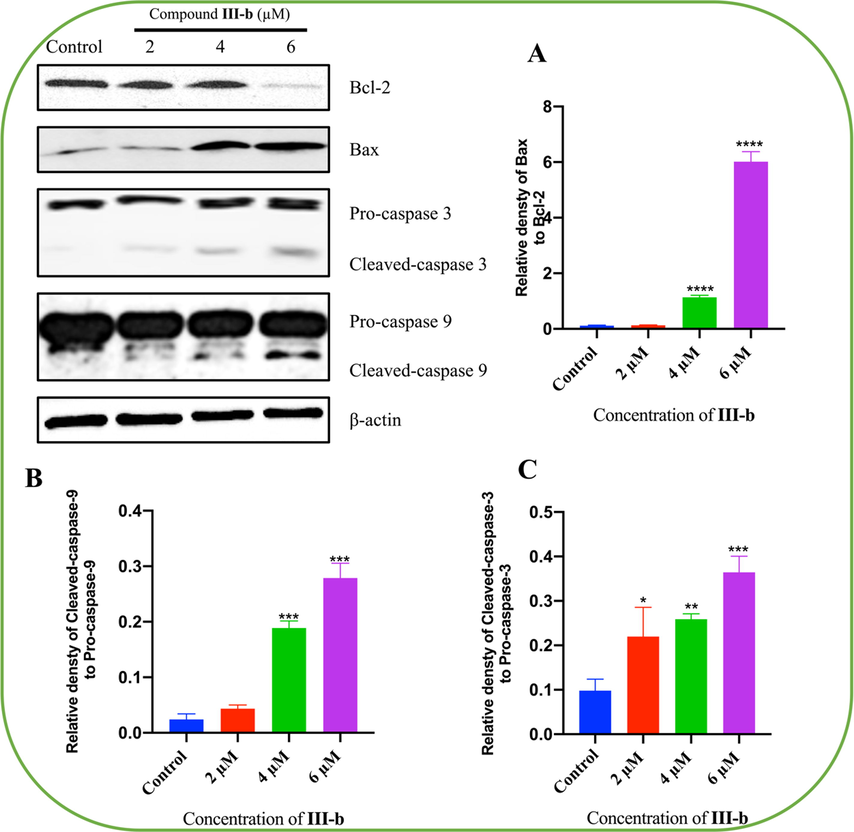
Compound III-b induces apoptosis in HepG-2 cells. HepG-2 cells were treated with Compound III-b (2 μM, 4 μM, 6 μM) for 48 h. (A) Relative densty of Bax to Bcl-2. (B) Relative densty of Cleaved-caspase-9 to Pro-caspase-9. (C) Relative densty of Cleaved-caspase-3 to Pro-caspase-3. Note: Compared with the control group, ns P > 0.05, *P < 0.05, **P < 0.01, ***P < 0.001.
3.7 Target prediction
We retrieved 100 targets related to compound III-b from SwissTargetPrediction database and retrieved and integrated 5726 targets related to Liver neoplasms from OMIM and DisGeNET databases (Rebhan et al., 1998, Pinero et al., 2017). Ultimately, through comparison, 64 potential targets associated with compound III-b in the treatment of Liver neoplasms were identified. These targets are shown in Fig. 8, (A).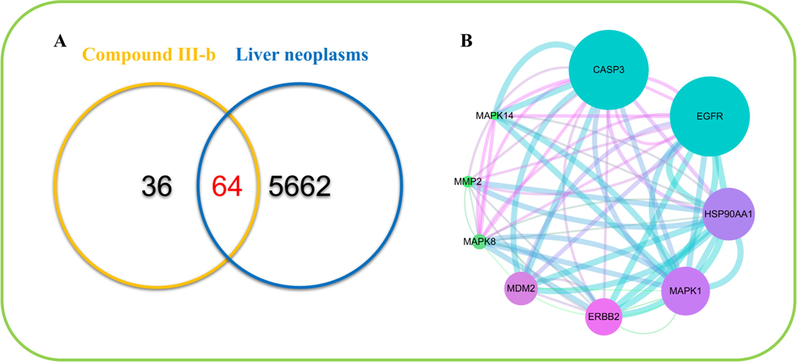
(A) Venn diagrams of common targets of compound III-b and liver neoplasms. (B) Protein-interactive (PPI) network based on the targets for compound III-b in the treatment of liver neoplasms.
3.8 Protein-Protein interaction (PPI) network construction and core target prediction
In network analysis, a node represented a target, and the lower the degree value was, the smaller the shape was, the lower the degree value was, the closer the color was to blue; otherwise, the closer the color was to green. In addition, the higher the intensity of the PPI was, the thicker the connected lines were, and the color tended to be blue; otherwise, the thinner the lines were, and the color was close to green. What we found were shown in the Fig. 8, (B).
We then used Cytoscape_v3.7.1 to perform a topology analysis of all the nodes in the network to determine the core target. We set three parameters for each target: the value of degree was set to be>16, the betweenness centrality and the closeness centrality was decided to be>0.518954 and 0.46616541. Based on these three parameters, we obtained nine core targets, namely, CASP3, EGFR, HSP90AA1, MAPK1, ERBB2, MDM2, MAPK8, MMP2, MAPK14.
3.9 Analysis of gene Ontology term (GO) and Kyoto Encyclopedia of genes and Genomes (KEGG) pathway enrichment
To predict the key mechanism of action of compound III-b on liver neoplasms, we performed data analysis of GO and KEGG through the DAVID platform. GO analysis revealed a total of 258 GO terms related to the treatment of liver neoplasms by compound III-b. In these GO annotations, 170 terms are related to the BP category, including protein autophosphorylation, regulation of sequence-specific DNA binding transcription factor activity, positive regulation of gene expression, positive regulation of cell proliferation and transmembrane receptor protein tyrosine kinase signaling pathway. 41 terms were associated to the CC category, mainly involving plasma membrane, cytosol, endosome, integral component of plasma membrane and membrane raft. MF category found its association with 47 terms, primarily embracing protein kinase activity, ATP binding, protein serine/threonine kinase activity, kinase activity and protein tyrosine kinase activity. As shown in Fig. 9. (A), the maximum enrichment degree of the processes related to compound III-b was arranged in ascending order of P-value. What’s more, KEGG analysis showed that 79 pathways may be involved in the therapeutic process of compound III-b for liver neoplasms, including pathways in cancer, GnRH signaling pathway, Fc epsilon RI signaling pathway, Proteoglycans in cancer and FoxO signaling pathway, showing in Fig. 9. (B).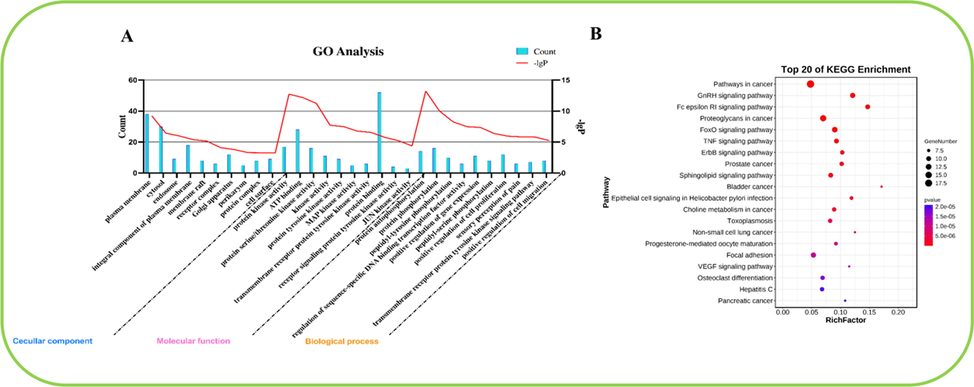
(A) GO enrichment analysis of the core targets of compound III-b for liver neoplasms. The 10 BP, CC and MF terms with the maximum enrichment are shown in the figure. (B) Top 20 KEGG pathways rich in core targets for the treatment of liver neoplasms with compound III-b. The bubble size indicated the number of enriched genes. The color indicates the corresponding P value. The rich factor represents the ratio of the target gene in a pathway to all the annotated genes in that pathway. The color of the bubble is related to the P value.
3.10 Molecular docking model prediction
The molecular docking model was used to evaluate the binding ability of compound III-b to 6 core targets (CASP3, EGFR, HSP90AA1, MAPK1, ERBB2, MDM2). In this study, the docking score (total score) ≥ 4.5 indicated that the molecule showed a good binding affinity with the target protein, and the docking score was > 5.0 is considered to indicate high binding activity (Gu et al., 2020). As shown in the Fig. 10.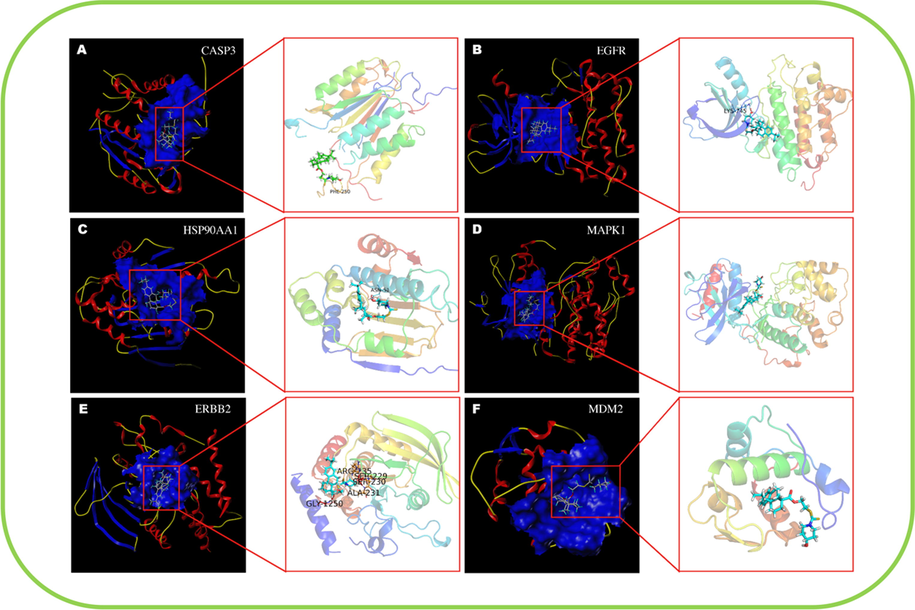
Molecular docking model of compound III-b with core protein. (A) Compound III-b bound to CASP3 protein via the active residue PHE-250, with docking scores of 4.57. (B) Compound III-b bound to EGFR protein via the active residue LYS-745, with docking scores of 5.56. (C) Compound III-b bound to HSP30AA1 protein via the active residue ASN-51, with docking scores of 7.13. (D) Compound III-b bound to MAPK1 protein, with docking scores of 5.77. (E) Compound III-b bound to ERBB2 protein, via the active residues ARG-235, SER-229, SER- 230, ALA-231, GLY-1250, with docking scores of 4.29. (F) Compound III-b bound to MDM2 protein, with docking scores of 5.55.
4 Conclusion
As a result, conducting by the “Molecular hybridization”, a series of 19 novel dehydroabietic acid-dithiocarbamate hybrids were synthesized and characterized. The antiproliferative activity against five cancer cells (HepG-2, MCF-7, HeLa, T-24, MGC-803) were evaluated by MTT assay and exhibited low micromolar IC50 values, meanwhile, the toxicity on two normal cell lines (LO-2, HEK-293 T) were calculated, revealing that compound III-b not only inhibited HepG-2, MCF-7,HeLa, MGC-803 cell lines with IC50 values of 4.07 µM, 4.88 µM, 13.38 µM, 7.32 µM, respectively, but also exhibited weak cytotoxicity on normal cells. Furthermore, the mechanism investigation exhibited that the reduction in tumor cell viability may be related to cell migration inhibition and cell apoptosis via upregulation of Bax, phosphorylation of caspase-3, caspase-9, and downregulation of Bcl-2 caused by compound III-b. Later study further confirmed that ROS levels in HepG-2 cells increased significantly with the rise of concentrations. In addition, the hub targets and signaling pathways of compound III-b for treatment of liver neoplasms were predicted and molecular docking model showed that compound III-b had high affinity with core targets (CASP3, EGFR, HSP90AA1, MAPK1, ERBB2, MDM2), suggesting that compound III-b might target the core protein to modulate signaling activity. Taken together, all the results emphasize that dehydroabietic acid structural modification following the “Molecular hybridization” is a potential strategy of finding the multi-target oriented antitumor agents with more safety, stability, and high efficiency. Verification of core targets and key pathways will be published in due course.
Acknowledgements
This work was supported by grants from National Natural Science Foundation of China (Grant No. 82074129); Science and Technology Planning Project of Sichuan Province, China (Grant No. 2022JDJQ0061); Project for Science Research and Technology Development of Guilin (20210227-1); Cultivation Plan of Thousands of Young and Middle-aged Backbone Teachers in Guangxi Colleges and Universities; Graduate Research Program of Guilin Medical University (GYYK2021010).
References
- The Versatility in the Applications of Dithiocarbamates. Int. J. Mol. Sci.. 2022;23
- [CrossRef] [Google Scholar]
- Synthesis, analgesic, anti-inflammatory, ulcerogenic index and antibacterial activities of novel 2-methylthio-3-substituted-5,6,7,8-tetrahydrobenzo (b) thieno[2,3-d]pyrimidin-4(3H)-ones. Eur. J. Med. Chem.. 2006;41:1293-1300.
- [CrossRef] [Google Scholar]
- Natural products are an important source for proteasome regulating agents. Phytomedicine. 2021;93:153799
- [CrossRef] [Google Scholar]
- Molecular Docking Using Quantum Mechanical-Based Methods. Methods Mol. Biol.. 2020;2114:269-284.
- [CrossRef] [Google Scholar]
- Anti-Inflammatory Drug Design Using a Molecular Hybridization Approach. Pharmaceuticals (Basel).. 2011;4:1450-1474.
- [CrossRef] [Google Scholar]
- From single drug targets to synergistic network pharmacology in ischemic stroke. Proc Natl Acad Sci U S A.. 2019;116:7129-7136.
- [CrossRef] [Google Scholar]
- Indole in the target-based design of anticancer agents: A versatile scaffold with diverse mechanisms. Eur. J. Med. Chem.. 2018;150:9-29.
- [CrossRef] [Google Scholar]
- Reliable Target Prediction of Bioactive Molecules Based on Chemical Similarity Without Employing Statistical Methods. Front. Pharmacol.. 2019;10:835.
- [CrossRef] [Google Scholar]
- SwissTargetPrediction: a web server for target prediction of bioactive small molecules. Nucleic Acids Res.. 2014;42:W32-38.
- [CrossRef] [Google Scholar]
- A network-based analysis of key pharmacological pathways of Andrographis paniculata acting on Alzheimer's disease and experimental validation. J. Ethnopharmacol.. 2020;251:112488
- [CrossRef] [Google Scholar]
- PubChem chemical structure standardization. J Cheminform.. 2018;10:36.
- [CrossRef]
- Network pharmacology: a Rosetta Stone for traditional Chinese medicine. Drug Dev. Res.. 2014;75:299-312.
- [CrossRef] [Google Scholar]
- Click chemistry-based synthesis and anticancer activity evaluation of novel C-14 1,2,3-triazole dehydroabietic acid hybrids. Eur. J. Med. Chem.. 2017;138:1042-1052.
- [CrossRef] [Google Scholar]
- systemsDock: a web server for network pharmacology-based prediction and analysis. Nucleic Acids Res.. 2016;44:W507-513.
- [CrossRef] [Google Scholar]
- Design, synthesis and in vitro evaluation of novel dehydroabietic acid derivatives containing a dipeptide moiety as potential anticancer agents. Eur. J. Med. Chem.. 2015;89:370-385.
- [CrossRef] [Google Scholar]
- Elucidation of the Mechanisms and Molecular Targets of Yiqi Shexue Formula for Treatment of Primary Immune Thrombocytopenia Based on Network Pharmacology. Front. Pharmacol.. 2019;10:1136.
- [CrossRef] [Google Scholar]
- Molecular Docking in Formulation and Development. Curr. Drug Discov. Technol.. 2019;16:30-39.
- [CrossRef] [Google Scholar]
- Recent advances (2015–2016) in anticancer hybrids. Eur. J. Med. Chem.. 2017;142:179-212.
- [CrossRef] [Google Scholar]
- Methods for studying tumor cell migration and invasiveness. Klin Onkol.. 2014;27(Suppl. 1):S22-27.
- [Google Scholar]
- Advances in Rosin-Based Chemicals: The Latest Recipes. Applications and Future Trends. Molecules.. 2019;24
- [CrossRef] [Google Scholar]
- Discovery and optimization of novel dual dithiocarbamates as potent anticancer agents. Eur. J. Med. Chem.. 2015;93:381-391.
- [CrossRef] [Google Scholar]
- Network Pharmacology in Research of Chinese Medicine Formula: Methodology, Application and Prospective. Chin J Integr Med.. 2020;26:72-80.
- [CrossRef] [Google Scholar]
- Synthesis and antitumor activity of isolongifoleno[7,8-d]thiazolo[3,2-a]pyrimidine derivatives via enhancing ROS level. Chem. Biol. Drug Des.. 2019;94:1457-1466.
- [CrossRef] [Google Scholar]
- Natural products: an evolving role in future drug discovery. Eur. J. Med. Chem.. 2011;46:4769-4807.
- [CrossRef] [Google Scholar]
- Natural products: promising resources for cancer drug discovery. Anticancer Agents Med Chem.. 2012;12:49-75.
- [CrossRef] [Google Scholar]
- From magic bullets to designed multiple ligands. Drug Discov Today.. 2004;9:641-651.
- [CrossRef] [Google Scholar]
- Natural products as sources of new drugs over the period 1981–2002. J. Nat. Prod.. 2003;66:1022-1037.
- [CrossRef] [Google Scholar]
- Effect of Lutein-Rich Extract on Human Cancer cells. Middle East J Cancer.. 2021;12(1):147-150.
- [Google Scholar]
- In vitro Cell Migration, Invasion, and Adhesion Assays: From Cell Imaging to Data Analysis. Front. Cell Dev. Biol.. 2019;7:107.
- [CrossRef] [Google Scholar]
- DisGeNET: a comprehensive platform integrating information on human disease-associated genes and variants. Nucleic Acids Res.. 2017;45:D833-D839.
- [CrossRef] [Google Scholar]
- Molecular Docking: Shifting Paradigms in Drug Discovery. Int. J. Mol. Sci.. 2019;20
- [CrossRef] [Google Scholar]
- GeneCards: a novel functional genomics compendium with automated data mining and query reformulation support. Bioinformatics. 1998;14:656-664.
- [CrossRef] [Google Scholar]
- TCMSP: a database of systems pharmacology for drug discovery from herbal medicines. J Cheminform.. 2014;6:13.
- [CrossRef] [Google Scholar]
- Molecular Docking: Challenges, Advances and its Use in Drug Discovery Perspective. Curr. Drug Targets. 2019;20:501-521.
- [CrossRef] [Google Scholar]
- Integrating Molecular Docking and Molecular Dynamics Simulations. Methods Mol. Biol.. 2019;2053:13-34.
- [CrossRef] [Google Scholar]
- The STRING database in 2017: quality-controlled protein-protein association networks, made broadly accessible. Nucleic Acids Res.. 2017;45:D362-D368.
- [CrossRef] [Google Scholar]
- Analysis of Apoptosis and Necroptosis by Fluorescence-Activated Cell Sorting. Cold Spring Harb Protoc.. 2016;2016 pdb prot087387
- [CrossRef] [Google Scholar]
- Synthesis and Biological Evaluation of Novel Dehydroabietic Acid-Oxazolidinone Hybrids for Antitumor Properties. Int. J. Mol. Sci.. 2018;19
- [CrossRef] [Google Scholar]
- Design, synthesis and biological evaluation of novel 2-aminobenzamides containing dithiocarbamate moiety as histone deacetylase inhibitors and potent antitumor agents. Eur. J. Med. Chem.. 2018;143:320-333.
- [CrossRef] [Google Scholar]
- Synthesis, cytotoxic evaluation and target identification of thieno[2,3-d]pyrimidine derivatives with a dithiocarbamate side chain at C2 position. Eur. J. Med. Chem.. 2018;154:324-340.
- [CrossRef] [Google Scholar]
- Metallodrug ranitidine bismuth citrate suppresses SARS-CoV-2 replication and relieves virus-associated pneumonia in Syrian hamsters. Nat. Microbiol.. 2020;5:1439-1448.
- [CrossRef] [Google Scholar]
- New dehydroabietic acid (DHA) derivatives with anticancer activity against HepG2 cancer cell lines as a potential drug targeting EGFR kinase domain. CoMFA study and virtual ligand-based screening. J. Biomol. Struct. Dyn.. 2021;39:2993-3003.
- [CrossRef] [Google Scholar]
- Drug discovery beyond the 'rule-of-five' Curr. Opin. Biotechnol.. 2007;18:478-488.
- [CrossRef] [Google Scholar]
- The synthesis and antistaphylococcal activity of dehydroabietic acid derivatives: modifications at C12 and C7. Eur. J. Med. Chem.. 2017;127:917-927.
- [CrossRef] [Google Scholar]
- Design, synthesis, and evaluation of novel coumarin-dithiocarbamate derivatives (IDs) as anti-colorectal cancer agents. J. Enzyme Inhib. Med. Chem.. 2021;36:593-604.
- [CrossRef] [Google Scholar]
Appendix A
Supplementary data
Supplementary data to this article can be found online at https://doi.org/10.1016/j.arabjc.2022.104145.
Appendix A
Supplementary data
The following are the Supplementary data to this article:Supplementary data 1
Supplementary data 1


