

Translate this page into:
Detailed investigation on the polyphenols from four Dendrobium species against α-glucosidase: An integrated in vitro and in silico approach
⁎Corresponding authors. 2004cnd@163.com (Naidong Chen), 18565084850@163.com (Jiao Li)
-
Received: ,
Accepted: ,
This article was originally published by Elsevier and was migrated to Scientific Scholar after the change of Publisher.
Peer review under responsibility of King Saud University.
Abstract
This work was aimed to investigate the α-glucosidase inhibitory potential of methanol, petroleum ether, ethyl acetate, n-butanol, and water extracts/fractions of four Dendrobium species, which are traditional medicinal plants over the centuries, and discovery some important polyphenols in terms of lowering blood sugar based our previous research. Furthermore, the enzyme kinetics, HPLC, fluorescence spectra, and molecular docking were performed to provide additional insights into the binding mechanisms between individual polyphenol and α-glucosidase. All the organic extracts/fractions showed promising results on α-glucosidase with IC50 values of 4.23–52.53 μg/mL. The EtOAcF of D. chrysotoxum (EtOAcF-DC) possessed the lowest IC50 value (4.23 ± 0.19 μg/mL) against α-glucosidase. And an obvious correlation existed between the total phenol contents and α-glucosidase inhition capacity. Schaftoside, isoschaftoside, 2,4,7-trihydroxy-9,10-dihydrophenanthrene (TD), dihydroresveratrol, coelonin, nudol (NU), gigantol (GT), erianin, and tristin were identified as the main polyphenol components in these four Dendrobium plants. However, only TD, NU, coelonin, and GT had significant inhibitory activity on α-glucosidase. TD, NU and GT were discovered simultaneously in the EtOAc fractions (EtOAcFs) of the four Dendrobium species and occupied higher contents than other components, thus being selected as objectives for deep research. The TD from Dendrobium species was first reported as α-glucosidase inhibitor with an IC50 value of 52.46 ± 2.34 μg/mL, which was almost 6.5 times stronger than that of acarbose (IC50 = 338.84 ± 18.57 μg/mL), signifying it was a potential candidate for treating diabetes. NU and GT acted as uncompetitive inhibitors against α-glucosidase, while TD and EtOAcF-DC exhibited mixed-type inhibition. The fluorescence spectra analysis demonstrated that these inhibitors could quenched the fluorescence spectrum of α-glucosidase significantly. Interestingly, the NU quenched fluorescence by an unusual static quenching method. The molecular simulation illustrated these three polyphenols interacted with α-glucosidase primarily through hydrogen bonds and van der Waals interactions, and the binding sites between polyphenols and α-glucosidase supported the obtained results of inhibition kinetics. This study revealed that the phenolic-rich extracts/fractions and polyphenol compounds from Dendrobium plants could be potential α-glucosidase inhibitors.
Keywords
Dendrobium
Polyphenolic compounds
α-Glucosidase
Inhibitory mechanisms

1 Introduction
Diabetes mellitus (DM) is a metabolic disease caused by impaired insulin secretion or inefficient use of insulin, leading to some health-threatening complications, such as diabetic nephropathy, retinopathy, neuropathy, etc (Cho et al., 2018; Han et al., 2017; Padhi et al., 2020; Schloesser et al., 2017). Type 2 DM is the most common type, accounting for 90 % of all diabetes types, with the expection to be 592 million by 2035 (Yabe et al., 2015). α-Glucosidase inhibitor is regarded as an effective agent for treating diabetes, which can delay the hydrolysis and absorption of carbohydrates by inhibiting the activity of α-glucosidase, leading to a lowering postprandial blood glucose. Nowadays, some synthetic α-glucosidase inhibitors are commercially available, including acarbose, voglibose and miglitol (Derosa and Maffioli, 2012; Chi et al., 2019). However, studies revealed that 56 %–76 % patients taking these synthetic glucosidase inhibitors for a prolonged period of time suffered from side effects, such as diarrhea, flatulence, nausea, etc (Bellesia and Tagliazucchi, 2014; Campbell et al., 2000; Krentz and Bailey, 2005; Zhao et al., 2019). Natural bioactive compounds in plants have shown great potential for treating the postprandial hyperglycemia and may be an alternative to DM drugs for the low toxicity and good effect.
Dendrobium is one of the largest orchidaceae genera with over 1500 species, most of which are epiphytes or lithophytes, widely distributed in South, East and Southeast Asia, such as China, Japan, Philippines, Vietnam, India, Indonesia, etc (Szlachetko, 2022; Wu et al., 2023). It has been recorded as traditional or folk medicine in many Asian countries for thousands of years. Today, in the same way, the Chinese Pharmacopoeia collected the values of some Dendrobium species, including Dendrobium nobile Lindl, Dendrobium huoshanense C. Z. Tang et S. J. Cheng, Dendrobium chrysotoxum Lindl, and Dendrobium fimbriatum Hook (2020 edition). Many phytochemical and pharmacological studies have showed that the active components of Dendrobium plants are polysaccharides, alkaloids, polyphenol, flavonoids, amino acids, and trace elements (He et al., 2020). Dendrobium polysaccharide exhibited immunomodulatory and liver protective activities; Alkaloids have antioxidant, anticancer, and neuroprotective effects, while other compounds have shown anti-cytotoxicity, anti-angiogenesis, and anti-mutation effects (Duan et al., 2022; Ng et al., 2012; Xu et al., 2013). Despite the extensive employment and effectiveness of Dendrobium plants, the comprehensive research data on the components, activity and action mechanisms are still lacked. Furthermore, there is a common phenomenon in China, with the interchangeable use of multiple Dendrobium ingredients to prepare the Traditional Chinese Medicine (TCM) Shihu for treating diabetes, among which D. fimbriatum, D. huoshanense, D. chrysotoxum, and D. nobile are the most important ingredients. Whereas, the involved active material bases and activity data for the interchangeable use between Dendrobium species are also absence. Similar to polysaccharides, the polyphenols, another type of the main components in Dendrobium plants, exhibit various pharmacological activity, such as antitumor, antioxidant, anti-inflammatory, neuroprotection, etc (He et al., 2020). Moreover, some studies have demonstrated that polyphenols are a kind of potential anti-diabetic functional factor by inhibiting the activity α-glucosidase (Sarakulwattana, 2020). However, to the best of our knowledge, no comprehensive study has been done on the hypoglycemic bioactivities of polyphenols from Dendrobium plants, especially about the activity mechanisms for lowering blood sugar. Thus, the detailed information of key polyphenol compounds in main Dendrobium species should be available, including the confirmation of key polyphenol components, hypoglycemic activity and action mechanism. And this would be vital for the development of the related dietary hypoglycemic supplements for Dendrobium plants.
In this study, based on our previous study, we therefore explored the α-glucosidase inhibitory activity of extracts and partitioned fractions from the four important Dendrobium, including D. fimbriatum, D. huoshanense, D. chrysotoxum, and D. nobile, discovered the possible phenolic marker, and further elucidated the activity mechanisms, providing a theoretical basis for the application of Dendrobium polyphenols in the management of hyperglycemia.
2 Materials and methods
2.1 Materials
D. huoshanense was collected from Huoshan County, Anhui Province, China. D. nobile, D. chrysotoxum, and D. fimbriatum were obtained from Wenshan, Yunnan Province, China. All the plants were identified by Prof. Nai-Fu Chen, West Anhui University, China.
α-Glucosidase (≥60 units/mg), acarbose and p-nitrophenyl-α-D-glucopyranoside (pNPG) were purchased from Hefei Bomei Biotechnology Co., Ltd (Anhui, Hefei, China). p-Nitrophenol (PNP) and analytical reagent grade formic acid (FA) were products of Aladdin Co., Ltd. (Shanghai, China). Schaftoside, isoschaftoside, 2,4,7-trihydroxy-9,10-dihydrophenanthrene, dihydroresveratrol, coelonin, nudol, gigantol, erianin, and tristin were acquired from Sichuan Weikeqi Biological Technology Co., Ltd. (Sichuan, Chengdu, China). Other chemical reagents were of analytical grade.
2.2 Extract preparation and liquid–liquid fractionation
The freeze-dried stems of D. huoshanense, D. nobile, D. fimbriatum and D. chrysotoxum were crushed and screened to obtain Dendrobium powder. A 30.0 g of each Dendrobium powder was extracted three times by 500 mL of 90 % methanol with ultrasonic for 60 min, following which they were filtrated. The filtrate obtained was concentrated to less than 10 mL using rotary evaporator under a reduced pressure at 60℃ and then freeze-dried to obtain MeOH extracts (MeOHEs). The lyophilized extracts (3.0 g) were re-dissolved in ultrapure water (60.0 mL) and partitioned with successive increasingly polar solvents (petroleum ether, ethyl acetate and n-butanol) with five repetitions to acquire petroleum ether fraction (PEF), ethyl acetate fraction (EtOAcF), and n-butanol fraction (BuOHF). The remained compounds existed in aqueous fractions (H2OF). The extractive organic solvents were removed using a rotary evaporator and the remained water was lyophilized (Justino et al., 2022).
2.3 Polyphenol content determination
The total polyphenol content in the MeOHEs and varied fractions from four Dendrobium plants was determined according to the Folin-Ciocalteu method (Bellesia and Tagliazucchi, 2014). Initially, 1 mL test or standard solution (gallic acid, 10–60 μg/mL) was added with 1 mL of 1 M Folin-Ciocalteu's phenol reagent. After that, 2 mL of 7.5 % Na2CO3 solutions and 6 mL double distilled water were added to the mixture and allowed to stand for 60 min before reading at an absorbance of 766 nm using ultraviolet and visible spectrophotometer (Beijing General Instrument Co., Ltd, TU-1901). The gallic acid calibration equation was y = 0.1154x + 0.0357, R2 = 0.9983. The total polyphenol content of four Dendrobium plants was expressed as milligrams of gallic acid equivalents (mg GAE/g) (Hao et al., 2020).
2.4 Identification of polyphenols
The polyphenols were identified by ultra-high-performance liquid chromatography electrospray ionization-tandem mass spectrometry (UHPLC-ESI/MSn). Agilent 1290 Infinity ultra-high performance liquid chromatography system coupled with Agilent 6545 Q-TOF mass spectrometer (Agilent Technologies Santa Clara, CA, USA) was employed. A 2 μL of the sample solution was injected on an Eclipse Plus-C18 column (2.1 × 50 mm, 5 μm) and eluted with a mobile phase consisting of water (A) and acetonitrile (B) at a flow rate of 0.25 mL/min. The solvent gradient was set as following: 0–6 min, 85.3–83.8 % A; 6–25 min, 83.8–40 % A; 25–27 min, 40–0 % A; 27–30 min, 0 % A; 30–32 min, 0–85.3 % A; and 32–35 min, 85.3 % A. Nitrogen with high purity was used as drying gas (flow rate of 10.0 L/min) with temperature at 320 ℃ and capillary potential of 4.0 kV. The data were acquired in positive/negative mode (GT for positive mode; NU and TD for negative mode). The scan range was m/z 50–1700 for the MS scan and m/z 50–750 for the MS/MS scan. The argon was applied as the collision gas and the collision energy was set at 50–80 eV. Acquisition and analysis of data was performed with Qualitative Analysis Software Version B.07.00.
2.5 Inhibition of α-glucosidase activity
Based on the method of Zheng et al. with some modifications, the inhibitory activity of α-glucosidase was measured (Zheng et al., 2020). Briefly, the α-glucosidase and pNPG were dissolved in phosphate buffer saline (PBS, 0.1 M, pH 6.8). Then, 80 μL of test solution at different concentrations and 20 μL of α-glucosidase solution (2 U/mL) were mixed and incubated in 96-well plates at 37 °C for 10 min, following which 40 μL of 8 mM pNPG solution was added to each well to start the reaction, and the mixture was further incubated at 37 °C for 30 min. A 60 μL of 1 M Na2CO3 solution was added to stop the reaction. The absorbance at 405 nm was recorded using micro-plate reader (BioTek, Synergy H1). The acarbose was used as positive control. The inhibitory activity for α-glucosidase was calculated by the following Eq. (1):
Where A1, A2, A3 and A4 are the absorbance at 405 nm in the experimental group (with α-glucosidase and samples), experimental blank group (without α-glucosidase and with samples), control group (with α-glucosidase and without samples) and control blank group (without α-glucosidase and samples), respectively. All assays were performed in triplicate.
2.6 Kinetics study against α-glucosidase
The mode of inhibition between enzyme and inhibitors was determined by Lineweaver-Burk plot, which was plotted between the reciprocal of the various concentration of substrate (1/[S]) and the reciprocal of enzyme catalytic rate (1/V) at different concentrations of inhibitors. Lineweaver-Burk plots for inhibition of α-glucosidase were acquired at varying concentrations of pNPG (1, 2, 4, 8 mM). Different concentrations of the inhibitors (0, 200, 300, 400 μg/mL for NU; 0, 400, 600 and 800 μg/mL for GT; 0, 20, 40 and 60 μg/mL for TD; 0, 4, 6 and 8 μg/mL for EtOAcF-DC) were set, using a fixed concentration of the α-glucosidase (2 U/mL). The assay was performed as mentioned in Section 2.5.
Michaelis constant (Km) and maximum initial reaction velocity (Vmax), as two important parameters used to judge the inhibition type, were obtained from the plot (Eq. (2)).
Where, v and [S] represent the reaction rate in the initial stage and substrate concentration, respectively.
The inhibition constants of compounds for the free enzyme (Ki) and for the enzyme-substrate complex (Kí) were obtained from Eq. (3) and (4).
2.7 HPLC analysis
The solutions including pNPG (8 mM, 0.4 mL), α-glucosidase (2 U/mL, 0.2 mL) and samples solution (NU, GT, TD and EtAOcF-DC, 0.2 mg/mL, 0.8 mL) were incubated at 37 ℃ for 40 min. Then, the Na2CO3 solution (1 M, 0.6 mL) was added to terminate the reaction, after which the reaction was immediately observed by Agilent1260 HPLC system (Santa Clara, CA, USA) using an Waters XBridge C18 column (5 μm, 250 × 4.6 mm, Waters Co., Milford, MA, USA) at 280 nm. The mobile phase was consisted of pure methanol (solvent A) and 0.1 % formic acid in ultrapure water (solvent B). The elution gradient was set as follows: initial, 20 % A; 0–5 min, 20 %-50 % A; 5–10 min, 50 %-80 % A; 10–20 min, 80 %-100 % A; 20–23 min, 100 %-100 % A; 23–25 min, 100 %-20 %; and 25–28 min, 20 %-20 % A. The loading volume was 10 µL and the flow rate was set as 1.0 mL/min. Triplicate analyses were done for each sample.
2.8 Fluorescence measurement
A 3.3 mL solutions containing 1.0 mL of PBS, 2 mL of 2 U/mL α-glucosidase and 0.3 mL of samples at different concentrations were incubated in a water bath for 10 min at three temperatures (297.15 K, 303.15 K, and 310.15 K). The fluorescence emission spectra were analyzed by a spectrofluorometer (model F-4600, Hitachi, Tokyo, Japan) in the range of 300–500 nm upon excitation at 280 nm. The excitation and emission bandwidths were 5 nm for acarbose, EtAOcF-DC, GT and TD, and 2.5 nm for NU.
The rate constant in the process of the biomolecular quenching (Kq), dynamic quenching constant (Ksv), binding constant (Ka), and the number of binding site(s) (n) were calculated following Eq. (5) and (6), where F0 and F are the fluorescence intensities of enzyme with or without quenchers, respectively; τ0 is the average lifetime of fluorescent molecule; Ksv is dynamic quenching constant, which is equal to Kqτ0; and [Q] represents the concentration of the quencher.
When the temperature does not change rapidly, the thermodynamic parameters including the enthalpy change (ΔHo) and entropy change (ΔSo) can be calculated according to the van’t Hoff Eq. (7). The free energy change (ΔGo) can be obtained from the Eq. (8):
2.9 Molecular docking
To observe the binding pattern, a molecular docking study was performed. Since the crystal structure of α-glucosidase from Saccharomyces cerevisiae is not available yet, the 3D protein structure of isomaltase (PDB ID: 3A4A), which shares high sequence similarity with α-glucosidase, was substituted for that (Ha et al., 2022). ChemDraw and Chem3D 19.1 (Cambridge Soft Corporation, Cambridge, USA) were used to prepare 2D and 3D structures of the tested compounds. The protein was dewatered by Pymol software. The gasteiger charges were added and the rotatable bonds were set using AutoDockTools 1.5.6, and the docking input files were also prepared. Molecular docking studies were carried out using Autodock vina, implementing Lamarckian genetic algorithm method. The substrate pNPG was initially docked into the active pocket of the enzyme and formed a substrate-enzyme complex, following which the polyphenols were docked with the complex separately. Acarbose was used as a reference for observing the catalytical active sites. The docking parameters were set according the methods of Ha et.al (Ha et al., 2022). The best-scoring pose was chosen and visually analyzed by Discovery Studio Visualizer v21.1 and PyMoL 1.7.6 software.
2.10 Statistical analysis
All results were presented as mean ± standard deviation of triplicate independent measurements. The significance of difference was calculated using one-way ANOVA followed by Tukey as post-test. Spearman’s correlation was used to evaluate linear relationships between the results. P < 0.05 was considered statistically significant. All the figures were plotted by Origin 9.0 software and GraphPad Prism 9.3 software.
3 Result and discussion
3.1 Total phenols content
The liquid–liquid partitioning was performed with the methanol extracts of the four Dendrobium species, since this strategy has always been employed to concentrate the phytochemicals in specific organic fractions, thus increasing the biological activities. The total phenols contents of four MeOH extracts (MeOHEs) and the varied fractions from four Dendrobium species were calculated in this study. As the Table 1 shown, it was obvious that the EtOAcFs of four Dendrobium species possessed more phenolic compounds compared with other fractions or MeOHEs, among which D. fimbriatum exhibited the highest total phenolic content (239.39 ± 5.33 mg GAE g−1), followed by D. huoshanense (225.41 ± 2.08 mg GAE g−1), D. chrysotoxum (186.59 ± 3.65 mg GAE g−1) and D. nobile (116.00 ± 4.17 mg GAE g−1) (p < 0.05). In addition, the content of total phenols in all EtOAcFs was higher than that of their corresponding MeOHEs (p < 0.001), indicating that the phenols were concentrated in the EtOAcFs after the liquid–liquid partitioning. Values expressed as mean ± standard deviation. Note: PEF: petroleum ether fraction; EtOAcF: ethyl acetate fraction; BuOHF: n-butanol fraction; H2OF: water fraction; MeOHE: methanol extract. Different letters within each column indicate significant differences (p < 0.05, one-way ANOVA followed by Tukey as post-test).
Total phenolic content (mg GAE g−1)
D. huoshanense
D. nobile
D. fimbriatum
D. chrysotoxum
MeOHE
23.85 ± 0.43d
30.27 ± 0.44c
35.81 ± 0.33b
41.34 ± 0.40c
PEF
76.89 ± 0.26b
47.42 ± 0.72b
41.76 ± 0.44b
30.90 ± 0.92d
EtOAcF
225.41 ± 2.08a
116.00 ± 4.17a
239.39 ± 5.33a
186.59 ± 3.65a
BuOHF
46.98 ± 0.77c
43.38 ± 0.17b
36.06 ± 0.55b
69.36 ± 0.68b
H2OF
7.59 ± 0.15e
12.13 ± 0.10d
10.72 ± 0.15c
10.47 ± 0.06e
3.2 α-glucosidase inhibition of methanol extracts and fractions from Dendrobium plants
The α-glucosidase inhibitoty activities of MeOHEs and the subsequent fractions from Dendrobium plants were shown in Table 2. For extracts, the MeOHE of D. chrysotoxum was calculated as the lowest IC50 value (11.30 ± 0.55 μg/mL), indicating it had the strongest inhibitory activity against α-glucosidase in contrast with those of other three Dendrobium plants. Values expressed as mean ± standard deviation. Note: PEF: petroleum ether fraction; EtOAcF: ethyl acetate fraction; BuOHF: n-butanol fraction; H2OF: water fraction; MeOHE: methanol extract. Different letters within each column indicate significant differences (p < 0.05, one-way ANOVA followed by Tukey as post-test).
samples
IC50 ± SD (μg/mL)
MeOHE
PEF
EtOAcF
BuOHF
H2OF
D.huoshanense
52.53 ± 1.0a
50.11 ± 1.72a
4.39 ± 0.19b
38.99 ± 2.49b
6933.22 ± 337.09a
D.nobile
42.84 ± 3.13b
11.61 ± 0.69b
5.98 ± 0.31a
48.02 ± 3.28a
2725.27 ± 92.99c
D.fimbriatum
28.45 ± 0.32c
9.53 ± 0.19bc
5.64 ± 0.16a
48.14 ± 2.88a
2228.28 ± 96.22c
D.chrysotoxum
11.30 ± 0.55d
8.00 ± 0.20c
4.23 ± 0.19b
21.50 ± 1.23c
4015.05 ± 428.1b
Acarbose
338.84 ± 18.57
By comparing the four fractions with different polarity (PEF, EtOAcF, BuOHF, and H2OF), all the EtOAcFs of four Dendrobium plants showed the highest α-glucosidase inhibition capacity, which was well in line with the total phenols content results because all the EtOAcFs also had the highest total phenolic content. And the EtOAcF of D. chrysotoxum (EtOAcF-DC) showed the lowest IC50 value (4.23 ± 0.19 μg/mL), implying it had strongest α-glucosidase inhibitory capacity. Furthermore, it is worth mentioning that the inhibitory potential on the α-glucosidase exhibited by all the MeOHEs and organic fractions from Dendrobium plants was greater than acarbose (338.84 ± 18.57 μg/mL). Notably, there was strong correlation between content of polyphenol compounds and the IC50 values against α-glucosidase (r ∼ -0.789, p < 0.001), supporting the fact that the high content polyphenol induced strong α-glucosidase inhibition, which was ascribed to the interactions of hydroxyl groups and α-glucosidase.
3.3 Confirmation of key phenolic compounds and α-glucosidase inhibition
According to our previous study, the main phenolic compounds, including schaftoside, isoschaftoside, 2,4,7-trihydroxy-9,10-dihydrophenanthrene (TD), dihydroresveratrol, coelonin, nudol (NU), gigantol (GT), erianin, and tristin, were identified and quantified in the same four Dendrobium species (Zhu et al., 2021). As displayed in Fig. 1A, among the tested phenolic compounds, 2,4,7-trihydroxy-9,10-dihydrophenanthrene (TD), nudol (NU), coelonin, and gigantol (GT) had significant inhibitory effect on α-glucosidase with the inhibition rate no lower than 50 %, determined at 0.5 mg/mL. Considering the individual content and inhibitory activity on α-glucosidase, NU, GT and TD were selected for the further mechanism study. For detecting whether the choosen individual polyphenols existed in the EtOAcFs which showed the strongest inhibition, the corresponding peaks of EtOAcFs were identified by LC-MS/MS, and the results were displayed in Figs. S(1–3). As expected, all the above three polyphenols (NU, GT and TD) were detected in EtOAcFs of four Dendrobium species, indicating that these four Dendrobium plants had some common polyphenol ingredients for exerting hypoglycemic activity. The inhibition curves of NU, GT, and TD were plotted based on inhibition rate (%) at gradient polyphenol concentrations (Fig. 1B). The IC50 values of NU, GT and TD for α-glucosidase were 287.79 ± 5.54, 458.20 ± 0.88, and 52.46 ± 2.34 μg/mL, respectively. Obviously, the IC50 of TD was far lower than that of acarbose (338.84 ± 18.57 μg/mL), indicating it performed stronger inhibition on α-glucosidase than acarbose and had potential to be an alternative of partial acarbose for reducing dose of the drug in the aspect of controlling hyperglycemia. It was reported that the hydroxyl groups in polyphenols could contribute to the α-glucosidase inhibition by forming intermolecular hydrogen bond with the vital amino acid residues located in α-glucosidase (Uddin et al., 2012). Therefore, it helps to explain that the significant inhibitory effect of TD on α-glucosidase may result from multiple hydroxyl groups (see structures illustrated in Fig. 1C). Compared with individual polyphenols, the inhibition performance of all the EtOAcFs was superior to the individual compounds, illustrating the active components of fractions inhibited α-glucosidase by synergistic effect. To reveal the inhibitory mechanism of complex fraction, the EtOAcF-DC was chosen as well for next research owing to the lowest IC50 value.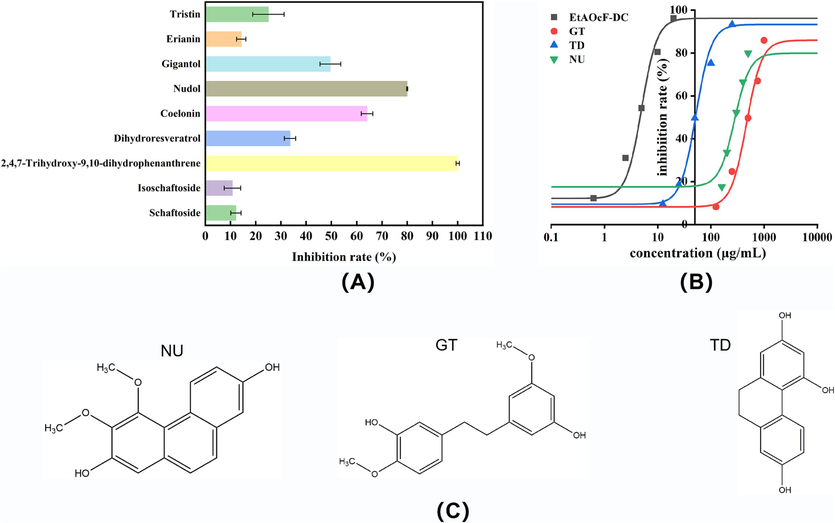
(A) Inhibition of α-glucosidase by individual polyphenol compounds at the concentration of 0.5 mg/mL; (B) Inhibition of α-glucosidase at varying concentrations of inhibitors (NU, GT, TD and EtOAcF-DC) and the fitted curves; (C) Molecular structures of NU, GT and TD.
3.4 Inhibition kinetics against α-glucosidase
The inhibition mode of α-glucosidase by three individual polyphenols and the EtOAcF-DC was judged using the Lineweaver–Burk plot (L-B plot). As shown in Fig. 2A-B, the Lineweaver-Burk plots of both NU and GT exhibited a pattern of parallel lines at all concentrations, acting as rare uncompetitive inhibitors, which bound only with the enzyme-substrate complex, but not with the free enzyme (Song et al., 2016). However, the L-B plots for TD and EtOAcF-DC (Fig. 2C-D) showed that the intersection of all straight lines was in the third quadrant, indicating they acted as a mixed inhibition manner (non-competitive and umcompetitive types) (Liu et al., 2022). In the mixed-inhibition mode, the inhibitors may not only interact with free enzyme, but also interact with enzyme-substrate complex, thus forming an enzyme-substrate-inhibitor ternary complex. Additionally, besides active sites, this mixed inhibitor could bind with the allosteric sites and change the conformation of enzyme, decreasing the catalytical rate of enzyme. The replots were linearly fitted within their concentrations, suggesting a single binding site or the same kind of binding sites on the enzyme for these inhibitors (shown in the insets of Fig. 2). The detailed kinetics parameters were calculated and showed as Table 3. As the concentrations increased, both Km and Vmax decreased for NU, GT, TD, and EtOAcF-DC. The Ki and Ki' represent the inhibition constants of compounds inhibit free enzyme and enzyme-substrate complex, respectively. A lower inhibition constant signifies a stronger binding affinity. It was noted that the Ki values for TD and EtOAcF-DC were higher than their respective Ki' values, proving that they bound tighter with alpha-glucosidase-pNPG complexes than free α-glucosidase (Cardullo et al., 2020). Due to the uncompetitive inhibition characteristics, only Ki' values were obtained for NU and GT, with a value of 119.58 μg/mL and 265.60 μg/mL, respectively.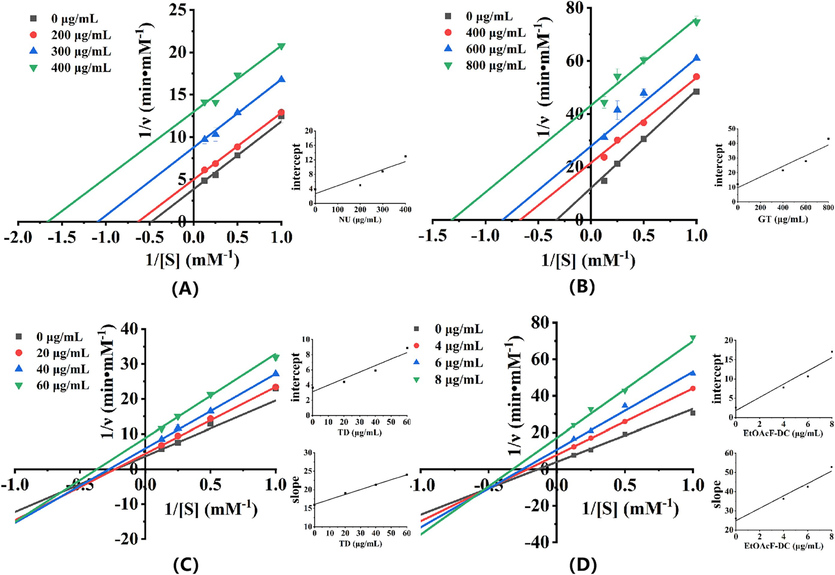
Lineweaver-Burk plots of α-glucosidase inhibition at different concentrations of substrate (pNPG) of: (A) NU; (B) GT; (C) TD; (D) EtOAcF-DC. The insets depict the secondary plots of slope and intercept vs inhibitors concentration.
Sample
Concentration (μg/mL)
Linear fit equation
Km (mM)
Vmax (mM/min)
Ki (μg/mL)
Kí (μg/mL)
NU
0
y = 7.99156x + 3.84094
2.08
0.26
–
119.58
200
y = 7.88076x + 4.98191
1.58
0.20
300
y = 8.03571x + 8.77356
0.92
0.11
400
y = 7.80334x + 12.97455
0.60
0.08
GT
0
y = 36.8834x + 12.06909
3.06
0.083
–
265.60
400
y = 32.09176x + 21.55458
1.49
0.046
600
y = 33.19112x + 27.8394
1.19
0.036
800
y = 32.76115x + 43.22057
0.76
0.023
TD
0
y = 15.89269x + 3.6499
4.35
0.274
120.85
36.36
20
y = 19.02381x + 4.3981
4.33
0.227
40
y = 21.26867x + 5.8926
3.61
0.170
60
y = 24.00335x + 8.8828
2.70
0.113
EtOAcF-DC
0
y = 26.07941x + 4.69199
5.56
0.213
7.70
2.44
4
y = 36.23242x + 7.77849
4.66
0.129
6
y = 42.44702x + 10.64638
3.99
0.094
8
y = 52.81317x + 17.05185
3.10
0.059
3.5 HPLC analysis
To study the effects of the inhibitors on enzyme catalytical system, HPLC was employed to observe the variation of peaks in reaction system when the three polyphenol compounds and EtOAcF-DC were added. As Fig. 3A-B shown, after reaction for 40 min, the area of peak 1 (pNPG, Rt = 6.175 min) decreased greatly and the area of peak 2 (PNP, Rt = 9.408 min) increased substantially without inhibitors (Peak 1 from 6162.5 to 439.9; Peak 2 from 0 to 3211.6). The area of peak 2, which represented the content of reaction product, was used as as the reference to evaluate the catalytic activity of α-glucosidase. After the addition of NU, GT, TD and EtOAcF-DC, the area of peak 2 decreased to 2486.7, 2762.2, 539.3 and 7.4, respectively, meaning that their reduction rates were 22.57 %, 13.99 %, 83.21 %, and 99.78 %, respectively. This was consistent with the α-glucosidase inhibition rate.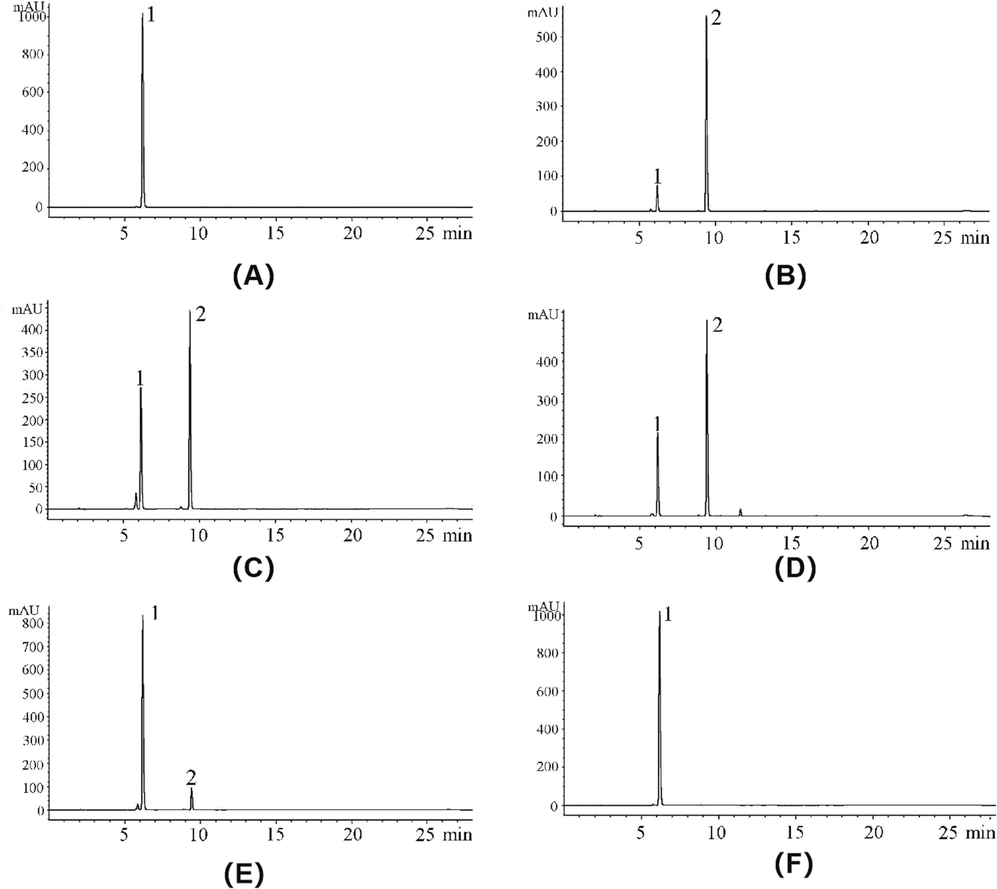
(A-B) Changes in the α-glucosidase catalytic system without inhibitors at different reaction times (A: 0 min; B: 40 min). (C-F) The effects of four samples on the α-glucosidase catalytic system after 40 min of reaction (C: NU; D: GT; E: TD; F: EtOAcF-DC) (Peak 1: pNPG; Peak 2: PNP).
3.6 Fluorescence spectra and analysis of the quenching mechanism
Fluorescence spectra measurement was employed to study binding interactions between small molecules and α-glucosidase. The fluorescence of α-glucosidase is closely associated with three intrinsic fluorophores: phenylalanine, tryptophan and tyrosine (Shang et al., 2018; Wang et al., 2014). Once the surrounding microenvironment of these aromatic amino acids changes, the intensity and position of the fluorescence might be affected. After excitation at 280 nm, the fluorophores show a strong emission peak at about 336 nm for α-glucosidase. When the quenchers are added, the fluorescence will be quenched and their intensity becomes weaker theoretically if there is no other interference. In our study, acarbose, three polyphenols (NU, GT and TD) and EtOAcF-DC were added to the α-glucosidase solution to observe the changes in the fluorescence emission intensity of α-glucosidase. Based on the results in Fig. 4A-B, the fluorescence of α-glucosidase was gradually quenched with the increased acarbose and NU concentrations, demonstrating the binding interactions of these two with α-glucosidase. Notably, with increasing the concentrations of acarbose, the maximal fluorescent emission wavelength showed a red shift, which proved that α-glucosidase was unfolded and it’s conformation might be changed induced by acarbose. While, the maximum fluorescence emission wavelength for NU didn’t move, showcasing NU bound to the active sites of α-glucosidase and didn’t affect the conformation of the enzyme. Though acarbose and NU showed fluorescence (The insets of Fig. 4A-B), their interference on α-glucosidase could be almost neglected due to the long distance of maximum fluorescence emission wavelength between the quenchers and α-glucosidase.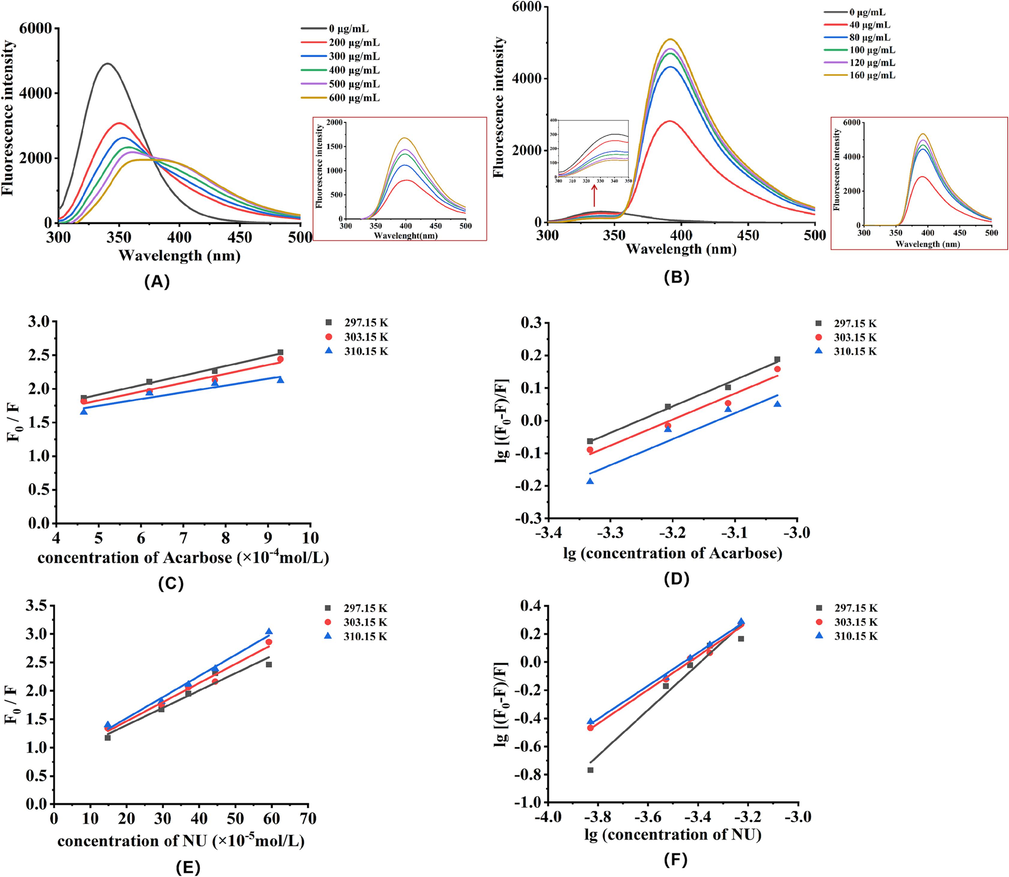
Fluorescence spectra of α-glucosidase in the presence of acarbose and NU at various concentrations (A: acarbose; B: NU). Stern-Volmer plots for fluorescence quenching of α-glucosidase with different temperature of 297.15 K, 303.15 K, and 310.15 K (C and D for acarbose, E and F for NU).
In addition, the variation for fluorescence emission intensity of α-glucosidase interacting with GT, TD and EtOAcF-DC was showed in Fig. S4. The fluorescence emission intensity of α-glucosidase decreased with the introductions of GT, TD and EtOAcF-DC at different concentrations (Figs. S4(A, C and E)). Different from acarbose and NU, the fluorescence emission intensity of α-glucosidase increased progressively as the concentrations of GT, TD and EtOAcF-DC increased. This result may be attributed to the interference of inhibitors on the fluorescence spectra of α-glucosidase. As shown in the Figs. S4(B, D), both GT and TD exhibited characteristic fluorescence emission peaks within the wavelength of 300–350 nm under the excitation wavelength of 280 nm, which were very close to the maximum fluorescence emission peak of α-glucosidase. Though the maximum fluorescence emission wavelength of EtOAcF-DC was a little far away from that of α-glucosidase, it still had influence on observing the fluorescence emission intensity of α-glucosidase due to the complexity of components (Fig. S4F).
The fluorescence quenching of substances includes two quenching forms i.e. static quenching and dynamic quenching. In static quenching process, the fluorescent molecules bind with the quencher and form a ground-state dark complex, quenching the fluorescence. Dynamic quenching refers to a process of collision between the fluorescent molecule and the quencher (Ding et al., 2018; Yin et al., 2022). Because the fluorescence emission of TD, GT, and EtOAcF-DC caused interference to α-glucosidase, resulting in the inaccurate fluorescence emission intensity. Herein, analysis of the quenching mechanism only involved acarbose and NU. Based on Equations (5), (6), (7) and (8), the biomolecular quenching rate constant (Kq), the dynamic quenching constant (KSV), binding constants (Ka), number of binding sites (n) and thermodynamic parameters (ΔHo, ΔSo and ΔGo) could be calculated. As shown in Fig. 4(C and E), the curves had good linearity within different concentrations at three temperatures (297.15, 303.15 and 310.15 K), meaning that both acarbose and NU interacted with α-glucosidase with a single type of quenching. Generally, when the quenching constant decreases with the temperature increasing, it is regarded as static quenching, while the reversed result is devided as dynamic quenching (Ajmal et al., 2016; Wu et al., 2018). For acarbose, the values of Ksv decreased gradually with the increase of temperatures. Moreover, all the Kq values were greater than the maximum scattering collision quenching constant (2.0 × 10¹⁰ L/(mol⋅s)), implying that the acarbose quenched the fluorescence of α-glucosidase by static quenching. For NU, the rise of temperature resulted in an increase of Ksv, which implied the possibility of dynamic quenching processes. However, all the values of Kq remained higher than 2.0 × 10¹⁰ L/(mol⋅s), explaining that the quenching was not initiated by the dynamic process but occurred statically with the formation of α-glucosidase-NU complex. The increased Ksv value may ascribe to its structural feature and physicochemical properties. Thus, it was concluded that the NU quenched α-glucosidase by an unclassical static quenching mechanism since the Kq value is one of the most definitive methods for distinguishing static or dynamic quenching (Ibrahim et al., 2010). This was consistent with some other studies and the similar phenomenon was presumed as a static quenching process (Tong et al., 2014; Wang et al., 2022). Besides, the values of the binding constants (Ka) were decreased with the rising temperature for both acarbose and NU, so the binding capacity of both two quenchers to α-glucosidase was weakened as the temperature increased, and the stability was decreased. Meanwhile, most binding sites (n) for acarbose and NU binding with α-glucosidase at three different temperatures tended to be 1, indicating one molecular of inhibitor bound to one available binding site on α-glucosidase in ratio (1:1).
The main thermodynamic parameters i.e. ΔHo and ΔSo values were determinated to analyze the interaction forces between quencher and α-glucosidase. As seen from Table 4, the ΔHo and ΔSo values for the interaction of acarbose and NU to α-glucosidase were both negative, indicating that hydrogen bonds and van der Waals were the main forces for forming the complex. Furthermore, since both the ΔGo values were negative, it was deduced that the binding process of both small molecules and α-glucosidase happened spontaneously (Zheng et al., 2020).
T (K)
Ksv (L*mol−1)
Kq (L/mol/s)
Ka (L/mol)
n
ΔHo (KJ/mol)
ΔSo (J/mol/K)
ΔGo (KJ/mol)
Acarbose
297.13
1.417 × 10³
1.417 × 10¹¹
4.344 × 10²
0.8107
−19.36
−14.73
−14.98
303.15
1.320 × 10³
1.320 × 10¹¹
3.598 × 10²
0.7977
−14.89
310.15
1.004 × 10³
1.004 × 10¹¹
3.124 × 10²
0.7973
−14.79
NU
297.13
3.045 × 10³
3.045 × 10¹¹
3.282 × 10⁵
1.627
−191.68
−544.20
−29.97
303.15
3.357 × 10³
3.357 × 10¹¹
1.352 × 10⁴
1.202
−26.71
310.15
3.712 × 10³
3.712 × 10¹¹
1.197 × 10⁴
1.180
−22.90
3.7 Molecular docking
The interaction mechanism between compounds and α-glucosidase was investigated via molecular docking. In this study, acarbose and three polyphenols (NU, GT and TD) were docked with glucosidase. The binding energy of the compounds against α-glucosidase and interacting residues were listed in Table S1.
Considering the kinetics result, the NU, GT and TD tended to bind with enzyme-substrate complex than the free enzyme, thus, the molecular docking was performed by a two-step method. Firstly, the substrate pNPG was docked into the catalytic site of enzyme and formed a pNPG-enzyme complex, then, the polyphenols were docked with the complex one by one. The acarbose was used as a catalytic reference inhibitor, which occupied at catalytic site, and the interaction with glucosidase was displayed in Fig. S5. From our docking 3D diagram (Fig. 5A), acarbose, NU, GT and TD were posed in the same catalytic pocket of the enzyme with the binding energy of − 9.0, −8.3, −7.7 and − 8.4 kcal/mol, respectively. Besides catalytic site, DT was also docked into the allosteric site of glucosidase with binding energy of − 6.7 kcal/mol. The docking results were consistent with the kinetics data, which revealed that both NU and GT were uncompetitive type inhibitors for docking into the catalytic site, whereas TD was a mixed type inhibitor as it could dock on both the catalytic and allosteric sites of glucosidase. Observing the binding forces, the hydrogen bonds and van der Waals interactions were the main interactions, which was also verified by the thermodynamic result. The NU shared the residues (Ser241, Lys156 and Asp242) via hydrogen bonds and residues (Ser311, Pro312, Arg315, Phe314, Leu 313, Ser240, Ser157, and Leu177) via van der Waals interactions with glucosidase (Fig. 5B). The GT interacted with Lys156, Arg315, Glu411 and Asn415 residues via hydrogen bonds interactions; Ser240, Ser157, Tyr316, Gly160, Phe159, Leu313, Asp242 and UNN0 via van der Waals interactions (Fig. 5C). UNN0 was the substrate pNPG, signifying that the compound might form interaction with the substrate of complex when it acted as uncompetitive pattern. Uncompetitive inhibition on α-glucosidase has rarely been reported, both NU and GT behaved as an uncompetitive inhibitor for α-glucosidase and might bind on the active site of pNPG-glucosidase complex, blocking catalytic reaction proceeding (Ha et al., 2022). As for TD, being located at catalytic site, it formed interactions involved in a strong hydrogen bond interaction with an important residue of Ser240, and seven van der Waals interactions with residues of Asp242, Arg315, Tyr316, Phe314, Gly160, Ser157 and UNN0 (Fig. 5D). As posed in allosteric sites, it bound with Glu271 and Ile272 residues via hydrogen bond interactions; Trp15, Ala292, Ser298, Leu297, Asn259, Ile262, Arg263, Val266, and Arg270 via van der Waals interactions (Fig. 5E). TD behaved as a mixed inhibition, including noncompetitive and uncompetitive inhibition mode. With uncompetitive mode, it interacted with catalytic site of complex, preventing the catalytic reaction from happening. When it acted as noncompetitive inhibitor, it would bind with allosteric sites and might change the conformation of the enzyme, therefore weakening the activity of the enzyme.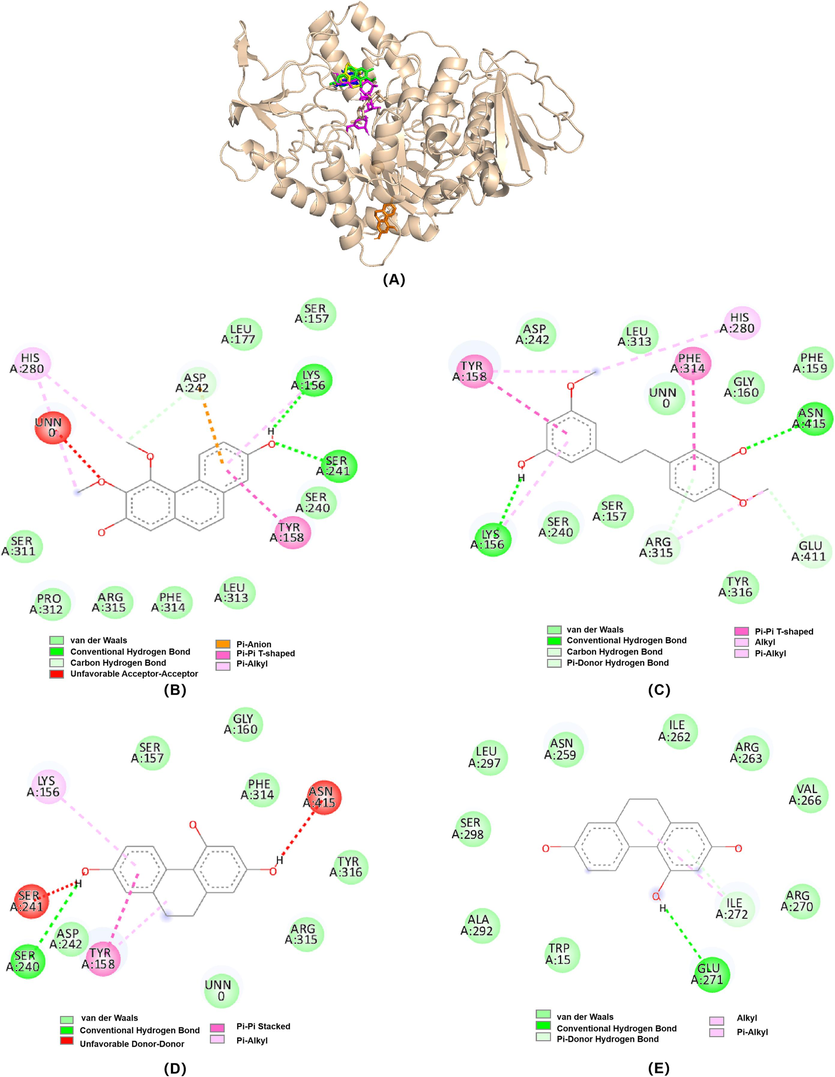
(A) 3D diagram of Molecular docking related α-glucosidase inhibition by acarbose (magenta stick), NU (green stick), GT (yellow stick) and TD (blue and orange stick). (B-E) 2D diagram of α-glucosidase inhibition by NU (B), GT (C), and TD (D (at the catalytic site) and E (at the allosteric site)). The figure was generated by PyMOL and Discovery Studio Visualizer.
4 Conclusion
In conclusion, three typical polyphenols (NU, GT, and TD) were found to exist in EtOAcFs of four Dendrobium species (D. fimbriatum, D. huoshanense, D. chrysotoxum, and D. nobile) simultaneously, and the inhibitory effect and mechanism towards α-glucosidase were investigated in this work. Through enzyme inhibition kinetics, it was concluded that NU and GT inhibited glycosidases in an uncompetitive manner, whereas TD and mixture EtOAcF-DC acted as mixed inhibition mode. HPLC showed that these three polyphenols and EtOAcF-DC could reduce the generation of catalytic products. The fluorescence spectra analysis demonstrated that acarbose, three polyphenols, and EtOAcF-DC could weaken the fluorescence emission intensity of α-glucosidase. Among them, acarbose and NU showed static quenching. The molecular docking showed that hydrogen bond and van der Waals interactions were the main interactions, which was consistent with the thermodynamic result from the fluorescence experiment. Furthermore, NU and GT interacted with the active site, whereas TD interacted with both the active site and allosteric sites, revealing the fact that NU and GT were uncompetitive inhibitors, while TD was a mixed inhibitor. Conclusively, this article not noly provides an effective guidance for the application of individual polyphenols or mixture as alternative of α-glucosidase inhibitors in food and pharmaceutical industry, but also gives some evidence on the rationality of the interchangeable use of these four Dendrobium species in preparing TCM Shihu for decreasing blood sugar.
Acknowledgments
This paper was granted by Natural Science Foundation of Anhui Scientific Research and Innovation Team of Quality Evaluation and Improvement of Traditional Chinese Medicine (No.2022AH010090); The Project of Anhui Rural Revitalization Traditional Chinese Medicine Industry Collaborative Technology Service; High-Level Talent Project of West Anhui University (No.WGKQ2022024); The Provincial Level Nature Science Foundation of Anhui Education Department (2022AH051676, 2023A052643). The authors would like to thank the anonymous reviewers for their invaluable suggestions that helped improve the manuscript.
Declaration of competing interest
The authors declare that they have no known competing financial interests or personal relationships that could have appeared to influence the work reported in this paper.
References
- Interaction of new kinase inhibitors cabozantinib and tofacitinib with human serum alpha-1 acid glycoprotein. A comprehensive spectroscopic and molecular Docking approach. Spectrochim. Acta. A Mol. Biomol. Spectrosc.. 2016;159:199-208.
- [Google Scholar]
- Cocoa brew inhibits in vitro alpha-glucosidase activity: The role of polyphenols and high molecular weight compounds. Food Res. Int.. 2014;63:439-445.
- [Google Scholar]
- Miglitol: Assessment of its role in the treatment of patients with diabetes mellitus. Ann. Pharmacother.. 2000;34:1291-1301.
- [Google Scholar]
- C-glucosidic ellagitannins and galloylated glucoses as potential functional food ingredients with anti-diabetic properties: a study of alpha-glucosidase and alpha-amylase inhibition. Food Chem.. 2020;313:126099
- [Google Scholar]
- Polyoxomolybdates as alpha-glucosidase inhibitors: Kinetic and molecular modeling studies. J. Inorg. Biochem.. 2019;193:173-179.
- [Google Scholar]
- IDF Diabetes Atlas: Global estimates of diabetes prevalence for 2017 and projections for 2045. Diabetes Res. Clin. Pract.. 2018;138:271-281.
- [Google Scholar]
- alpha-Glucosidase inhibitors and their use in clinical practice. Arch. Med. Sci.. 2012;8:899-906.
- [Google Scholar]
- New Insights into the Inhibition Mechanism of Betulinic Acid on alpha-glucosidase. J. Agric. Food Chem.. 2018;66:7065-7075.
- [Google Scholar]
- Alkaloids from Dendrobium and their biosynthetic pathway, biological activity and total synthesis. Phytomedicine. 2022;102:154132
- [Google Scholar]
- PTP1B and alpha-glucosidase inhibitory activities of the chemical constituents from Hedera rhombea fruits: Kinetic analysis and molecular docking simulation. Phytochemistry. 2022;197:113100
- [Google Scholar]
- Inhibitory effect of phloretin on alpha-glucosidase: Kinetics, interaction mechanism and molecular docking. Int. J. Biol. Macromol.. 2017;95:520-527.
- [Google Scholar]
- Assessment of ATR-NIR and ATR-MIR spectroscopy as an analytical tool for the quantification of the total polyphenols in Dendrobium huoshanense. Phytochem. Anal.. 2020;31:366-374.
- [Google Scholar]
- Recent research progress on natural small molecule bibenzyls and its derivatives in Dendrobium species. Eur. J. Med. Chem.. 2020;204:112530
- [Google Scholar]
- Interactions between antimalarial indolone-N-oxide derivatives and human serum albumin. Biomacromolecules. 2010;11:3341-3351.
- [Google Scholar]
- Flavonoids and proanthocyanidins-rich fractions from Eugenia dysenterica fruits and leaves inhibit the formation of advanced glycation end-products and the activities of alpha-amylase and alpha-glucosidase. J. Ethnopharmacol.. 2022;285:114902
- [Google Scholar]
- Oral antidiabetic agents - Current role in type 2 diabetes mellitus. Drugs. 2005;65:385-411.
- [Google Scholar]
- Preparation and characterization of a dihydromyricetin-sugar beet pectin covalent polymer. Food Chem.. 2022;376:131952
- [Google Scholar]
- Review of research on Dendrobium, a prized folk medicine. Appl. Microbiol. Biot.. 2012;93:1795-1803.
- [Google Scholar]
- Type II diabetes mellitus: a review on recent drug based therapeutics. Biomed. Pharmacother.. 2020;131:110708
- [Google Scholar]
- New bisbibenzyl and phenanthrene derivatives fromDendrobium scabrilingueand their alpha-glucosidase inhibitory activity. Nat. Prod. Res.. 2020;34:1694-1701.
- [Google Scholar]
- Antidiabetic properties of an apple/kale extract in vitro, in situ, and in mice fed a western-type diet. J. Med. Food. 2017;20:846-854.
- [Google Scholar]
- The effect of 7,8,4 '-trihydroxyflavone on tyrosinase activity and conformation: Spectroscopy and docking studies. Luminescence. 2018;33:681-691.
- [Google Scholar]
- Cinnamic acid amides from Tribulus terrestris displaying uncompetitive alpha-glucosidase inhibition. Eur. J. Med. Chem.. 2016;114:201-208.
- [Google Scholar]
- Micromorphology of labellum in selected Dendrobium Sw. (Orchidaceae, Dendrobieae) Int. J. Mol. Sci.. 2022;23:9578.
- [Google Scholar]
- Comprehensive study of the adsorption of an acylhydrazone derivative by serum albumin: unclassical static quenching. Rsc Adv.. 2014;4:59686-59696.
- [Google Scholar]
- Pistagremic acid, a glucosidase inhibitor from Pistacia integerrima. Fitoterapia. 2012;83:1648-1652.
- [Google Scholar]
- The antioxidant activities, inhibitory effects, kinetics, and mechanisms of artocarpin and alpha-mangostin on alpha-glucosidase and alpha-amylase. Int. J. Biol. Macromol.. 2022;213:880-891.
- [Google Scholar]
- Inhibitory effect of morin on tyrosinase: Insights from spectroscopic and molecular docking studies. Food Chem.. 2014;163:226-233.
- [Google Scholar]
- Dendrobium as a new natural source of bioactive for the prevention and treatment of digestive tract diseases: A comprehensive review with future perspectives. Phytomedicine. 2023;114:154784
- [Google Scholar]
- Integrated multi-spectroscopic and molecular docking techniques to probe the interaction mechanism between maltase and 1-deoxynojirimycin, an alpha-glucosidase inhibitor. Int. J. Biol. Macromol.. 2018;114:1194-1202.
- [Google Scholar]
- Chemistry, bioactivity and quality control of Dendrobium, a commonly used tonic herb in traditional Chinese medicine. Phytochem. Rev.. 2013;12:341-367.
- [Google Scholar]
- beta cell dysfunction versus insulin resistance in the pathogenesis of type 2 diabetes in East Asians. Curr. Diabetes Rep.. 2015;15:36.
- [Google Scholar]
- Synergistic effects and antityrosinase mechanism of four plant polyphenols from Morus and Hulless Barley. Food Chem.. 2022;374:131716
- [Google Scholar]
- Resveratroloside alleviates postprandial hyperglycemia in diabetic mice by competitively inhibiting alpha-glucosidase. J. Agric. Food Chem.. 2019;67:2886-2893.
- [Google Scholar]
- Inhibition mechanism of ferulic acid against alpha-amylase and alpha-glucosidasee. Food Chem.. 2020;317:126346
- [Google Scholar]
- Simultaneous quantification of 11 phenolic compounds and consistency evaluation in four Dendrobium species used as ingredients of the Traditional Chinese Medicine Shihu. Front. Nutr.. 2021;8:771078
- [Google Scholar]
Appendix A
Supplementary material
Supplementary data to this article can be found online at https://doi.org/10.1016/j.arabjc.2024.105627.
Appendix A
Supplementary material
The following are the Supplementary data to this article:Supplementary data 1
Supplementary data 1


