

Translate this page into:
Development and characterization of a clay-HDTMABr composite for the removal of Cr(VI) from aqueous solutions with special emphasis on the electrochemical interface
⁎Corresponding author. aelgamouz@sharjah.ac.ae (Abdelaziz Elgamouz),
-
Received: ,
Accepted: ,
This article was originally published by Elsevier and was migrated to Scientific Scholar after the change of Publisher.
Peer review under responsibility of King Saud University.
Abstract
This research aims to study the removal of chromium in its toxic form, Cr (VI), from wastewater, using clay and modified clay with Hexadecyltrimethyl ammonium bromide (HDTMABr)as adsorbents. The modified clay is obtained by impregnating a known quantity of HDTMABr into the clay. The two materials were characterized by different techniques, such as X-ray diffraction, which is used to determine the inorganic composition and the phyllite structures it contains. Thermal analysis TGA isused to understand the thermal behavior as function of the sintering temperature. Nitrogen adsorption/desorption is used to get the pores' size and surface area, using the Brunauer-Emmett-Teller (BET) theory. Scanning electron microscopy (SEM) coupled with Energy Dispersive X-ray Spectroscopy (SEM/EDAX) is used to study the surface morphology of the bare clay and the HDTMABr/clay. The operating conditions, such as contact times, pH, and adsorption temperatures, were studied, and optimized to improve the efficiency of the adsorption process. The adsorption is favored in acidic medium and room temperature, giving adsorption capacities for Cr(VI) of 12 mg/g and 250 mg/g for the clay and clay/HDTMABr, respectively. The reaction kinetics were studied and found to fit a pseudo-second-order model. The standard entropy (ΔS°), enthalpy (ΔH°), and Gibbs free energy (ΔG°) changes indicate that the chromium (VI) adsorption process is a physical, spontaneous, endothermic process. Cyclic voltammetry (CV) and the electrochemical impedance spectroscopy (EIS) are used for the electrochemical characterization of the raw clay and clay/HDTMABr in [Fe(CN)6]3-/4-/ 0.1 M KCl solution. The linear scan anodic stripping voltammetry (LSASV) is used for the reduction the Cr(VI) to Cr(III), indicating that Cr(VI) accumulates better at the surface of clay/HDTMABr compared to the bare graphite and the raw clay.
Keywords
Clay mineral
Clay/HDTMABr composite
Heavy metals
Cyclic voltammetry
Electrochemical surface

1 Introduction
Water stress is a primary concern in the Mediterranean region, particularly in the southern and eastern Mediterranean countries. The uneven distribution of water is one of the major problems contributing to water poverty in the Mediterranean basin (Marsalek et al., 2014). An increase in the population, the aridity of the climate, and the installation of more and more factories in the proximity of the cities are additional factors that lead to water pollution. There have been efforts made in several research fields to examine the removal of specific contaminants like dyes and heavy metals (Bhattacharyya and Sen Gupta, 2006; Sun et al., 2015; Taylor et al., 2013). Many pollutants were found to be redirected to a stationary receiving environment, for example, polyphenols, heavy metals, etc. (Briffa et al., 2020). However, the huge quantities of toxic pollutants released to the sewage and dumped directly into the natural environment are still a threat to our ecosystem (Briffa et al., 2020; Bhattacharyya and Sen Gupta, 2006). Heavy metals are thought to impact the environment, life, and human health negatively (Sun et al., 2015). In Morocco for example, chromium (VI) is utilized in numerous industries, such as the production of dyes, inks, paints, metal coatings, tanneries, auto parts, and petroleum refining (Briffa et al., 2020; Taylor et al., 2013; Loulidi, et al., 2019). Hexa-valent chromium compounds are caustic and irritating to mucosal tissues. Work-related exposure to Cr(VI) is associated with high risk of nasal, sinus, lung, kidney, liver, and gastric cancers (Fraternali et al., 2014; Loulidi, et al., 2019). It is considered as a multi-sytem toxicant that can have adverse effect on the skin, gastroinetstinal track, resperatory system, cardiovascular, endocrine system, hepatic, renal, and reproductive system (Hessel et al., 2021). It was found to affect the endocrine system by playing the role of sex hormones, it enhances the infertility and increases the possibility of premature absorption in women working in occupational chromium industries (Banu et al., 2017).
Chromium compounds were also found to be toxic to bacteria, plant, and animals. Chromium could destabilize the marine ecosystem for instance. It was found to be cytotoxic to fish behavior leading to an increase in the oxidative stress and cell death of rat tissue. Prolonged exposure of mice to Cr(VI), was found to affect their liver function adversely (Yan, 2020). Intranasal instillation of potassium dichromate in rats was found to have an adverse effect on the brain and the lungs after 24 h (Salama et al., 2016). Oxidative strain inflammatory markers were escalated when high concentrations of Cr(VI) were used, however when pregnant rats were exposed to Cr(VI) administered through drinking water, chromium was found to concentrate in tissue of placenta leading to apoptosis cell death and therefore a breaking up of the placenta. Many other disorders in animals were associated with chromium exposure such as neurological diseases, reproductive system problems, kidneys, liver, genomic and epigenic disorders (Genchi et al., 2020). The mechanism of action of Cr(VI) is based on its ability to be reduced to Cr(III), DNA double strand is promoted during this process which promotes the inhibition of DNA transcription and duplication and increases cell death. On the basis of these facts, the World Health Organization (WHO) has classified Cr(VI) compounds as carcinogen and limited their presence in wastewater to a maximum contaminant level of 50 ppb (Briffa et al., 2020).
Heavy metals (HM) can be recovered and recycled from wastewater using the highly effective and affordable technique of adsorption (Kali, et al., 2022). Clays (Ouallal et al., 2019), sewage sludge, silica (Elgamouz and Tijani, 2018), and unprocessed and modified zeolite are just few of numerous standard and non-conventional adsorbents identified in the literature for the elimination of Cr(VI) (Elgamouz and Tijani, 2018; El-kordy et al., 2022). It is known that clayey soils use ion exchange properties and absorption to filtrate and purify water from various impurities (Daou et al., 2015; Ba Mohammed, 2021; Kali, 2022). Clays are made from very small particles (≤ 2 μm) with very high specific-surface, they are chemically and mechanically stable and possess a high cation exchange capacity (CEC) (Cao et al., 2023), among other properties, which make them one of the actual and great adsorbents (Khan and Khan, 1995). On the other hands, surfactants, have been widely employed as adsorbent materials for metal ions as standalone materials or as surface modifiers, they are used to improve particles dispersion, flocculation and surface properties of intercalated materials (Omer et al., 2022; Pietrelli et al., 2020). The combination of clays that are widely available with surfactants, can yield very cheap materials that are cost effective compared to high-cost adsorbents such as bentonite, zeolites and activated carbon.
HM can also be controlled in the environment by using various physicochemical techniques such as solvent extraction, ion exchange, chemical precipitation, and filtration (El-Kordy, 2022; Tahiri et al., 2021). Many studies developed simple techniques to explain the mechanism of the removal of HM by various materials, including size exclusion, repulsion, complexation, ion exchange, precipitation, and physical adsorption. The size, cationic exchange capacity, surface charge, have been widely assessed by using titrimetric methods, tetrameter, and adsorption desorption of nitrogen. The rejection mechanism of heavy metals at the surface of an adsorbent is one of the predominant mechanisms that have been widely used to explain rejection of heavy metals at the surface specifically when using membrane techniques. The mechanism is usually explained based on estimation of zeta potential from various pH values not based on the HM concentration, which give usually wrong assumptions.
Electrochemical techniques are very powerful methods, user-friendly, reliable, and suitable for many sensing applications. Recently, many studies have been reported for the detection of Cr(VI) ions using various electrochemical techniques due to their low cost, simplicity, rapidness, high sensitivity, and low detection limits compared to conventional methods (de Oliveira et al., 2022). Voltammetric techniques are rapid and reliable methods for electrode electrochemical characterization and to achieve efficient Cr(VI) detection via electrochemical reduction on the electrode surface (Watwe and Kulkarni, 2021). Electrochemical Impedance Spectroscopy (EIS) can be used to assess the electrode resistance and evaluate the effect of additives on charge transfer kinetics (de Oliveira et al., 2022). However, not much attention has been paid to the use of electrochemical techniques to study the mechanism of repulsion between the HM analyte and the adsorbent material. The removal of Cr(VI) using an adsorption approach on a natural clay sampled from the northern region of Morocco Nador, which has been altered by organic molecules is the main goal of this work (CTAB clay). Previous works have tended to focus on pure clays such as bentonite, montmorillonite and smectite intercalation by various organic molecules. These clays are usually purchased, and they are not cost effective which make the removal process not practical to scale up to industrial applications. In this study, we attempt to use a widely available clay which will reduce the cost of Cr(VI) removal from wastewater compared to pure clay modified materials. Various methods, including XRF, FTIR, XRD, TGA, and pHpzc, were used to distinguish between crude clay and the modified clay. A comparative study was performed to determine the performance of two adsorbents in retaining Cr(VI). Cyclic voltammetry and electrochemical impedance spectroscopy (EIS) were used to determine the electrochemical active surface area, resistance and charge transfer properties for the electrodes modified with clay and HDTMABr/clay as electroactive materials.The proposed techniques also helped in predicting the mechanism of accumulation of Cr(VI) at the surface of the clay, and HDTMABr/clay modified electrodes.
2 Materials and methods
2.1 Chemicals and reagents
The clay used in this study was collected from the northern region of Morocco Nador, Once dried in an oven at 60 °C, this material was crushed and then sieved on AFNOR standardized sieves (all the material passed through the 63 µm sieve), Hexadecyltrimethylammonium bromide (C16H33N(CH3)3Br, ≥ 97.0 %), potassium chloride (KCl, ACS reagent ≥ 99.0 %), Potassium hexacyanoferrate (II) trihydrate (K4Fe(CN)6·3H2O, Reagent Plus, ≥98.5 %), potassium ferricyanide(III) hydrate (K3[Fe(CN)6]), ACS, Reag. ≥ 99.0 %) graphite powder (20 mm, synthetic), and mineral oil were purchased from Sigma Aldrich. sodium hydroxide (NaOH, 99%), hydrochloric acid (HCl, 37%), Potassium Dichromate (K2Cr2O7, ACS, Reag. ≥ 99.0 %), Nitric acid (HNO3, 65%) are obtained from Somaprol Chemicals and Laboratory Reagent Ltd, Casablanca-Morocco. Millipore deionized water (resistivity = 17.2 MΩ.cm) is used in all experiments.
2.2 Preparation of adsorbents
The clay used in this study was sampled from the northern region of Morocco Nador. The clay is brought to the lab as large chunks, crushed to powder, and sieved using AFNOR standard sieves (Tahiri et al., 2021). A powder with a particle size Φ ≤ 250 μm was collected and intercalated with HDTMA-Br to get the Clay/HDTMABr. 10 g of clay was suspended in 200 mL of 0.1 M sodium chloride solution (NaCl) and stirred at 850 rpm for 24 h to obtain a slurry. This step allows the saturation of the interspace layer of the clay fraction with Na+ cation benefiting from the cationic exchange capacity of the clay fractions contained in the natural clay. Later, the slurry was centrifuged at 4500 rpm for 20 min and washed several times with deionized water until chloride ions were eliminated. The resulting material was dried for 2 h in the oven sat at 105 °C before being finely grind. To prepare the Clay/ HDTMABr material, 10 g of Na+-exchange clay was further treated with 200 mL of 10-2 M solution of HDTMA-Br in a beaker and stirred at 850 rpm for 24 h. The obtained material is centrifugated at 4500 rpm for 20 min and washed several times with deionized water until the bromide ions were completely eliminated. Chloride and bromide ions elimination was assured by testing the clay supernatant in both experiments with AgNO3, a clear solution after the addition of AgNO3 is indicative of the absence of Cl- and Br-. The solid is dried at room temperature and then stored for further use.
2.3 Adsorption tests
50 mg of the two materials (Clay and Clay/HDTMABr) were suspended with 20 mL of a solution of 10-4 mol /L of potassium dichromate (K2Cr2O7). Cr(VI) in the potassium dichromate solution is speciated into different oxyanions forms depending on the pH of the solution (Slimani et al., 2012). To make sure that chromium is kept at an oxidation state of + 6, the adsorption kinetic experiments are carried out at fixed pH < 5 for a specific period of time. The temperature was controlled using a water-circulating bath. After a specified adsorption time, the solid was separated from the liquid phase by filtration on a 0.45 µm syringe filter. A UV/visible spectrophotometer (Shimadzu UV-1240) is used for the analysis of Cr(VI) remaining in the solution. The sample is analyzed at a maximum wavelength of 350 nm (Sanchez-Hachair and Hofmann, 2018). Standardized solutions of 0.1 M NaOH and 0.1 M HCl were used to adjust the pH when studying the pH effect of the removal of Cr(VI) by clay and Clay/HDTMABr. The titration curve depicted in Fig. S1 (Supporting document) was used to calculate the concentration of chromium (VI) in the reaction mixture at time t (Ct). Eq. (1) was used to determine the adsorption capacity of chromium (VI) when studying the kinetic and isotherm models of the Cr(VI) removal from the solution (Dehmani, 2020).
In Eq. (1), Q represents the capacity of removal of Cr(VI) from the solution, Co, is the initial concentration in mol/L of Cr(VI) used, Ce, is the equilibrium concentration of Cr(VI) after the removal of chromium, and madsorbent, is the mass of clay and Clay/HDTMABr in gram used in the batch experiments.
2.4 Adsorption capacity
To examine the adsorption mechanism, pseudo-first-order, and pseudo-second-order kinetic models were used to test the dynamic experimental data (Messaoudi et al., 2021). The Lagergren equation expressing the pseudo-first order is given by Eq. (2).
In Eq. (2), K1 is the pseudo-first-order rate constant in min−1, Qe is the amount of Cr(VI) adsorbed at equilibrium in mg/g, and Qt is the amount of Cr(VI) adsorbed at a specific time t in mg/g.
If the adsorption reaction follows the pseudo-first-order law, the plot of Ln (Qe-Qt) versus time will give a straight line.
The pseudo-second-order equation is given by Eq.3 (Slimani et al., 2014).
In Eq. (3), k2 is the pseudo-second-order rate constant in g.mg−1.min−1. If the adsorption reaction follows a quadratic pseudo-law, then the plot as a function of t will give a straight line.
2.5 Adsorption isotherm
Cr(VI) removal data by crude clay is processed according to the linear equations of Langmuir and Freundlich described by Eq.4 and 5. The linear form of the Langmuir isotherm is given by Eq. (4) (Ba Mohammed, 2019), where Ce in mg/L is the equilibrium concentration, Qe in mg/g is the amount adsorbed at equilibrium, Qm in mg/g is the maximum amount adsorbed and KL in L/mg is the Langmuir constant. However, the linear form of the Freundlich isotherm is given by Eq. (5) (Armbruster and Austin, 1938), where KF and n are Freundlich constants.
2.6 Thermodynamic parameters
The thermodynamic parameters of the adsorption reactions, such as standard enthalpy (ΔH°), standard entropy (ΔS°), and standard Gibbs free energy (ΔG°), help gain information about heat evolvement as well as whether the reaction will happen or not. In Eq.6, is given the relationship between the standard Gibbs free energy and the adsorption constant Kd (Kali, et al., 2022):
The standard enthalpy (ΔH°) and entropy (ΔSo) changes can be obtained from the slope and coordinates at the origin of the Van't Hoff Eqs. (7) and (8), by plotting ln(Kd) as a function of the absolute temperature T (Kali, 2022).
In the Eqs. (7) and (8), Kd is the adsorption distribution coefficient , R is the universal ideal gas constant, T is the absolute temperature in Kelvin (K), qe is the adsorbed amount of Cr (VI), and Ce is the residual concentration of Cr (VI) after adsorption of Cr(VI) on the clay material.
2.7 Characterization techniques
Both solids clay and HDTMABr/clay were characterized using various analytical techniques prior to their utilization as adsorbents for Cr(VI). X-ray fluorescence spectrometry is utilized to determine the elemental chemical composition of the raw clay. This analysis was carried out with an AXION X-ray fluorescence spectrometer. X-ray diffraction analysis is used in order to identify the crystalline phases, and it was performed using an XPert PRO MPD diffractometer employing CuKα radiation (Kα1 = 1.5418 Å), Fourier-transform infrared spectra (FTIR) was collected using the attenuated total reflectance (ATR) from 400 to 4000 cm−1 on a Shimadzu, JASCO 4100 FTIR spectrometer. Thermal analysis is performed using NETZSCH STA 449 F5 Jupiter operating in TGA mode under air at a linear static mode from room temperature of 25 °C to a final temperature of 800 °C with a heating rate of 10 °C/min. Nitrogen adsorption/desorption measurements were obtained using Micromeritics ASAP 2010 to get textural parameters (surface area, volume of the pores, and pores’ sizes) (Elgamouz et al., 2019). The surface morphology of the samples was performed using a Topcon EM200B scanning electron microscope (SEM), equipped with an energy-dispersive X-ray analysis (EDX) (Dehmani, 2020). The point of zero charge (pHpzc) for the raw clay and the HDTMABr/clay was carried out according to the method used in previous studies (Messaoudi, 2021; El-Kordy, 2022). Briefly, 1.0 g of raw clay was suspended in 100 mL of 0.5 M NaCl overnight, later, 0.5 mL of 0.5 M HCl is added to the solution. After that, the mixture was titrated with 0.2 M NaOH solution, 50 μL of NaOH aliquots were added at each step, and the pH was recorded using a pH meter-type Hanna instrument. This protocol is done for the blank as well as the solution containing the clay mineral. The point of zero charge is where the pH of the blank titration curve and the solid coincide.
2.8 Electrochemical tests
Clay and the HDTMABr/clay were used to prepare carbon paste electrodes (CPEs) at different %wt modifications. Graphite was mixed with clay or HDTMABr/clay, and mineral oil was used as a binder with a fixed amount of 30 wt% in all electrodes. The electrodes compositions are listed in detail in Table 1. To ensure homogeneous and uniform mixing, the paste was mixed for 10–15 min using a glass rod. The paste was then loaded into the sensing part of a 3D printed working electrode body with dimensions identical to those of the commercial glassy carbon electrode (7.0 cm long, 2.0 mm diameter) using a copper wire for electric contact. All electrochemical measurements were conducted using Zahner Zennium Pro electrochemical workstation in a 3-electrode system comprising unmodified and modified CPEs as the working electrodes, a Pt wire as the counter electrode, and an Ag/AgCl (1.0 M KCl) as reference electrode (Jaber et al., 2022). The working electrodes were electrochemically characterized in [Fe(CN)6]3-/4-/0.1 M KCl solution using CV in the potential range of −0.25 - +0.75 V at different scan rates ranging from 5.0 to 200 mV/s and EIS at open circuit potential over the frequency range of 106-0.05 Hz. Cr(VI) reduction tests were carried out using linear sweep voltammetry (LSV) between −0.6 V and 1.2 V at a scan rate of 100 mV/s and accumulation potential of −1.2 V and accumulation time of 60 s.
Clay electrodes
HDTMABr/Clay electrodes
Graphite (wt.%)
Clay or HDTMABr/Clay (wt.%)
Mineral oil (wt.%)
CPE/0wt.%clay
CPE/0% HDTMABr/Clay
70
0
30
CPE/10wt.%clay
CPE/10% HDTMABr/Clay
60
10
30
CPE/20wt.%clay
CPE/20% HDTMABr/Clay
50
20
30
CPE/30wt.%clay
CPE/30% HDTMABr/Clay
40
30
30
CPE/40wt.%clay
CPE/40% HDTMABr/Clay
30
40
30
CPE/50wt.%clay
CPE/50% HDTMABr/Clay
20
50
30
3 Results and discussion section
3.1 Characterization of the raw material
3.1.1 X-ray fluorescence analysis
The X-ray fluorescence data in Table 2 shows that the crude clay is mostly made from silicon oxide (72.2 wt%), confirming the high concentration of quartz suggested by the XRD diffraction plots. Additionally, this clay has a moderate level of alumina (15.8 wt%), indicating that there are not many clay minerals in it. The molar ratio exceeds the traditional value of bentonite, which is 2.7 wt%, indicating that this clay contains a significant amount of free quartz. Since other oxides make up 12 wt% of the mixture, the clay cannot be considered pure. The existence of smectite traces explains the MgO content of 0.1 wt%. A mass loss of around 2.93 wt% was caused by the loss of ignition (LOI). This can be explained by removing organic matter, dehydration of clay, and hydroxylation of clay minerals (Jiang, et al., 2019).
(%)
SiO2
Al2O3
CaO
MgO
Fe2O3
K2O
Na2O
TiO2
Cr2O3
Mn2O3
ZnO
SrO
LOI
Clay
72.2
15.8
0.0
0.10
0.93
5.84
0.99
0.04
0.01
0.04
0.01
0.02
2.93
3.1.2 X-ray diffraction
The diffraction of raw clay and clay sintered to 550 °C are shown in Fig. 1. The diffraction pattern (Fig. 1a) indicates that the crude clay is mainly composed of quartz (Q), evident with a high peak intensity positioned at 26.7° and low peaks’ intensities at 20.71, 27.4, 45.4, and 50.2°, and kaolinite (K), which exhibits its characteristic lines around 12.2° and 25.4°, illite (I), which appears around 8.8°, and smectite, which was detected at 17.8°. However, (Fig. 1b) showing the sintered clay to 550 °C revealing the disappearance of the kaolinite and a decrease in the intensity of the main quartz peak at 26.7° (Zhang, 2021). Kaolinitic clays have been widely reported in many studies, they show similar diffraction spectrums, in a pervious study we have identified a triclinic kaolinite by diffraction peaks attributed to reticular planes (0 0 1), (0 2 0), (0 0 2) and (0 0 3) with respective d-spacings of 7.17 Å, 4.47 Å, 3.57 Å, and 2.38 Å, (Lahnafi et al., 2021).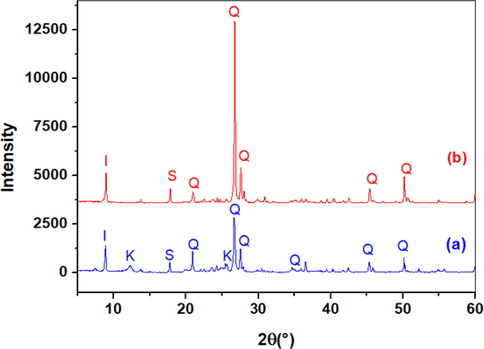
X-ray diffractogram of raw clay (a) and clay sintered to 550 °C (b). I: illite, K: kaolinite, Q: quartz, S: smectite.
3.1.3 Nitrogen (N2) adsorption/ desorption
The N2 adsorption/desorption technique based on the Brunauer–Emmett–Teller theory (BET) allows the determination of the specific surface area, pores’ volume, and pores’ diameter (Selim et al., 2017; Yenial et al., 2020). The clay materials were degassed overnight at T = 100 °C, then nitrogen adsorption isotherms were recorded at 77 K. Fig. 2 shows the adsorption–desorption isotherm curves of the raw clay and the HDTMABr/clay materials.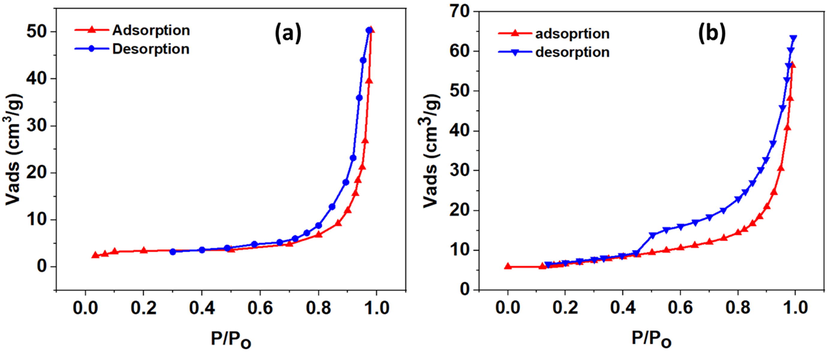
N2 adsorption/desorption isotherms of (a) raw clay and (b) HDTMABr/clay.
The porous clay isotherms are type IV, often known as H3 hysteresis-type characteristics for porous solids. The above results show a decrease in the BET specific surface area when the clay is modified by HDTMA-Br faced with an increase in the average pore diameter. It was due to the obstruction of mesopores by HDTMA+ cations, thus, impeding the diffusion of N2 throughout its channels. The parameters characterizing the texture of the raw clay and HDTMABr/clay obtained from the adsorption/desorption of N2 are summarized in Table 3.
Samples
Area (m2/g)
Volume (cm3/g)
Pore diameter (Å)
Clay
4.21
7.94 × 10⁻³
92.60
Clay/HDTMABr
2.04
2.70 × 10⁻²
170.03
The pore size, pore volumes and specific surface area are parameters that could be used to explain the mechanism of heavy metals removal using aluminosilicates in general and clays particularly. For instance, Selim et al. (Selim et al., 2017), demonstrated that a zeolite A material performed well in the removal of Cd2+ through a precipitation and ion exchange mechanisms due to its specific surface area of 374 m2/g, a total pore volume of 0.205 cm3/g and pore size of 1.08 nm.
3.1.4 Thermogravimetric (TGA) analysis
Fig. 3a shows the thermogravimetric analysis (TGA) of raw clay, and Fig. 3b gives the TGA of the HDTMABr/clay modified. The analysis is used to identify the temperature regimes at which large mass losses and possible phase transformations that are taking place while heating the materials. The first mass loss of 1.0 wt% and 3.0 wt% for clay and clay-HDTMABr, respectively, occurring between 25° and 300 °C, corresponding to the evaporation of interstitial water inserted between the plates or into the cavities of the crystal structure of the clay material as well as adsorbed waters on the surface or as moisture. The second important mass loss of approximately 2.3 wt% for the natural clay occurring between 300 and 500 °C are associated with the exit of structural water caused by the release of hydroxyl belonging to the crystal lattices of clay minerals such as illite and kaolinite. While clay-HDTMABr shows a second mass loss of 1.0 wt% between 250 and 350 °C, which could be attributed to the HDTMA+ degradation, Nunes et al. reported degradation of the same reagent at temperatures between 473 and 573 K (200–300 °C) (Nunes et al., 2020). Between 488 and 700 °C, the natural clay shows mass loss of 0.4 wt% which could be attributed to hydroxyl loss due to the transformation of kaolinite to metakaolinite and α-quartz to β-quartz for clay and clay modified (El-Kordy, 2022). The TGA of clay-HDTMABr shows a late mass loss of 2.0 wt%, between 365 and 590 °C, which could be attributed to continuous degradation of the HDTMA+, surfactant which is strongly bounded to the clay mineral surface, and this may be due to the electrostatic binding between the ammonium head and corresponding negative sites of interaction on the clay. Similar results were demonstrated by Aghaii et al. (Aghaii et al., 2013), where they demonstrated that a HDTMABr modified zeolite presented two main mass loss stages the first one below 200 °C attributed to unbound and physisorb water on the zeolite surface and a second stage at higher temperatures attributed to strong bounding of the surfactant on the zeolite surface.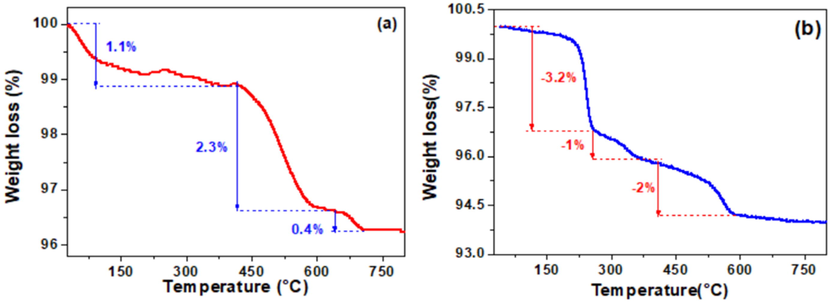
Thermogravimetric analysis (TGA) of (a) raw clay and (b) HDTMABr/clay.
3.1.5 FTIR analysis
The study of clays by infrared spectroscopy aims to determine different chemical functional groups present on the surface of these solids. This is a complementary method that often focuses on the molecular analysis of samples. Fig. 5a shows the infrared spectra of the crude clay, and Fig. 5b that of the HDTMABr-modified clay. In Fig. 5a, several bands are observed. The Si-OH, Al-OH, and Mg-OH, OH groups in the clay fractions, as well as the adsorbed water, are responsible for the two broad bands that occur at 3706 cm−1 and 3433 cm−1, respectively. A weak absorption band is detected at 1634 cm−1 and is attributed to the bending of the structural water molecule of the clay mineral. The bands appearing at 540 cm−1 and 1031 cm−1 are attributed to the stretching vibrations of Si-O and Si-O-Si, respectively. Si-O bending vibrations and Si-OH stretching vibrations, respectively, are responsible for the vibration bands that emerge at 472 cm−1 and 782 cm−1. The band at 690 cm−1 is due to the stretching vibration of the Si-O-Al bond of the kaolin (Lynch et al., 2018).
Fig. 4b, represents the FTIR of the clay-HDTMABr. The FTIR spectrum contains all bands recorded in the raw clay, including those appearing at 3706 cm−1 and 3433 cm−1, which were attributed to the stretching vibration of the OH group in the clay fraction (Si—OH, Al—OH, and Mg—OH) and adsorbed water, respectively. The bands detected at 472 cm−1, and 1031 cm−1 are attributed to the stretching vibrations of Si—O and Si—O—Si, respectively. Additionally, it should be highlighted that treating the clay with HDTMA-Br resulted in two new absorption bands at 2850 cm−1 and 2920 cm−1, which are attributed to the symmetric and asymmetric stretching vibrations of the CH2 and CH3 groups, respectively. These bands also have another vibration mode detected at 1472 cm−1, corresponding to a bending mode. This could be used as evidence of the exchange between Na+ and HDTMA+, and, therefore, the intercalation of the clay by HDTMA-Br. Displacement of vibrations could also be assessed during the modification of the clay with HDTMA-Br. Slimani et al. (Slimani et al., 2012) attributed these displacement to exchange reactions occurring in the interlayer space of sodium modified bentonite, it was suggested that the interlayer water coordinating the Na+ cation is been lost during the replacement of Na+ by the HDTMA+ cation.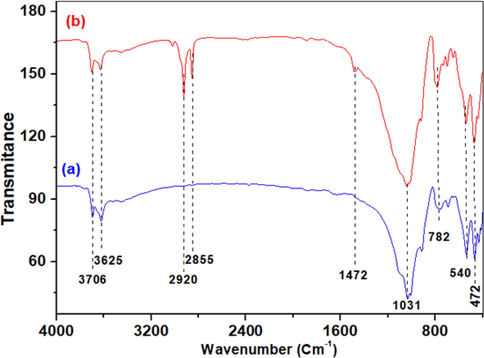
FTIR spectra of raw clay (a) and Clay/HDTMABr (b).
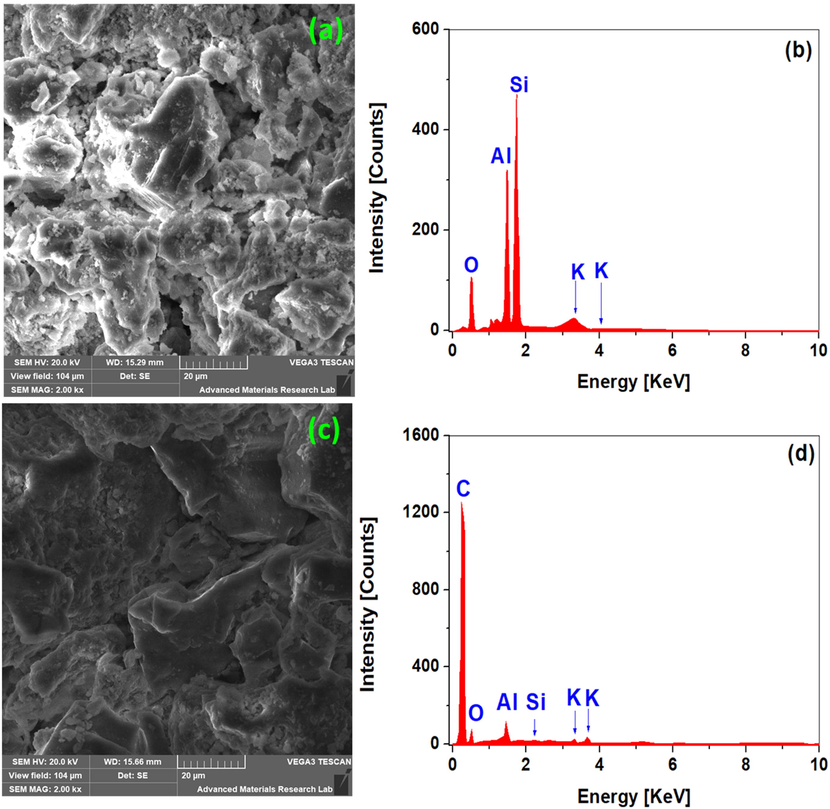
Micrographs and corresponding elemental analysis of raw clay (a, b) and HDTMABr/clay (c, d) using SEM coupled with EDAX.
3.1.6 Scanning electron microscopy coupled to energy disperse spectroscopy (SEM-EDX)
The morphology of the clay was examined by scanning electron microscopy (SEM) before and after HDTMABr intercalation. The SEM micrograph in Fig. 5a shows clay powder particles with no defined shape. Furthermore, no agglomeration could be seen in the clay powder. The surface is homogenous, with the occurrence of small platelets indicating the crystallinity of the clay mineral. The peak intensity of silicon, aluminum, and calcium oxides (SiO2 and Al2O3), which appear to be quite high in the clays according to XRD, are relatively low in the EDAX analysis (Fig. 5b), however still show that they are the main components of the clay. These observations are fully confirmed and supported by the elemental composition of the clay using XRF. Furthermore, it is important to note from the EDAX spectra that the elemental chemical composition of the clay is dominated by the elements Si, Al, Ca, and Fe. Dehmani et al. found that Si, Al, Fe and K were the predominant elements contained in a clay sampled from the Errachidia region (Dehmani, 2020).
In Fig. 5c, the two solids can be clearly distinguished from one another, the clay's porous structure could be clearly seen with small particles inside the pores. This is due to the intercalation of the clay by the HDTMA-Br surfactant and its adsorption on the outer surface of the clay. The intercalation of the clay by the surfactant is also demonstrated by EDAX analysis presented in Fig. 5d, which shows the appearance of a new carbon peak, originating from the HDTMABr surfactant, with high intensity. However, the percentage of Al and Si, decreases because of the elemental redistribution in the new HDTMA-Br/ clay material.
3.1.7 Point of zero charge
The point of zero charge (pHpzc) is an important parameter that can be used to explain the adsorption, as it gives information about the surface charge of the adsorbent. Fig. 6, shows the evolution of the pH as a function of the volume of NaOH added to the clay suspension and the blank solution. The point of intersection of the two curves corresponds to pHpzc. The intersection point was found at pH = 9.5, which indicates that below pHpzc = 9.5, the surface of the clay is positively charged, while at higher pH above the pHpzc = 9.5 the surface of the clay will be negatively charged. This would help in the explanation of the mechanism of adsorption of Cr(VI) at the surface of the adsorbent. For example, we demonstrated in a previous study that the pHpzc = 9.8 for a zeolite membrane, which was found to control the rejection of heavy metals at the surface of the zeolite membrane. Filtrations were carried out at pH ≤ pHpzc, the surface of the zeolite membrane was positively charged which played a high role in the rejection of heavy metals by repulsion effect, since these are positively charged also (Lahnafi et al., 2021).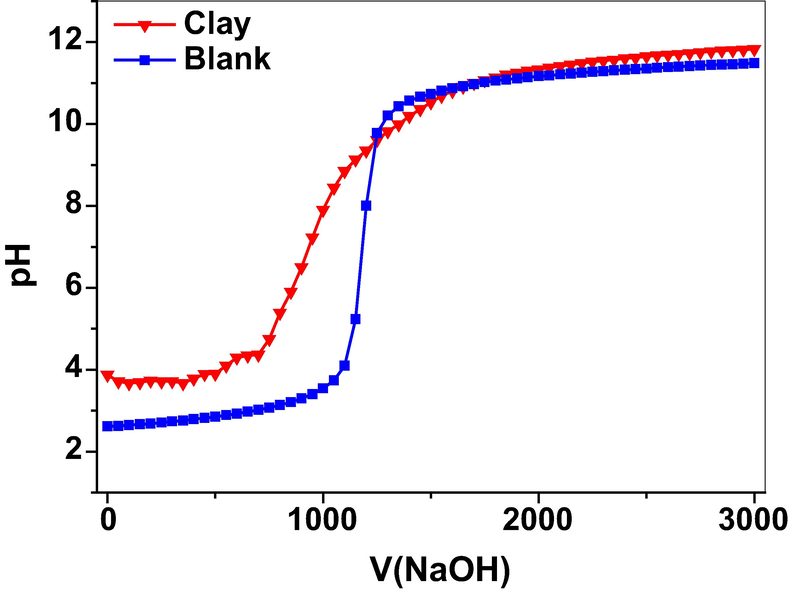
Surface charge curves of the clay suspension and blank at an ionic strength of 0.001 M NaCl.
3.2 Adsorption studies
3.2.1 Influence of pH on the adsorption of Cr(VI) at the surface of clay and HDTMABr/Clay
To evaluate the influence of pH on the adsorption of Cr(VI) on the raw and HDTMABr-modified clay, we have conducted a series of experiments using Cr(VI) solutions of 10-4 M concentration which were placed in contact with the raw clay and HDTMABr modified clay at different pH values. Fig. 7 represents the results obtained. At pH = 1.0, the predominant form of chromium is
constituting almost 80% of the chromium speciation,
is present with 12% and
with 8% (Trifi, 2013), it is expected that the surface of the clay and HDTMABr-modified clay will be highly charged positively at this pH. This will help
and
to be adsorbed perfectly compared to the chromic acid (
) and explain the highest capacity of both materials at lower pHs. On the further increase of the pH to values above pH = 4, the number of positive charges of the clay and HDTMABr modified start declining. However, still charged positively since the pH was below the pHpzc = 9.5. At these pHs, the percentage of speciation predominance changes,
speciation predominance increases to 92%, and the
remain constant, while the chromic acid disappear completely. The reduction of positive surface charge is much higher than
speciation increase, this has a direct effect on the decrease in the adsorption capacity of both materials, the raw clay and HDTMABr-modified clay. The highest capacity of HDTMABr-modified clay however, could be explained by the additional positive sites provided by the ammonium group.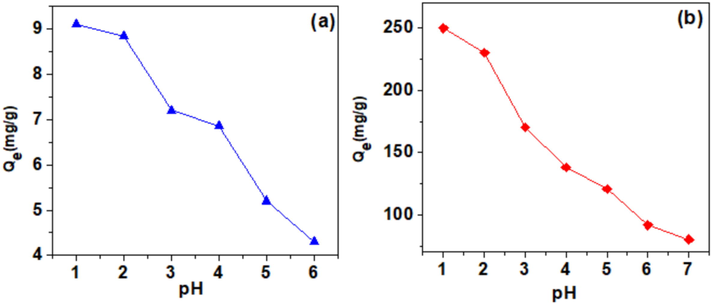
pH effect on Cr(VI) removal capacity of the raw clay (a) and HDTMABr modified clay (b) at different pH values. Experimental conditions: C0 = 10-4 M, m = 50 mg, V = 20 mL, T = 25 °C, pH = Variable, t = 120 min.
3.2.2 Influence of the contact time on the adsorption of Cr(VI) at the surface of clay and HDTMABr/Clay
To study the effect of contact time on the adsorption of Cr(VI) ions on the raw and HDTMABr/clay, we have used the batch experiment technique. In 9 test tubes, 50 mg of clay or HDTMABr/clay was introduced in each test tube, then 20 mL of Cr(VI) with 10-4 M initial concentration and at pH = 2, since the highest capacities of removal are obtained at this pH. Test tubes were rota-mixed and kept for different timing ranging from 60 min to 580 min. Cr(VI) ion elimination by raw clay and clay-HDTMABr as a function of time are depicted in Fig. 8a and b, respectively. Fig. 8a shows that the adsorption of Cr(VI) ions increases linearly in the beginning, which is explained by the high affinity of the active sites to retain Cr(VI). Still, after 360 min, the sites are saturated and have reached equilibrium. The removal rate is about 9.2 mg/g. For Fig. 8b, we also observe a gradual increase until the equilibrium time of 380 min, which is consistent with active sites in the (clay-HDTMABr). The removal capacity of chromium (VI) by this organoclay is found to be 250 mg/g which is 25 folds higher than previously reported montmorillonite HDTMABr modified clay (Akar et al., 2009).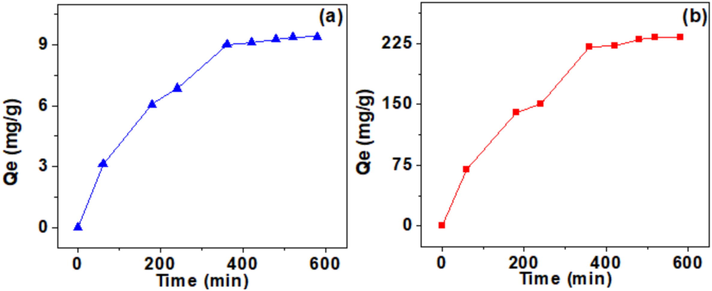
effect of contact time on the Cr(VI) removal capacity using raw clay (a) and using HDTMABr/clay (b). Experimental conditions: C0 = 10-4 M, V = 20 mL, T = 25 °C, pH = 2, m = 50 mg, t = Variable.
3.2.3 Influence of the temperature on the adsorption of Cr(VI) on the surface of clay
Fig. 9a presents the adsorption of chromium (VI) by clay as a function of temperature. At room temperature of 25 °C, the adsorption capacity is quite low (9.30 mg/g). Increasing the temperature leads to a linear increase in the capacity with a stiff slope of 0.55 and a regression coefficient R2 of 0.994 to a final value of 37.0 mg/g at 75 °C. The behavior of the material at high temperatures above 25 °C could be explained by the increase of the speed of movement of Cr(VI) speciated ions towards the surface of the adsorbent. The process could be classified as an endothermic possess. Slimani et al. found that the standard Gibbs free energy (ΔG°) is decreasing while increasing the temperature, which indicated that adsorption is much efficient at higher temperature (Slimani et al., 2014).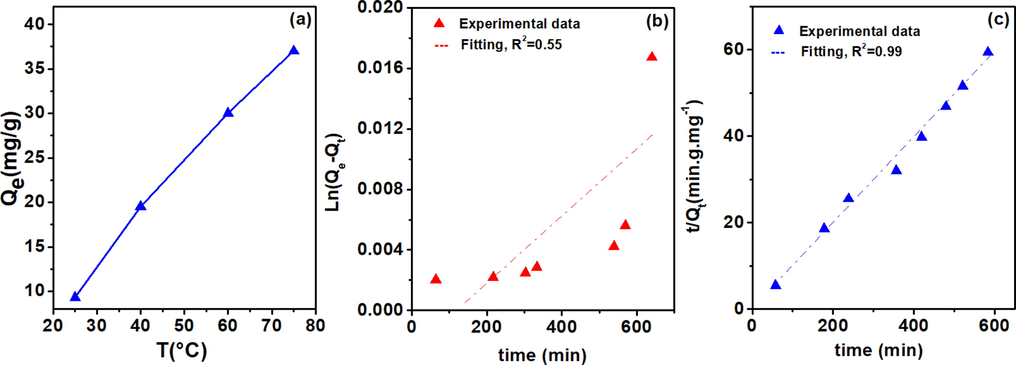
Influence of temperature on the capacity of Cr(VI) removal with raw clay (a), modeling of adsorption kinetics (b) pseudo-first-order and (c) pseudo-second-order. Experimental conditions: C0 = 10-4 M, V = 20 mL, T = Variable, pH = 2, m = 50 mg, t = 120 min.
3.2.4 Adsorption kinetics
To study the adsorption kinetics of raw clay, pseudo first- and second-order kinetic models were used, while the Langmuir equation was used to determine the rate constants K1, the equilibrium adsorption capacity (Qe), and the correlation coefficients (R1) of the lines obtained by plotting ln (Qe - Qt) as a function of times (Fig. 9a). In the same circumstance, we have also tested the pseudo-second-order kinetic model by plotting t/Qt as a function of time (Fig. 9b). When using the pseudo-first-order kinetics model, it is found that the amount adsorbed at equilibrium determined experimentally (Qexp = 9.2 mg/g), differs from that calculated theoretically (Qth = 3 mg/g). The correlation coefficient between the two data is also found to be very low (R2 = 0.55). Therefore, the pseudo-first-order kinetic model was considered non-suitable to model the kinetics of the reaction of adsorption of Cr(VI) on the raw clay material. However, the pseudo-second-order model (Fig. 9c) shows that an equilibrium adsorption capacity, Qexp of 9.2 mg/g is found to be closer to a theoretically calculated, Qcalc of 12.8 mg/g, with a correlation coefficient R2 = 0.99. Therefore, it is concluded that the pseudo-second-order model is more suitable and is the one that best describes the Cr(VI) adsorption process on the studied clay. Table 4 compares the experimental and theoretical results of Cr(VI) adsorption on the raw clay. In this study, we presented only the experimental results of Cr(VI) adsorption processes on clay. Similar results were reported for the removal Cr(VI) on a bentonite modified clay, which shows that the process was very fast and following pseudo second order reaction with similar capacity of 251.7 mg/g (Slimani et al., 2014).
Reaction order
Parameter
Value
Pseudo first order
T
30 °C
Co
1.0 × 10⁻⁴ M
Qt
9.2 mg/g
K1
0.0026 min−1
Qe
3 mg/g
R2
0.55
Pseudo second order
K2
4.13 × 10⁻⁴ g.mg−1.min−1
Qe
12.82 mg/g
R2
0.99
3.2.5 Thermodynamic study
Thermodynamic parameters compared to kinetic give very precise information about the physical process of Cr(VI) adsorption on the clay. Estimation of the standard Gibbs free energy (ΔG°), standard enthalpy (ΔH°), and standard entropy (ΔS°) from Van't Hoff equation is not always valid because the temperature is not constant. However, general guidance about the process could be gained, such as whether the process is binding (enthalpy) or diffusion (entropy) controlled. The values of ΔH° and ΔS° are obtained from the slope and intercept of the linear plot of ln Kd versus 1/T, as shown by Eqs. (6) and (8) (Kali, 2022). Kd, is the thermodynamic stability constant that measures the strength of adsorption of Cr(VI) on the raw clay and is determined from the pseudo-second-order kinetic model described previously. Fig. 10 shows the linear plotting of the Van't Hoff equation, which gave a straight line with ΔH°/R as the slope and ΔS°/R as the intercept. However, ΔG° is determined from ΔG° = ΔH° -TΔS°.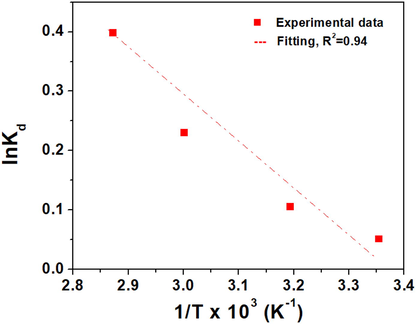
Variation of Ln (K) as a function of 1/T. Experimental conditions: C0 = 10-4 M, V = 20 mL, T = Variable, pH = 2, m = 50 mg, t = 120 min.
The adsorption process is spontaneous for the investigated temperatures, as evidenced by the negative value of the standard Gibbs free energies (Table 5). It may be claimed that the Cr(VI) adsorption process is endothermic, spontaneous and functions as physisorption since the standard Gibbs free energy is negative and smaller than 40 KJ/mol. Also, the process is entropically controlled since the term TΔS° is the predominant term at high temperatures. The positive value of the entropy shows that adsorption is accompanied by an increase in the disorder, which shows that Cr(VI) ions near the solid/liquid interface are less structured than those in the bulk of the solution. We have demonstrated previously that is not right to use Van't Hoff equation to estimate the thermodynamic parameters because this equation work on the assumption that the temperature is constant, however still the equation can give information about the spontaneity of the process, the sign of internal energy as well as whether the process is enthalpically or entropically controlled (Elgamouz, 2020).
Adsorbent
T(K)
ΔG°
(KJ.mol−1)
ΔS°
(J.mol−1.K−1)
ΔH°
(KJ.mol−1)
R2
Clay
298.15
−0.126
19.80
5.85
0.94
313.15
−0.274
333.15
−0.636
348.15
−1.152
3.2.6 Electrochemical testing
CV was used to evaluate the electrochemical properties of the unmodified and modified CPEs. An equimolar (5.0 mM) solution of K4[Fe(CN)6]/K3[Fe(CN)6] was used due to the efficiency and reversibility of Fe2+/Fe3+ redox species, and 0.1 M KCl was used as the supporting electrolyte. The analysis was carried out at a potential range of −0.25–0.75 V and a scan rate of 100 mV/s. The reduction and oxidation peaks of the Fe2+/Fe3+ redox species were observed at ∼ 0.1 V and ∼ 0.3 V, respectively (Fig. 11a-b). Unmodified CPE showed an anodic peak current of 47.7 μA, which was increased upon 10 wt% clay modification to 55.4, reached a maximum of 56.2 μA at 20 wt% clay modification, and then decreased significantly to ∼ 51.0 μA at higher clay content. Clay-HDTMABr showed a similar trend with a maximum peak current of 99.3 μA at 40 wt% modification. A voltage overpotential was observed at > 40 wt% and > 20 wt% of clay and clay-HDTMABr modification, respectively. The increasing in peak current with CPE modification using both clays and Clay-HDTMABr demonstrated the high electrochemical activity of both additives, and the higher current achieved by clay-HDTMABr indicated its higher electrocatalytic effect. The different concentrations of both additives at which the maximum peak current was achieved could be attributed to the surface change upon HDTMABr incorporation. The decreasing current and overpotential observed at high additive content could be explained by the increasing of electrode resistance due to the insulative nature of the additives, which stifled charge transfer at high concentrations.![CV and Nyquist plots of (a, c) CPE-clay with different clay content and (b, d) CPE-clay-HDTMABr with different clay-HDTMABr contents in 5.0 mM [Fe(CN)6]3-/4- prepared in 0.1 M KCl at a scan rate of 100 mV/s for CV scans and EIS at the frequency range of 106-0.05 Hz.](/content/184/2023/16/8/img/10.1016_j.arabjc.2023.105027-fig11.png)
CV and Nyquist plots of (a, c) CPE-clay with different clay content and (b, d) CPE-clay-HDTMABr with different clay-HDTMABr contents in 5.0 mM [Fe(CN)6]3-/4- prepared in 0.1 M KCl at a scan rate of 100 mV/s for CV scans and EIS at the frequency range of 106-0.05 Hz.
The electroactive surface area of CPEs modified with different loads (CPE-wt%clay) of clay or Clay-HDTMABr (CPE-wt%Clay-HDTMABr) was calculated by applying the Randles-Sevcik Eq (9), where C is the concentration of the analyte (5.0 mM), n is the number of electrons (1e-) that contribute to the redox reaction on the CPE-Clay, and CPE/Clay-HDTMABr modified electrodes, A is the electroactive surface area of the electrodes (cm2), D is the diffusion coefficient (cm2.s−1), and γ is the scan rate (Vs−1). With the aid of the CVs of CPE-%clay and CPE-%Clay-HDTMABr presented in Figs. S2-S12 (Supporting document). The electroactive surface areas were calculated and represented in Fig. 12a. The surface area of the CPE-wt%Clay electrodes and CPE-wt%Clay-HDTMABr were found to increase linearly with the increase of the modifier percentage. The maximum surface areas were presented by 20 wt% and 30 wt% for clay and Clay-HDTMABr, respectively. On the further increase of the percentages of load, the surface area for both materials declines dramatically. This decrease can be explained by the brittleness of the prepared paste due to the fact that the electrode releases imperfections in the solution of K4[Fe(CN)6]/K3[Fe(CN)6].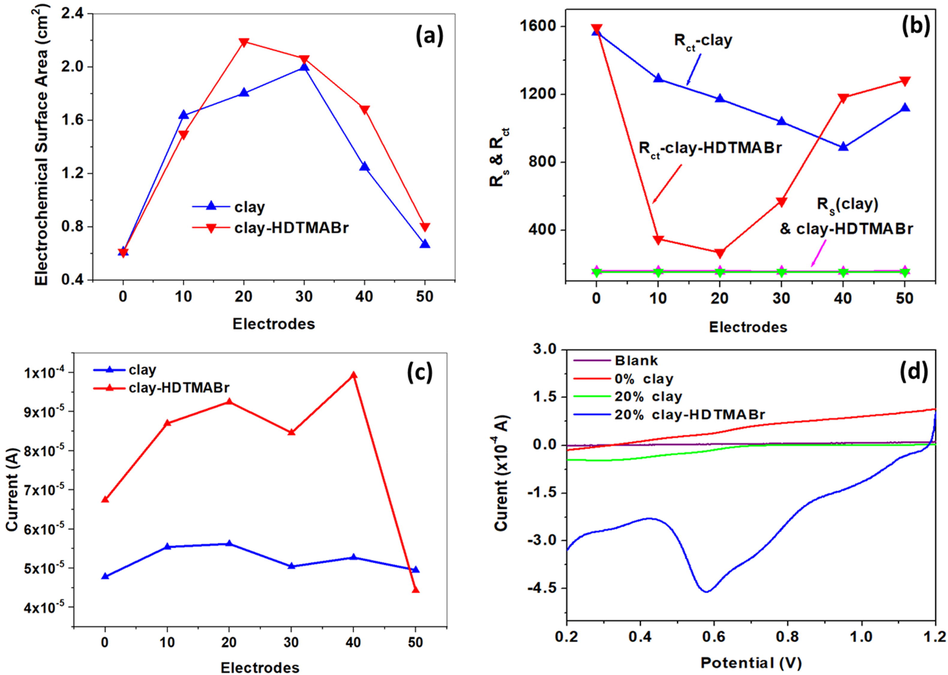
Change of (a) electrochemical surface area, (b) Rs and Rct, and (c) anodic peak current of CPE-modified electrodes with clay and clay-HDTMABr additives. (d) LSV of 500 µM Cr(VI) in 5.0 M HNO3 (pH = 0.5) using unmodified and modified CPEs at 100 mV/s and the accumulation condition used −1.2 V for 60 s.
EIS was done to investigate the electrode resistance and study the influence of clay and clay-HDTMABr on the charge transfer efficiency (Fig. 11 c-d). The Nyquist plots were fitted using Randle’s circuit (Rs [Cdl-Rct-W]), where Rs is the solution resistance corresponding to the intersection with the real-impedance axis in the high-frequency region, Cdl is the double-layer capacitance, Rct is the charge-transfer resistance corresponding to the semi-circle in the high-to-medium frequency region, and W is Warburg diffusion in the low-frequency region corresponding to the ionic diffusion process. The unmodified CPE showed Rs and Rct of 151 Ω and 1598 Ω, respectively (Fig. 12b). Upon CPE modification with clay, Rs showed only minor change, while Rct decreased significantly with the increase in clay content reaching a minimum of 887.7 Ω at 40 wt% clay and then increased thereafter. Clay-HDTMABr showed a similar trend (Fig. 12b), however, with an enhanced sensitivity, where a drastic decrease in Rct took place at 10 wt% modification reaching a low value of 349.1 Ω, and decreased further to 269.9 Ω at 20 wt%, and then started to increase thereafter. The decrease in Rct with clay and clay-HDTMABr modification indicated enhanced electrode charge transfer kinetics, which could be attributed to the electrocatalytic effect of the oxides abundant in the clay. The significantly reduced Rct in the case of clay-HDTMABr showed that HDTMABr further facilitated charge transfer. The increase in Rct at high clay and modified clay concentrations could be due to their insulative nature that started to dominate the electrode as their ratio to graphite became too high. This corroborated the lower peak currents and overpotential observed in the abovementioned CV study. Based on the data above, 20 wt% modification was chosen as the optimal additive content, considering the high current achieved, low over potential, and low Rct.
LSV was used for Cr(VI) detection by electrochemical reduction on the surfaces of modified CPEs with various additives percent, 20 wt% additive was found to yield the highest peaks for both materials clay and clay-HDTMABr (Fig. 12c). CPE-0wt%clay, CPE-20wt% clay, and CPE-20wt%clay-HDTMABr, were therefore, tested to explain the mechanism of accumulation of Cr(VI) at the interface between the clay or the clay-HDTMABr and the solution. 500 µM Cr(VI) prepared in 5.0 M HNO3 (pH = 0.5) was used at a scan rate of 100 mV/s (Fig. 12d). A high Cr(IV) reduction peak was observed at 0.57 V in the case of CPE-20wt%clay-HDTMABr with a large peak current of 456 µA, which was 60% higher than that obtained using CPE-20wt%clay. Unmodified CPE only showed a minor peak with a very low peak current of 100 µA. The high peak current shown by the modified CPEs showed the significant electrocatalytic activity of clay and clay-HDTMABr, and the 60% peak current increase in the case of CPE-20wt%clay-HDTMABr, as compared to CPE-20wt%clay, indicated enhanced electrochemical activity upon HDTMABr incorporation within the clay. The high sensitivity of the modified electrodes towards Cr(IV) reduction could be explained by an anion exchange process involving the dominant Cr(IV) anion at pH = 0.5, (Cr2O7)2-, at HDTMA+ site as explained in equations Eq. (10) (El Ouafy et al., 2015), the reaction of reduction of Chromium VI to Cr(III) indicated in Eqs (12) according to the study which was made by Kachoosangi et al. and Butter et al. (Kachoosangi and Compton, 2013; Butter et al., 2021). The high accumulation of Cr(VI) at the surface of the CPE-20wt%clay-HDTMABr, manifested by high peak current correlate will with adsorption data which indicates high adsorption of Cr(VI) by the HDTMABr modified clay. The mechanism of retention of Cr(VI) by HDTMABr modified clay could be dominated by charge repulsion, adsorption, and/or exchange capacity of the material.
4 Conclusion
In the present paper, we have presented an investigation of the Chromium (VI) adsorption on clay and composite organoclay. Various methods, including XRF, XRD, FTIR, BET, and SEM were used to characterize the clay and the clay/HDTMABr. A cost effective clay is very efficient for adsorption of Cr(VI), as it is widely available, cheap, and suitable for modification. The modification shows the creation of new sites of interaction for Cr(IV), which dramatically increases the adsorption capacity of the composite material. The ideal removal capacity for Cr(VI) using both adsorbents, clay and clay/HDTMABr was obtained at pH < pHpzc where the surfaces are positively charged for both materials. Kinetic studies showed that Cr(VI) adsorption on clay and clay/HDTMABr reached equilibrium after 300 min with maximum adsorption capacity of 12 mg/g and 250 mg/g, respectively. Analysis revealed that Cr(VI) adsorption on natural clay followed a pseudo second-order kinetic model. The thermodynamic study indicates that the Cr(VI) adsorption process is physical, endothermic, and spontaneous. The organically modified material, clay/HDTMABr was found to outperform many modified materials presented in the literature. Clay and clay/HDTMABr materials were used as electrodes for cyclic voltammetry (CV) and electrochemical impedance spectroscopy (EIS) in [Fe(CN)6]3-/4-/0.1 M KCl solution showing better results in electrochemical charge transfer. Also Cr(VI) reduction were carried out using linear sweep voltammetry (LSV) of 500 µM Cr(VI) in 5.0 M HNO3 (pH = 0.5). The results showed a large reduction peak for Cr(VI) to Cr(III) at 0.54 V by using clay and clay/HDTMABr electrodes, indicating that the peak current is enhanced by 60%. The high peak current presented by the CPE-20wt%clay-HDTMABr, as compared to CPE-20wt%clay, indicated that the enhanced electrochemical activity when clay is incorporated with HDTMABr is due to high sensitivity of the modified electrodes towards Cr(IV) reduction which is based on anion exchange process involving the (Cr2O7)2-, dominant form of Cr(IV) at pH = 0.5, and the HDTMA+ site of interaction. We are aware that our research may have one main limitation which is the conversion of Cr(VI) to Cr(III), a much less toxic form of chromium. However, no evidence exist about Cr(III) low toxicity to the respiratory track for instance.
Funding
This research was funded by the Ministry of Higher Education and Le Centre National pour la Recherche Scientifique et Technique (CNRST). The Research Institute of Science and Engineering (RISE), University of Sharjah, Sharjah, United Arab Emirates, targeted research grant: Ref. V.C.R.G./R. 447/2022.
CRediT authorship contribution statement
Abderrazek El-Kordy: Methodology, Validation, Formal analysis, Investigation, Data curation, Writing – original draft, Writing – review & editing, Visualization. Abdelaziz Elgamouz: Conceptualization, Methodology, Validation, Formal analysis, Investigation, Data curation, Writing – original draft, Writing – review & editing, Visualization, Supervision, Project administration, Funding acquisition. Awad A. Alrashdi: Methodology, Validation, Formal analysis, Investigation, Data curation, Writing – original draft, Writing – review & editing, Visualization. Abderrahim Kali: Methodology, Validation, Formal analysis, Investigation, Data curation, Writing – original draft, Writing – review & editing, Visualization. Ayman Abdelhamid: Methodology, Validation, Formal analysis, Investigation, Data curation, Writing – original draft, Writing – review & editing, Visualization. Abdel-Nasser Kawde: Conceptualization, Methodology, Validation, Formal analysis, Investigation, Data curation, Writing – original draft, Writing – review & editing, Visualization, Supervision, Project administration, Funding acquisition. Najib Tijani: Conceptualization, Methodology, Validation, Formal analysis, Investigation, Data curation, Writing – original draft, Writing – review & editing, Visualization, Supervision, Project administration, Funding acquisition.
Acknowledgement
Authors would like to thank Advanced Materials Research Center, University of Sharjah, Sharjah, United Arab Emirates for X-ray diffraction and SEM-EDS analysis.
Declaration of Competing Interest
The authors declare that they have no known competing financial interests or personal relationships that could have appeared to influence the work reported in this paper.
References
- Synthesis and characterization of modified UZM-5 as adsorbent for nitrate removal from aqueous solution. Sep. Purif. Technol.. 2013;113:24-32.
- [CrossRef] [Google Scholar]
- Removal of chromium (VI) ions from aqueous solutions by using Turkish montmorillonite clay : effect of activation and modification. DES. 2009;244(1–3):97-108.
- [CrossRef] [Google Scholar]
- The adsorption of gases on plane surfaces of mica. J. Am. Chem. Soc.. 1938;60(2):467-475.
- [CrossRef] [Google Scholar]
- Adsorptive removal of phenol using faujasite-type Y zeolite: adsorption isotherms, kinetics and grand canonical Monte Carlo simulation studies. J. Mol. Liq.. 2019;296
- [CrossRef] [Google Scholar]
- Insights into methyl orange adsorption behavior on a cadmium zeolitic-imidazolate framework Cd-ZIF-8: a joint experimental and theoretical study. Arab. J. Chem.. 2021;14(1):102897
- [CrossRef] [Google Scholar]
- Chromium VI − Induced developmental toxicity of placenta is mediated through spatiotemporal dysregulation of cell survival and apoptotic proteins. Reprod. Toxicol.. 2017;68:171-190.
- [CrossRef] [Google Scholar]
- Adsorption of Chromium (VI) from water by clays. Ind. Eng. Chem. Res.. 2006;Vi:7232-7240.
- [Google Scholar]
- Heavy metal pollution in the environment and their toxicological effects on humans. Heliyon. 2020;6(9):e04691.
- [Google Scholar]
- Electrochemical reduction of Cr(VI) in the presence of sodium alginate and its application in water purification. J. Environ. Sci. (China). 2021;101:304-312.
- [CrossRef] [Google Scholar]
- Understanding the role of quaternary ammonium cations on the interaction of bitumen with clay: a molecular modeling study. Constr. Build. Mater.. 2023;364(December 2022)
- [CrossRef] [Google Scholar]
- Physico-chemical characterization and kinetic study of methylene blue adsorption onto a Moroccan Bentonite. Int. J. Sci. Res. Publications (December 2016)
- [Google Scholar]
- Determination of Cr(VI) in leather residues using graphite/paraffin composite electrodes modified with reduced graphene oxide nanosheets. Sci. Total Environ.. 2022;834(April)
- [CrossRef] [Google Scholar]
- Determination of Cr(VI) in leather residues using graphite/paraffin composite electrodes modified with reduced graphene oxide nanosheets. Sci. Total Environ.. 2022;834(February)
- [CrossRef] [Google Scholar]
- Chemical characterization and adsorption of oil mill wastewater on Moroccan clay in order to be used in the agricultural field. Heliyon. 2020;6(1):e03164.
- [Google Scholar]
- Kinetic, thermodynamic and mechanism study of the adsorption of phenol on Moroccan clay. J. Mol. Liq.. 2020;312
- [CrossRef] [Google Scholar]
- Electrochemical studies and cyclic viltammetry of paracetamol at clay modified carbon paste electrode. Bull. Eng.. 2015;VIII(2)
- [Google Scholar]
- Optical sensing of hydrogen peroxide using starch capped silver nanoparticles, synthesis, optimization and detection in urine. Sensors Actuators Rep.. 2020;2(1):100014
- [CrossRef] [Google Scholar]
- From a naturally occurring-clay mineral to the production of porous ceramic membranes. Microporous Mesoporous Mater.. 2018;271(March):52-58.
- [CrossRef] [Google Scholar]
- From a naturally occurring-clay mineral to the production of porous ceramic membranes. Microporous Mesoporous Mater.. 2018;271:52-58.
- [CrossRef] [Google Scholar]
- Characterization of the firing behaviour of an illite-kaolinite clay mineral and its potential use as membrane support. Heliyon. 2019;5(8):e02281.
- [Google Scholar]
- Preparation of sodalite and faujasite clay composite membranes and their utilization in the decontamination of dye effluents. Membranes (Basel). 2022;12(1):1-18.
- [CrossRef] [Google Scholar]
- Experimental study of phenol removal from aqueous solution by adsorption onto synthesized Faujasite-type Y zeolite. J. Mol. Liquids. 2022;277:144-154.
- [CrossRef] [Google Scholar]
- A discrete-to-continuum approach to the curvatures of membrane networks and parametric surfaces. Mech. Res. Commun.. 2014;56:18-25.
- [CrossRef] [Google Scholar]
- The effects of cadmium toxicity. Int. J. Environ. Res. Public Health. 2020;17(11):1-24.
- [CrossRef] [Google Scholar]
- Occupational exposure to hexavalent chromium. Part I. Hazard assessment of non-cancer health effects. Regul. Toxicol. Pharmacol.. 2021;126:105048
- [CrossRef] [Google Scholar]
- An insight to the filtration mechanism of Pb(II) at the surface of a clay ceramic membrane through its preconcentration at the surface of a graphite/clay composite working electrode. Arab. J. Chem.. 2022;15(12):104303
- [CrossRef] [Google Scholar]
- Influences of synthesis conditions on preparation and characterization of Ti-MWW zeolite membrane by secondary hydrothermal synthesis. Microporous Mesoporous Mater.. 2020;297(October 2019):4-10.
- [CrossRef] [Google Scholar]
- Voltammetric determination of Chromium(VI) using a gold film modified carbon composite electrode. Sensors Actuators, B Chem.. 2013;178:555-562.
- [CrossRef] [Google Scholar]
- Efficient adsorption removal of an anionic azo dye by lignocellulosic waste material and sludge recycling into combustible briquettes. Colloids Interfaces 2022
- [Google Scholar]
- Study of the adsorption properties of an almond shell in the elimination of methylene blue in an aquatic. Moroccan J. Chem.. 2022;10(3):509-522.
- [CrossRef] [Google Scholar]
- Adsorption of Chromium (III), Chromium (VI) and Silver (I) on bentonite. Waste Manage.. 1995;15(4):271-282.
- [Google Scholar]
- Hydrothermal synthesis and electrochemical characterization of novel zeolite membranes supported on flat porous clay-based microfiltration system and its application of heavy metals removal of synthetic wastewaters. Microporous Mesoporous Mater.. 2022;334(October 2021):111778.
- [CrossRef] [Google Scholar]
- Adsorptive removal of chromium (VI) using walnut. Res. J. Chem. Environ.. 2019;23(12):25-32.
- [Google Scholar]
- Preparation, characterization, and determination of mechanical and thermal stability of natural zeolite-based foamed geopolymers. Constr. Build. Mater.. 2018;172:448-456.
- [CrossRef] [Google Scholar]
- Urban water cycle processes and interactions: Urban water series - UNESCO-IHP. Urban Water Cycle Process Interact. Urban Water Ser. - UNESCO-IHP. 2014;78:1-131.
- [Google Scholar]
- Characterization of ceramic pieces shaped from clay intended for the development of filtration membranes. South African J. Chem. Eng.. 2021;37(January):1-11.
- [CrossRef] [Google Scholar]
- Adsorption process of the malachite green onto clay: Kinetic and thermodynamic studies. Desalin. Water Treat.. 2021;240(December):191-202.
- [CrossRef] [Google Scholar]
- Use of coal beneficiation tailings as solid sorbents in the treatment of nitrate-contaminated real wastewater. Appl. Water Sci.. 2020;10(4):1-14.
- [CrossRef] [Google Scholar]
- Insights into recent advances of chitosan-based adsorbents for sustainable removal of heavy metals and anions. Arab. J. Chem.. 2022;15(2):103543
- [CrossRef] [Google Scholar]
- Kinetic, isotherm and mechanism investigations of the removal of phenols from water by raw and calcined clays. Heliyon. 2019;5(5):e01616.
- [Google Scholar]
- Applied sciences Chromium (III) removal from wastewater by chitosan flakes. Appl. Sci.. 2020;10(Iii):11.
- [Google Scholar]
- Intranasal chromium induces acute brain and lung injuries in rats: assessment of different potential hazardous effects of environmental and occupational exposure to chromium and introduction of a novel pharmacological and toxicological animal model. PLoS One. 2016;11(12):1-20.
- [CrossRef] [Google Scholar]
- Hexavalent chromium quantification in solution: Comparing direct UV–visible spectrometry with 1,5-diphenylcarbazide colorimetry. Comptes Rendus Chim.. 2018;21(9):890-896.
- [CrossRef] [Google Scholar]
- Preparation and characterization of Na-A zeolite from aluminum scrub and commercial sodium silicate for the removal of Cd2+ from water. J. Assoc. Arab Univ. Basic Appl. Sci.. 2017;24:19-25.
- [CrossRef] [Google Scholar]
- Adsorption of hexavalent chromium and phenol onto bentonite modified with hexadecyltrimethylammonium bromide (HDTMABr) J. Adv. Chem.. 2012;8(2):1602-1611.
- [CrossRef] [Google Scholar]
- Evaluation of kinetic and thermodynamic parameters of chromium adsorption on a organobentonite. Int. J. Adv. Res. Chem. Sci.. 2014;1(5):17-29.
- [Google Scholar]
- Oral chromium exposure and toxicity. Curr. Environ. Health Rep. 2015:295-303.
- [CrossRef] [Google Scholar]
- Manufacture and characterization of flat membrane supports based on Moroccan Rif clay. Mater. Today Proc. 2021:1-7.
- [CrossRef] [Google Scholar]
- Toxicological & environmental chemistry removal of cadmium (II), lead (II), and chromium (VI) ions from aqueous solution using clay. Toxicol. Environ. Chem. (November 2013):37-41.
- [CrossRef] [Google Scholar]
- Trifi, I.M., 2013. “Étude de l ’ élimination du chrome VI par adsorption sur l ’ alumine activée par dialyse ionique croisée To cite this version : Thèse de Doctorat en cotutelle Présentée pour l ’ obtention de titre de Docteur en Chimie Etude de l ’ élimination du chrome.
- Evaluation of Cr(VI) adsorption on glutaraldehyde crosslinked chitosan beads using cyclic voltammetry employing gold electrode. J. Anal Sci. Technol.. 2021;12(1)
- [CrossRef] [Google Scholar]
- Enhanced reduction of sulfate and chromium under sulfate-reducing condition by synergism between extracellular polymeric substances and graphene oxide. Environ. Res.. 2020;183(December 2019)
- [CrossRef] [Google Scholar]
- Recovery of nanoferrites from metal bearing wastes: Synthesis, characterization and adsorption study. J. Mol. Liq.. 2020;318:114047
- [CrossRef] [Google Scholar]
- Removal difference of Cr(VI) by modified zeolites coated with MgAl and ZnAl-layered double hydroxides: efficiency, factors and mechanism. Colloids Surf. A Physicochem. Eng. Asp.. 2021;621(April):126583
- [CrossRef] [Google Scholar]
Appendix A
Supplementary material
Supplementary data to this article can be found online at https://doi.org/10.1016/j.arabjc.2023.105027.
Appendix A
Supplementary material
The following are the Supplementary data to this article:Supplementary data 1
Supplementary data 1


