

Translate this page into:
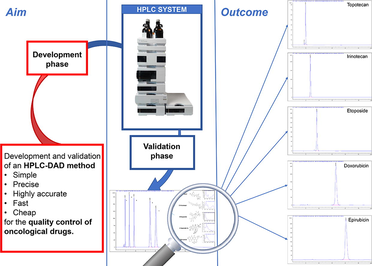
Development and validation of an HPLC-DAD method for the simultaneous identification and quantification of Topotecan, Irinotecan, Etoposide, Doxorubicin and Epirubicin
⁎Corresponding author at: Oncology Pharmacy Unit, Istituto Scientifico Romagnolo per lo Studio e la Cura dei Tumori (IRST) IRCCS, Via P. Maroncelli 40, 47014 Meldola (FC), Italy. paolo.silimbani@irst.emr.it (Paolo Silimbani),
-
Received: ,
Accepted: ,
This article was originally published by Elsevier and was migrated to Scientific Scholar after the change of Publisher.
Abstract
Abstract
The knowledge of the chemical stability of drugs prepared and administered in hospital is of paramount importance for establishing the methods and times of their preparation, as well as for ensuring patient safety. The objective of this work was to develop and validate a single chromatographic method, according to the International Conference on Harmonization (ICH), United States Pharmacopeia (USP) and the European Pharmacopoeia (Ph. Eur.) guidelines, to allow the determination of the chemical stability of 5 chemotherapy drugs. The high performance liquid chromatography coupled with diode array detection (HPLC-DAD) method developed was found to be linear (all analytical curves showed R2 ≥ 0.999), sensitive, precise (RSDs < 3%) and accurate (recovery values ranging between 95% and 105%). The method was demonstrated to be robust to small deliberate variations such as column temperature, pH and composition of the mobile phase and also able to determine drug decomposition products. Therefore, the method described here is perfectly able to identify and quantify the chemotherapy drugs analysed.
Keywords
HPLC-DAD
Anticancer drugs
Quality control

- ANOVA
-
analysis of variance
- Conc.
-
concentration
- DAD
-
diode array detection
- DOX
-
doxorubicin
- EPI
-
epirubicin
- ETO
-
etoposide
- FDA
-
Food and Drug Administration
- HPLC
-
high performance liquid chromatography
- IRI
-
irinotecan
- LOD
-
limit of detection
- LOQ
-
limit of quantitation
- Ph. Eur.
-
European Pharmacopoeia
- R2
-
correlation coefficient
- RSD
-
relative standard deviation
- SmPC
-
summary of product characteristics
- TPT
-
topotecan
- USP
-
United States Pharmacopeia
- UV
-
ultraviolet
Abbreviations
1 Introduction
In the Oncology Pharmacy Unit of our institute (Istituto Scientifico Romagnolo per lo Studio e la Cura dei Tumori (IRST) IRCCS) drugs are generally prepared up to 24 h before their actual administration. This allows the laboratory to work in a planned way, by product line, thus optimising the consumption of drugs from the warehouse, reducing production waste and carrying out more rigorous checks on the production process (for example the control of production residues).
The planned production (in advance compared to the administration of the drug) also makes it possible to perfect the automated production which is, by definition, safer (in terms of quality, quantity and traceability) but slower than manual production (Masini et al., 2014; Yaniv et al., 2017). Early processing binds the laboratory to strict compliance with the operating procedures to maintain the environmental classes and guarantee the sterility of the prepared products. However, this production method is only possible if the stability data of the product allows it. For most injectable oncology drugs, the summary of product characteristics (SmPC) do not provide sufficient stability data to guarantee, on the whole, the planned production in fact only rarely there are stability data relative to the drug as a residue of production stored inside the vial, pierced through the rubber stopper, or data of the diluted drug stored in infusion bags (Electronic Medicines Compendium (emc), Epirubicin; Electronic Medicines Compendium (emc), Doxorubicin; Electronic Medicines Compendium (emc), Etoposide; Electronic Medicines Compendium (emc), Irinotecan; Electronic Medicines Compendium (emc), Topotecan). The Oncology Pharmacy Unit considers it necessary to reproduce the stability data in IRST, verifying it on the actual operating procedures and using materials and tools that define the normal clinical practice and preparation methods. To fill the gaps in the chemical stability information of common chemotherapeutic drugs, in order to allow the planned production, we have developed and validated a single HPLC-DAD method, according to ICH (The International Conference on Harmonization, 2005), USP (The United States Pharmacopoeia (USP) 42 National Formulary (NF) 37, 2019) and the Ph. Eur. (European Pharmacopeia, 2009) guidelines, which allows the determination of the stability of topotecan, irinotecan, etoposide, doxorubicin and epirubicin. In the literature there are several other methods that allow the identification of one of the present chemotherapeutic drugs, but very often they require mobile phases consisting in complex mixtures, gradient systems and long times for drug elution (D’Huart et al., 2020; Patel et al., 1998; Sewell and Massimini, 2014; Thiesen and Krämer, 2000). Short analysis times reduces mobile phase consumption, thus reducing solvent costs and environmental pollution. Complex and expensive methods do not adapt well to routine analyses (quality control) in hospitals. For example, in the absence of literature data and information in the SmPC, it may be necessary to carry out analyses to update the stability data and drug storage times when changing the manufacturer drugs are purchased from, shifting from the brand to the generic or from a generic to another drug (Sewell, 1995).
In the literature, there are also some isocratic and rapid methods to analyse the chemotherapy drugs covered in this article (Bhaskaran et al., 2021; Klasen et al., 2014; Rodrigues et al., 2009), however there is no method that applies to everyone. It was necessary for us to develop and validate a single method to optimize the quality control workflow in economic and time terms. For example, if a single method were routinely used for each drug, it would be necessary to have more chromatography columns and different mobile phases specific to each drug available, thus a greater monetary investment. Furthermore, to pass from the analysis of one drug to another, there would be technical times to change the mobile phases, the columns and condition the columns to make them operational. All of this, on the whole, increases working time, fragments operations and consequently reduces the number of analyses that can be done in a day compared to having a single method capable of analysing multiple drugs.
The novelty of the method developed by us consist to ensure simultaneously the stability of five different chemotherapeutic drugs with a single isocratic chromatographic condition in a simple, reliable, cheap and quick way, using a common HPLC-DAD instrumentation. Compared to HPLC-DAD, mass spectrometry can offer better sensitivity and selectivity but this expensive instrumentation cannot be easily found in low budget analytical laboratories and cannot be used for all routine analyses, since it requires skilled staff (Dmitrienko et al., 2014).
This method can be applied to make qualitative and quantitative analyses of drugs stored in vials, syringes and infusion bags, in compliance with the guidelines regarding practical stability studies of anticancer drugs (Bardin et al., 2011).
2 Materials and methods
2.1 Additives, vehicles and materials
All the drugs used are infusion solution concentrates and were obtained from Accord Healthcare Italia S.r.l.: Topotecan 1 mg/mL, Irinotecan 20 mg/mL, Etoposide 20 mg/mL, Doxorubicin 2 mg/mL, Epirubicin 2 mg/mL. 0.9% Sodium Chloride Injection, USP, 100 mL Viaflo Plastic Container (Baxter S.p.A., Rome, Italy); ChemoClave® Universal Vented Vial Spike (Icu Medical California, USA); Microtip Ultra Hypodermic Needle 18 G (Rays S.p.A, Ancona, Italy); monobasic sodium phosphate (GPR, 500 g, BDH Laboratory Supplies, VWR International PBI S.r.l., Milan, Italy); methanol RS for HPLC PLUS Gradient Grade, water HPLC Plus, hydrochloric acid and sodium hydroxide (Carlo Erba Reagents S.a.s., Milan, Italy); sodium hypochlorite (Lombarda H S.r.l, Milan, Italy); Philips UV-C TUV 36 W/G36 T8 (Lampadine professionali, Turin, Italy).
2.2 Instrument and chromatographic conditions
Chromatographic analyses were performed by using the Agilent 1200 HPLC system (Agilent Technologies) equipped with ChemStation revision B.04.01, Degasser G1379B, Binary Pump G1312A, Autosampler (ALS) G1329A, Thermostatted Column Compartment (TCC) G1316A and Diode-Array Detector (DAD) G1315D. Merck Purospher® STAR RP-18 end-capped, 3 µm Hibar® RT 150–4.6 mm column was used for separation. The column temperature was set at 40 °C. The mobile phase consisted in water (adjusted to pH 1.7 with monobasic sodium phosphate buffer 20 mM) and methanol (45/55, v/v) was used for isocratic elution at a flow rate of 1 mL/min. The injection volume was 3 μl. The eluent was monitored at 233 nm for drug detection over a period of 15 min. The method allows for the elution of all drugs within 10 min. The chromatographic conditions are shown in Table 1
Parameters
Conditions
Column
Purospher® STAR RP-18 end-capped
3 µm Hibar® RT 150–4.6 mm
Column temperature
40 °C
Mobile phase
45/55 (v/v) water (pH 1.7, phosphate buffer 20 mM)/methanol
Type of elution
isocratic
Flow
1 mL/min
Duration of the analysis
10 min
Injection volume
3 μl
Ultraviolet (UV)
233 nm
Instrumentation: Agilent 1200 HPLC system
2.3 Preparation of samples for validation process
The pharmaceutical specialties were used as a standard for the preparation of all samples as they do not have excipients that absorb at the same wavelength as the drug or that interfere with its spectrophotometric determination (topotecan excipients: tartaric acid, mannitol; irinotecan excipients: sorbitol, lactic acid, sodium hydroxide, hydrochloric acid, water for injections; etoposide: anhydrous citric acid, benzyl alcohol, polysorbate 80, macrogol 300, anhydrous ethanol; doxorubicin and epirubicin excipients: sodium chloride, hydrochloric acid, water for injections) (Peter Wuelfing et al., 2006). All drugs used as raw materials for analysis are in solution in the manufacturer's original vials and each sample was obtained independently by diluting the drug concentrate for solution for infusion with water for HPLC.
All samples were set up using Gilson® pipettes in Agilent glass vials supplied with the HPLC system in use and suitable for the autosampler. After mixing and agitating with the vortex mixer, the sample was visually inspected to verify the absence of precipitates, transparency and correct sample setup (volume matching by comparison with the graduated scale on glass vials). For each type of analysis, the samples were prepared in triple and injected into the column three times (n = 9).
According to the ICH, the concentration range to be analysed for the validation of a method must cover at least 80% to 120% of the test concentration. In our Institute the topotecan in the range of 0.01–0.08 mg/mL, irinotecan in the range of 0.11–1.44 and etoposide in the range of 0.16–0.40 mg/mL are administered intravenously after dilution of the concentrated drug with 0.9% sodium chloride for injection. Doxorubicin and epirubicin are not diluted but administered intravenously at a concentration of 2 mg/mL, for these two drugs the method has been validated at a concentration between 0.02 mg/mL and 0.80 mg /mL since it is planned to analyse their chemical stability by diluting the samples to 0.40 mg/mL before their injection in the HPLC to avoid overloading the column.
The concentrations for the validation protocol (shown in Table 2), were chosen based on these considerations and for the tests in which two different concentrations were analysed, a low and a high concentration were chosen arbitrarily. C = final concentration of sample in mg/mL; D = amount of drug used in mL; W = amount of water for HPLC used as diluent in mL.
Sample
Topotecan
1 mg/mLIrinotecan
20 mg/mLEtoposide
20 mg/mLDoxorubicin
2 mg/mLEpirubicin
2 mg/mL
C
D
W
C
D
W
C
D
W
C
D
W
C
D
W
C1
0.005
0.01
1.99
0.04
0.02γ
0.98
0.02
0.01Ω
0.99
0.02
0.01
0.99
0.02
0.01
0.99
C2
0.010α
0.02
1.98
0.08α β
0.04γ
0.96
0.06
0.03Ω
0.97
0.04
0.02
0.98
0.04
0.02
0.98
C3
0.020
0.04
1.96
0.30
0.03
1.97
0.10 αβ
0.01
1.99
0.10 αβ
0.05
0.95
0.08
0.04
0.96
C4
0.030
0.06
1.94
0.60
0.06
1.94
0.20
0.02
1.98
0.20
0.10
0.90
0.10αβ
0.05
0.95
C5
0.060β
0.12
1.88
0.90
0.09
1.91
0.30
0.03
1.97
0.40
0.20
0.80
0.20
0.10
0.90
C6
0.080α
0.16
1.84
1.20
0.12
1.88
0.40
0.04
1.96
0.50
0.25
0.75
0.40
0.20
0.80
C7
0.110
0.22
1.78
1.50α
0.15
1.85
0.50α
0.05
1.95
0.70α
0.35
0.65
0.60
0.30
0.70
C8
0.140
0.28
1.72
1.80
0.18
1.82
0.60
0.06
1.94
0.80
0.40
0.60
0.80
0.40
0.60
C9
0.70α
0.35
0.65
Range
0.005–0.14
0.04–1.80
0.02–0.60
0.02–0.80
0.02–0.80
2.4 Validation of the HPLC method
After optimising the analytical conditions, linearity, precision, accuracy (recovery), selectivity, limit of detection (LOD), limit of quantification (LOQ) and robustness were evaluated according to the ICH guidelines (The International Conference on Harmonization, 2005). The acceptance criteria considered for the various parameters analysed are those indicated by the Food and Drug Administration (FDA) which in its document “Methods, Method Verification and Validation” (Food and Drug Administration Office of Regulatory Affairs, 2020) summarizes the guidelines contained in ICH and USP.
2.4.1 System suitability
In accordance with the USP (The United States Pharmacopoeia (USP) 42 National Formulary (NF) 37, 2019) and the Ph. Eur. (European Pharmacopeia, 2009) criteria, system suitability was checked by determining peak retention time, injection precision, resolution, tailing factor, symmetry factor and the theoretical plates for all cytotoxic drugs. Nine replicate samples were assayed to determine the system suitability.
2.4.2 Specificity and selectivity
Selectivity is the ability to unequivocally assess the target analyte in the presence of other analytes, matrices, diluent or other potentially interfering materials that may be expected to be present in the matrix or sample (Terriente-Palacios et al., 2019). Acceptance criteria: absence in the chromatogram of interference between the diluent and the drugs and no co-elution of the substances. Moreover thanks to the DAD software the purity of the peaks was evaluated (Ragab and El-Kimary, 2017).
2.4.3 Range and linearity
To establish linearity, a calibration curve was constructed from plots of peak areas vs concentrations using 8 different samples at different concentrations and each sample was analysed 3 times. The concentrations used to make the calibration curves for all drugs range from sample C1 to C8 (Section 2.3). Acceptance criteria: determination coefficient, R2 ≥ 0.995.
2.4.4 Detection limit and quantitation limit
Limits of detection (LODs) and quantitation (LOQs) were estimated for each drug following the signal-to-noise ratio criterion, S/N of 3:1 and 10:1, respectively (Li et al., 2019). They were calculated from the noise magnitude that was taken as an estimate of the blank standard deviation (Armentano et al., 2018; Velasco et al., 2018; Vial and Jardy, 1999). C1 concentrations for each drug were used to determine LODs and LOQs (Section 2.3).
2.4.5 Accuracy
The accuracy of the method was assessed as its ability to quantify the concentration of the samples shown in Section 2.3. by comparing the theoretical concentration of the samples with that of the experimental concentration. Three samples were prepared for each concentration and each was analysed 3 times. All of the analyses were carried out on the same equipment, on the same day and by the same analyst. Accuracy was calculated from the Eq. (1):
2.4.6 Precision
Precision was evaluated by determining the repeatability and intra-day and inter-day variability.
Repeatability refers to the degree of agreement between several independent measures of the same analytical variable. To estimate repeatability, for each drug a single sample for each of the two selected concentrations was injected 9 times. All of the analyses were carried out on the same equipment, on the same day and by the same analyst.
Intra-day variability was evaluated by performing 2 sets of analyses, time interval was 12 h from each other on 3 samples at 2 different concentrations. Each sample was analysed 3 times. All of the analyses were carried out on the same equipment by the same analyst.
Inter-day variability was assessed by repeating analyses at two different concentrations on days 0, 4 and 8 for each drug. Three samples were prepared for each concentration and analysed in triplicate. The analysis were performed on different days by different analysts.
The precision data was expressed in terms of relative standard deviation (RSD%) of the measurements, calculated with Eq. (2) and with the analysis of variance (ANOVA).
The concentrations analysed are shown in Section 2.3. Acceptance criteria: RSD ≤ 3%.
2.4.7 Robustness
The robustness of the method was evaluated by deliberate variation of chromatographic parameters such as column temperature, pH and composition of the mobile phase using the one-factor-at-a-time approach (OFAT) (Ragab and El-Kimary, 2017; Terriente-Palacios et al., 2019). The concentrations of the samples used are indicated in Section 2.3, each concentration was prepared in triplicate and injected 3 times (9 measurements/point). The method is considered robust when concentration changes are within the limits of acceptable precision and bias: precision expressed in RSD should be less than 5% and bias should remain in the range of ±5% (Pinto et al., 2017).
2.4.8 Stability indication
The stability-indicating capability of the chromatographic method, that is, distinguishing intact drugs from their degradation products, was assessed using partially decomposed solutions of the drugs (D’Huart et al., 2020; Lepage et al., 2000; Singh et al., 2013; Thiesen and Krämer, 2000; Walker et al., 1991; WHO, 2018). For the partial degradation, 0.7 mL of the drugs were treated as reported in Table 3. tr′ = retention time. UV-C = Ultraviolet light with wavelengths between 200 and 280 nm. NaOH = Sodium hydroxide. NaClO = Sodium hypochlorite.
Not degraded
UV-C 36 W
Temperature
NaOH
NaClO
tr′
(min)
%Areatr′ (min)
%AreaCondition
tr′ (min)
%AreaCondition
tr′ (min)
%AreaCondition
tr′ (min)
%AreaCondition
Topotecan 0.06 mg/mL
1.858
100%/
/
1.880
79%6 h
100 °C1.849
79%3 µl
0.5 M
10 min
100 °C1.860
66%1 µl
0.27%
45 min
25 °C
Irinotecan 0.91 mg/mL
2.885
100%2.925
87%3 day
25 °C2.896
88%11 h
100 °C2.859
85%7 µl
5 M
1 h
25 °C/
/
Etoposide 0.30 mg/mL
3.952
100%3.955
85%6 day
25 °C4.121
73%40 min
100 °C3.167
57%1 µl
0.5 M
2 h
25 °C/
/
Doxorubicin 0.40 mg/mL
6.965
100%/
/
6.802
63%20 min
100 °C6.964
71%1 µl
1 M
45 min
25 °C6.950
63%3 µl
1.35%
15 min
25 °C
Epirubicin 0.40 mg/mL
8.191
100%/
/
7.994
89%20 min
100 °C8.145
50%1 µl
1 M
1 h
25 °C8.249
88%1 µl
2.7%
30 min
25 °C
The chromatograms obtained were compared with those of intact drugs, evaluating the variation in retention times, shape and the area of the peaks, the formation or disappearance of peaks and the analysis of their UV spectra.
3 Results and discussion
3.1 Column selection
One of the most important aspects of a chromatographic method with HPLC is to obtain well resolved peaks of the target compounds with respect to any interfering peaks with reasonable analysis times. Fast and efficient analysis is essential when many routine quality control tests need to be performed.
To achieve this goal, all the variables that influence a chromatographic method were evaluated, starting with the choice of the stationary phase. Among the various columns tested (Merck Chromolith HighResolution RP-18 endcapped, Merck SeQuant ZIC-HILIC, Phenomenex Kinetex HILIC, Phenomenex Kinetex C8, Phenomenex Luna Omega PS C18), the one that gave a clear peak resolution between the eluted compounds, sharper symmetric peaks and relatively shorter retention times was the Merck Purospher STAR RP-18.
This column is characterized by high resistance to acids (stability and reproducibility over a wide range of pH 1.5–10.5) and an acid mobile phase was selected to prevent epimerisation of etoposide during the assay (Chow et al., 1987; Lepage et al., 2000) and to have a single ionization state for each drug, thus avoiding doubling, tailing and fronting of chromatographic peaks. To confirm this, looking in the literature it is observed that the other chromatographic methods proposed for these single drugs also involve analysis with acid mobile phases (Bhaskaran et al., 2021; D’Huart et al., 2020; Klasen et al., 2014; Patel et al., 1998; Rodrigues et al., 2009; Sewell and Massimini, 2014; Thiesen and Krämer, 2000).
In addition, the column has excellent stability up to 65 °C and our analysis were made at 40 °C. The high temperature of the column was chosen to shorten the analysis times because at high temperatures the drugs elute earlier, especially doxorubicin and epirubicin, which are those with the longest retention times. Furthermore, at higher temperatures it is possible to work at higher flow rates to accelerate the elution of drugs, without having too high back pressures that could damage the column. Considering that the method involves the use of the water/methanol mixture which has a higher viscosity and therefore gives higher back pressures than the common water/acetonitrile mixture used in chromatography, a high analysis temperature represents an advantage. The use of methanol was preferred over acetonitrile because it is cheaper.
Since the choice of stationary phase depends on the polarity and hydrophilicity/hydrophobicity of the analytes, having 3 of the 5 drugs analysed a negative LogP (topocatecan LogP = -0.535, doxorubicin and epirubicin LogP = -1,899), we tried to use the Hydrophilic Interaction Liquid Chromatography (HILIC) column. This is the most successful approach for the retention and separation of polar compounds. However, even though we had good results in terms of peaks resolution, the analysis had low precision and accuracy, this is a common problem found with the technique other than the reverse phase. Since we needed a reliable method to use in routine quality control analysis, we therefore decided to use the reverse phase which is more unfailing.
3.2 Validation of the HPLC method
The HPLC-UV-DAD method used in our study was fully validated, as shown in the Materials and methods section. The parameters of system suitability are summarised in Table 4. All measured parameters were within the recommended limits according to USP and Ph. Eur. Elution time of the void volume T0 = 1.439 (±0.003) min. Resolution values were calculated in relation to the previous peak with the half-width method. Each value shows the mean of 9 analyses.
Parameter
Limit
Topotecan
Irinotecan
Etoposide
Doxorubicin
Epirubicin
Retention time tr′ (min ± SD)
1.87 ± 0.09
2.85 ± 0.06
3.67 ± 0.04
6.79 ± 0.06
8.18 ± 0.04
Injection precision RSD%
≤1%
0.4
0.3
0.2
0.8
0.3
Resolution Rs
>2
2.51
8.80
3.85
17.48
25.63
Tailing factor T
≤2
1.16
1.18
1.28
1.18
1.31
Symmetry factor
0.8 ≤ x ≤ 1.5
0.8
0.9
0.8
0.8
0.8
Theoretical plate N
>2000
6206
6306
9915
8322
9082
A typical chromatogram of the mixture of the 5 drugs is shown in Fig. 1. The method effectively separates drugs such as topotecan and irinotecan that belong to the same pharmaceutical class and two epimers such as doxorubicin and epirubicin.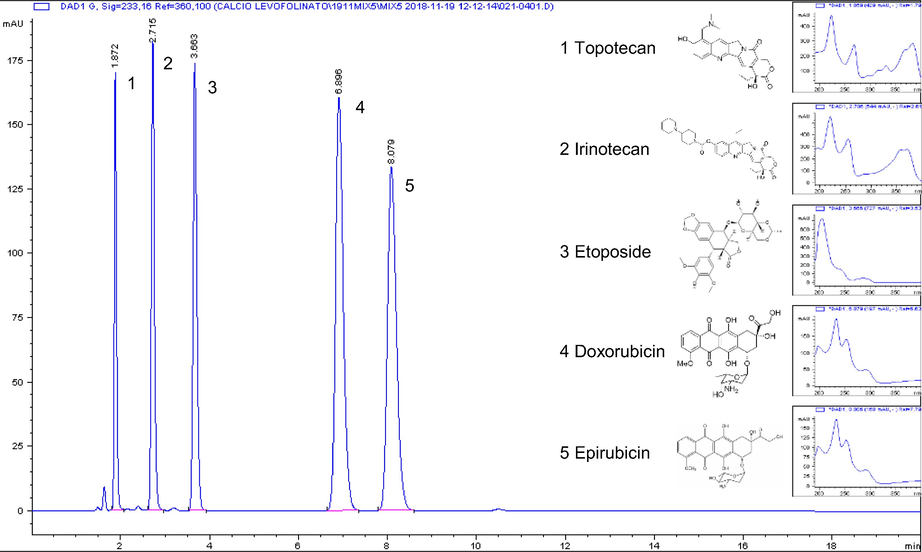
Chromatogram and absorbance spectra of topotecan 0.10 mg/mL (tr′ 1.872 min), irinotecan 0.21 mg/mL (tr′ 2.715 min), etoposide 0.21 mg/mL (tr′ 3.663 min), doxorubicin 0.21 mg/mL (tr′ 6.896 min) and epirubicin 0.20 mg/mL (tr′ 8.079 min). tr′ = retention time.
The specificity of the method was achieved using the UV-DAD detector which clearly showed the absence of interfering peaks in the diluent and of interference between cytotoxic drugs. These results can be seen with chromatograms, the UV profiles and the peak purity of the drugs (Fig. 2).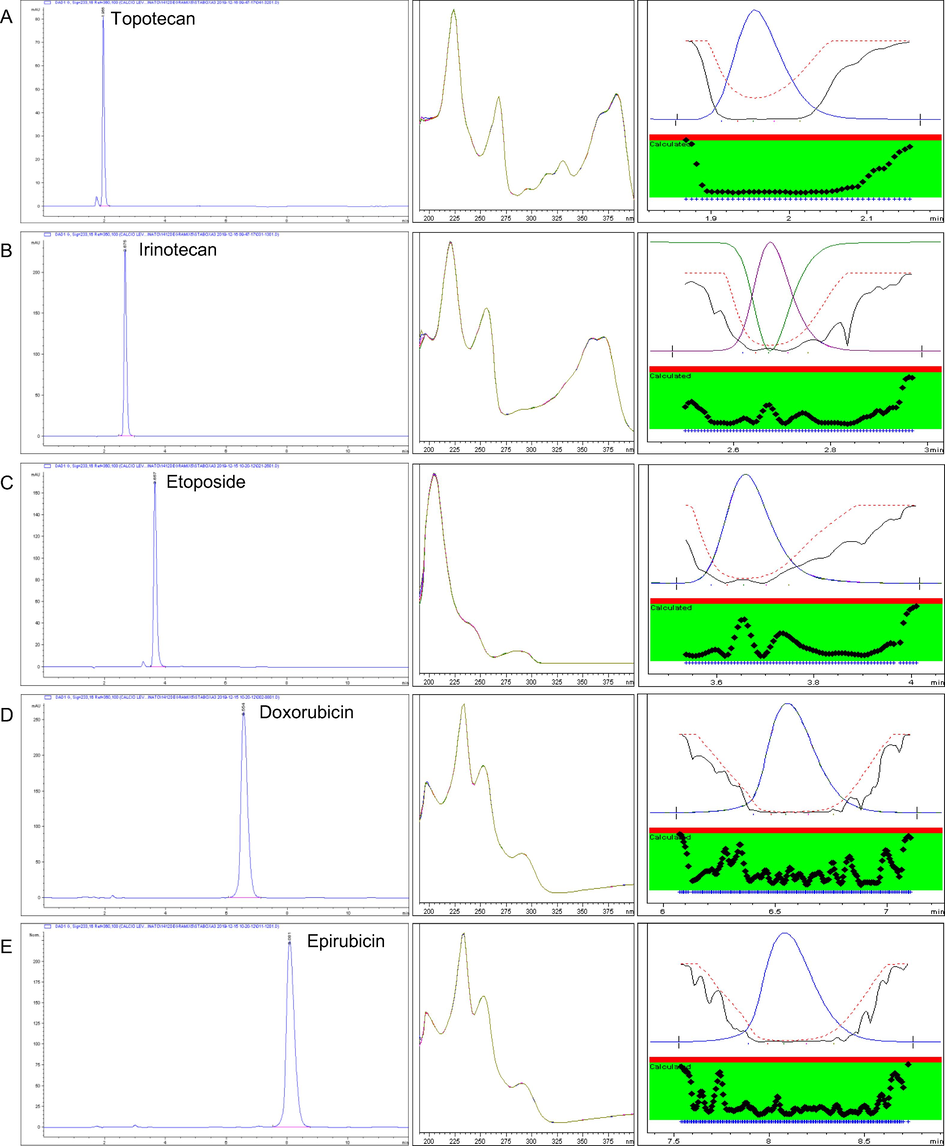
Specificity and Selectivity: chromatogram, absorbance spectra and peak purity of topotecan tr′ 1.956 min (A), irinotecan tr′ 2.675 min (B), etoposide tr′ 3.657 min (C), doxorubicin tr′ 6.554 min (D) and epirubicin tr′ 8.081 min (E). tr′ = retention time.
The HPLC-DAD method has sufficient sensitivity to determine the drugs under normal conditions of use (diluted or concentrated, stored in vials, bags and syringes) in fact low values of LODs and LOQs were measured, thanks to the proper selection of the detection wavelength, which allowed for low base line noise. Good fitting with the linear model for the response was demonstrated by the analysis of the residuals (data not shown) and by the high value of the determination coefficient (Araujo, 2009), for all the drugs an R2 > 0.999 was obtained (Table 5). Conc. – concentration, LOD – limit of detection, LOQ – limit of quantitation, TPT – topotecan, IRI – irinotecan, ETO – etoposide, DOX – doxorubicin, EPI – epirubicin. *8-point calibration graph, 3 replicates/point (N = 24).
Drug
Range mg/mL
R2*
LOD mg/mL
LOQ mg/mL
PrecisionΩ
Recovery %
Conc. mg/mL
Repeatability RSD %
Inter-day RSD %
Intra-day RSD %
day 1
day 4
day 8
TPT
0.005–0.14
0.9999
0.0004
0.0012
0.01
0.72
2.34
2.09
2.74
2.01
99.3–103.5
0.08
0.17
0.59
0.36
0.22
0.53
100.3–102.2
IRI
0.04–1.8
0.9996
0.0017
0.0057
0.08
0.23
1.23
0.78
1.69
1.09
100.9–103.0
1.50
0.30
1.83
0.36
0.43
0.71
100.8–102.9
ETO
0.02–0.60
0.9999
0.0014
0.0046
0.10
0.13
0.57
0.26
0.80
0.64
97.6–101.4
0.50
0.34
1.13
0.81
1.29
1.34
98.6–101.6
DOX
0.02–0.80
0.9999
0.0013
0.0044
0.10
0.89
0.22
1.68
1.61
0.40
97.6–102.0
0.70
0.83
0.18
1.09
0.67
0.50
99.9–100.5
EPI
0.02–0.80
0.9999
0.0007
0.0021
0.10
0.33
2.52
2.84
2.70
2.74
96.0–102.3
0.70
0.23
0.20
0.53
0.36
0.20
97.4–98.1
The overall bias values obtained were acceptable, in any case the recovery remains in the range of ± 5% (Table 5).
The method was precise, the data of repeatability, intra-day and inter-day variability all had a value of RSDs < 3% (Table 5). Furthermore, the ANOVA test demonstrated the non-significant difference in the area of chromatographic peaks, when the analyses are carried out under the same conditions, both within the whole day and within 8 days (Table 5 and Table 6). df = degrees of freedom. The data in the table is the values of F calculated with ANOVA with a p-value of 0.05.
Drug
ANOVA
Concentration mg/mL
Inter-day (df = 23 , F crit. = 3.47)
Intra-day (df = 15, F crit. = 4.60)
Topotecan
0.08
0.41
0.09
Irinotecan
0.08
1.29
0.14
Etoposide
0.50
0.92
0.11
Doxorubicin
0.70
1.09
1.61
Epirubicin
0.70
0.19
0.28
The slight variations in column temperature, mobile phase composition and pH cause changes in the precision and in the bias within the acceptance limit (Table 7). Thus, the developed method can be considered robust. The working operating conditions are: temperature 40 °C, mobile phase 45/55 (H20/MeOH), mobile phase pH 1.7. The values in the table are obtained from 9 analyses. A – Accuracy, P- – Precision expressed as RSD – relative standard deviation, TPT – topotecan, IRI – irinotecan, ETO – etoposide, DOX – doxorubicin, EPI – epirubicin.
Parameters
Drug conc. (mg/mL)
Temperature (°C)
Mobile phase composition H2O/MeOH (v/v %)
Mobile phase pH
36
44
50/50
40/60
1.5
1.9
A %
P %
A %
P %
A %
P %
A %
P %
A %
P %
A %
P %
TPT
0.01
+0.62
0.67
−0.86
0.58
−0.70
2.09
−3.02
1.08
+1.40
1.18
+1.63
0.37
0.08
+0.03
0.48
−0.62
0.06
−0.02
0.45
+1.22
0.54
+0.28
0.61
−0.22
0.33
IRI
0.08
−4.04
2.10
−2.38
1.13
−2.52
1.38
+1.98
0.19
−1.95
0.60
+4.55
0.31
1.50
−4.02
0.27
−4.76
0.30
−0.81
0.53
−4.73
0.34
−3.05
0.55
−3.95
0.62
ETO
0.10
+ 4.13
1.00
−4.26
0.57
+2.18
0.38
+4.08
1.03
−0.48
1.59
−3.80
0.85
0.50
−4.20
1.66
−4.08
0.70
+1.05
1.56
+3.87
0.35
−1.27
1.17
−4.29
0.64
DOX
0.10
−0.96
2.44
+1.42
2.19
+0.53
0.67
−0.74
1.13
−1.73
0.73
+3.95
0.56
0.70
−1.21
0.73
+1.19
0.43
+1.43
0.17
+1.28
0.38
+2.10
0.36
+1.29
0.27
EPI
0.10
+2.40
0.59
−0.62
2.59
+1.57
1.53
+3.41
0.41
+2.65
0.41
−3.91
0.59
0.70
+1.42
0.38
+0.78
1.13
+1.47
0.78
+3.08
0.78
+1.14
0.44
−0.30
1.34
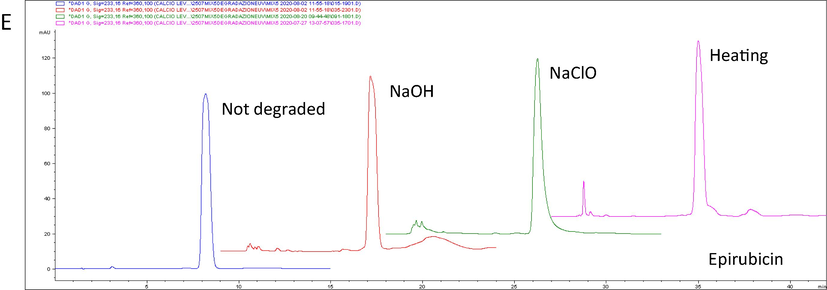
The degradation analyses have demonstrated the ability of the chromatographic method to discriminate intact drug from degradation products (Fig. 3) and the percentage of drug remaining and retention times after degradation are shown in Table 3. The UV profile of the degradation products observed with the DAD (diode array detector) was different from that of the intact drug. In addition, the peak purity analysis showed that the degradation products did not coelute with drugs (Fig. 2).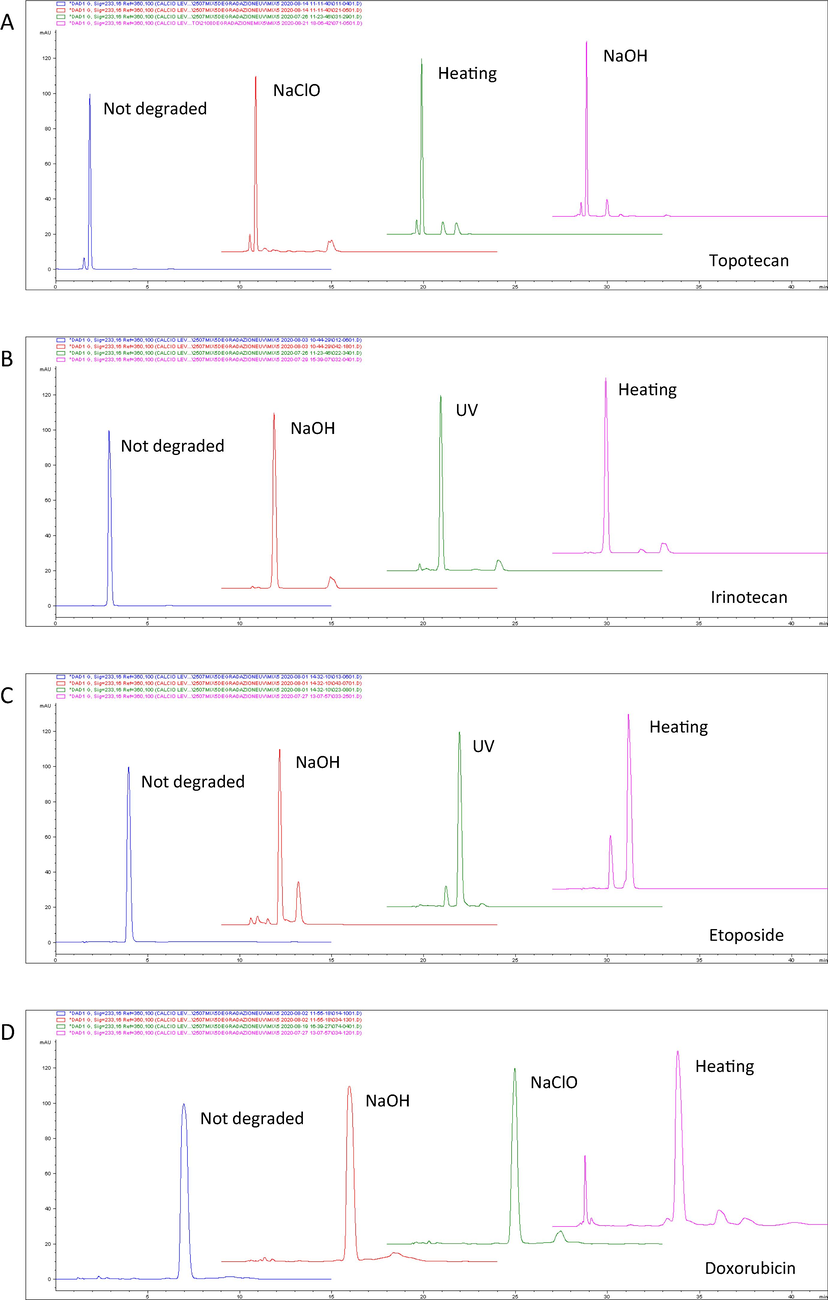
Forced degradation of topotecan tr′ 1.858 min (A), irinotecan tr′ 2.885 min (B), etoposide tr′ 3.952 min (C) doxorubicin tr′ 6.965 min (D) and epirubicin tr′ 8.191 min (E). UV = ultraviolet light; NaOH = sodium hydroxide; NaClO = sodium hypochlorite; tr′ = retention time.
Forced degradation of topotecan tr′ 1.858 min (A), irinotecan tr′ 2.885 min (B), etoposide tr′ 3.952 min (C) doxorubicin tr′ 6.965 min (D) and epirubicin tr′ 8.191 min (E). UV = ultraviolet light; NaOH = sodium hydroxide; NaClO = sodium hypochlorite; tr′ = retention time.
4 Conclusions
The proposed RP-HPLC method for assaying topotecan, irinotecan, etoposide, doxorubicin and epirubicin was simple, precise, highly accurate, cost-saving and time-efficient. The total run time is lower with respect to most of the existing analytical methods described in the literature and developed using HPLC-DAD. The intra-day and inter-day variability and bias results were also acceptable. The method was validated as per the ICH, the USP and the Ph.Eur. guidelines and stability studies under different conditions confirmed that it was highly robust.
The method developed will be applied to determine stability of the five drugs analysed in this paper in order to set up the production of oncological therapies in a planned way in order to optimise drug consumption, reduce production waste, perform more rigorous controls and optimise automated production. Furthermore, it can be easily used by laboratories, such as those of hospital pharmacies, which do not have expensive equipment such as mass spectrophotometers, to perform routine quality control analyses of chemotherapy drugs.
Funding
This research did not receive any specific grant from funding agencies in the public, commercial, or not-for-profit sectors.
Data availability
The datasets generated and/or analysed during the current study are available from the corresponding author on reasonable request.
Authors’ contribution
C.M: designed and coordinated the project; S.S: developed the method and conducted the analyses; P.S and R.G: supervised the project. All authors read and approved the final manuscript.
Acknowledgements
The authors would like to thank Cristiano Verna and Grainne Eileen Tierney for the article editing service.
Declaration of Competing Interest
The authors declare that they have no known competing financial interests or personal relationships that could have appeared to influence the work reported in this paper.
References
- Key aspects of analytical method validation and linearity evaluation. J. Chromatogr. B Anal. Technol. Biomed. Life Sci.. 2009;877(23):2224-2234.
- [CrossRef] [Google Scholar]
- Rapid method for the quantification of 13 sulphonamides in milk by conventional high-performance liquid chromatography with diode array ultraviolet detection using a column packed with core-shell particles. J. Chromatogr. A. 2018;1531:46-52.
- [CrossRef] [Google Scholar]
- Guidelines for the practical stability studies of anticancer drugs: A european consensus conference. Ann. Pharm. Fr.. 2011;69:221-231.
- [CrossRef] [Google Scholar]
- An analytical “quality by design” approach in RP-HPLC method development and validation for reliable and rapid estimation of irinotecan in an injectable formulation. Acta Pharm.. 2021;71(1):57-79.
- [CrossRef] [Google Scholar]
- Stability-indicating high-performance liquid chromatography of etoposide at various pH conditions using a reversed-phase octyl column. J. Chromatogr. A.. 1987;396:217-223.
- [CrossRef] [Google Scholar]
- Physicochemical stability of etoposide diluted at range concentrations between 0.38 and 1.75 mg/mL in polyolefin bags. Eur. J. Hosp. Pharm.. 2020;27:43-48.
- [CrossRef] [Google Scholar]
- Recent advances in sample preparation techniques and methods of sulfonamides detection - A review. Anal. Chim. Acta. 2014;850:6-25.
- [CrossRef] [Google Scholar]
- Electronic Medicines Compendium (emc), Topotecan 1 mg/mL Concentrate for Solution for Infusion. Last Updat. emc 19 Jul 2018. URL https://www.medicines.org.uk/emc/product/4159/smpc.
- Electronic Medicines Compendium (emc), Irinotecan 20 mg/mL concentrate for solution for infusion. Last Updat. emc 07 Apr 2018. URL https://www.medicines.org.uk/emc/product/7318/smpc.
- Electronic Medicines Compendium (emc), Etoposide 20 mg/mL concentrate for solution for infusion. Last Updat. emc 06 Apr 2019. URL https://www.medicines.org.uk/emc/product/3385/smpc.
- Electronic Medicines Compendium (emc), Doxorubicin 2 mg/mL Concentrate for Solution for Infusion. Last Updat. emc 02 Jun 2016. URL https://www.medicines.org.uk/emc/product/6112/smpc.
- Electronic Medicines Compendium (emc), n.d. Epirubicin Hydrochloride 2 mg/ml solution for injection or infusion. Last Updat. emc 24 Apr 2019. URL https://www.medicines.org.uk/emc/product/5998/smpc.
- Food and Drug Administration Office of Regulatory Affairs, 2020. Laboratory Manual Volume II “Methods, Method Verification and Validation”. Document N: ORA-LAB.5.4.5.
- Stability of etoposide solutions in disposable infusion devices for day hospital cancer practices. Drugs R D.. 2014;14(1):13-23.
- [CrossRef] [Google Scholar]
- Stability and compatibility of etoposide in normal saline. Can. J. Hosp. Pharm.. 2000;53:338-345.
- [Google Scholar]
- Determination of trace methanesulfonates in drug matrix using derivatization and headspace single drop microextraction followed by high-performance liquid chromatography with ultraviolet detection. J. Chromatogr. A. 2019;1591:131-137.
- [CrossRef] [Google Scholar]
- Automated preparation of chemotherapy: Quality improvement and economic sustainability. Am. J. Heal. Pharm.. 2014;71:579-585.
- [CrossRef] [Google Scholar]
- Microbial inhibitory properties and stability of topotecan hydrochloride injection. Am. J. Heal. Pharm.. 1998;55:1584-1587.
- [CrossRef] [Google Scholar]
- Polysorbate 80 UV/vis spectral and chromatographic characteristics - defining boundary conditions for use of the surfactant in dissolution analysis. J. Pharm. Biomed. Anal. 2006
- [CrossRef] [Google Scholar]
- European Pharmacopeia, 2009. Chapter 2.2.46. Chromatographic Separation Techniques.
- Development and validation of an analytical method using high performance liquid chromatography (HPLC) to determine ethyl butylacetylaminopropionate in topical repellent formulations. Brazilian J. Pharm. Sci.. 2017;53:1-8.
- [CrossRef] [Google Scholar]
- High performance liquid chromatography with photo diode array for separation and analysis of naproxen and esomeprazole in presence of their chiral impurities: Enantiomeric purity determination in tablets. J. Chromatogr. A. 2017;1497:110-117.
- [CrossRef] [Google Scholar]
- Development of an analytical methodology for simultaneous determination of vincristine and doxorubicin in pharmaceutical preparations for oncology by HPLC-UV. J. Chromatogr. Sci.. 2009;47(5):387-391.
- [CrossRef] [Google Scholar]
- Studies on the stability and compatibility of cytotoxic drug infusions with the Tevadaptor device. Eur. J. Oncol. Pharm.. 2014;8:26-30.
- [Google Scholar]
- Practical guides II: Hospital pharmacy quality control services. J. Clin. Pharm. Ther.. 1995;20:149-157.
- [CrossRef] [Google Scholar]
- Forced degradation studies to assess the stability of drugs and products. TrAC - Trends Anal. Chem.. 2013;49:71-88.
- [CrossRef] [Google Scholar]
- A validated ultra-performance liquid chromatography with diode array detection coupled to electrospray ionization and triple quadrupole mass spectrometry method to simultaneously quantify taurine, homotaurine, hypotaurine and amino acids in macro- and mic. J. Chromatogr. A. 2019;1589:83-92.
- [CrossRef] [Google Scholar]
- The International Conference on Harmonization (ICH) 2005. Harmonized Tripartite Guideline. Validation of Analytical Procedures: Text and methodology Q2(R1). 1–13.
- The United States Pharmacopoeia (USP) 42 National Formulary (NF) 37, Chromatography <621>, 2019. https://hmc.usp.org/system/files/general-chapters/GC-Pdfs_2019/_621_ CHROMATOGRAPHY.pdf.
- Physicochemical stability of irinotecan injection concentrate and diluted infusion solutions in PVC bags. J. Oncol. Pharm. Pract.. 2000;6:115-121.
- [CrossRef] [Google Scholar]
- Quantitative determination of major oxidation products in edible oils by direct NP-HPLC-DAD analysis. J. Chromatogr. A. 2018;1547:62-70.
- [CrossRef] [Google Scholar]
- Experimental comparison of the different approaches to estimate LOD and LOQ of an HPLC method. Anal. Chem.. 1999;71:2672-2677.
- [CrossRef] [Google Scholar]
- Walker, S., Lau, D., DeAngelis, C., lazzetta, J., Coons, C., 1991. Doxorubicin Stability in Syringes and Glass Vials and Evaluation of Chemical Contamination. Can. J. Hosp. Pharmacy; 44, 71-88. https://doi.org/10.4212/cjhp.v44i2.2697
- WHO, 2018. Annex 10 Stability testing of active pharmaceutical Ingredients and finished pharmaceutical products 309–351. http://www.who.int/medicines/areas/quality_safety/quality_assurance/.
- Robotic i.v. medication compounding: Recommendations from the international community of APOTECAchemo users. Am. J. Heal. Pharm.. 2017;74:40-46.
- [CrossRef] [Google Scholar]


