

Translate this page into:
Development and validation of an LC-MS/MS method for simultaneous determination of three organic azido impurities in tetrazole-containing sartans
⁎Corresponding author at: Department of Food and Pharmaceutical Chemistry, Faculty of Pharmaceutical Sciences, Chulalongkorn University, 254 Phayathai Road, Patumwan, Bangkok 10330, Thailand. pornchai.r@chula.ac.th (Pornchai Rojsitthisak)
-
Received: ,
Accepted: ,
This article was originally published by Elsevier and was migrated to Scientific Scholar after the change of Publisher.
Peer review under responsibility of King Saud University.
Abstract
Abstract
The first validated method for single-shot determination of three analogues of organic azido impurities in tetrazole-containing sartan APIs and pharmaceutical products is described. The sufficient sensitivity of the method within the acceptable limit criteria of azido impurities for various sartans as per the ICH M7 requirement is demonstrated. Sample preparation of the method is simple, industry-friendly, and applicable for routine laboratory practice. The method has been fully validated and successfully applied to analyze sartan APIs and commercial medicinal products.
Abstract
This study aimed to develop a sensitive and simple liquid chromatography-tandem mass spectrometry for the simultaneous determination of organic azido impurities (AZBC, AZBT, and AZTT) in sartan active pharmaceutical ingredients and drug products. The method employed a HALO C8 column for chromatographic separation using gradient elution, with a mobile phase composed of 0.1% formic acid in water and 0.1% formic acid in acetonitrile. Quantification of analytes was achieved using a triple quadrupole mass spectrometer, operating in multiple reaction monitoring mode with positive electrospray ionization. The method was fully validated following the ICH Q2 (R1) guideline, and the validation parameters met the criteria for specificity, carryover, and robustness. The developed method was found to be sufficiently sensitive, with LOD and LOQ below the acceptable limits of azido impurities in pharmaceuticals as per the ICH M7 guideline. The assay had dynamic ranges of 1.00–20.00 ng/mg for AZBC and 0.10–15.00 ng/mg for AZBT and AZTT in sartans. In conclusion, the established method was effectively utilized for determining azido impurities in sartan active pharmaceutical ingredients and drug products, achieving high accuracy and precision.
Keywords
Azide
Azido impurity
LC-MS/MS
Mutagenic impurity
Sartans
Plackett-Burman

1 Introduction
Sartans, also known as angiotensin II receptor blockers (ARBs), are a class of medications commonly used in the treatment of hypertension (Burnier and Brunner, 2000). They work by blocking the effects of angiotensin II, a hormone that constricts blood vessels and increases blood pressure. Sartans are considered effective and well-tolerated options for managing hypertension, and are often prescribed as a first-line treatment or in combination with other antihypertensive drugs (Burnier and Brunner, 2000). Sartans can be classified based on their structures, with some containing a tetrazole ring, such as losartan, valsartan, irbesartan, telmisartan and olmesartan, and others that do not, like eposartan (Wichitnithad et al., 2023). Ensuring the quality and safety of sartan-containing pharmaceuticals is crucial for protecting patient health.
In recent years, there has been a heightened focus on genotoxic impurities in pharmaceuticals among regulatory authorities and manufacturers globally. This has led to concerns about patient safety for physicians and healthcare professionals and posed challenges in the medical supply chain for pharmaceutical manufacturers (Brian Byrd et al., 2019). In 2021, the discovery of new mutagenic organic azide by-products, known as azido impurities, in tetrazole-containing sartan drugs further intensified concerns about impurity control in pharmaceuticals (https://recalls-rappels.canada.ca/en/alert-recall/multiple-lots-irbesartan-losartan-and-valsartan-drugs-recalled, accessed 30 May 2021). Azide contaminants in pharmaceuticals can be classified into two categories: inorganic azido impurities and organic azido impurities. Well-known inorganic azides, the so-called metal azide salts (M+N3¯) such as sodium azide (NaN3), potassium azide (KN3) and rubidium azide (RbN3), can be contaminated during the synthesis of tetrazole-containing drugs such as cilostazol (Leyva-Ramos and Cardoso-Ortiz, 2021), losartan (Leyva-Ramos and Cardoso-Ortiz, 2021; Roh et al., 2012; Zou et al., 2020), irbesartan (Leyva-Ramos and Cardoso-Ortiz, 2021; Roh et al., 2012; Zou et al., 2020), candesartan (Leyva-Ramos and Cardoso-Ortiz, 2021; Zou et al., 2020), tomelukast (Roh et al., 2012; Zou et al., 2020), tedizolid (Zou et al., 2020), and encequidar (Zou et al., 2020), resulting in residual adulteration in those active pharmaceutical ingredients (APIs). Similarly, organic azido impurities such as alkyl azides (R-N3) are hazardous azide by-products occurred during the synthesis of drug substances. The Canadian FDA recently announced the voluntary recalls of multiple sartan drug products due to the contamination of 4′-(azidomethyl)-[1,1′-biphenyl]-2-carbonitrile (AZBC) and 5-(4′-(azidomethyl)-[1,1′-biphenyl]-2-yl)-1H-tetrazole (AZBT) impurities (https://recalls-rappels.canada.ca/en/alert-recall/multiple-lots-irbesartan-losartan-and-valsartan-drugs-recalled, accessed 30 May 2021). Subsequently, the third azido impurity, 5-(4′-((5-(azidomethyl)-2-butyl-4-chloro-1H-imidazol-1-yl) methyl)-[1,1′-biphenyl]-2-yl)-1H-tetrazole (AZTT), has recently been reported in losartan by European Directorate for the Quality of Medicines & HealthCare (EDQM) (https://www.edqm.eu/en/-/risk-of-the-presence-of-mutagenic-azido-impurities-in-losartan-active-substance, accessed 9 Jun 2022) and the Australian Therapeutic Goods Administration (TGA) (https://www.tga.gov.au/news/safety-alerts/azide-impurity-sartan-blood-pressure-medicines, accessed 6 Apr 2022).
The possible formation pathways of AZBC, AZBT, and AZTT by-products in sartan APIs are depicted in Fig. 1. Based on the chemical structures of those organic azides, AZBC possibly arises from the side-reaction between sodium azide and remaining residual carbonitrile intermediates such as 4′-(bromomethyl)-[1,1′-biphenyl]-2-carbonitrile left from the upstream reaction step of the sartan synthesis. Furthermore, the reactive cyano functional group on AZBC can subsequently react with sodium azide, which immediately converts to the tetrazole analogue of AZBC called AZBT. Unlike AZBC and AZBT, AZTT origins from the interaction between the remaining sodium azide and losartan during the manufacturing process. Therefore, AZTT must be monitored in losartan potassium only.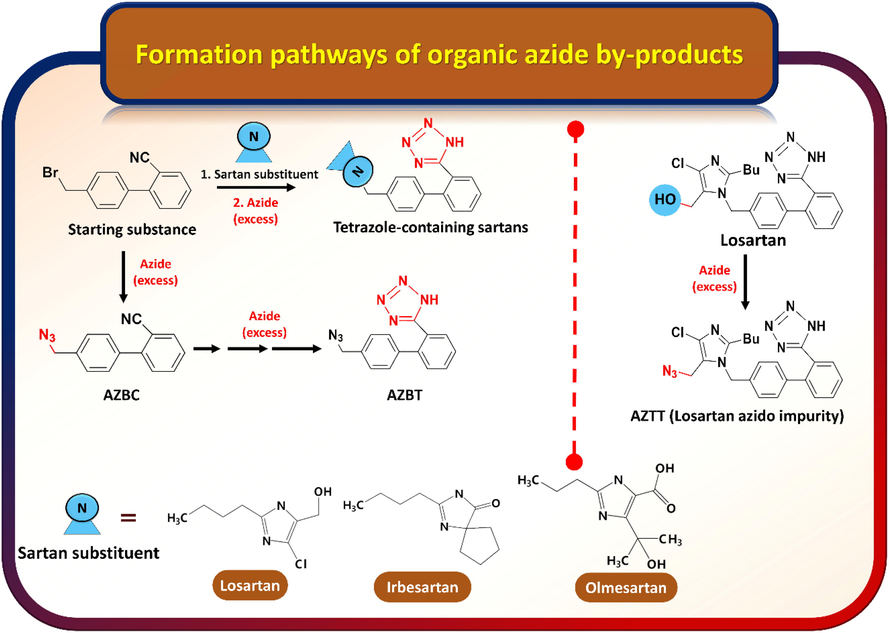
Possible formation pathways of organic azide by-products in the sartan synthetic route.
Apart from the risk assessment, developing a reliable analytical methodology is a potential approach for routine quality monitoring of organic azide impurities during sartan manufacturing and storage. In 2016, Gročar and Andrenšek reported an assay of sodium azide, an inorganic azide impurity, in sartans using reversed-phase HPLC coupled with UV detection (Gričar and Andrenšek, 2016). In addition to the liquid chromatographic technique, gas chromatography coupled with double flame ionization detectors has also been applied to determine residual inorganic azide salt in sartan products (Wacheƚko et al., 2020). The US pharmacopoeia monograph mentioned sodium azide assay in irbesartan by ion chromatographic technique with conductivity detection (United State Pharmacopoeia, 2008). Besides sodium azide determination in the sartan drug class, Páll et al. reported the assay method for sodium azide impurity in cilostazol by ion chromatograph with matrix elimination (Páll et al., 2021). Regarding organic azide impurities, only one report of AZBC and AZBT determination in irbesartan has recently been published by Jireš et al. (2021). The method was validated using irbesartan as a surrogate matrix and concluded for other sartans such as valsartan, losartan, and candesartan. However, the method of AZTT determination in pharmaceuticals has not yet been reported.
In this study, we first developed a method for single-shot determination of three analogues of organic azido impurities, including AZBC, AZBT, and AZTT, in tetrazole-containing sartan APIs and pharmaceutical products. The method development and validation were explored in three surrogate sartan matrices, i.e., losartan potassium, irbesartan, and olmesartan medoxomil. The technique is simple, sensitive, selective, and robust using liquid chromatography coupled with tandem mass spectrometry (LC–MS/MS) without complicated sample pre-treatment practicable for a routine industrial laboratory. The developed method was fully validated in terms of linearity, sensitivity, selectivity, carryover, precision, accuracy, and robustness according to the ICH Q2 (R1) guideline (The International Conference on Harmonization, 2005). The method was challenged to simultaneously determine the three organic azides in different sartan matrices, e.g., losartan potassium, irbesartan, and olmesartan medoxomil, indicating its applicability to other sartan APIs and corresponding pharmaceuticals.
2 Materials and methods
2.1 Chemicals and reagents
AZBT (lot no. SL-GSV-194–176, purity 98.52%) and AZBC (lot no. SL-GSV-194–042, purity 99.65%) were purchased from SimSon Pharma Ltd (Mumbai, India). AZTT (lot no. 4647-022A3, purity 99.1%) was purchased from TLC (Ontario, Canada). Celecoxib (internal standard (IS)), losartan potassium, irbesartan, and olmesartan medoxomil API samples were gifted by Siam Bheasach Co., Ltd (Bangkok, Thailand). Commercial losartan drug products from five pharmaceutical manufacturers were randomly purchased from local drug stores. The batches and manufacturers of those test samples are intentionally blinded so that the published test results do not cause any business impacts to those manufacturers. All reagents were at least of analytical grade and procured from commercial sources. The ultra-purified water (18.2 MΩ-cm) used throughout this study was obtained from a Milli-Q water purification system (Millipore; S.A.S, France).
2.2 Preparation of stock standard solutions and working standard solutions
Stock standard solutions of AZBC, AZBT and AZTT were separately prepared by dissolving an appropriate amount in acetonitrile (ACN) at a concentration of 0.5 mg/mL. Working standard solutions of azido impurities for calibration standards, quality control (QC) samples (limit of quantitation (LOQ), medium concentration QC (MQC), and high concentration QC (HQC)), and limit of detection (LOD) were prepared by appropriate dilution of the stock solutions. A stock solution of celecoxib (an internal standard, IS) was prepared in ACN at a concentration of 0.5 mg/mL. A working standard solution of celecoxib was prepared at 5.00 µg/mL from the celecoxib stock solution. All working standard solutions were diluted with 80%ACN in water (ACN:Water = 8:2) as a diluent.
2.3 Preparation of calibration standards, LOD, and QC samples
Calibration standards for AZBC were prepared at concentrations of 5, 10, 25, 50, 75, and 100 ng/mL, whereas for AZBT and AZTT, the standards were prepared at concentrations of 0.5, 1, 10, 25, 50, and 75 ng/mL. They were separately prepared by spiking the appropriate amount of the working standard solutions of azido impurities in 80%ACN. Six spiked standard calibration samples were prepared by spiking the working standard solutions of corresponding azido impurities in losartan potassium, olmesartan medoxomil and irbesartan APIs to yield concentrations ranging from 5.00 to 100.00 ng/mL for AZBC and 0.50 to 75.00 ng/mL for AZBT and AZTT. LOD samples for AZBC, AZBT and AZTT were prepared by adding the corresponding working standard solutions to losartan potassium, olmesartan medoxomil, and irbesartan APIs at 2.5, 0.25, and 0.25 ng/mL, respectively. Spiked QC samples for AZBC were prepared by adding the working standard solutions to losartan potassium, olmesartan medoxomil, and irbesartan APIs at concentrations of 5.00, 25.00, and 75 ng/mL, representing QC at LOQ, MQC and HQC, respectively. For AZBT and AZTT, spiked QC samples were prepared by spiking the corresponding working standard solutions to losartan potassium, olmesartan medoxomil, and irbesartan APIs at concentrations of 0.50, 10.00, 50.00 ng/mL, representing QC at LOQ, MQC and HQC, respectively. It is noted that the sample concentrations indicated above between 0.25 and 100 ng/mL corresponded to the amounts of azido impurities in sartan matrices between 0.05 and 20 ng/mg based on the concentration of the test samples at 5 mg/mL. Samples were filtered through a 0.22 µm nylon membrane filter prior to injection.
2.4 Sample preparation
A 500 mg API sample was dissolved in 100 mL of 80% ACN (5 mg/mL). A 50 µL of the IS working solution (celecoxib 5.00 µg/mL) was added into a centrifuge tube containing 5 mL of sample solution. Then, the sample solution was vortex-mixed and filtered through a 0.22 µm nylon membrane filter. The filtered sample solution was transferred into a vial for LC-MS/MS analysis.
In order to prepare tablet samples for analysis, a suitable quantity of tablets was weighed and finely ground. A portion of this powder, corresponding to 500 mg of the drug substance, was accurately weighed and dissolved in 100 mL of an 80% ACN solution, yielding a 5 mg/mL concentration of the drug substance. Next, 50 µL of the internal standard (IS) working solution containing 5.00 µg/mL celecoxib was added to 5 mL of the prepared solution. This mixture was vortex-mixed and subsequently centrifuged at 10,000 rpm. Following centrifugation, the transparent supernatant was filtered using a 0.22 µm nylon membrane filter. The resulting filtered sample solution was placed into a vial for LC-MS/MS analysis.
2.5 Instrumentations and conditions
Samples were analyzed using a Prominence LC system (Shimadzu, Kyoto, Japan) coupled with an AB Sciex API4000 mass spectrometer (Foster City, CA, USA). Chromatographic separation was carried out on a HALO C8 2.7 µm i.d., 4.6 × 100 mm column (Wilmington, DE, USA) under gradient conditions at a flow rate of 0.5 mL/min. The mobile phase was composed of 0.1% formic acid in water (solvent A) and 0.1% formic acid in acetonitrile (solvent B). The gradient elution program was as follows: 0.00–0.50 min, B: 45%; 0.51–6.00 min, B: 90%; 6.01–8.50 min, B: 90%; 8.51–9.50 min, B: 45%; 9.51–11.00 min, B: 45%. The divert valve was used to control the eluent direction into the mass spectrometer after 4.00 min. The column and autosampler temperatures were maintained at 35 °C and 15 °C, respectively. The injection volume was 5 μL. The total analysis time was 11.0 min.
The API4000 triple-quadrupole mass spectrometer is equipped with an electrospray ionization (ESI) source. The Turbo ionspray™ interface and ion spray voltage were set at 500 °C and 5500 V, respectively. Source parameters including collision gas, curtain gas, ion source gas 1, and ion source gas 2 were adjusted to 5, 25, 60, and 50 psi, respectively. Nitrogen served as the carrier and fragmentation gas. Compound parameters, such as declustering potential (DP), entrance potential (EP), collision energy (CE), and collision cell exit potential (CXP) were set at 60, 10, 30, and 10 V for AZBC; 55, 10, 13, and 6 V for AZBT; 80, 10, 30, and 10 V for AZTT; and 80, 10, 36, and 10 V for celecoxib (IS), respectively. Multiple reaction monitoring (MRM) analysis using ESI with positive ion mode was used to monitor ion transitions of m/z 192.4 → 165.3 for AZBC, m/z 278.5 → 235.5 for AZBT, m/z 448.4 → 207.6 for AZTT, and m/z 382.1 → 303.1 for celecoxib (IS). Data acquisition and processing were carried out using the Analyst software™ (version 1.7.2, Sciex, CA, USA).
2.6 Method validation
Validation was conducted by evaluating system suitability, specificity, carryover, linearity and range, accuracy, precision, LOD, LOQ, and robustness. These parameters were validated in compliance with the Q2(R1) ICH guidelines for analytical method validation (The International Conference on Harmonization, 2005).
2.6.1 System suitability
The suitability of the chromatographic system was assessed before initiating validation experiments and routine assays. A system suitability solution containing a mixture of AZBC, AZBT, AZTT, and celecoxib was prepared at 5, 0.5, 0.5 and 50 ng/mL, respectively. The system suitability solution was injected in five replicates. The system reproducibility was evaluated based on the variation in peak area (%CV ≤ 10) and retention time (%CV ≤ 2%), which indicated the precision of injections. The column efficiency and detection sensitivity were evaluated from the symmetry factor (≤2) and signal-to-noise ratio (s/n ≥ 10) of analytes, respectively.
2.6.2 Specificity
Specificity refers to the chromatographic system's ability to differentiate the analyte of interest amid potential interferences such as solvents, matrices, and other impurities. Specificity was evaluated by separately injecting 80%ACN in water (diluent), various sartan matrices, formulation excipients, and an authentic standard solution mixture of azido impurities (at the LOQ concentration of each component). Specificity was determined based on the presence or absence of interference peaks at the same m/z and retention time for AZBC, AZBT, AZTT, and IS on the chromatograms.
2.6.3 Carryover
Carryover was investigated to ensure that no analyte from a prior sample appeared in the subsequent sample. The carryover effect was evaluated as the percentage of carryover by analyzing a blank 80%ACN after injecting the highest concentration of calibration sample. The percentage of carryover in the blank sample was calculated against the calibration curve in comparison with the LOQ concentration, which was considered acceptable at ≤ 20% and ≤ 5% for the individual analyte and IS, respectively. This assessment was performed in three independent experiments on three different days.
2.6.4 Linearity and range
Linearity is the relationship between the concentration of an analyte and its corresponding peak area ratio. Six-point calibration curves were generated in triplicate by plotting the analyte peak area ratios against various concentrations of AZBC, AZBT, and AZTT. A weighted-linear least square model with a weighting factor was selected based on a statistical test of homoscedasticity. The coefficient of determination (r2 ≥ 0.995) was used to confirm the linearity of the plot. The percent deviation of mean back-calculated concentrations of AZBC, AZBT, and AZTT should be ± 10%. The %CV of triplicate plots should be ≤ 11%. Statistic parameters such as p and F values were determined for linear regression evaluation. The p values of the slope and intercept from the residual plot were used to determine if the slope and y-intercept were significantly different from zero at a 95% confidence interval (Barwick, 2003). The F value was calculated and compared to the FANOVA, illustrating a strong linear relationship between the peak response ratio obtained from the instrument (y) and the concentration (x) of the analyte.
Range refers to the concentration interval between lower and upper quantitative levels. The range of the method was determined using the spiked calibration samples. Losartan potassium, irbesartan, and olmesartan medoxomil used as sample matrices were spiked with the corresponding azido impurities within a given dynamic range. The equation model was designed following the same approach as the linearity experiment. The slope, intercept, and r2 were calculated.
2.6.5 Accuracy and precision
According to ICH Q2 (R1) (The International Conference on Harmonization, 2005), accuracy should be assessed using a minimum of 9 determinations over at least three concentration levels covering the specified range of the method. Regarding precision, the experiments can be assessed by either a minimum of 9 determinations covering the specified range of the method or a minimum of six independent preparations at 100% of the positive test sample. Unfortunately, there is no positive real sample containing the three azido impurities. Therefore, the accuracy and precision experiments were designed on the evaluation at three levels of the separately spiked QC samples at the concentration of 1.00 (LOQ), 5.00 (MQC) and 15.00 (HQC) ng/mg for AZBC and 0.10 (LOQ), 2.00 (MQC), and 10.00 (HQC) ng/mg for AZBT in losartan potassium, irbesartan, and olmesartan medoxomil API matrices. For AZTT, accuracy and precision were determined in losartan API matrice at three levels of the spiked QC samples at the concentrations of 0.10 (LOQ), 2.00 (MQC), and 10.00 (HQC) ng/mg. Each concentration level was prepared and analyzed in triplicate on the same day for within-run (intraday) analysis and on two different days for between-run (interday) analysis. Accuracy was assessed by comparing the %recovery between the mean back-calculated and nominal (actual) concentrations. The %recovery should fall within the range of 90–110%. The within-run and between-run precision values were evaluated using the %CV of the back-calculated concentrations. The %CV should be ≤ 11% for all concentration levels, excluding the LOQ, which should be ≤ 15%.
2.6.6 LOD and LOQ
The LOD represents the lowest amount of an analyte in a sample matrix that can be detected but not necessarily quantitated as an exact value. The LOD can be derived from the signal-to-noise (S/N) ratio, which is usually expressed as the analyte concentration in a sample matrix. It is determined by the S/N ratio and % CV of five replicate injections. The LOD was theoretically verified at S/N ≥ 3 and % CV of five replicate injections ≤ 15.
The LOQ represents the lowest amount of analyte in a sample matrix that can be quantitatively analyzed with suitable accuracy and precision. Typically, the LOQ is estimated by determining the S/N ratio, accuracy and precision of five replicate spiked samples. The LOQ established using five independent spiked QC samples met the criteria with accuracy and precision of recovery in the range of 90–110% and %CV ≤11, respectively.
2.6.7 Robustness and stability
Robustness is an indicated parameter of method tolerability in case of small variation occurrence in chromatographic parameters to ensure the reliability and stability of the method during analysis. In this study, the robustness of the developed method was evaluated using Plackett-Burman (P-B) partial factorial design and multivariate analysis (Maškovic et al., 2010). Twelve assigned experiments (N = 12) were performed from eleven factors. Eight factors including chromatographic and turbo spray ion source parameters were investigated in the robustness experiment. The details are summarized in Table 1S of the supplementary material. Three dummy (D) effects are available to estimate the critical effect (Ecritical). Factor effects (Ex) are calculated from Equation (1).
Test substance
Run no.
Peak response
%interference
Blank
LOQ
AZBC
1
0.000
3097.215
0.00
2
0.000
3204.825
0.00
3
0.000
3444.672
0.00
AZBT
1
0.000
14461.433
0.00
2
0.000
15125.278
0.00
3
0.000
15082.857
0.00
AZTT
1
0.000
15219.756
0.00
2
0.000
15357.961
0.00
3
0.000
15604.793
0.00
Celecoxib (IS)
1
0.000
78748.787
0.00
2
0.000
81427.844
0.00
3
0.000
75920.454
0.00
The blank losartan matrix spiked at a concentration level corresponding to approximately 5 ng/mg of AZBC, AZBT, and AZTT impurities was used to evaluate the robustness of the method.
The stability studies of the stock and working standard solutions and the spiked sartan samples were investigated. To define the appropriate storage time and condition, the percent deviation of the analyte concentration of the sample stored at each specified time and condition compared to the freshly prepared sample should not be greater than ± 5%.
3 Results and discussion
3.1 Optimization of chromatographic conditions
The quantitative analysis of trace amounts of impurities in APIs and drug products is still challenging since it is usually faced with difficulties from analyte-matrix co-elution resulting in signal suppression or enhancement. In this work, we developed an LC-MS/MS method for determining AZBC and AZBT in losartan potassium, irbesartan, and olmesartan medoxomil APIs and determining AZTT in losartan potassium API. Initially, 100 ng/mL solutions of the analytes were infused to find the protonated precursor ion and the most stable and intense product ion. The Q1 MS showed predominant protonated precursor ions at m/z 192.4, 278.5, and 448.4 for AZBC, AZBT, and AZTT, respectively. After MS fragmentation, the most prominent and stable product ions for quantification of AZBC, AZBT, and AZTT were found at m/z 165.3, 235.5 and 207.6, respectively. The representative product ion spectra of AZBC, AZBT, and AZTT are shown in Fig. 2A-2C, respectively. The parameters of an analyte such as DP, EP, CE and CXP were optimized to achieve the highest sensitivity of analytes. Typically, precursor ions from the ESI source were fragmented in the collision cell (the second quadrupole). In some cases, unstable and fragile ions undergo breakdown, whereas ionization occurs within the ESI source, generating in-source fragment ions that are observed at the same chromatographic retention time as the target analyte (He et al., 2020). High temperature and ion-source voltage parameters are critical factors that may induce in-source fragmentation (He et al., 2020; Sun et al., 2022). The result showed that the precursor ion of AZBC was found at m/z 192.1 instead of m/z 235 because of the neutral loss of hydrazoic acid (HN3) after ionization due to in-source fragmentation shown in Fig. 3A. The declustering potential of AZBC was optimized but could not gain the protonated precursor ion of m/z 235. Regarding AZBT, the in-source fragmentation made the loss of sensitivity when too high declustering potential was applied. AZBT can lose two neutral molecules of HN3 to generate the fragmented ion of m/z 192 and convert to m/z 165 at 2° quadrupole (Q2) as illustrated in Fig. 3B. Therefore, the in-source fragmented peak of AZBT showed up at the mass transition of AZBC (m/z 192 → 165) but eluted at the same retention time of AZBT (4.48 min), while the AZBT peak showed up at the mass transition of AZBT (m/z 278 → 235) demonstrated in Fig. 4A. To reduce the in-source fragmentation effect of AZBT, the declustering potential was adjusted from 100 to 55 V as presented in Fig. 4B.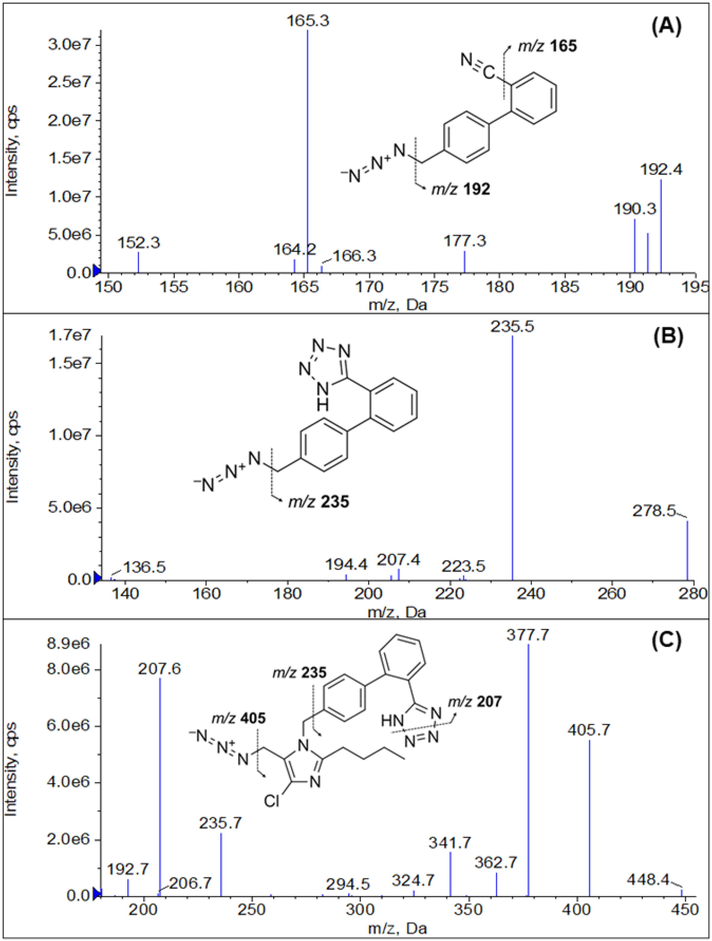
Product ion spectra of (A) AZBC, (B) AZBT, and (C) AZTT.
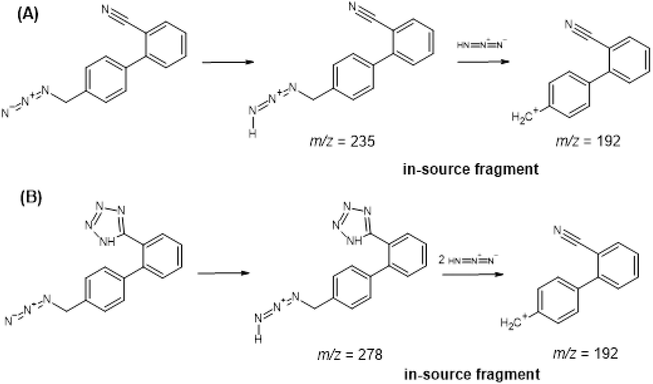
In-source fragment pathways of (A) AZBC and (B) AZBT.
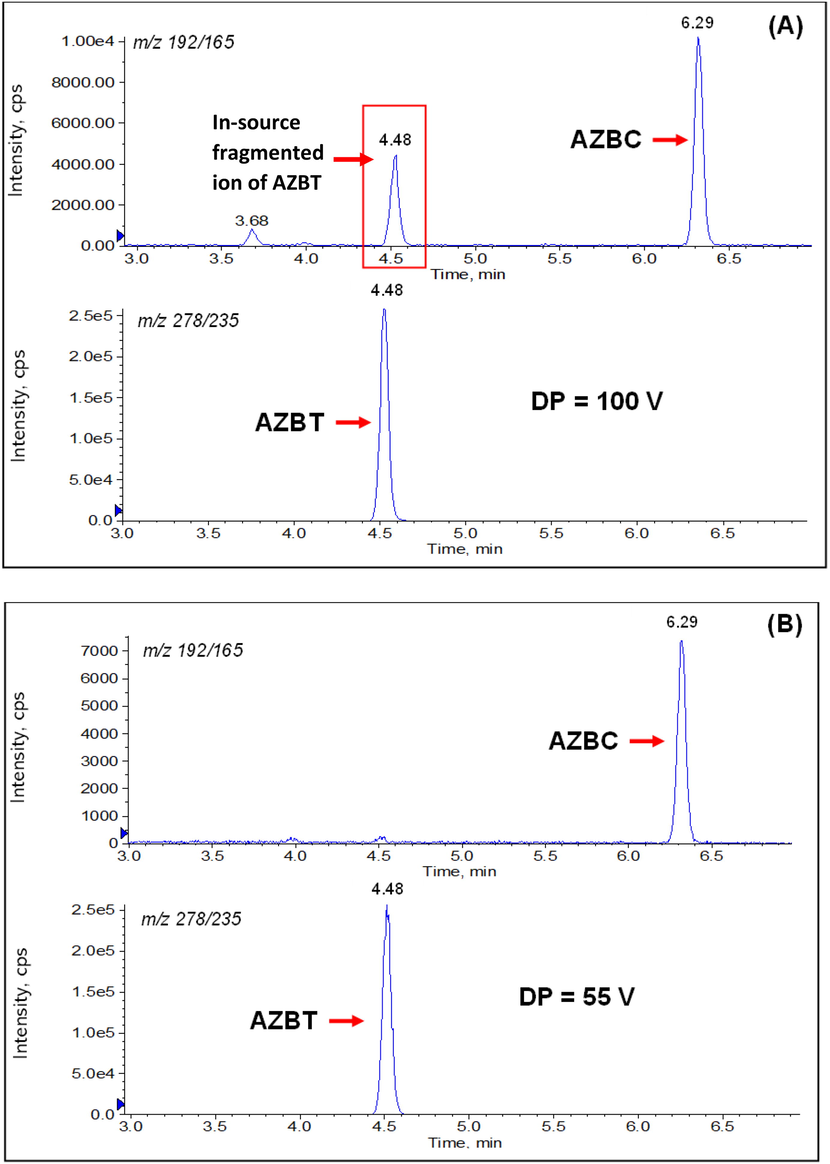
In-source fragmentation of AZBT at (A) DP of 100 V and (B) DP of 55 V.
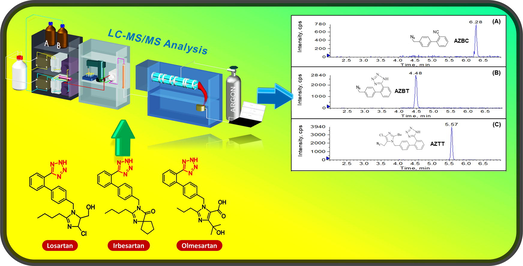
The chromatographic parameters including mobile phase and column type were optimized to achieve clear separation of the azido impurities from drug substance matrices. The best chromatographic result was obtained using a HALO C8 4.6 × 100 mm, 2.7 µm column and a mobile phase mixture of 0.1% formic acid in water and 0.1% formic acid in acetonitrile with gradient elution. Formic acid serves as a mobile phase modifier during the separation of losartan potassium, irbesartan, and olmesartan medoxomil from their azido impurities, enhancing separation efficiency and resolution. Azido impurities are polar and basic, which can result in tailing and poor peak shape during analysis. Formic acid functions as a weak ion-pairing reagent, improving analyte retention on polar stationary phases like a C8 column and reducing basic impurities' ionic interaction with the stationary phase. Additionally, formic acid helps adjust the mobile phase's pH, which is crucial for maintaining the ionization state of analytes and impurities, ultimately leading to better chromatographic performance, peak shape, and resolution. Optimizing the pH enhances analyte and impurity retention and separation. As a volatile acid, formic acid is frequently employed in LC-MS techniques to boost ionization. Its acidic mobile phase facilitates sartan ionization and separation from azido impurities. Fig. 5 presents the representative chromatograms showing elution and separation of azido impurities in the standard solution and sartan APIs. The retention times of AZBT, AZTT and AZBC were 4.48, 5.57 and 6.28 min, respectively, while the retention times of olmesartan medoxomil, irbesartan and losartan were 2.91, 3.11, and 3.65, respectively. According to this chromatographic condition, azido impurities were completely separated and eluted after all sartan matrices elution. To prevent mass spectrometer contamination with a high concentration of sartan matrices, the divert valve is added to the LC system to bypass those into waste portions during 0–4.0 min. Chromatographic optimization is a beneficial strategy to remove any unwanted matrice from the analyte of interest and serves as a common high-throughput quantitative screening method. Acetonitrile was selected as the organic modifier in the mobile phase due to the potential peak splitting of AZBC induced by methanol, as evidenced in Fig. 1S of the supplementary material. Additionally, formic acid was added to acetonitrile in order to maintain its concentration during mobile phase gradient elution.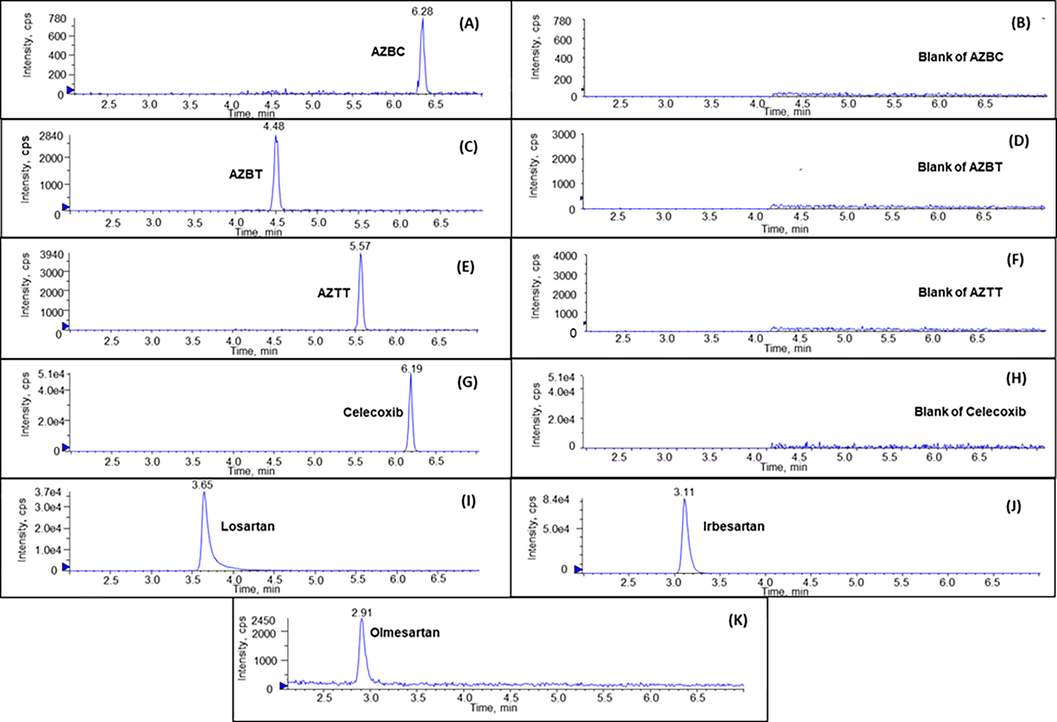
Representative chromatograms of (A) AZBC, (B) Blank of AZBC (C) AZBT, (D) Blank of AZBT (E) AZTT, (F) Blank of AZTT, (G) celeccoxib, (I) losartan, (J) irbesartan, and (K) olmesartan.
Regarding sample preparation, the choice of 80% ACN in water as a diluent in the analysis of azido impurities in sartan samples mainly stems from its capacity to efficiently dissolve both sartan drugs and their azido impurities. Azido impurities, being polar and basic, can exhibit poor solubility in water or other aqueous solvents. In contrast, ACN possesses high solvating power for numerous organic compounds, including polar and basic substances, making it an ideal solvent for dissolving both sartan drugs and their azido impurities compared to methanol. The use of an IS is another practical approach to compensate for signal instability and to improve accuracy and precision. The chromatographic properties and ionization properties of an IS should be similar to an analyte of interest. A deuterated isotope of an analyte is preferably practical to use as an internal standard. However, it is often relatively expensive and not commonly available in a routine laboratory. In this work, celecoxib was chosen as the IS since it was eluted at 6.19 min, which was after all sartan matrices elution and appeared between the retention time of azido impurities (Fig. 5G). The authentic solution and all the spiked samples achieved an excellent peak shape and desired signal sensitivity without interferences.
3.2 Method validation
3.2.1 System suitability
System suitability was evaluated at the beginning of each experiment. The standard mixture solution of azido impurities and IS was injected for five replicates. The %CVs of the peak area ratio of AZBC, AZBT, and AZTT were 7.97, 4.47, and 3.16, respectively. The %CVs of retention time of AZBC, AZBT, and AZTT were 0.53, 0.34, and 0.21%, respectively, indicating the suitability of the chromatographic system before the beginning of the analysis. The signal-to-noise ratios of AZBC, AZBT, and AZTT were 14.3, 40.7, and 24.2, respectively. Representative chromatograms of system suitability are illustrated in supplementary material section 2.1. In line with the ICH guidelines, chromatographic peaks are deemed acceptable if their symmetry factor falls between 0.8 and 1.5. In our study, the symmetry factors for all analytes were below 1.3, adhering to the acceptable range specified by the ICH guidelines.
3.2.2 Specificity
The specificity of the method was investigated on diluent (80% ACN) and various sartans including losartan potassium, irbesartan, and olmesartan medoxomil. No co-eluting peak and interference signal presenting at the same m/z and retention time of azido impurities and the IS were observed, indicating the specificity of the method in the presence of sartan APIs and diluent (Fig. 5A-H). Furthermore, as illustrated in Fig. 5I-K, all validated sartan matrices were eluted prior to their corresponding azido impurities, which were subsequently diverted into waste.
3.2.3 Carryover
Carryover testing was performed by injecting a blank sample after the highest concentration of the calibration sample in triplicate experiments to ensure that no signal from the analyte and IS was carried on from the previously analyzed sample. The carryover was calculated as the percent response (% interference) in the blank sample compared to the response in the lowest calibration sample (LOQ concentration). The carryover effect was determined to be negligible, with all analytes and the internal standard exhibiting percentage interference values below 5% as demonstrated in Table 1.
3.2.4 Linearity and range
Linearity was evaluated by analyzing the standard solutions at various concentrations ranging from 5.00 to 100.00 ng/mL for AZBC and 0.50 to 75.00 ng/mL for AZBT and AZTT. Representative chromatograms of this experiment are depicted in supplementary material section 2.2. Calibration curves were plotted from the concentrations of the analyte against the peak area ratios between the analyte and the IS. The homoscedasticity was tested, and a weighted-linear least square model with a weighting factor of 1/x2 was applied as it provided the best fit. The analytical procedure was linear over the concentration range tested with a coefficient of determination (r2) greater than 0.995. The %deviation values of the mean back-calculated concentrations and actual AZBC concentrations were between −5.32 and 3.67 with a %CV of ≤ 6.64. For AZBT, %deviation values of the mean back-calculated and actual AZBT concentrations were between −1.72 and 2.83 with %CVs of ≤ 3.85. For AZTT, %deviation values of the mean back-calculated and actual AZTT concentrations were between −1.61 and 2.51 with %CVs of ≤ 2.54. The residual plots and regression generated using a one-way analysis of variance were also evaluated. As the results show in Table 2S of the supplementary material, the F values (Fcal) of all regression lines were significantly more than the F values (FANOVA), indicating that a good linear relationship between the peak response ratio from the instrument (y) and the concentration of the analyte (x) was achieved. The p values of the slope and y-intercept were also determined. It was found that the p values of the slope were<0.05 while the p values of the intercept were more than 0.05, indicating that the slope of all regression lines was significantly different from zero, whereas the intercepts of all regression lines were insignificantly different from zero (see supplementary material, section 1). Consequently, a single-point calibration standard can be applied for the routine analysis of azido impurities.
Compound
Matrix
Dynamic range (ng/mg)
Slope
y-intercept
r2
AZBC
losartan potassium
1.00 – 20.00
0.0424
−0.0059
0.996
irbesartan
1.00 – 20.00
0.0411
0.0014
0.997
olmesartan medoxomil
1.00 – 20.00
0.0407
0.0009
0.995
AZBT
losartan potassium
0.10 – 15.00
2.0267
0.0275
0.999
irbesartan
0.10 – 15.00
2.0021
0.0502
0.999
olmesartan medoxomil
0.10 – 15.00
2.0045
0.0103
0.999
AZTT
losartan potassium
0.10 – 15.00
1.0500
0.0014
0.998
The range was used to demonstrate the ability of the analytical procedure to elicit test results that are directly proportional to the concentrations of analyte in sample matrices within a given dynamic range by a well-defined mathematical transformation. The linear relationships between the spiked concentration of AZBC and AZBT were evaluated in the losartan potassium, irbesartan, and olmesartan medoxomil API matrices. For AZTT, the linear relationships were assessed in the losartan potassium API matrix. Representative chromatograms of this experiment are presented in supplementary material section 2.3. The results are summarized in Table 2. All calibration curves had a coefficient of determination (r2) greater than 0.99 and were linear over the concentration ranges of 1.00–20.00 ng/mg for AZBC and 0.10–15.00 ng/mg for AZBT and AZTT. For impurities detected beyond the validated range, sample dilution should be considered to adjust the assay concentration to fall within the validated range. Consequently, if any impurities are identified above the validated range, the sample can be diluted to bring the assay concentration into the validated range.
3.2.5 Accuracy and precision
Within-run and between-run accuracy and precision were evaluated at three levels of the QC samples. For AZBC, the QC samples were prepared by spiking AZBC in losartan potassium, irbesartan, and olmesartan medoxomil API matrices at the concentration of 1.00 (LOQ), 5.00 (MQC), and 15.00 (HQC) ng/mg. In losartan potassium, the spiked QC samples of AZBC for within-run and between-run accuracy and precision exhibited %recoveries with %CVs ranging from 102.11 − 104.41 (%CVs = 4.69–6.68) and 99.54–102.14 (%CV = 4.57–7.35), respectively. In irbesartan, the within-run and between-run accuracy and precision of AZBC had %recoveries with %CVs varied from 100.76 − 107.22 (%CV = 4.96–6.38) and 100.08–102.61 (%CV = 4.65–7.82), respectively. In olmesartan medoxomil, within-run and between-run accuracy and precision of AZBC were found in the range from 97.41 − 108.83 (%CV = 2.93–6.42) and 98.54–102.95 (%CV = 4.45–9.07), respectively. For AZBT, the spiked QC samples were evaluated in losartan potassium, irbesartan, and olmesartan medoxomil API matrices at the concentration of 0.10 (LOQ), 2.00 (MQC) and 10.00 (HQC) ng/mg. The %recoveries with %CVs ranged from 101.47 − 105.10 (%CV = 1.18–2.11) and 100.91–103.10 (%CV = 2.45–9.97) for within-run and between-run accuracy and precision in losartan potassium, respectively. The within-run and between-run accuracy and precision in irbesartan varied from 97.98 − 102.68 (%CV = 0.74–3.23) and 97.98–103.41 (%CV = 2.10–2.91), respectively. The spiked QC samples of AZBT in olmesartan medoxomil for within-run and between-run accuracy and precision exhibited %recoveries with %CVs values ranging from 98.99 − 103.03 (%CV = 1.01–4.01) and 98.99–105.42 (%CV = 2.30–3.10), respectively. For AZTT, within-run and between-run accuracy and precision were evaluated in losartan potassium at the concentration of 0.10 (LOQ), 2.00 (MQC) and 10.00 (HQC) ng/mg and %recoveries with %CVs were found in the range of 96.93–98.99 (%CV = 2.47–6.53) and 97.22–100.01 (%CV = 2.10–5.19), respectively. Representative chromatograms of these experiments are presented in supplementary material section 2.4. The results summarized in Table 3 showed that the reliability of the proposed method was achieved.
compound
Sample matrix
Nominal conc. (ng/mg)
Within-run (n = 3)
Between-run (n = 6)
Mean back-calculated conc. (ng/mg)
Accuracy (%recovery)
Precision (%CV)
Mean back-calculated conc. (ng/mg)
Accuracy (%recovery)
Precision (%CV)
AZBC
losartan potassium
1.00
1.04
104.41
6.68
1.02
102.41
7.35
5.00
5.11
102.11
4.69
4.98
99.54
4.57
15.00
15.55
103.70
4.91
15.18
101.17
4.96
irbesartan
1.00
1.07
107.22
6.38
1.03
102.61
7.82
5.00
5.18
103.55
4.96
5.00
100.08
5.33
15.00
15.11
100.76
5.55
15.07
100.45
4.65
olmesartan medoxomil
1.00
1.09
108.83
6.42
1.02
101.60
9.07
5.00
4.87
97.41
2.93
4.93
98.54
5.89
15.00
15.45
102.99
4.42
15.44
102.95
4.45
AZBT
losartan potassium
0.10
0.10
105.10
2.11
0.10
102.02
9.97
2.00
2.03
101.47
2.09
2.02
100.91
2.66
10.00
10.49
104.89
1.18
10.31
103.10
2.45
irbesartan
0.10
0.10
97.98
3.23
0.10
97.98
2.91
2.00
1.98
99.19
0.74
2.04
101.83
2.86
10.00
10.27
102.68
1.17
10.34
103.41
2.10
olmesartan medoxomil
0.10
0.10
98.99
4.01
0.10
98.99
3.10
2.00
2.02
101.12
1.36
2.06
102.89
2.30
10.00
10.30
103.03
1.01
10.54
105.42
2.68
AZTT
losartan potassium
0.10
0.10
98.99
6.53
0.10
100.01
5.19
2.00
1.97
98.73
2.47
1.99
99.70
2.10
10.00
9.69
96.93
3.17
9.72
97.22
2.39
3.2.6 LOD and LOQ
According to ICH Q2 (R1) (The International Conference on Harmonization, 2005), the LOD and LOQ of each azido impurity were estimated based on the calibration curve of the corresponding azido impurity. The LOD obtained from the calibration curve, namely calculated LOD, was 0.49, 0.25, and 0.16 ng/mg for AZBC, AZBT, and AZTT, respectively (see supplementary material, section 1). The LOQ obtained from the calibration curve, namely calculated LOQ, was 1.48, 0.77, and 0.49 ng/mg for AZBC, AZBT, and AZTT, respectively (see supplementary material, section 1). Representative chromatograms of LOD and LOQ are demonstrated in supplementary material section 2.5.
We further confirmed LOD and LOQ obtained from the calculation by experiments using the S/N or the accuracy and precision criteria. The experimental results indicated that LOD was 0.50 ng/mg for AZBC and 0.05 ng/mg for AZBT and AZTT, in which the S/N greater than 3 with %CV of five replicate injections < 10 was archived. The LOQ was 1.00 ng/mg for AZBC and 0.10 ng/mg for AZBT and AZTT, in which S/N greater than 10 with % recovery of 90–110 and %CV of five replications < 15 was accomplished. The % recoveries with %CVs were 98.95 (%CV = 6.87), 100.41 (%CV = 6.85), and 97.36 (%CV = 8.23) for AZBC in losartan potassium, irbesartan, and olmesartan medoxomil, respectively. For AZBT, the %recoveries and %CVs in losartan potassium, irbesartan, and olmesartan medoxomil were 91.91 (%CV = 8.39), 97.23 (%CV = 4.41), and 99.75 (%CV = 2.18), respectively. The %recovery with %CV for AZTT in losartan potassium was 96.38 with a %CV of 5.91.
There are no specific acceptable intake limits for azido impurities in losartan, irbesartan, and olmesartan; instead, the limit criteria are based on the “Threshold of Toxicological Concern” (TTC) concept. This concept establishes the maximum allowable amounts of lifetime exposure with negligible cancer risk to humans. In accordance with the TTC concept, the acceptable daily intake of azido impurities is set at 1.5 µg, linked to a minimal risk over a period of more than 10 years to a lifetime. Consequently, the limit criteria for azido impurities in losartan, irbesartan, and olmesartan are set at 10, 5, and 18.75 ng/mg (ppm), respectively, considering the maximum daily doses for these drugs, which are 150, 300, and 80 mg, respectively. The method LOQs for azido impurities reported in this work are much lower than acceptable limits proposed in ICH guideline M7(R1) (limit criteria = 10.00, 5.00, and 18.75 ng/mg for azido impurities in losartan potassium, irbesartan and olmesartan medoxomil, respectively) (The International Conference on Harmonization (ICH), 2017). The results demonstrated that the method could be applied for azido impurities analysis in sartan APIs. The results are summarized in Table 4.
Compound
matrix
LOQ (n = 5)
LOD (n = 5)
Nominal conc. (ng/mg)
Accuracy (%recovery)
Precision (%CV)
S/N
Nominal conc. (ng/mg)
%CV
S/N
AZBC
losartan potassium
1.00
98.95
6.87
15.0
0.50
6.81
9.5
irbesartan
100.41
6.85
12.2
olmesartan medoxomil
97.36
8.23
12.2
AZBT
losartan potassium
0.10
91.91
8.39
46.7
0.05
4.05
17.4
irbesartan
97.23
4.41
31.1
olmesartan medoxomil
99.75
2.18
35.3
AZTT
losartan potassium
0.10
96.38
5.91
26.6
0.05
3.34
9.8
3.2.7 Robustness and stability
The use of statistical design and analysis of experiments based on P-B partial factorial design and multivariate to simultaneously determine multiple parameters that affect the response of analysis is recommended for evaluation of the method’s robustness. The designed experiment runs were generated using the Design Expert Software trial version 13 (Stat-Ease Inc. Minneapolis, MN, USA). The studied results are described in Table 3S of the supplementary material. To estimate the effects of the factors (Ex) on the responses, the computation of the factor effects (Ex) and critical effects (Ecrit) is summarized in Table 4S of the supplementary material. Absolute effect values (|Ex|) of each studied factor (Fx) are less than the critical effects (Ecrit) of the corresponding responses. The results imply that the studied factors have no statistically significant impact on the content determination of AZBC, AZBT, and AZTT in the spiked losartan sample.
Regarding the stability studies, the stock solutions of azido impurities and celecoxib IS were evaluated at 2–8 °C for 15 days. In addition, the lowest and highest concentrations of working standard solutions under 25 °C were assigned to demonstrate benchtop stability for 8 h. In addition to the standard solution stability study, the stability in the autosampler of the sample at 15 °C for 1 day was evaluated to estimate the appropriate analysis time after sample preparation. The percent deviation values of all analytes at specified periods under the assigned conditions were in the range of −3.5 to 2.9%. The results summarized in Table 5 demonstrated that all samples were relatively stable at particular storage conditions and times.
Solution
Compound
Storage Condition
Deviation (duration)
Stock standard solution (0.5 mg/mL)
AZBC
2–8 °C
−3.5% (15 days)
AZBT
−2.2% (15 days)
AZTT
2.6% (15 days)
Stock internal standard (0.5 mg/mL)
celecoxib
−1.7% (15 days)
Working standard solution (500 ng/mL)
AZBC
25 °C
−2.3% (8 h)
Working standard solution (50 ng/mL)
AZBT
0.9% (8 h)
AZTT
1.9% (8 h)
Working standard solution (10000 ng/mL)
AZBC
−1.2% (8 h)
Working standard solution (7500 ng/mL)
AZBT
2.5% (8 h)
AZTT
0.5% (8 h)
Spiked losartan (5 ng/mg)
AZBC
Autosampler at 15 °C
2.8% (24 h)
AZBT
−2.8% (24 h)
AZTT
−1.8% (24 h)
Spiked irbesartan (5 ng/mg)
AZBC
0.8% (24 h)
AZTT
−2.7% (24 h)
Spiked olmesartan (5 ng/mg)
AZBC
−0.3% (24 h)
AZTT
2.9% (24 h)
3.3 Application for azido impurities determination in sartan APIs and finish products
The validated method was applied to quantify azido impurities content in nine samples including six losartan potassium tablets, two losartan potassium APIs, one irbesartan API and one olmesartan API. The samples were obtained from various sources. The analysis was performed in 3 replicates for each sample, and the analysis results are summarized in Table 6. No AZBC in sartan samples was detected at a concentration higher than its detection limit. For AZBT, four losartan potassium tablet samples, one losartan potassium API and one irbesartan API were found above the method LOQ of 0.10 ng/mg but were lower than acceptable limits of 10.0 and 5.0 ng/mg for losartan and irbesartan, respectively. For AZTT, four losartan potassium tablets contained an AZTT content above 100.00 ng/mg, which is much higher than the acceptable limit. The representative chromatograms of AZBC, AZBT and AZTT in losartan potassium API samples are shown in Fig. 6. *AZBC: LOD = 0.5 ng/mg; LOQ = 1 ng/mg, **AZBT: LOD = 0.05 ng/mg; LOQ = 0.1 ng/mg.
Sample name
AZBC (ng/mg)*
AZBT (ng/mg)**
AZTT (ng/mg)**
Average
%CV
Average
%CV
Average
%CV
Losartan potassium Tablet brand 1
< LOD
–
< LOD
–
< LOD
–
Losartan potassium Tablet brand 2
< LOD
–
0.81
2.14
152.77
3.12
Losartan potassium Tablet brand 3
< LOD
–
1.89
3.41
227.31
2.54
Losartan potassium Tablet brand 4
< LOD
–
2.74
3.52
315.70
3.72
Losartan potassium Tablet brand 5
< LOD
–
5.60
4.13
303.24
3.98
Losartan potassiun API 1
< LOD
–
< LOD
–
< LOD
–
Losartan potassiun API 2
< LOD
–
0.17
3.25
1.33
2.96
Irbesartan API 1
< LOD
–
< LOD
2.92
–
–
Irbesartan API 2
< LOD
–
< LOD
–
–
–
Olmesartan medoxomil API
< LOD
–
< LOD
–
–
–
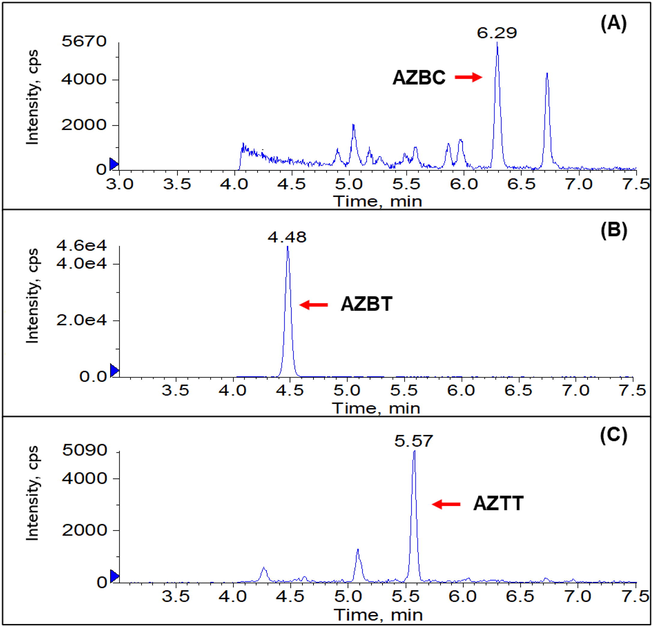
Representative chromatograms of AZBC, AZBT and AZTT in losartan potassium APIs samples.
4 Conclusion and future perspectives
The LC-MS/MS method for genotoxic azido impurity determination has been successfully developed and fully validated according to the ICH Q2 (R1) guideline (The International Conference on Harmonization, 2005). The advantage of this work is the determination of three organic azido impurities in a single injection with a short analysis time of 11.0 min. The sufficient sensitivity of the method serving the acceptable limit criteria of azido impurities for various sartans as per the ICH M7 requirement (The International Conference on Harmonization, 2017) is another highlight of the developed method. More importantly, sample preparation of the method is simple and suitable for application in routine laboratories. Lastly, the described method has successfully been applied to analyze sartan APIs and commercial medicinal products.
Recently, the greenness of analytical methods has gained attention and emerged as a challenging consideration. In evaluating the greenness of our analytical method for simultaneous determination of three organic azide impurities in sartan APIs and products, we conducted a qualitative assessment of the environmental impact of solvents, energy consumption, waste generation, safety, and analytical performance (see details in the supplementary material, Section 3). In summary, our method uses a low concentration of formic acid in water and acetonitrile as solvents, with minimal consumption due to a low flow rate. Although acetonitrile is known to have a moderate environmental impact due to its toxicity and non-biodegradability, considering recycling and greener solvent alternatives like isopropyl alcohol can be beneficial. However, it is important to note that method optimization and validation might be necessary when implementing these changes. The centrifugation and filtration steps employed in the sample preparation method are expected to result in minimal waste generation compared to liquid–liquid extraction and solid phase extraction techniques, as the filtered sample solution is directly transferred to a vial for subsequent analysis. Energy consumption arises from the operation of the LC-MS/MS system, mass spectrometer, and auxiliary equipment such as temperature control units, and we recommend optimizing analysis times and instrument settings and considering energy-efficient equipment. In developing and validating our analytical method, we have carefully addressed important concerns related to waste management and safety. Waste management strategies implemented during this process include minimizing solvent usage, promoting recycling practices, and ensuring proper disposal of solvent and consumable wastes. Additionally, safety measures have been taken into account, including proper storage of chemicals, use of personal protective equipment, maintaining adequate ventilation, efficient spill management, responsible waste disposal, and providing necessary training to the personnel involved. The method's strong analytical performance, including sensitivity, accuracy, precision, and other validation parameters, contributes to its greenness, reducing complicated sample preparation steps, reanalysis and minimizing resource use, and waste generation.
Acknowledgments
The authors thank Dr. Khent Primo Alcantara, Chulalongkorn University for providing technical support and helpful discussion for the experimental design of Plackett-Burman in the robustness experiment. This work was supported by the Ratchadaphiseksomphot Endowment Fund, Chulalongkorn University for the Center of Excellence in Natural Products for Ageing and Chronic Diseases under Grant No. GCE 3330170003 (Pornchai Rojsitthisak).
Human and animal rights
This article does not contain any studies with human or animal subjects performed by any authors.
Declaration of Competing Interest
The authors declare that they have no known competing financial interests or personal relationships that could have appeared to influence the work reported in this paper.
References
- Barwick, V., 2003. A Guide to Best Practice: Preparation of Calibration Curves. LGC/VAM/2003/032., 1-27.
- Hypertension hot potato-Anatomy of the angiotensin-receptor blocker recalls. N. Engl. J. Med.. 2019;380:1589-1591.
- [CrossRef] [Google Scholar]
- Gričar, M., Andrenšek, S., 2016. Determination of azide impurity in sartans using reversed-phase HPLC with UV detection. J. Pham. Biomed. Anal. 125, 27−32. https://doi.org/ 10.1016/j.jpba.2016.03.020.
- He, Z., Zhao, L., Liu, X., et al, 2020. The application of in-source fragmentation in ultra-high performance liquid chromatography-electrospray ionization-tandem mass spectrometry for pesticide residue analysis. J. Chrom. A. 1633, 461637. https://doi.org/ 10.1016/j.chroma.2020.461637.
- The determination of two analogues of 4-(azidomethyl)-1,1′-biphenyl as potential genotoxic impurities in the active pharmaceutical ingredient of several sartans containing a tetrazole group. J. Pham. Biomed. Anal.. 2021;205:114300-114306.
- [CrossRef] [Google Scholar]
- Recent developments in the synthesis of tetrazoles and their pharmacological relevance: a review. Curr. Org. Chem.. 2021;25:1-16.
- [CrossRef] [Google Scholar]
- Assessment of liquid chromatographic method robustness by use of Plackett-Burman design. Acta. Chromatogr.. 2010;22(2):281-296.
- [CrossRef] [Google Scholar]
- Determination of genotoxic azide impurity in Cilostazol API by Ion chromatography with matrix elimination. Separations. 2021;8:162.
- [CrossRef] [Google Scholar]
- Synthesis and Functionalization of 5-Substituted Tetrazoles: a microreview. Eur. J. Org. Chem.. 2012;31:6101-6118.
- [CrossRef] [Google Scholar]
- The effect of alternating fragmentor voltages of LC-MS in full scan mode on data quality: a comparative study. Chemom. Intell. Lab. Syst.. 2022;228:104625
- [CrossRef] [Google Scholar]
- The International Conference on Harmonization (ICH), 2005. ICH Harmonized Tripartite Guideline. Validation of Analytical Procedures: Text and methodology Q2(R1), Current Step 4 version, 1-17.
- The International Conference on Harmonization (ICH), 2017. ICH Harmonized Guideline on Assessment and Control of DNA Reactive (Mutagenic) Impurities in Pharmaceuticals to Limit Potential Carcinogenic Risk M7(R1), Current Step 4 version, 1-119.
- The National Formulary. Irbesartan. USP 31-NF 26. Pharmacopeia: Rockville, MD, USA: United States; 2008. p. :2446.
- A novel simple and precise method for the determination of azide impurity in sartans using headspace gas chromatography with two dissimilar capillary columns and two flame ionization detectors (HS-GC-FID/FID) J. Pham. Biomed. Anal.. 2020;192:113671
- [CrossRef] [Google Scholar]
- An update on the current status and prospects of nitrosation pathways and possible root causes of nitrosamine formation in various pharmaceuticals. Saudi Pharm. J.. 2023;31:295-311.
- [CrossRef] [Google Scholar]
- Bioisosteres in drug discovery: focus on tetrazole. Future Med. Chem.. 2020;12:91-93.
- [CrossRef] [Google Scholar]
Appendix A
Supplementary data
Supplementary data to this article can be found online at https://doi.org/10.1016/j.arabjc.2023.104951.
Appendix A
Supplementary data
The following are the Supplementary data to this article:Supplementary data 1
Supplementary data 1


