

Translate this page into:
Development, characterization and evaluation of composite adsorbent for the adsorption of crystal violet from aqueous solution: Isotherm, kinetics, and thermodynamic studies
⁎Corresponding author. mohsuly1@pg.edu.pl (Mohamed Sulyman)
-
Received: ,
Accepted: ,
This article was originally published by Elsevier and was migrated to Scientific Scholar after the change of Publisher.
Abstract
Abstract
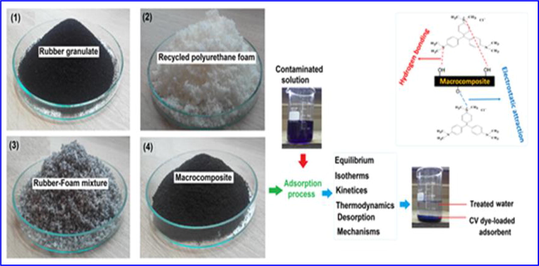
The purpose of this work focuses on the production and investigations of a new composite material as alternative low-cost adsorbent for the removal of crystal violet (CV) dye from waste solution. The production method was performed by in-situ thermal activation technology via extrusion process of polymer wastes containing tire rubber (50 wt%) and polyurethane foam (50 wt%) using single-screw extruder under processing temperature of 180 °C and shearing rate 100 rpm. The physico-chemical properties of the materials obtained were examined such as bulk density, zero surface charge (pHpzc), Brunauer-Emmett-Teller (BET) surface area, as well as samples tested by infrared absorption spectroscopy (FT-IR), scanning electron microscopy (SEM). X-ray fluorescence spectroscopy (WD-XRF). Thermogravimetric analysis (TGA). These techniques were additionally applied to the full characteristics of the composite materials obtained. The impacts of solution pH (3.0–9.0), adsorbent dosage (0.1–1.0 g) and initial adsorbate concentration (in range 10 –90 mg/l) on adsorption capacity of the investigated adsorbent were studied. From our investigation we found that adsorption equilibrium was achieved within 200 min. The maximum monolayer adsorption capacity (qmax) for our composite adsorbent were obtained from the Langmuir equation and equaled 20.92 mg/g. Mathematical analysis has shown that the pseudo second kinetic model of the order describes the kinetics of the adsorption process well.
Keywords
Polymer composite
Extrusion process
Crystal violet (CV) adsorption
Low-cost adsorbent
Kinetics

1 Introduction
Today, wastewater treatment is one of the major emerging field for research due to increasing rate of population (Gupta et al., 2009, Fadzil et al., 2015, Zwain et al., 2014, Markandeya et al., 2017), fast industrialization, domestic wastewater production, utilize wastewater in agriculture, and fast geological, environmental, and global changes. Many scientific reports indicates that the fresh water that is available for use is in very little amount, approximately 1.0% of the total water on earth (Gupta et al., 2009). However, the consumption of water is still growing worldwide, which is followed by increase in the generation of a large volume of waste effluents every day, containing hazardous materials that have harmful effects to both human and aquatic life (Rudi et al., 2020, Abdel-Raouf and Abdul-Raheim, 2017, Chuah et al., 2005). Such reasons, about 844 million people do not have a basic drinking water source and about 230 million people take over 30 min daily for collecting water from clean water streams (Joseph et al., 2019). It was reported that about 300–400 million tonnes of synthetic dyes, heavy metals, toxic sludge, solvents, chemicals, oil, acids and alkalis, salts, surfactants, industrial wastes and other hazardous substancese are still end up into the environment every year (Sulyman et al., 2020a,b; Rudi et al., 2020).
Dyes are widely used in many areas such as staining paper, leather, rubber, textiles, plastics, etc. (Markandeya et al., 2017, Deniz and Yildiz, 2019, Dawood and Sen, 2014). It is approximated that over 100,000 commercial dyes are industrially used and more than 700,000 tons of dyestuff are produced every year worldwide (Markandeya et al., 2017; Deniz and Yildiz, 2019; Chikri et al., 2020). In the world, the total colorant production is estimated to be 800,000 tons/year (Lim et al., 2013), and up to about 15% of dyes are lost in the effluent during the dyeing system (Foo and Hameed, 2010). Color effluents have existed since the dyeing technology is first started. It is among the earliest pollutants to be observed in wastewater (Lim et al., 2013).
Several of conventional processes such as precipitation or coagulation methods have been used to remove dyes present in industrial (Mouni et al., 2018, Sulyman et al., 2016; Chikri et al., 2020). However, most of these processes are not good economically and environmentally approaches, due to high-operating cost, and they have low efficiency in treat a wide range of dye wastewater, toxic by product formation, high chemical requiment; they also generate a ton of secondary waste (sludge disposal) after removal process or even during the synthesis of adsorbents (Chuah et al., 2005, Deniz and Yildiz, 2019, Saad et al., 2010; Soleimani et al., 2019). Among other, adsorption is one of the most widely used technologies in treating polluted water to reduce hazardous contaminants present in industrial effluents (Sulyman et al., 2020a,b; Chuah et al., 2005; Chikri et al., 2020).
Commercial activated carbon (CAC) is a preferred adsorbent for dye removal due to its excellent adsorption efficiency, but its use is limited due to its relatively high cost and its regeneration problems (Chikri et al., 2020; Abdel-Raouf and Abdul-Raheim, 2017, Yagub et al., 2014). On the other hand, the management and recycling way of polymer tire rubbers (WTR) are still a challenge for industry, engineers, and scientists, due to the cross-linked structure. Due to the high amount of rubber presented in scrap tires, approximately 47% (Bhattia et al., 2017), scrap tires constitute about 80% of the total waste rubbers generated annually (Zedler et al., 2020). Another big issue of waste to the environment nowadays is flexible polyurethane foams (PUF). Polyurethane foam wastes mainly come from the production process of leftover materials and product scraps (Yanga et al., 2012).
Currently, development of environment friendly method for producing a new material from recycled polymers are gaining importance as a new technology for the researchers and industrial applications. Composite materials created from such wastes could offer many significant advantages in the resulting composites regarding the compatibility, mechanical properties and applications, as, rubbers and polyurethane foam wastes are elastic materials. Polyurethane (PU) is a material with excellent hydrodynamic properties and has been utilized as a solid phase for removing dyes from textile effluent (de Neta et al., 2011; El-Bouraie, 2015; Moawed et al., 2015), for adsorptive uptake of havey metals from aqueous solution (Moawed et al., 2013). PU has also been used for oil spill clean up (Lin et al., 2010; Nikkhah et al., 2015).
Therefore, we have obtained adsorbent consisting of a mixture of industrial waste containing rubber granules (RG) and waste from polyurethane foam (PUF) and subjected this sorbent different tests, as a novel, alternative and environmentally friendly composite for adsorption of crystalline dye (CV) from contaminated aqueous solutions.
The main objectives of our work are listed as follow: 1) The describe an eco-friendly method that has been used to produce a new composite based adsorbent via extrusion process. 2) The investigate the possibility of converting polymer wastes such as rubber tires and polyurethane foam wastes into an industrially viable and low-cost adsorbent. This utilizing of wastes will minimize the landfill space occupied by scrap tires disposal and can provide a cost-effective alternative to the existing commercial activated carbon. 3) The investigate of the kinetics, equilibrium, and thermodynamics of CV dye removal by polymer composite. 4) The estimate and optimize the parameters controlling the rate of adsorption. 5) The use of a thermomechanical process under the influence of shear forces by using an extrusion technique to combine the properties of rubber granules and waste polyurethane foam into a single adsorbent was also one of the main purposes, which made these investigations as a novelty of this study. According to the best knowledge of the authors, no study has been done on production of composite containing rubber granulate and polyurethane foam using extrusion process for the adsorptive removal of hazardous dye from contaminated aqueous solution.
2 Materail and methods
2.1 Materials and adsorbent production
The rubber granulate (RG) was obtained from the grinding process of scrap car tires with a particle size ranging (0.20–0.80 mm) as shown in Fig. 1; it was supplied by Orzeł company in Poland. Scrap polyurethane foam (PUF) was collected from used sofa in a small pieces. The material collected was then washed completely with liquid soap and rinsed with distilled water to remove any impurities and followed was dried. The grinding process for polyurethane foam was repeated sevral times till enough mass was obtained for extrusion process. The required amount of RG and PUF was kept in an oven for drying at 107 ± 2 °C for 24 h. Second, a composite material from PUF and RG was produced during the extrusion process under processing temperature and shear rate of 180 °C and 100 rpm, respectively using single-screw extruder (Sulyman et al., 2020a,b). The weight fraction of RG to PUF was (50:50) and (75:25). Rate production of composites was about 1.0–1.25 kg/h. The composites thus obtained were kept at room temperature to coold down, and then stored in polyethylene bags for further use. No chemical treatment was used during or even before the processing of composites. Crystal violet (CV); molecular weight = 408g/mol; λmax = 584 nm, a cationic dye purchased from B.D.H Chemicals, Ltd., England was selected as the model adsorbate. CV dye solutions of varying concentrations were prepared from an aqueous stock solution (1.0 g per liter) in distilled water by using formula (1) (Sulyman et al., 2018), and the solution pH was adjusted by adding base (0.1 M NaOH) or acid (0.1 M HCl). Volume solution was kept constant at 150 ml for all experiments.
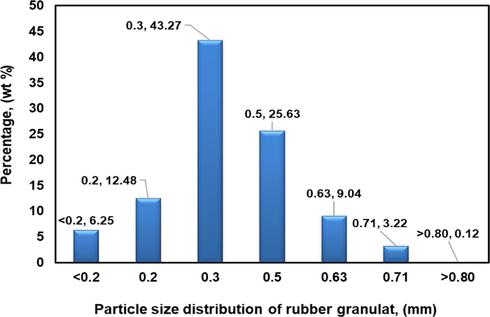
The particle size distribution of rubber granulate used in the study.
2.2 Characterization of the adsorbent
The X-ray fluorescence analysis was employed to identification chemical compositions of the composite adsorbent. The measurement was made in helium atmosphere, apparatus: (Bruker 1 kW WD-XRF model S8 Tiger spectrometer). The surface morphology of polyurethane, rubber granulate before and after the extrusion process, as well as polymer composite were characterized using a Zeiss EVO 40 scanning electron microscopy (SEM) acceleration voltage of 5 kV. The kind and number of functional groups on the adsorbent surface were studied using a Fourier Transformed Infrared (FTIR) spectrometer (Tensor 27 Bruker model) in the range of 500–4000 cm−1, with test parameters of 2 cm−1 resolution; 64 is the number of scans, and 4 mm is for spectral beam dimeter.
The point of zero charge of adsorbents charge (pHpzc) was determined as follows: the initial pH (pHinitial) was adjusted using 0.01 N HCl or 0.01 N NaOH solutions respectively, in the range of 2–12, using pH-meter (740 Inolab WTW model pH-meter with a SenTix 20 pH model double electrode). After that, about 50 mg of each sample was added to the aqueous solutions and incubated for 24 h at room temperature, stirred with rate of 150 rpm to obtaine the final value of pH (pHfinal) was measured. The difference between the initial and final pH values (ΔpH = pHf –pHi) for each series was plotted against the pHi. Finally, the pHpzc was estimated from the point where it crossed the ΔpH (pHi − pHf) = 0.0. Such procedure was reported for different adsorbens; acid activated gmelina aborea leaf (Bello et al., 2019a,b), for Kail sawdust charcoal (Gupta et al., 2019), and for halloysite-magnetite-based composite (Bonetto et al., 2015). Bulk density of the material was determined according to the procedure used in our previous works (Sulyman and Gierak, 2020; Al-Azabi et al., 2018). Thermo-gravimetric experiments were carried out on a TA instrument SDT Q 600 under nitrogen with a flow rate of 100 ml/min through a furnace nitrogen atmosphere, heating rate 20 °C/min up to 700 °C.
2.3 Adsorption studies
Adsorption experiments via a batch mode system were carried out as follow: fixed amount of composite was dispersed in a series of beakers (250 ml) containing 150 ml of CV dye of different concentrations (10–90 mg/l), then stirred at netural pH value (7 ± 0.35), 800 rpm and room temperature for 180 min. The effects of relevant factors affecting adsorption system including contact time (15–200 min), solution pH (3–9), adsorbent dose (0.1–1.0 g), and temperature (298–333 K) were investigated. Also, blank experiments without adsorbent were performed and the adsorption of the CV dye was determined from the difference in the initial and finale concentration of the solution. The change in concentrations of dyes was determined using UV–vis spectrophotometer. The stirring rate used throughout the adsorption process was 800 rpm. The amount of CV dye removal and percentage removal at equilibrium were estimated using Eqs. (2) and (3), respectively (Sulyman et al., 2018; Soleimani et al., 2019; Hashem et al., 2020). All the series of experiments were performed in triplicates and the average values of the CV dye removal were reported. All solutions were prepared using double distilled water.
2.4 Desorption experiments and adsorbent recycling
One of the important parameters to determine feasibility of the selected materials based-adsorbent on the large scale is its reusability (Jain and Gogate, 2018). To investigate the desorption behavior, the adsorbent was first loaded with CV dye as follows: 0.1 g of the composite was stirred with 25 ml of the contaminated solution (50 mg L−1) at stirring temperature of 50 °C, natural solution pH, 200 rpm for 90 min. After the adsorption, the loaded adsorbent was separated, washed with double distilled water to remove non adsorbed dye, and dried. Dried spent adsorbent was then shaken in 25 ml of 0.5 M HCl as absorbing agent via orbital shaker at room temperature and 200 rpm for 90 min. The residual concentrations of CV dye in the eluate were determined using UV–vis spectrometer. The recycled adsorbent was again washed with distilled water and tried. After that, adsorption-desorption experiments were repeated for five cycles under the same conditions. The desorption percentage was calculated from Eq. (4).
3 Results and discussion
3.1 Characterization of the adsorbents
3.1.1 Morphology and elemental compositions
The morphologies of the adsorbents including, polyurethane, rubber granulate before and after processing, as well as macrocomposites are presented in Figs. 2–4. Typically, the polyurethane foam without processing is open cells and highly porous material in its nature as shown in Fig. 2a (El-Bouraie, 2015). The external surface roughness and irregular grain shape of the rubber granulate became more pronounced as the extrusion process has been carried out at high temperature about 180 °C and shear rate of 100 rpm, as presented in Fig. 3a and b, respectively. Additionally, the surface morphology of rubber granulates and polyurethane foam composite at weight fraction of 50:50 and 75:25 are presented in Fig. 4a and b, respectively. In general, it can be observed that the surface area of adsorbents has been improved after using extrusion process, which revealed an irregular texture and porous cavities on the surface compared with that of unprocessed raw materials (rubber and polyurethane foams). The thermal processing of materials via extrusion process indicated partially de-vulcanization and breakdown of stronger crosslinkings of the RG and PUF. This behavior could be explained as a result the partially devulcanization of the rubber granulate and decomposition of the polyurethanes during the thermal-extrusion process. Thus, the surface area of powdered composites has been improved. Also, some volatiles particles have been diffused out through at high temperature and high shear rate and in this way developed the porous volume of composites. The results obtained indicated that the composites were excellent adsorbents with potential could replacement of the commercial activated carbon. Similar trend was observed for the production of activated carbon-based adsorbents (Lay et al., 2020, Selvaraju et al., 2017). Bulk density of the materials was found to be 0.420, 0.400, 0.392, and 0.080 g/ml for 100% rubber granulate (RG), 75 RG:25 PUF, 50 RG:50 PUF and 100% polyurethane foam (PUF).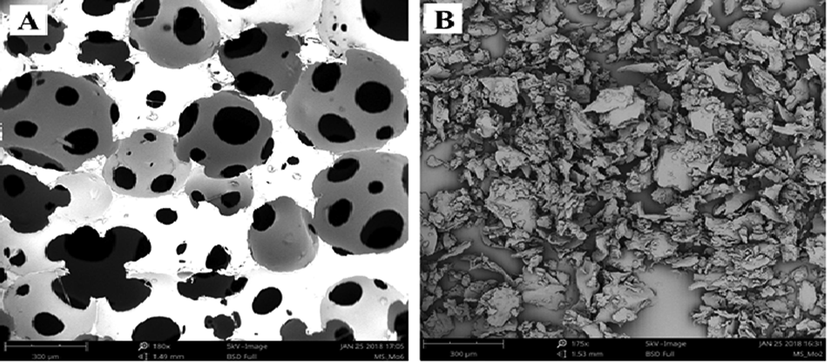
SEM images of raw PUF (a), and processed PUF (b).
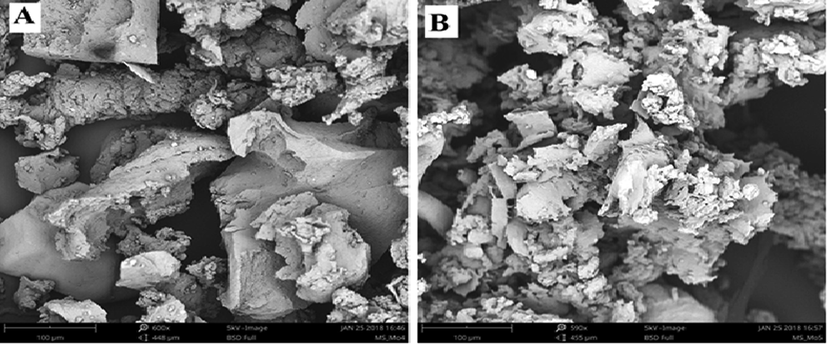
SEM images of raw rubber granulate (a), and processed rubber granulate (b).
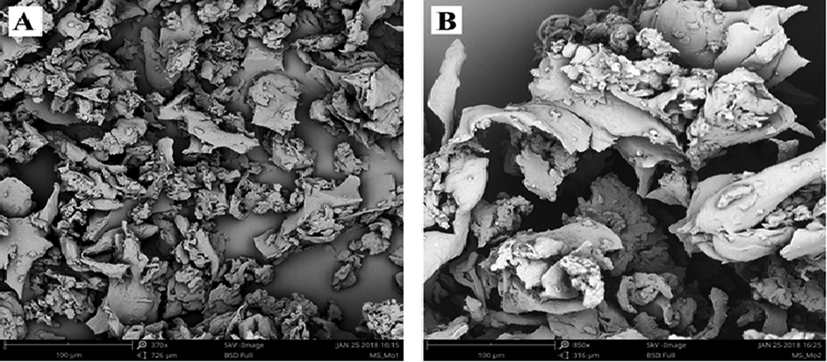
SEM images of composites; 50 RG:50PUF (a), and composites; 75 RG:25PUF (b).
3.1.1.1 Thermogravimetric analysis (TGA)
Thermogravimetry analysis is used to study the general behavior of thermal degradation of materials (Osayi et al., 2014), and thermal stability as well. Thermal stability of the composite is examined based on percentage weight loss at increase temperature, from TGA thermogram and compared it to that of samples of polyurethane foam and rubber granulate. Fig. 5 presented the TGA-DTG curve of polyurethane, rubber and composite adsorbent. From the graph, it can be seen that the decomposition of all samples has similar trends. There were no weight loss percentages for all samples until a temperature has reached 370 °C. However, there were a sharp weight loss percentage only around 400 °C for polyurethane foam and composite. While, in the case of rubber granulate, there was a two sharp weight loss around 400 °C and 437 °C, respectively. Simila behaviour has been reported by Osayi et al. (2014).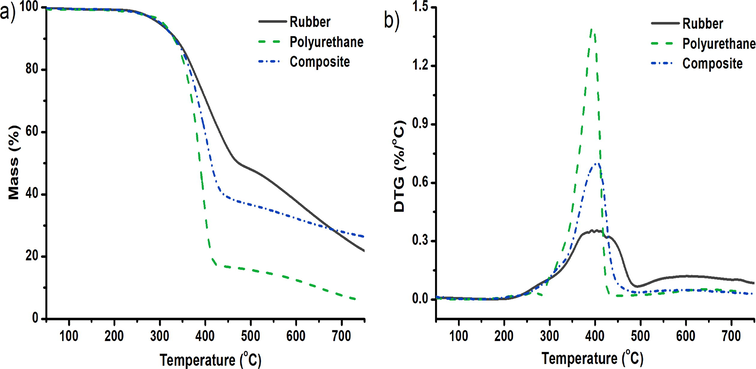
Thermogravimetric analysis of polyurethane foam, rubber, and polymer composite based-adsorbent.
3.1.1.2 FTIR analysis of composite
The functional groups present on the adsorbent surface can be identified by FTIR study since each group has a unique energy absorption band (Bhattia et al., 2017). FTIR spectra of the macrocomposite produced from rubber granulate and flexible polyurethane foam wastes, i.e. called as low cost and potential adsorbent had possessed the following functional groups (Fig. 6): the peaks at (3271–3306 cm−1) reveal the presence of amide (—NH) stretching or hydroxyl (—OH) group. Peaks with shoulders at 2845–2970 cm−1 were characteristics of alkyl chains. The peak at 1597 cm−1 may be associated with C⚌C of aromatics in polymer. A peak at 1709.67 cm−1 was attributed to the carbonyl (—C⚌O) stretching from carboxylic acids or amide. The peak around 1380.21 cm−1 can be attributed to the —COO— of the carboxylate group present on rubber surface. The presence of a small peak around 1000 cm−1 could be related to the phosphate group. For the polymer composite, the peak around 1709.67 cm−1 has been shifted to 1714.94 cm−1, while the peaks at (3271–3306 cm−1) were shifted to 3309 cm−1 as presented in Fig. 6c. After adsorption process the peak at 1714.94 cm−1 was shifted again to1710.66 cm−1. Such changing may be confirming the uptake of CV by polymer composite. Finally, Peaks at 890 cm−1 and down to 560.70 cm−1 indicated that aromatic units were still present within the material. Thus, the IR spectral study revealed that the adsorbent derived from composite contain mainly —OH and C⚌O functional groups which probably are mainly responsible for the adsorption of CV dye. A similar behavior was reported by Bhattia et al. (2017) when they investigated the use of waste tire rubber as adsorbent for the adsorptive uptake of Chromium Cr(III) and Cr(VI) from aqueous solution (Bhattia et al., 2017), and for adsorptive of malachite green by polyurethane foam functionalized with Salicylate (El-Bouraie, 2015).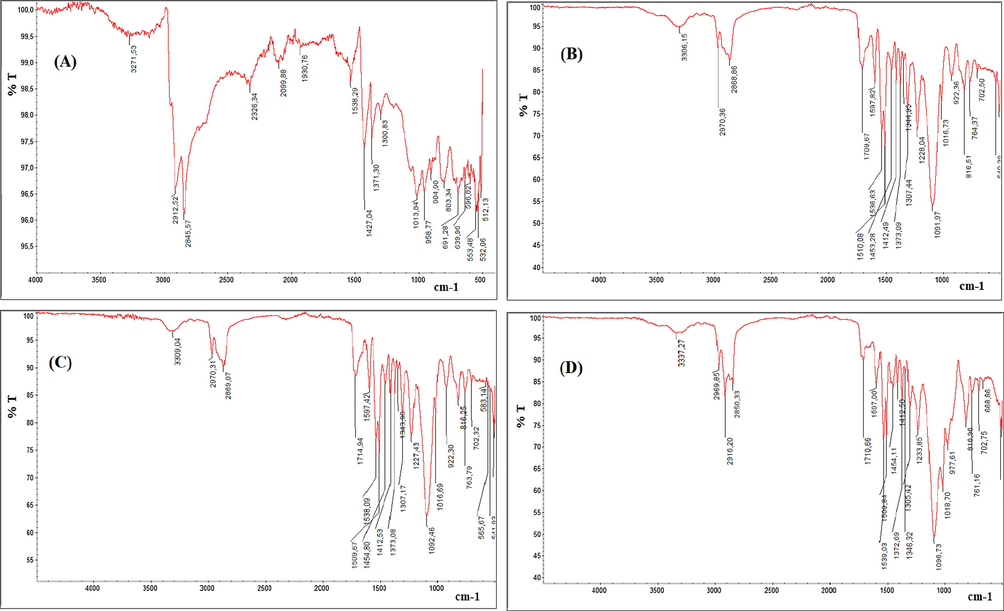
FTIR spectra of rubber (a), polyurethane foam (b), composite (c) and CV-loaded composite (d).
3.1.1.3 Surface area of polymer composite
In general, surface of materials such as natural and industrial wastes in either as raw materials or in form of activated carbon are pores in nature, containing micropores, mesopores and macro-pores (Khatoon and Rai, 2016). The micropores usually provide the largest proportion of the internal surface of the adsorbent and contribute to most of the total pore volume. While, mesopores and the macropores surface of adsorbents represent the external surface, and most of the adsorption takes place in the micropores. On the other hand, the mesopores and macropores are playing an important role in the adsorption system because they serve as passage for the substance to reach micropores. Moreover, the multilayer adsorption only takes place in mesopores and macropores (Mohamed, 2011). The BET surface area was investigated, and the procedure was carried out according to our previous studies (Sulyman et al., 2014; Sulyman et al., 2016). The obtained results compared to that reported in previous studies were listed in Table 1. While, Table 2 lists the chemical composition of rubber obtained from used by the application of wavelength dispersive X-ray florescent spectrometer (WDXRF) for inorganic elements and FLASH 2000 CHNS/S analyzer for CHNO. The chemical analysis has revealed that tire-derived rubber is characterized by a lettel high zinc and sulfer content of 1.81 wt% and 0.99 wt%, respectively. The high content of such elements are probably attributed to the zinc oxide and sulfuradded as an activator andcrosslinking agent in the process of vulcanization.
Adsorbent
Surface area (SBET, m2/g)
Total volume (Vtotal, cm3/g)
Ref.
Prunus persica stones
0.985
0.002876
(Lopicic et al., 2019)
Charchol from oak leaves
4.0
0.02
(Sulyman et al., 2014)
Kail sawdust charcoal
5.381
*
(Gupta et al., 2019)
Raw coffee residues
3.0
*
(Kyzas et al., 2012)
Rejected tea leaves
4.2
0.0045
(Nasuha et al., 2010)
Modified dika nut-DN
4.99
*
(Inyinbor et al., 2017)
Xanthated rubber leaf
0.89
*
(Khalir et al., 2011)
Raw hazelnut shell
0.188
*
(Sayan, 2014)
Hazelnut shell activate carbon
5.0
*
(Sayan, 2014)
Raw olive stone
0.187
*
(Fiol et al., 2006)
Raw wheat shell
0.67
*
(Aydın et al., 2008)
Raw lentil shell
0.19
*
(Aydın et al., 2008)
Raw chitosan
0.0092
*
(Inyinbor et al., 2017)
Polymer composite
0.9473
0.0004
(This study)
Elements
Amount, wt%
Elements
Amount, wt%
C
74.29
Si
0.65
H
7.01
Fe
0.39
N
3.79
Ca
0.24
O
10.61
Cu
0.05
Zn
1.81
Co
0.02
S
0.99
Br
0.05
3.2 Operational parameters
3.2.1 Effect of contact time
The contact time between the contaminant and the adsorbent is one of the vital variables to investigate the effectiveness of prepared adsorbents for the removal of contaminants, as well as for practical application of adsorption process (Lim et al., 2013). The effect of contact time for the adsorptive removal of CV dye from contaminated solution was carried out by contacting 150 ml of 50 mg/l of initial dye concentration with 0.5 g of polymer composite at solution temperature of 25 ± 1.5 °C, stirring rate of 800 rpm, and natural solution pH without any adjustment using 250 ml beakers, over time periods ranging from 15 to 200 min. Generally, the removal rate of the contaminant is rapid at the first stage of the adsorption time, and thereafter, the rate slowed down near the equilibrium. In between these two stages, the removal rate of contaminant is almost constant (Hameed et al., 2008; Lim et al., 2013, Sulyman et al., 2018; Bello et al., 2019a,b). The effect of contact time on the adsorption is shown in Fig. 7. From the Fig. 7, it was clear that rapid removal was noticed in the initial stages of contact time (within the first 120 min), and then color removal rate became slow with the increase of contact time until it attained its equilibrium at contact time of 180 min. A further increase in adsorption time shows no significant impact on the rate of adsorption. This phenomenon was due to the fact that a large number of vacant surface sites were available for uptake during the initial stage, and after a period of time, the remaining vacant surface sites were difficult to be occupied due to repulsive forces between the solute molecules on the solid and in aqueous phases (Hameed et al., 2008; Sulyman et al., 2014, Abudaia et al., 2013, Obayomi et al., 2019, Lafi et al., 2014). The percentage removal and adsorption capacity for CV dye onto composite at equilibrium were obtained to be 89.4% and 12.7 mg/g, respectively. This indicated that 200 min. was the optimal contact time to reach the equilibrium of adsorption. Similar observations have been reported in the literatures (Mouni et al., 2018, Sulyman et al., 2016, Sulyman et al., 2018, Sulyman et al., 2014, Abudaia et al., 2013, Obayomi et al., 2019, Lafi et al., 2014, Isiuku et al., 2019, Hameed et al., 2008).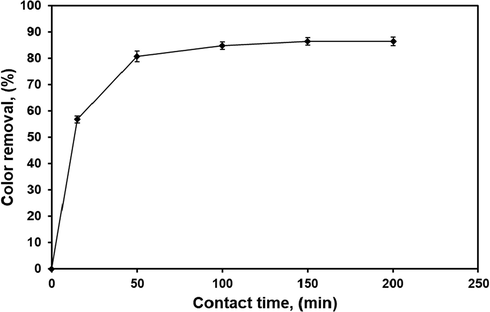
Effect of contact time on the efficiency of dye removal at natural solution pH, initial dye concentration, 50 mg/l; adsorbent dose, 0.5 g; room temperature; and 800 rpm).
3.2.1.1 Effect of adsorbent dose
To evaluate the influence of adsorbent dose on the adsorption capacity of the composite for CV dye, a given amounts of composite in the range of (0.1–1.0 g) were dispersed in a series of experiments containing 150 ml for an initial CV concentration of 50 mg/l. The solution was then stirred at room temperature, 800 rpm, and natural solution pH for 180 min. The effect of adsorbent dose on the color removal was shown in Fig. 8. The obtained results showed that as the amount of adsorbent was increased from 0.1 mg to 1.0g, the residual concentration of CV in the aqueous solution was decreased, which indicated that the color removal by composite adsorbent was increased from 57% to 92.4%. As expected, This can be attributed to the increase in the available adsorption sites that resulted from an increase in the adsorbent dose (Soleimani et al., 2019; Sharafi et al., 2015; Sulyman et al., 2020a,b). In contrast, the maximum capacity for CV was decreased as the amount of adsorbent increasing. The adsorption capacity of 41.56 mg/g at 0.1 g adsorbent dose was obtained, which decreased to 6.1 mg/g for the adsorbent mass of 1.0 g. The drop in adsorption capacity with increasing adsorbent dose can be described as a result of overlapping or aggregation of adsorption sites resulting in a decrease in the total removal surface are available to the CV molecules and an increase in the diffusion path length (Shoukat et al., 2017). A similar observation was reported by Mouni et al., 2018, who evaluated the adsorptive removal of methylene blue from aqueous solutions on kaolin. Likewise, Sulyman et al., 2014, investigated the efficiency of crystal violet adsorption from aqueous solutions by activated carbon derived from oak leaves, reported an increased removal efficiency by increasing the mass of the activated carbon.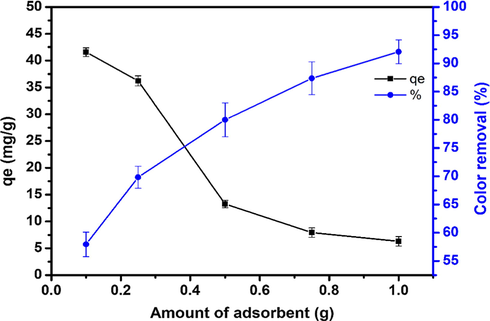
Effect of adsorbent dose on the dye removal at (natural solution pH, 50 mg/l; 200 min and 800 rpm).
3.2.1.2 Effect of temperature
Temperature was also one of the most important parameters for the water pollution control Since the industrial effluents containing dyes have a high temperature in the range of 60–70 °C (Markandeya et al., 2017). Typically, temperature is directly related to the kinetic energy of the dye molecules in the aqueous media. The impact of temperature on the elimanition of CV was carried out at 298, 303, 313, 323 and 333 K. The initial concentration of CV was maintained at 50 mg/l, other factors were kept at their optimal level. The natural solution pH was used without any adjustment. The percentage removal of the CV dye onto composite adsorbent increased with an increase in temperature (Fig. 9). This was because of an increase in the mobility of contaminate and a increase in the number of active sites for the adsorption with increasing temperature. Also, it might be because of the rise in chemical interaction between the contaminate molecules and surface functionalities of the composite (Mouni et al., 2018, Sulyman et al., 2018). Further increase in temperature reduce the swelling impact thus enabling the large dye molecules to easily penetrate (Jain and Gogate, 2018). This improved the diffusion rate of the contaminate molecules across the external boundary layer and in the internal pores of the adsorbent as a result of the viscosity decreases of the aqueous media (Mouni et al., 2018, Sulyman et al., 2018). In this study, the optimal temperature for the elimination of CV from contaminated solution was obtained to be 323 K (50 °C).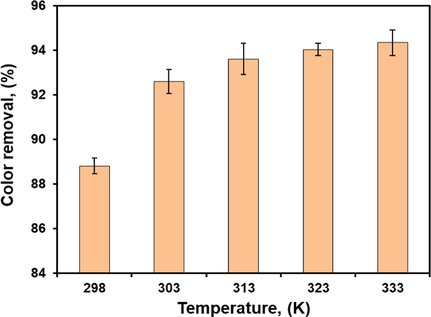
Effect of temperature on the rate of adsorption at (initial CV concentration, 50 mg/l; contact time, 200 min; natural solution pH; adsorbent dose 0.5 g, and 800 rpm).
3.2.1.3 Effect of solution pH
This experiment was carried out at pH ranging (3–9), stirring rate of 800 rpm, contact time of 200 min, for an initial CV concentration of 50 mg/l and adsorbent dose of 0.5g and reaction temperature of 323 K as shown in Fig. 10. Results obtained indicated that the adsorption capacity (qe) of CV increased slightly with increasing solution pH from 3 up to 8, and then become steady with the increase of solution pH until it attained its equilibrium at pH 8. A further increase in pH showd no significant impact on the rate of adsorption. However, when solution pH was lower than pHpzc (6.3), the protonation of the binding active sites was enhanced by the high increase in proton (H+) and thus the number of active sites became lower for the sorption of CV molecules. In contrast, at pH above pHpzc, the surface acquired increasingly negative charge, between 7 and 9, increasing the adsorption of cationic CV dye molecules due to electrostatic interaction (Lim et al., 2013, Mouni et al., 2018, Sulyman et al., 2014, Khan et al., 2015). The maximal adsorption of CV was achieved at pH 8. However, the experiments were conducted at the natural solution pH.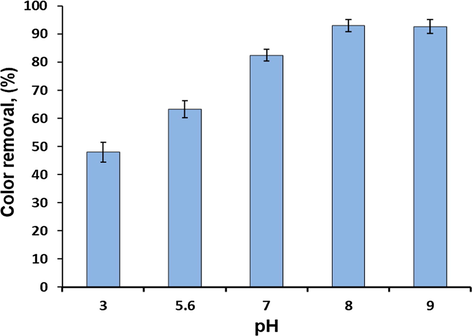
The effect of pH on the dye removal from contaminated solution at (contact time, 200 min; temperature, 323 K; initial CV concentration, 50 mg/l; adsorbent dose, 0.5 g).
3.2.1.4 Effect of initial dye concentration
The initial concentration provided an important driving force to overcome all mass transfer resistance of CV molecules between the two phases (Sulyman et al., 2014). The initial CV dye concentration ranging from 10 to 90 mg/l were used at temperature of 50 °C (selected as the best temperature of adsorption process), adsorption time of 200 min and stirring rate of 800 rpm and in conjunction with adsorbent mass of 0.5 g. The natural solution pH was used without any adjustment. The impact of initial CV concentration on the adsorption rate is shown in Fig. 11. It was found that the percentage of adsorption decreased with an increase in the initial concentration. This is due to the increase in the number of CV molecules in the solution for the same number of sites and the same adsorbent surface area (Loulidi et al., 2020). While, the increase in the initial dye concentration caused an increase in the loading capacity of the adsorbent and this may be due to the high driving force for mass at a high initial dye concentration (Etim et al., 2016; Bulut and Aydin, 2006). In other words, the residual concentration of dye molecules will be higher for higher initial dye concentrations. In the case of lower concentrations, the ratio of the initial number of dye molecules to the available adsorption sites is low and subsequently the adsorption becomes independent of the initial concentration (Etim et al., 2016; Sulyman et al., 2018, Lim et al., 2013; Sulyman et al., 2014).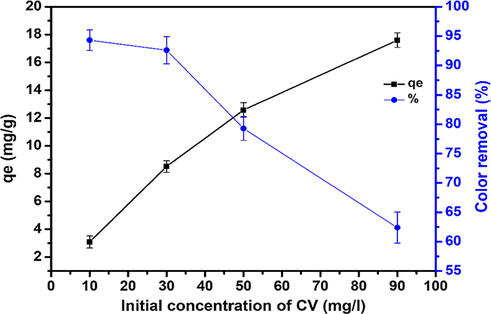
Effect of initial dye concentration on the rate of adsorption at (contact time, 200 min; natural solution pH; adsorbent dose, 0.5 g, and 800 rpm).
3.3 Isotherm studies
To describe the equilibrum between the adsorbent surface and the aqueous phase in the adsorption process, three isothem models (Langmuir, Ferundlich and Temkin) are applied in the current study. The equilibrium isotherms for the sorption of CV molecules by composites were carried out using the best adsorption conditions at different initial concentrations of CV dye ranging between 10 and 150 mg/l. Adsorption isotherm represents as equilibrium relationship between the dyes concentration in the aqueous solution and the solid adsorbent. Eq. (5) shows the linear form of the Langmuir isotherm (Langmuir, 1918). The Langmuir isotherm can also be expressed in terms of a dimensionless constant separation factor (RL) that is given by Eq. (6) (Mouni et al., 2018, Sulyman et al., 2018).
Usually, the Freundlich isotherm model is mainly applied to describe the characteristics of the heterogeneous surface. The linear form of the Freundlich equation is expressed as given by Eq. (7) (Freundlich and Heller, 1939).
The Temkin isotherm model assumes that the adsorption energy decrease linearly with the surface coverage due to adsorbent-adsorbate interactions (Alothman et al., 2013). The linear form of Temkin isotherm is given by Eq. (8) (Jain and Gogate, 2018).
The all isotherm constants were determined from the slope and intercept of linear plot of Langmuir, Freundlich and Temkin isotherms models (Fig. 12a), (b) and (c), respectively and were presented in Table 3. As can be seen from the values of correlation coefficients, the Langmuir and Temkin isotherms fitted well with the experimental data which were obtained (0.9949) and (0.9597) in compared with the Freundlich isotherm which showed low value of the correlation coefficient (0.8226). Similar results were observed for the adsorption of CV and MB dyes onto modified watermelon rind (Lakshmipathy and Sarada, 2013), and for the removal of acid green 25 dye by modified prunus dulcis (Jain and Gogate, 2018). Fig. 13 shows the separation factor as function of initial CV concentration.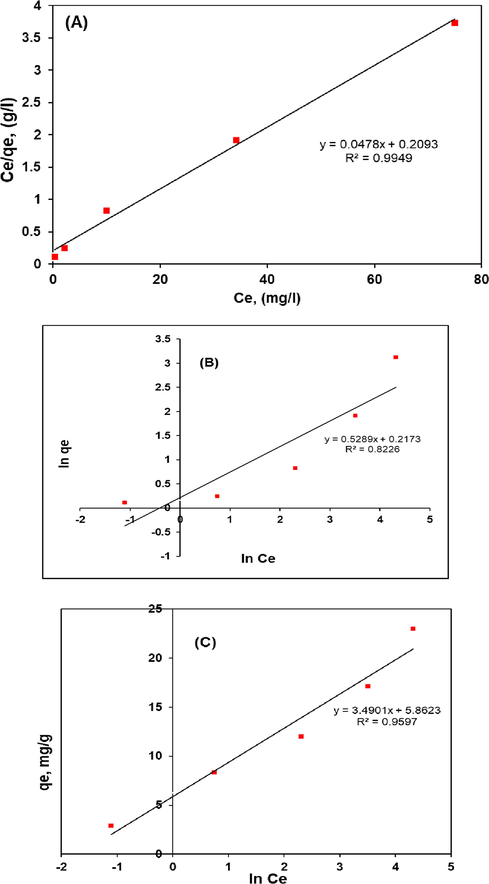
Plot of Langmuir isotherms (a), plot of Freundlich isotherms (b), and plot of Temkin isotherms for CV dye adsorption by polymer composite (c).
Langmuir isotherm constant
Fruendlich isotherm constant
Temkin isotherm constant
qmax(mg/g)
K (L/mg)
R2
n
Kf (L/mg)
R2
bT (kJ/mol)
KT(L/g)
R2
20.92
0.2284
0.9949
1.891
1.2427
0.8226
0.772
1.0017
0.9597
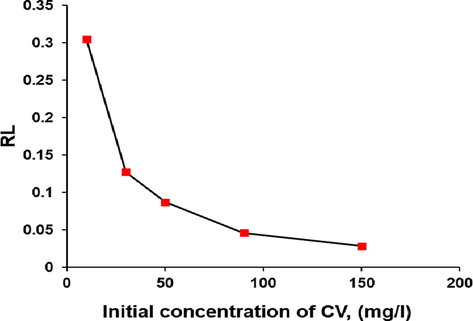
Separation factor (RL) of CV adsorption onto macrocomposite (temperature, 50 °C; stirring rate, 800 rpm; solid adsorbent, 0.5g/150 ml).
3.4 Kinetic studies
To investigate the mechanism of adsorption and potential rate controlling steps such as mass transfer and chemical reaction we have analyzed the kinetic these processes. The linear pseudo-first-order Eq. (9) (Lagergen (1898), pseudo-second-order Eq. (10) Ho and Mckay (1999) and intraparticle diffusion Eq. (11) (Lakshmipathy and Sarada, 2013) are widely used for the purpose.
In this study, the kinetic experiments were carried out by stirring 150 ml solutions of 50 mg/l CV concentration at the optimum conditions: 0.5 g of adsorbent dose, natural solution pH, stirring speed of 800 rpm. Fig. 14 shows the obtained results for the pseudo-firs-order (a), pseudo-second order (b) and interparticle diffusion (c).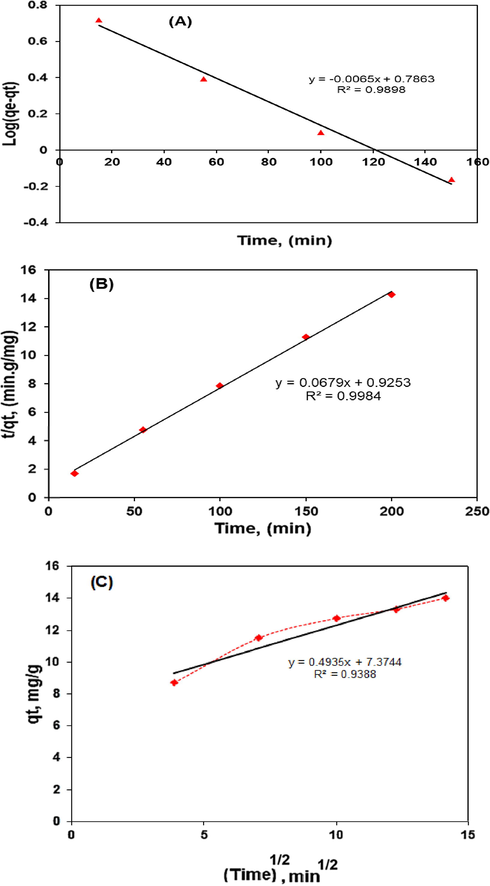
Plot of pseudo-first-order kinetic (a), pseudo-second-order kinetic (b), intraparticle diffusion (c) for the elimination of CV onto polymer composite.
Obtained data for Lagergren pseudo-first order equation cannot be used to predict the adsorption kinetics of CV onto polymer composite. The correlation coefficient (R2) obtained for the pseudo-first order kinetic model was a little low which varied 0.9898 for CV initial concentration of 50 mg/l. This indicates the imperfect fit of the pseudo-first-order kinetic model to the experimental data. This fact is confirmed by the discrepancies between the adsorption capacities as calculated from the pseudo-first-order kinetic model (qe1) and as determined experimentally (qe). Conversely, results presented in Table 4 show a good agreement between the experimental and the calculated qe values, resulting in high correlation coefficient (0.9984). However, the linear form of pseudo-second-order model showed the best fit to the experimental data related to the adsorptive removal of CV dye by polymer composite, as shown in Table 4. Thus, these results obtained by linear regression of experimental data, suggest that the pseudo-second order model provides the best correlation of the kinetic data. In several works published in the literature have also observed that pseudo-second order model is applicable in the case of dye removal (Mouni et al., 2018, Sulyman et al., 2018, Al-Mahmoud, 2020, Bello et al., 2019a,b, Albadarin et al., 2017; Lopicic et al., 2019; Hameed et al., 2008; Ahmed et al., 2014; Sulyman and Gierak, 2020). Similar reports were also given by (Hameed et al., 2017), on the adsorption of chromotrope dye onto activated carbons from the seeds of various plants. Similarly, Gupta et al., 2019) studied the removal of torque blue and yellow M4G dyes by kail sawdust charcoal, reported that adsorption process was good fitted to the pseudo-second-order model. Etim et al., 2016 reported similar trend for the adsorption of methylene blue onto coconut coir dust.
Pseudo-first-order kinetic
qe1(mg/g)
K1(1/min)
(R1)2
8.42
0.15637
0.9898
Pseudo-second-order kinetic
qe2 (mg/g)
K2 (g /mg min)
(R2)2
14.73
0.0734
0.9984
Intraparticle diffusion kinetic
C (mg/g)
Kd (mg/g min1/2)
(R2)
7.37
0.4935
0.9388
3.5 Thermodynamic studies
To describe the thermodynamic behavior and understand the effectiveness and nature of the adsorption system for adsorption of CV onto polymer composite at equilibrium conditions, we made experiments in temperature ranged from 298 to 333 K. Thermodynamic parameters including change in free energy (ΔGo), enthalpy (ΔHo), and entropy (ΔSo) were derived from Eqs. (12)–(14) (Mouni et al., 2018, Shoukat et al., 2017, Lakshmipathy and Sarada, 2013, Karadag et al., 2006).
The values of thermodynamic parameters ΔHo and ΔSo were found from the slope and intercept of the plot of ln Kd versus (1/T) as shown in (Fig. 15). The obtained values of thermodynamics parameters are presented in Table 5. The spontaneous nature of adsorption appears due to negative values of ΔGo. The increase in ΔGo with increase in temperature express that the adsorption process was more spontaneous at the higher temperature (Lakshmipathy and Sarada, 2013) and confirmed endothermic nature of the adsorption reaction. Similar observations have been reported during methylene blue adsorption onto kaolin (Mouni et al., 2018), and also adsorption of acid green 25 dye by activated prunus dulcis (Jain and Gogate, 2018).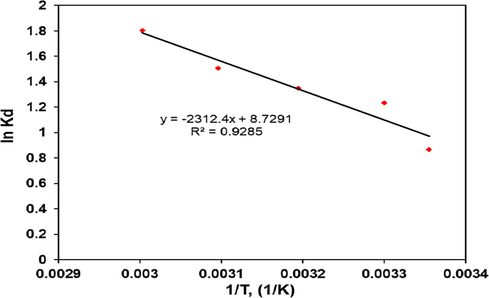
Van’t Hoff plot of ln Kd versus 1/T for CV adsorption onto polymer composite.
Temperature (K)
ΔGo (kJ mol−1)
ΔHo (kJ mol−1)
ΔSo(kJ mol−1 k−1)
298
−2.146
303
−3.111
313
−3.515
323
−4.046
19.22
0.0726
333
−4.999
3.6 Desorption experiments and recycling of macrocomposite adsorbent
The regeneration efficiency of an adsorbent is an indicator of its repeated applicability. Results obtained from the regeneration process of adsorbent (Fig. 16) showed that the desorption efficiency decreased slowly over the five cycles, from 82% to 63.7%. While the adsorption efficiency was decreased from 91% for the first cycle to 82% for the fifth. The obtained results established that the composite can successfully be reused in the adsorptive removal of CV dye from its contaminated solution with a small reduction in the efficiency of adsorption-desorption for five cycles (by 9.89% for adsorption and 22.32% for desorption). This result indicates the excellent mechanical properties of adsorbent, as well as the high resistance to the chemical agents. Several investigations of adsorption-desorption system have been performed for other adsorbents and found similar results (Jain and Gogate, 2018, Lakshmipathy and Sarada, 2013, Albadarin et al., 2017). In general, desorption and reusability studies can offer many advantages which include dye recovery, reusability of adsorbent, reduction the process cost, minimizing secondary wastes, and identifying mechanism of adsorption (Sulyman et al., 2016).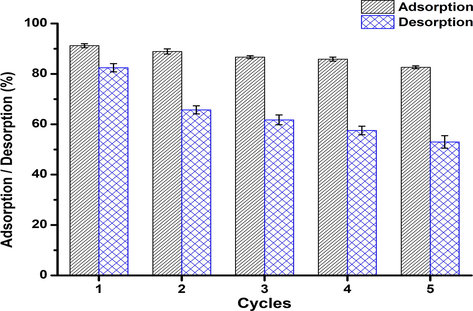
Adsorption/desorption cycles with 0.5 M HCl as desorbing agent.
3.7 Adsorption mechanisms
To understand the adsorption mechanism, it is necessary to study the structure of the adsorbate and the characteristics of the adsorbent surface (Loulidi et al., 2020). For this purpose, it should be noted that crystal violet is a cationic dye with amine groups in its structure and in aqueous phase dissociates into CV+ and Cl− (Loulidi et al., 2020). On the other hand, composite obtained by us contain functional groups such as hydroxyl and carboxyl (Bhattia et al., 2017), which has been confirmed by the FTIR analysis. Based on the experimental results of the current study, and depending on the structure of the adsorbate molecules and the properties of the composite surface, the mechanism for adsorption CV onto polymer composite involves the following steps (Loulidi et al., 2020, Sulyman et al., 2017):
-
(1)
Migration of the dye molecules from the bulk solution to the surface of the adsorbent.
-
(2)
Dye diffusion via the boundary layer on the surface of the adsorbent.
-
(3)
Adsorption of the dye molecules on the composite surface, which can be due to two mechanisms. The first mechanism can explain the behavior of adsorption by the formation of hydrogen bonds between the surface hydroxyl and carboxyl groups and the nitrogen atoms of the crystal violet. The second mechanism was a dye-hydrogen ion exchange mechanism because at pH ≥ 6.3, the surface functional groups were deprotonated and become negatively charge, which facilitates their binding to the positively charged CV ions (Loulidi et al., 2020). Similar observations have also been reported for adsorption of cationic methylene blue onto activated lignin-chitosan extruded pellets (Albadarin et al., 2017), for adsorptive removal of crystal violet onto treated ginger waste (Kumar and Ahmad, 2011), for the elimination of MB dye by almon shell (Loulidi et al., 2020), adsorption of 2,4,6-trichlorophenol onto activated carbon derived from coconut husk (Hameed et al., 2008) and for sequestering pyridine by lignocellulosic based adsorbent (Ahmed et al., 2014).
From Fig. 15c, we observed that CV dye adsorption by composite can involve two stages. These two stages suggest that the dye adsorption system proceeds by surface adsorption followed interparticle diffusion. Similar reports were given by (Lopicic et al., 2019; Ahmed et al., 2014; Hameed et al., 2008).
3.8 Comparison with other studies
Table 6 shows the comparison of different adsorption capacity of the dyes and heavy metal by low-cost adsorbents. From the table, it can be concluded that the adsorption capacity of polymer composite prepared and used in this study was very close to that obtained in the literatures. This comparison has indicated that the composite offered great potential for removing basic dyes like crystal violet from the water.
Adsorbent
Adsorbate
Optimal pH
qmax, (mg/g)
Ref.
Activated lignin–chitosan
methylene blue
7.0
36.25
(Albadarin et al., 2017)
Kaolin
methylene blue
6.0
52.76
(Mouni et al., 2018)
Modified kaoline
basic fuchsin
7.0
10.36
(Khan et al., 2015)
Modified kaoline
crystal violet
7.0
20.64
(Khan et al., 2015)
Natural clay
methylene blue
7.0
100.0
(Omer et al., 2018)
Natural clay
crystal violet
7.5
330.0
(Omer et al., 2018)
Raw ball clay
methylene blue
10
34.65
(Auta and Hameed 2012)
Modified
ball clay methylene blue
10
100
(Auta and Hameed 2012)
Coffee grounds-AC
methylene blue
5.0
8.73
(Franca et al., 2009)
Banana peel
methylene blue
7.2
20.8
(Annadurai et al., 2002)
Banana peel
congo red
7.9
18.2
(Annadurai et al., 2002)
Banana peel
methyl violet
5.3
12.20
(Annadurai et al., 2002)
Orange peel
methylene blue
5.7
18.60
(Annadurai et al., 2002)
Orange peel
rhodamine B
5.8
14.30
(Annadurai et al., 2002)
Oak leaves-AC
crystal violet
7.0
41.15
(Sulyman et al., 2014)
Punica granatum shell
crystal violet
5.0
50.21
(Silveira et al., 2014)
P. ceanica fiber
methylene blue
6.0
5.56
(Ncibi et al., 2007)
Carica papaya wood
methylene blue
10.0
32.25
(Rangabhashiyam et al., 2018)
Macroalgae biomass
crystal violet
6.5
38.4
(Sulyman et al., 2018)
Wheat bran
methylene blue
7.0
25.18
(Yao et al., 2012)
Cashew nut shell
congo red
3.0
5.20
(Kumar et al., 2010)
Date stones
methylene blue
6.3
43.47
(Belala et al., 2011)
Palm-trees waste
methylene blue
6.3
39.47
(Belala et al., 2011)
Date palm leaves-AC
crystal violet
6.5
36.63
(Sulyman et al., 2016)
Sea plant leaves
crystal violet
7.0
22.93
(Sulyman and Gierak 2020)
Oak leaves
crystal violet
7.0
31.65
(Sulyman and Gierak 2020)
Peanut Hull-AC
amaranth dye
4.0
76.92
(Nadeem et al., 2020)
Modified polyurethane foam
malachite green
7.0
32.108
(El-Bouraie 2015)
Polymer composite
crystal viole
neutral
20.9
This study
3.9 Cost estimation
In general, a cost comparison between the widely used adsorbent (commercial activated carbon) in wastewater treatment to that an inexpensive which are derived from industrial solid wastes still needs much more attention from engineers and scientists because not much has been conducted in this trend. Since, the global activated carbon market accounted for USD 4.12 billion in the year of 2017 (Ahmad et al., 2020), and and USD 4.3 billion by 2020 (Chuah et al., 2005), and this cost is expected to reach 14.21 billion by the year of 2026 (Ahmad et al., 2020). Table 6 presented the total cost of adsorbent derived from composite in comparison with the cost of another activated carbon based adsorbent prepared from natural solid wastes. These costs have been compared to the cost of commercial activated carbon. In this research work, total cost of (1.0 Kg) composite based adsorbent was included cost of raw material and transportation, cost of of distilled water, cost of electricity, and cost of filter paper. From the Table 7, it showed a difference between total cost of low-cost adsorbent, regarding local currency of the country against the USD, and conditions used for the production and/or processing of adsorbent.
Adsorbent
Application
Price, $US/kg
Ref.
Modified agricultural waste
Removal of pollutants
10.714
(Jain et al., 2016, Ahmed et al., 2014)
Gmelina aborea leaves-AC
Rhodamine B dye seguestration
36.34
(Bello et al., 2019a,b)
Coconut husk-AC
Rhodamine B dye seguestration
42.96
(Bello et al., 2019a,b)
Modified ficus carica fiber
Remediation of chromium Cr(VI)
0.20
(Gupta et al., 2013)
Glyricidia sepium wood chip-AC
Adsorption of basic green 4
0.57
(Ahmad et al., 2020)
Artocarpus integer waste
Production of activated carbon
1.67
(Selvaraju and Abu Bakar 2017)
Commercial activated carbon
Wastewater treatment
387.75
(Bello et al., 2019a,b)
Commercial activated carbon
Wastewater treatment
259.5
(Bello et al., 2019a,b)
Polymer ccomposite
CV removal
4.35
This study
4 Conclusion
In this study, An environmentally friendly method involving extrusion and thermal activation was successfully employed to produce adsorbent material. The composite sorbent obtained was then, structurally characterized, and applied in the adsorptive removal of crystal violet (CV) from its contaminated solution. The dye removal depends significantly on the adsorption conditions. The equilibrium time for dye molecules adsorption to reach equilibrium was 200 min. The Langmuir isotherm and pseudo-second order kinetic model described well to CV adsorption data, yielding a maximum adsorption capacity of 20.92 mg/g. The desorption efficiency decreased slowly over the five cycles, from 82% to 63.7%. This study indicates that composite presents great potential adsorbent for dye removal. In addition, adsorbent used has a possibility of separation and collection dyes from aqueous environment with a high its removal of dye from its contaminated solution. Total cost of adsorbent including raw material, transportation, filter paper, electricity was estimated to be $4.35 per kg. Overall, the newly developed composite is a promising cost-effective alternative to commercial adsorbents and offered great potential for adsorptive removal of CV dye from water, consequently, benefiting human health and water pollution control.
Declaration of Competing Interest
The authors declare that they have no known competing financial interests or personal relationships that could have appeared to influence the work reported in this paper.
References
- Removal of heavy metals from industrial waste water by biomass-based materials: A review. J. Pollut. Effects Control. 2017;5
- [CrossRef] [Google Scholar]
- Adsorption of Pb (II) and Cu (II) from aqueous solution onto activated carbon prepared from dates stones. Int. J. Environ. Sci. Develop.. 2013;4:191-195.
- [CrossRef] [Google Scholar]
- Adsorption of basic green 4 onto gasified glyricidia sepium woodchip based activated carbon: Optimization, characterization, batch and column study. Arabian J. Chem.. 2020;13:6887-6903.
- [CrossRef] [Google Scholar]
- Lignocellulosic derived modified agricultural waste: development, characterization and implementation in sequestering pyridine from aqueous solutions. J. Colloid Interface Sci.. 2014;428:222-243.
- [CrossRef] [Google Scholar]
- Equilibrium, isotherm studies of dye adsorption onto orange peel powder. Chem. Res. J.. 2018;3(1):45-59.
- [Google Scholar]
- Activated lignin-chitosan extruded blends for efficient adsorption of methylene blue. Chem. Eng. J.. 2017;307:264-272.
- [CrossRef] [Google Scholar]
- Kinetic, isothermal and thermodynamic investigations for the use of pumpkin seed husks as low-cost biosorbent of solochrome cyanine R from aqueous solutions. Egyption J. Chem.. 2020;63:2947-2957.
- [CrossRef] [Google Scholar]
- Kinetic, equilibrium isotherm and thermodynamic studies of Cr(VI) adsorption onto low-cost adsorbent developed from peanut shell activated with phosphoric acid. Environ. Sci. Pollut. Res.. 2013;20:3351-3365.
- [CrossRef] [Google Scholar]
- Use of cellulose-based wastes for adsorption of dyes from aqueous solutions. J. Hazard. Mater.. 2002;92:263-274.
- [CrossRef] [Google Scholar]
- Modified mesoporous clay adsorbent for adsorption isotherm and kinetics of methylene blue. Chem. Eng. J.. 2012;198–199:219-227.
- [CrossRef] [Google Scholar]
- Removal of copper (II) from aqueous solution by adsorption onto low-cost adsorbents. J. Environ. Manage.. 2008;87:37-45.
- [CrossRef] [Google Scholar]
- Biosorption of basic dye from aqueous solutions by date stones and palm-trees waste: Kinetic, equilibrium and thermodynamic studies. Desalination. 2011;271:80-87.
- [CrossRef] [Google Scholar]
- Functionalized coconut husk for rhodamine-B dye sequestration. Appl. Water Sci.. 2019;9:189.
- [CrossRef] [Google Scholar]
- Rhodamine B dye sequestration using gmelina aborea leaf powder. Heliyon. 2019;5:e02872
- [CrossRef] [Google Scholar]
- Chromium adsorption using waste tire and conditions optimization by response surface methodology. J. Environ. Chem. Eng.. 2017;5:2740-2751.
- [CrossRef] [Google Scholar]
- Removal of methyl violet 2B dye from aqueous solution using a magnetic composite as an adsorbent. J. Water Process Eng.. 2015;6:11-20.
- [CrossRef] [Google Scholar]
- A kinetics and thermodynamics study of methylene blue adsorption on wheat shells. Desalination. 2006;194:259-267.
- [Google Scholar]
- Efficiency of sawdust as low-cost adsorbent for dyes removal: A review. J. Chem.. 2020;2020:1-17.
- [CrossRef] [Google Scholar]
- Rice husk as a potentially low-cost biosorbent for heavy metal and dye removal: An overview. Desalination. 2005;175:305-316.
- [CrossRef] [Google Scholar]
- Review on dye removal from its aqueous solution into alternative cost effective and non-conventional adsorbents. J. Chem. Proc. Eng.. 2014;1:104.
- [Google Scholar]
- Bioremediation potential of a widespread industrial biowaste as renewable and sustainable biosorbent for synthetic dye pollution. Int. J. Phytorem.. 2019;21:259-267.
- [CrossRef] [Google Scholar]
- Removal of malachite green (Mg) dye from textile industrial wastewater using polyurethane foam functionalized with salicylate. J. Dispersion Sci. Technol.. 2015;36
- [CrossRef] [Google Scholar]
- Coconut coir dust as a low cost adsorbent for the removal of cationic dye from aqueous solution. J. Saudi Chem. Soc.. 2016;20:S67-S76.
- [CrossRef] [Google Scholar]
- Adsorption of lead (II) onto orange acid modified rubber leaf powder: Batch and column studies. Process Saf. Environ. Prot.. 2015;1–19
- [CrossRef] [Google Scholar]
- Sorption of Pb(II), Ni(II), Cu(II) and Cd(II) from aqueous solution by olive stone waste. Sep. Purif. Technol.. 2006;50:132-140.
- [CrossRef] [Google Scholar]
- An overview of dye removal via activated carbon adsorption process. Desalin. Water Treat.. 2010;19:255-274.
- [CrossRef] [Google Scholar]
- Kinetics and equilibrium studies of methylene blue adsorption by spent coffee grounds. Desalination. 2009;249:267-272.
- [Google Scholar]
- Low-cost adsorbents: Growing approach to wastewater treatment-A review. Crit. Rev. Environ. Sci. Technol.. 2009;39:783-842.
- [CrossRef] [Google Scholar]
- Remediation of noxious chromium (VI) utilizing acrylic acid grafted lignocellulosic adsorbent. J. Mol. Liq.. 2013;177:343-352.
- [CrossRef] [Google Scholar]
- Kail sawdust charcoal: A low–cost adsorbent for removal of textile dyes from aqueous solution. SN Appl. Sci.. 2019;1:1271.
- [CrossRef] [Google Scholar]
- Adsorption isotherm, kinetic modeling and mechanism of 2,4,6-trichlorophenol on coconut husk-based activated carbon. Chem. Eng. J.. 2008;144:235-244.
- [CrossRef] [Google Scholar]
- Adsorption of chromotrope dye onto activated carbons obtained from the seeds of various plants: Equilibrium and kinetics studies. Arabian J. Chem.. 2017;10:S2225-S2233.
- [CrossRef] [Google Scholar]
- Natural and low-cost p. turgidum for efficient adsorption of Hg(II) ions from contaminated solution: Isotherms and kinetics studies. J. Polym. Environ. 2020
- [CrossRef] [Google Scholar]
- Pseudo-second order model for adsorption processes. Process Biochem.. 1999;34:451-465.
- [Google Scholar]
- Liquid phase adsorptions of Rhodamine B dye onto raw and chitosan supported mesoporous adsorbents: isotherms and kinetics studies. Appl Water Sci.. 2017;7:2297-2307.
- [CrossRef] [Google Scholar]
- Adsorption performance of acid-activated carbon derived from gmelina arborea in batch removal of methyl violet from aqueous solution. J. Chem. Soc. Nigeria. 2019;44:011-021.
- [Google Scholar]
- Applicability of plant based biosorbents in the removal of heavy metals: A review. Environ. Process. 2016;3:495-523.
- [CrossRef] [Google Scholar]
- Efficient removal of acid green 25 dye from wastewater using activated prunus dulcis as biosrbent: Batch and column studies. J. Environ. Manage.. 2018;210(2018):226-238.
- [CrossRef] [Google Scholar]
- Removal of heavy metals from water sources in the developing world using low-cost materials: A review. Chemosphere. 2019;229:142-159.
- [CrossRef] [Google Scholar]
- Removal of ammonium ion from aqueous solution using natural Turkish clinoptilolite. J. Hazard. Mater.. 2006;B136:604-609.
- [CrossRef] [Google Scholar]
- Removal of basic dyes from aqueous solution by adsorption onto binary iron-manganese oxide coated kaolinite: Non-linear isotherm and kinetics modeling. Appl. Clay Sci.. 2015;107:50-77.
- [CrossRef] [Google Scholar]
- Agricultural waste materials as biosorbents for the removal of heavy metals and synthetic dyes: A review. Octa J. Environ. Res.. 2016;4(3):208-229.
- [Google Scholar]
- Khalir, W.K.A.W.M., Hanafiah, M.A.K.M., Soad, S.Z.M., Ngah, W.S.W., 2011. Adsorption behavior of Pb(II) onto xanthated rubber (Hevea brasiliensis) leaf powder. Polish J. Chem. Technol. 13 (4), 82–88, doi: 10.2478/v10026-011-0054-1
- Adsorption of dye from aqueous solution by cashew nut shell: Studies on equilibrium isotherm, kinetics and thermodynamics of interactions. Desalination. 2010;261:52-60.
- [CrossRef] [Google Scholar]
- Biosorption of hazardous crystal voilet dye from aqueous solution onto treated ginger waste (TGW) Desalination. 2011;265:112-118.
- [Google Scholar]
- Removal of dyes from aqueous solutions with untreated coffee residues as potential low-cost adsorbents: Equilibrium, reuse and thermodynamic approach. Chem. Eng. J.. 2012;189–190:148-159.
- [CrossRef] [Google Scholar]
- Coffee waste as potential adsorbent for the removal of basic dyes from aqueous solution. Korean J. Chem. Eng.. 2014;31:2198-2206.
- [CrossRef] [Google Scholar]
- On the theory of so-called adsorption of dissolved substances. Handlingar. 1898;24:1-39.
- [Google Scholar]
- Adsorptive removal of basic cationic dyes from aqueous solution by chemically protonated watermelon (Citrullus Lanatus) rind. Desalin. Water Treat.. 2013;52:1-10.
- [CrossRef] [Google Scholar]
- Adsorption of gases on plain surfaces of glass mica platinum. J. Am. Chem. Soc.. 1918;40:1361-1403.
- [Google Scholar]
- Converting dead leaf biomass into activated carbon as potential replcement for carbon blak filler composites. Compos. B. 2020;201:108366
- [CrossRef] [Google Scholar]
- Application of zeolite-activated carbon macrocomposite for the adsorption of acid orange 7: Isotherm, kinetic and thermodynamics studies. Environ. Sci. Pollut. Res.. 2013;20:7243-7255.
- [CrossRef] [Google Scholar]
- Using a composite material containing waste tire powder and polypropylene fiber cut end to recover spilled oil. Waste Manage.. 2010;30:263-267.
- [CrossRef] [Google Scholar]
- Adsorption of crystal violet onto an agricultural waste residue: Kinetics, isotherm, thermodynamics, and mechanism of adsorption. Sci. World J.. 2020;2019:1-9.
- [CrossRef] [Google Scholar]
- Effects of different mechanical treatments on structural changes of lignocellulosic waste biomass and subsequent Cu(II) removal kinetics. Arabian J. Chem.. 2019;12:4091-4103.
- [CrossRef] [Google Scholar]
- Toxicity of desperse dyes and its removal from wastewater using various adsorbents: A review. Res. J. Environ. Toxicol. 2017;11:72-89.
- [CrossRef] [Google Scholar]
- Synthesis and characterization of iodo polyurethane foam and its application in removing of aniline blue and crystal violet from laundry wastewater. J. Taibah Univ. Sci.. 2015;9:80-88.
- [CrossRef] [Google Scholar]
- Separation and determination of iron and manganese in water using polyhydroxyl polyurethane foam. J. Assoc. Arab Universities Basic Appl. Sci.. 2013;14:60-66.
- [CrossRef] [Google Scholar]
- Mohamed, E.F., 2011. Removal of organic compounds from water by adsorption and photo-catalytic oxidation. 2011; Thesis is Submitted for the Degree of Doctoral, Institute National Polytechnique Toulouse. http://ethesis.inp-toulouse.fr/archive/00001569/01/mohamed.pdf
- Removal of methylene blue from aqueous solutions by adsorption on kaolin: Kinetic and equilibrium studies. Appl. Clay Sci.. 2018;153:38-45.
- [CrossRef] [Google Scholar]
- Utilization of peanut (Arachis hypogaea) hull based activated carbon for the removal of amaranth dye from aqueous solutions. Iran. J. Chem. Chem. Eng.. 2020;39(4):183-191.
- [Google Scholar]
- Rejected tea as a potential low-cost adsorbent for the removal of methylene blue. J. Hazard. Mater.. 2010;175:126-132.
- [CrossRef] [Google Scholar]
- Kinetic and equilibrium studies of methylene blue biosorption by posidonia oceanica (L.) fibres. J. Hazard. Mater.. 2007;139:280-285.
- [CrossRef] [Google Scholar]
- Use of polyurethane foams for the removal of the Direct Red 80 and Reactive Blue 21 dyes in aqueous medium. Desalination. 2011;281:55-60.
- [CrossRef] [Google Scholar]
- Removal of oil from water using polyurethane foam modified with nanoclay. Chem. Eng. J.. 2015;262:278-285.
- [CrossRef] [Google Scholar]
- Development of low-cost bio-adsorbent from agricultural waste composite for Pb(II) and Ar(III) sorption from aqueous solution. Cogent Eng.. 2019;6:1687274.
- [CrossRef] [Google Scholar]
- Adsorption thermodynamics of cationic dyes (methylene blue and crystal violet) to a natural clay mineral from aqueous solution between 293.15 and 323.15 K. Arabian J. Chem.. 2018;11:615-623.
- [CrossRef] [Google Scholar]
- Biocrude production through pyrolysis of used tyres- A review. J. Catal.. 2014;2014:1-9.
- [CrossRef] [Google Scholar]
- Biosorption characteristics of methylene blue and malachite green from simulated wastewater onto carica papaya wood biosorbent. Surf. Interfaces. 2018;10:197-215.
- [CrossRef] [Google Scholar]
- Evolution of adsorption process for manganese removal in water via agricultural waste adsorbents. Heliyon. 2020;6:e05049
- [CrossRef] [Google Scholar]
- Chemically modified sugarcane bagasse as a potentially low-cost biosorbent for dye removal. Desalination. 2010;264:123-128.
- [CrossRef] [Google Scholar]
- An optimization study on removal of Zn2+ from aqueous solution by ultrasound-assisted preparation of activated carbon from alkaline impregnated hazelnut shell. J. Chem. Soc. Pak.. 2014;36(1):28-36.
- [Google Scholar]
- Selvaraju, G., Abu Bakar, N.K., 2017. Production of a new industrially viable green-activated carbon from Artocarpus integer fruit processing waste and evaluation of its chemical, morphological and adsorption properties. 141, 989–999. https://doi.org/10.1016/j.jclepro.2016.09.056
- Production of a new industrially viable green activated carbon from artocarpus integer fruit processing waste and evaluation of its chemical, morphological and adsorption properties. J. Clean. Prod.. 2017;141:989-999.
- [CrossRef] [Google Scholar]
- Adsorptive removal of methylene blue from aqueous solutions by pumice powder: process modelling and kinetic evaluation. Environ. Eng. Manage. J.. 2015;14(5):1067-1078.
- [Google Scholar]
- Mango stone biocomposite prepartion and application for cystal violet adsorption: A mechanistic study. Microporous Mesoporous Mater.. 2017;239:180-189.
- [CrossRef] [Google Scholar]
- Punica granatum shell preparation, characterization, and use for crystal violet removal from aqueous solution. Clean-Soil, Air, Water. 2014;42:939-946.
- [CrossRef] [Google Scholar]
- Green environmental approach for adsoption of hazardous dye from water using tree and sea plant leaves (dead L.) ACTA Sci. Agric.. 2020;4:1-10.
- [CrossRef] [Google Scholar]
- Greener cleaner: Liquid-phase adsorption of dye using macroalgae based biosorbent materials. Acta Sci. Agric.. 2018;3:30-38.
- [CrossRef] [Google Scholar]
- Utilization of new activated carbon from an oak leaves for removal of crystal violet from aqueous solution. Pol. J. Environ. Stud.. 2014;23:2223-2232.
- [CrossRef] [Google Scholar]
- Sulyman, M., Namieśnik, J., Gierak, A., 2016. Adsorptive removal of aqueous phase crystal violet dye by low-cost activated carbon obtained from date palm (L.) dead leaflets. Eng. Protect. Environ. 19, 611–631. https://doi.org/10.17512/ios.2016.4.14 4
- Economical and eco-friendly adsorbent derived from coffee waste for efficient adsorption of methylene blue: Characterization, evaluation and optimization studies. Chem. Sci. Int. J.. 2020;29(10):16-36.
- [CrossRef] [Google Scholar]
- Low-cost adsorbents derived from agricultural by-products/wastes for enhancing contaminant uptakes from wastewater: A review. Pol. J. Environ. Stud.. 2017;26:1-32.
- [CrossRef] [Google Scholar]
- Sulyman, M., Sienkiewicz, M., Kucinska-Lipka, J., Haponiuk, J., 2020. Continuous processing of extrusion crumb rubber and recycled polyurethane foam to develope and produce a new material for asphalt modification. X Ukrainian-Polish Scientific conference “Polymers of special applications”, Lviv, September 21-24, 2020.
- Effect of modification by five different acids on pumice stone as natural and low-cost adsorbent for removal of humic acid from aqueous solutions-Application of response surface methodology. J. Mol. Liq.. 2019;290:111181
- [CrossRef] [Google Scholar]
- Dye and its removal from aqueous solution by adsorption: A review. Adv. Colloid Interface Sci.. 2014;209:172-184.
- [CrossRef] [Google Scholar]
- Recycling and disposal methods for polyurethane foam wastes. Procedia Environ. Sci.. 2012;16:167-175.
- [CrossRef] [Google Scholar]
- Biosorption of methylene blue onto tartaric acid modified wheat bran from aqueous solution. Iranian J. Environ. Health Sci. Eng.. 2012;9:16.
- [Google Scholar]
- Modification of ground tire rubber promising approach for development of green composites. J. Compos. Sci.. 2020;4
- [CrossRef] [Google Scholar]
- Waste materail adsorbent for zinc removal from wastewater: A comprehensive review. Int. J. Chem. Eng.. 2014;1–13
- [CrossRef] [Google Scholar]


