

Translate this page into:
Development of a high sensitivity UHPLC-MS/MS method to determine the twelve compounds of Physochlainae Radix extract and application to a pharmacokinetic study in rats
⁎Corresponding authors. 493507647@qq.com (Jihong Feng), hejun673@163.com (Jun He)
-
Received: ,
Accepted: ,
This article was originally published by Elsevier and was migrated to Scientific Scholar after the change of Publisher.
Abstract
Physochlainae Radix (PR) is generally applied for treating cough and asthma. In this study, a sensitive ultra-high-performance liquid chromatography coupled with triple quadrupole mass spectrometry (UHPLC-MS/MS) method was established and validated for the simultaneous determination of twelve components (scopolamine, anisodamine, hyoscyamine, protocatechuic acid, fabiatrin, scopolin, 4-hydroxybenzoic acid, caffeic acid, tropic acid, scopoletin, isoquercitrin, and scoparone) of PR extract in rat plasma. ACQUITY UPLC CSH C18 column was employed for the chromatographic separation with the mobile phase system consisting of acetonitrile and 0.1 % (v/v) formic acid aqueous solution. The intra-day and inter-day precisions of twelve analytes was less than 9.33 %, and the accuracy ranged from −11.08 to 11.89 %. The extraction recoveries of the analytes ranged from 76.42 to 93.17 % and the matrix effects varied from 76.02 to 90.56 %. The results of stability tests demonstrated that the analytes were stable under the different conditions and their relative standard deviation were less than 13.06 %. The developed method was firstly successfully applied to the pharmacokinetic study of the twelve analytes of PR extract in rats, and the pharmacokinetic results showed that the maximum concentration (Cmax, 1553.51 ± 736.52 ng/mL) of tropic acid were relatively large, which was related to the fact that scopolamine and anisodamine were metabolized to tropic acid in vivo. The elimination half-life (T1/2) of fabiatrin, scopolin, 4-hydroxybenzoic acid, and tropic acid were 6.45, 6.16, 9.87, and 7.12 h, suggesting that these analytes were kept for a longer duration in vivo. This research would provide meaningful reference for PR in clinical use.
Keywords
Physochlainae Radix
UHPLC-MS/MS
Pharmacokinetics
Rat plasma

- PR
-
Physochlainae Radix
- UHPLC-MS/MS
-
ultra-high-performance liquid chromatography coupled with triple quadrupole mass spectrometry
- IS
-
internal standard
- MRM
-
Multiple reaction monitoring
- QC
-
quality control
- S/N
-
signal-to-noise ratio
- RE
-
relative error
- RSD
-
relative standard deviation
- LLOQ
-
lower limits of quantification
- T1/2
-
elimination half-life
- Tmax
-
time to reach maximum concentration
- Cmax
-
maximum concentration
- AUC
-
area under the curve
Abbreviations
1 Introduction
Medicinal plants have shown promising efficacy and accessibility, alleviating the harm of diseases to human health, which has led to an increased attention in recent years (Wheatley, 2005; Ardalani et al., 2020; Gregory et al., 2021; Ben-Shabat et al., 2020). Physochlainae Radix (PR) is derived from the dried roots of Physochlaina infundibularis Kuang in the family Solanaceae (State Pharmacopoeia Commission, 2020). Due to its remarkable clinical efficacy, PR is widely used in medications. Traditionally, PR is employed to relieve cough and phlegm, warm the lung, and calm the mind. Currently, more and more pharmacological studies have demonstrated that PR has been found to possess a variety of properties, such as antitussive, expectorant, antioxidant and analgesic (Yohannes et al., 2019; Wang et al., 2023; Tang et al., 2019). Meanwhile, clinical studies have indicated that PR is effective in the treatment of chronic bronchitis, asthmatic bronchitis, allergic purpura (Yohannes et al., 2019; Zhou et al., 2017), etc.
Medicinal plants have these properties depending on the bioactive metabolites they contain. In phytochemical studies, various components have been identified in PR, mainly including alkaloids, coumarins, and organic acids (Lou et al., 2011; Dai and Song, 2012; Zhao et al., 2013), etc. Among them, tropane alkaloids are considered both as the main active ingredients for the treatment of various airway diseases and as the cause of toxicity in PR (Flynn et al., 2009; Wigenstam et al., 2021; Gadzikowska and Grynkiewicz, 2002; Kohnen-Johannsen and Kayser, 2019). Hence, it is necessary to figure out how these ingredients are metabolized to minimize the occurrence of side effects in vivo.
Pharmacokinetics of components in herbal medicine is mainly used for investigating absorption, distribution, metabolism, and excretion of drugs in vivo (He et al., 2011), which is an essential bridge connecting the herb compositions and active components (Laddha and Kulkarni, 2023; Huang et al., 2022). Meanwhile, the pharmacokinetic characteristics can illustrate the dynamically changing process of compounds in vivo. These are extremely valuable for improving the safety and efficacy in clinical use of drugs and helping to determine the suitable dosing and administration time (Hanley et al., 2023; Ma et al., 2023). Although PR is widely used clinically, its pharmacokinetic properties in vivo have not been reported.
In this study, a rapid and sensitive ultra-high-performance liquid chromatography coupled with triple quadrupole mass spectrometry (UHPLC-MS/MS) method was established and validated for the simultaneous determination of twelve components (scopolamine, anisodamine, hyoscyamine, protocatechuic acid, fabiatrin, scopolin, 4-hydroxybenzoic acid, caffeic acid, tropic acid, scopoletin, isoquercitrin, and scoparone) after oral administration of the PR extract in rat plasma. This research is the first pharmacokinetic study of both PR extract and fabiatrin, which can provide some valuable references for further pharmacological studies and applications.
2 Materials and methods
2.1 Chemicals, reagents, and plant materials
Scopolamine, anisodamine hydrobromide, hyoscyamine, protocatechuic acid, fabiatrin, scopolin, 4-hydroxybenzoic acid, caffeic acid, tropic acid, scopoletin, isoquercitrin, scoparone and coptisine (internal standard [IS], purity ≥ 98 %) were purchased from Chengdu Desite Biotechnology Co., Ltd. (Chengdu, China). Fig. 1 shows the chemical structures of the twelve analytes and IS. Fisher Scientific (Fair Lawn, NJ, USA) provided the methanol and acetonitrile (chromatographic purity) used in this study. Chromatographic purity formic acid was prepared from ROE (St. Louis, MO, USA). The demineralized water was obtained from Millipore's Milli-Q water purification system (Milford, MA, USA). PR was collected from Shaanxi province (China), and preserved at Tianjin University of Traditional Chinese Medicine, China.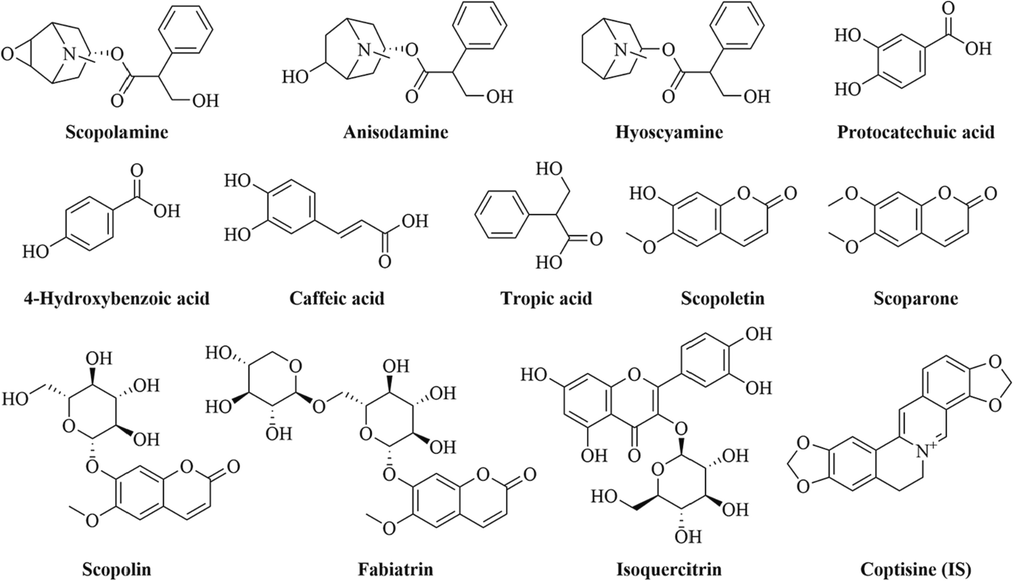
Chemical structures of twelve compounds and IS.
2.2 Instruments and conditions
In UHPLC-MS/MS, an Agilent 1290 ultra-high performance liquid chromatography system along with an Agilent 6470 series triple quadrupole mass spectrometer were used. ACQUITY UPLC CSH C18 column was employed for the chromatographic separation, and the column temperature of 30 °C was maintained. As mobile phases, 0.1 % formic acid in water (A) and acetonitrile (B) were used with the following gradient elution method: 0 – 7 min, 10 – 55 % B; 7 – 8 min, 55 – 61 % B, post run time of 4 min. The flow rate and injection volume were 0.3 mL/min and 2 μL, respectively. Multiple reaction monitoring (MRM) mode was applied for analysis in both positive and negative ionization mode simultaneously. The instrumental parameters were set as follows: gas temperature at 350 °C, gas flow rate at 11 L/min, and nebulizer pressure at 30 psig. The quantitative parameters of twelve components and IS were listed in Table 1. The mass spectroscopy characterization of twelve compounds were shown in Figure S1.
Compounds
Rt
(min)Precursor ion
(m/z)Product ion
(m/z)Fragmentor
(V)Collision energy
(V)Ion mode
Scopolamine
1.541
304.1
138.1
80
24
Positive
Anisodamine
1.643
306.1
140.1
80
28
Positive
Hyoscyamine
2.237
290.1
124.1
80
10
Positive
Protocatechuic acid
2.455
153.0
109.0
99
16
Negative
Fabiatrin
2.744
531.1
191.0
99
8
Negative
Scopolin
2.911
399.1
191.0
84
8
Negative
4-Hydroxybenzoic acid
3.474
137.0
93.0
84
16
Negative
Caffeic acid
3.704
179.0
135.0
84
16
Negative
Tropic acid
4.053
165.0
103.0
69
4
Negative
Scopoletin
4.545
191.0
176.0
84
12
Negative
Isoquercitrin
4.593
463.0
300.0
135
29
Negative
Scoparone
5.469
207.0
107.0
108
40
Positive
Coptisine (IS)
4.206
321.0
321.0
130
6
Positive
2.3 PR extract preparation
PR (700.0 g) was weighed accurately, and ten times 85 % ethanol (v/v) was extracted under hot reflux for two times, each time for two hours. Extract was mixed and concentrated by evaporation at reduced pressure. The dried PR extract was crushed and stored. The contents of scopolamine, anisodamine, hyoscyamine, protocatechuic acid, fabiatrin, scopolin, 4-hydroxybenzoic acid, caffeic acid, tropic acid, scopoletin, isoquercitrin, and scoparone in PR extract were listed in Table 2.
Compounds
Content (μg/g)
Scopolamine
1537.52 ± 20.80
Anisodamine
4811.42 ± 30.59
Hyoscyamine
4238.32 ± 64.62
Protocatechuic acid
121.50 ± 0.76
Fabiatrin
22213.64 ± 199.22
Scopolin
4488.79 ± 67.24
4-Hydroxybenzoic acid
260.42 ± 3.87
Caffeic acid
164.00 ± 7.33
Tropic acid
1457.80 ± 18.99
Scopoletin
6053.56 ± 72.47
Isoquercitrin
0.41 ± 0.05
Scoparone
38.21 ± 2.77
2.4 Preparation of standard solutions, calibration standards and quality control samples
Scopolamine, anisodamine, hyoscyamine, protocatechuic acid, fabiatrin, scopolin, 4-hydroxybenzoic acid, caffeic acid, tropic acid, scopoletin, isoquercitrin, scoparone and coptisine (IS) were separately weighed and dissolved with methanol at a concentration of 1.0 mg/mL. The calibration solutions were obtained by adding appropriate volumes of mixture working solution and 20 μL of IS into 100 μL blank rat plasma, resulting in concentrations: 1, 2, 4, 10, 20, 40, 80, 160, and 320 ng/mL for scopolin, 4-hydroxybenzoic acid, isoquercitrin, protocatechuic acid, and caffeic acid; 2, 4, 8, 20, 40, 80, 160, 320, and 640 ng/mL for scopoletin, fabiatrin, anisodamine, and hyoscyamine; 0.3, 0.6, 1.2, 3, 6, 12, 24, 48, and 96 ng/mL for scopolamine and scoparone; 10, 20, 40, 100, 200, 400, 800, 1600, and 3200 ng/mL for tropic acid. Three levels (low, medium, and high concentrations) of quality control (QC) samples were prepared in the same way.
2.5 Plasma sample preparation
20 μL of methanol, 20 μL of IS (coptisine, 1 μg/mL) were added to 100 μL of plasma sample and then vortex-mixed. The mixture was extracted with 600 μL methanol for 5 min. After centrifuging at 14,000 g for 10 min, the upper purified liquid was collected and evaporated under a stream of nitrogen until dry. The residue was redissolved in 100 μL of 50 % methanol. Finally, 2 μL of upper purifying solution was injected into the UHPLC-MS/MS system for analysis.
2.6 Method validation
The method was evaluated for specificity, linearity, sensitivity, precision and accuracy, recovery, matrix effect, and stability to ensure that it meets the U.S. Food and Drug Administration (FDA) guideline for accurate quantitation. (Tang et al., 2021; Xu et al., 2019; Zhang et al., 2022).
2.6.1 Specificity
Specificity was assayed by comparing chromatograms of blank plasma samples, blank plasma samples spiked with twelve ingredients and IS, and plasma samples collected after oral administration of PR extract.
2.6.2 Linearity and lower limits of quantification
Calibration curves were prepared by plotting the relationship between the peak area ratios of each analyte to IS versus the concentration of the corresponding analyte, and 1/x2 was used as weighting coefficient. The LLOQ was the lowest concentration that could be measured with a signal-to-noise ratio (S/N) of 10.
2.6.3 Precision and accuracy
Precision and accuracy were assessed by analyzing six replicates of QC samples at low, medium, and high concentrations levels on the same day and on three consecutive days. Accuracy was evaluated by relative error (RE), while precisions were assessed by relative standard deviation (RSD).
2.6.4 Extraction recovery and matrix effect
Extraction recoveries were measured by comparing the peak response of the analytes in extracted samples with those in post-extraction spiked samples. Matrix effects were evaluated by calculating the ratio of the peak response of the analytes in the post-extracted spiked samples to those of the unextracted samples.
2.6.5 Stability
By analyzing the QC samples under various conditions: stored in auto-sampler for 12 h, at room temperature for 4 h, under three freeze–thaw cycles, and stored at −80 °C for 7 days, the stability of analytes in plasma samples was evaluated.
2.7 Pharmacokinetic study
Six SD rats (SPF, 220 ± 10 g, Male) were prepared from HuaFuKang Bioscience Co., Inc. (Beijing, China). Rats were allowed to drink freely and fasted for 12 h prior to the study. The PR extract was dissolved to a concentration of 62 mg/mL with 0.5 % CMC-Na aqueous solution. A suspension of 0.62 g/kg was administered orally to rats and roughly 300 μL of blood were collected before and at 0, 0.03, 0.08, 0.17, 0.25, 0.5, 0.75, 1, 2, 4, 6, 8, 10, 12, 24, and 36 h after oral administration. After centrifugation at 7000 rpm for 10 min, the plasma is frozen at −80 °C until analysis. Pharmacokinetic parameters were calculated using “Drug and Statistics 3.0” (DAS 3.0) (Medical College of Wannan, China).
3 Result and discussion
3.1 Optimization of LC and MS/MS conditions
In the paper, the analytes were separated by UHPLC and characterized by mass spectrometry (QQQ-MS/MS). The UHPLC conditions, including column stationary phase type, mobile phase and additives, were optimized to obtain better separation. The stationary phase is crucial for obtaining satisfactory separation results. Main chemical components of most traditional Chinese medicines are readily absorbed by reversed-phase stationary phases, and three commonly used reversed-phase stationary phases were employed in this study: ACQUITY UPLC BEH C18 (2.1 × 100 mm, 1.7 µm), CORTECS UPLC C18 (2.1 mm × 100 mm, 1.6 μm), and ACQUITY UPLC CSH C18 (2.1 × 100 mm, 1.7 μm) to optimize the separation of twelve analytes. In comparison, the ACQUITY UPLC CSH C18 (2.1 × 100 mm, 1.7 µm) column provided better retention and shorter analysis time. Moreover, different mobile phases (ACN/H2O, ACN/0.1 %FA-H2O, ME/H2O, and ME/0.1 %FA-H2O) were compared and the results showed that ACN/0.1 %FA-H2O had higher sensitivity for analytes and IS. The twelve analytes and IS were eluted within eight min without any interference peaks (Fig. 2).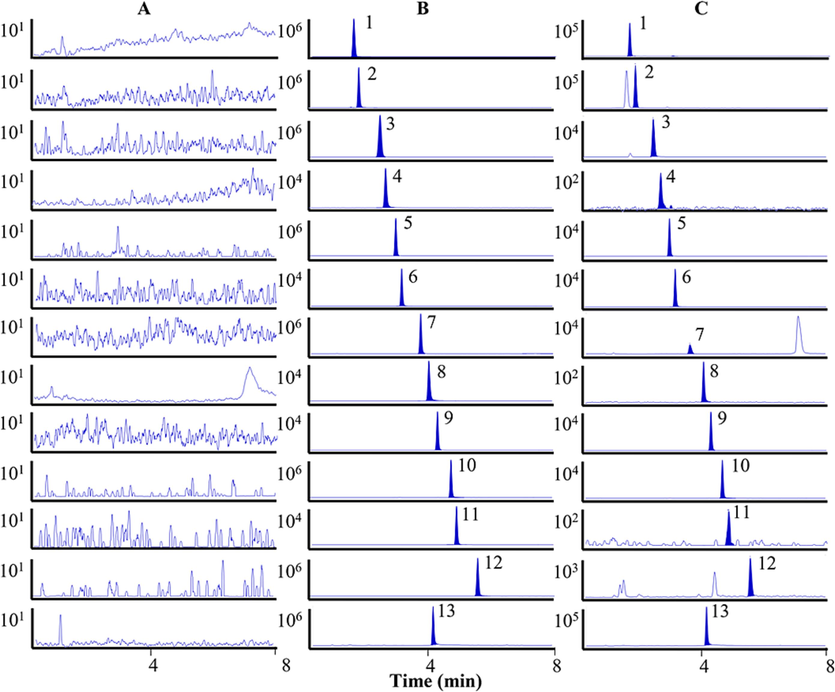
MRM chromatograms of twelve analytes and IS. Blank plasma sample (A); Blank plasma spiked with twelve analytes and IS (B); Plasma samples after oral administration of PR extract (C). 1. scopolamine, 2. anisodamine, 3. hyoscyamine, 4. protocatechuic acid, 5. fabiatrin, 6. scopolin, 7. 4-hydroxybenzoic acid, 8. caffeic acid, 9. tropic acid, 10. scopoletin, 11. isoquercitrin, 12. scoparone, and 13. coptisine (IS).
For QQQ-MS/MS conditions, key parameters of the mass spectrometry that may affect the ion response were optimized. Three main ion source parameters, including gas flow rate (5–11 L/min), gas temperature (350–380 °C), and nebulizer pressure (20–50 psig), were optimized using a single factor experiment. Figure S2 shows the histogram of the trend of ion response for these twelve compositions at different parameter levels. The final optimized MS/MS conditions were as follows: gas temperature of 350 °C, gas flow rate of 11 L/min and nebulizer pressure of 30 psig.
3.2 Sample preparation
Sample preparation by appropriate methods is a key step in pharmacokinetic study. Three methods, ethyl acetate liquid–liquid extraction, acetonitrile precipitated protein, and methanol precipitated protein were compared for plasma sample preparation. Results revealed that methanol precipitated protein method has higher extraction efficiency, lower matrix effect, and simpler operation procedure. In order to meet the demands of this experiment for biological sample determination, methanol precipitated protein method was adopted for sample preparation in this study.
3.3 Method validation
3.3.1 Specificity
The MRM chromatograms of blank plasma sample (A), blank plasma spiked with twelve analytes and IS (B), and plasma samples collected in rats (C) are displayed in Fig. 2. No endogenous interference was found in the samples.
3.3.2 Linearity and LLOQ
The regression equations, linear ranges, correlation coefficients, and LLOQs for the twelve analytes are presented in Table 3. The results indicated that the calibration curves for the twelve analytes showed excellent linearity over the corresponding concentration range. (r > 0.9950). The LLOQs of scopolamine, anisodamine, hyoscyamine, protocatechuic acid, fabiatrin, scopolin, 4-hydroxybenzoic acid, caffeic acid, tropic acid, scopoletin, isoquercitrin, and scoparone were 0.3, 0.4, 1.0, 1.0, 2.0, 1.0, 1.0, 1.0, 2.0, 1.0, 1.0, and 0.3 ng/mL, respectively.
Compounds
Calibration curves
r
Linear range
LLOQ
(ng/mL)
(ng/mL)
Scopolamine
Y = 1.6869X + 3.0132E-004
0.9960
0.3–96
0.3
Anisodamine
Y = 1.6171X + 0.0031
0.9962
2–640
0.4
Hyoscyamine
Y = 0.2129X + 2.7028E-004
0.9950
2–640
1.0
Protocatechuic acid
Y = 0.0271X + 1.1599E-005
0.9952
1–320
1.0
Fabiatrin
Y = 0.1597X + 8.1309E-005
0.9966
2–640
2.0
Scopolin
Y = 0.0172X + 1.0846E-005
0.9953
1–320
1.0
4-Hydroxybenzoic acid
Y = 0.0286X + 0.0011
0.9953
1–320
1.0
Caffeic acid
Y = 0.0098X + 2.3091E-004
0.9955
1–320
1.0
Tropic acid
Y = 0.0097X-1.7889E-004
0.9961
10–3200
2.0
Scopoletin
Y = 0.0299X-2.5028E-006
0.9954
2–640
1.0
Isoquercitrin
Y = 0.0216X + 4.5810E-005
0.9983
1–320
1.0
Scoparone
Y = 0.2856X + 7.1036E-007
0.9951
0.3–96
0.3
3.3.3 Precision and accuracy
The accuracy and intra- and inter-day precision were evaluated based on the RE and RSD values. As shown in Table 4, the intra- and inter-day RSD values were less than 9.33 %, the intra-day RE ranged from −11.08 to 11.89 %, while the inter-day RE ranged from −5.75 to 7.50 %. The results suggested that this method has acceptable limits of precision and accuracy.
Compounds
Spiked
concentration
(ng/mL)Intra-day
Inter-day
Measured (ng/mL)
RE (%)
RSD (%)
Measured (ng/mL)
RE (%)
RSD (%)
Scopolamine
0.6
0.54 ± 0.05
−10.03
8.37
0.64 ± 0.05
6.37
7.17
6
5.67 ± 0.24
−5.42
4.20
5.86 ± 0.16
−2.29
2.70
76.8
80.24 ± 4.42
4.48
5.51
75.30 ± 3.53
−1.95
4.68
Anisodamine
4
4.38 ± 0.23
9.48
5.32
4.29 ± 0.27
7.33
6.40
40
41.42 ± 3.36
3.56
8.10
38.73 ± 1.62
−3.17
4.19
512
493.08 ± 25.40
−3.70
5.15
524.34 ± 24.29
2.41
4.63
Hyoscyamine
4
4.23 ± 0.20
5.80
4.78
3.83 ± 0.18
−4.34
4.78
40
41.47 ± 3.43
3.68
8.28
39.07 ± 1.95
−2.34
5.00
512
553.48 ± 21.39
8.10
3.87
520.63 ± 24.60
1.68
4.73
Protocatechuic acid
2
2.06 ± 0.10
3.08
5.01
1.89 ± 0.14
−5.49
7.45
20
20.67 ± 1.29
3.35
6.25
19.19 ± 1.13
−4.06
5.88
256
272.56 ± 15.45
6.47
5.67
259.73 ± 19.79
1.46
7.62
Fabiatrin
4
4.11 ± 0.22
2.84
5.31
3.83 ± 0.20
−4.17
5.20
40
41.33 ± 1.71
3.33
4.14
38.72 ± 2.29
−3.19
5.93
512
534.45 ± 12.05
4.38
2.25
526.02 ± 24.87
2.74
4.73
Scopolin
2
2.24 ± 0.09
11.89
3.82
2.15 ± 0.14
7.50
6.64
20
18.22 ± 0.65
−8.88
3.57
18.85 ± 0.72
−5.75
3.83
256
250.30 ± 8.98
−2.23
3.59
264.55 ± 22.99
3.34
8.69
4-Hydroxybenzoic acid
2
2.06 ± 0.10
2.77
4.84
2.02 ± 0.13
1.22
6.65
20
20.31 ± 1.89
1.54
9.33
20.61 ± 0.78
3.04
3.80
256
260.44 ± 6.87
1.74
2.64
264.06 ± 14.51
3.15
5.50
Caffeic acid
2
2.07 ± 0.15
3.71
7.40
2.12 ± 0.18
5.86
8.43
20
21.13 ± 0.69
5.63
3.27
20.07 ± 1.07
0.36
5.32
256
253.06 ± 12.38
−1.15
4.89
260.00 ± 6.64
1.56
2.55
Tropic acid
20
20.98 ± 0.75
4.91
3.58
20.54 ± 0.85
2.69
4.13
200
179.75 ± 9.21
−10.12
5.12
202.67 ± 13.20
1.34
6.51
2560
2487.37 ± 100.74
−2.84
4.05
2548.56 ± 57.95
−0.45
2.27
Scopoletin
4
4.24 ± 0.09
6.06
2.24
4.07 ± 0.23
1.67
5.63
40
41.19 ± 2.62
2.98
6.36
40.15 ± 1.73
0.39
4.30
512
538.84 ± 27.26
5.24
5.06
521.40 ± 20.08
1.84
3.85
Isoquercitrin
2
1.78 ± 0.02
−11.08
0.97
1.95 ± 0.10
−2.73
4.89
20
21.23 ± 1.10
6.17
5.17
19.07 ± 1.32
−4.64
6.92
256
265.11 ± 15.49
3.56
5.84
260.44 ± 15.58
1.74
5.98
Scoparone
0.6
0.59 ± 0.05
−2.27
8.08
0.63 ± 0.03
5.02
4.65
6
6.09 ± 0.19
1.55
3.07
6.12 ± 0.28
1.99
4.52
76.8
74.81 ± 5.72
−2.59
7.65
78.21 ± 2.58
1.84
3.30
3.3.4 Extraction recovery and matrix effect
The results of extraction recovery and matrix effect are provided in Table 5. The extraction recoveries for the three concentration levels of analytes in rat plasma samples ranged from 76.42 % to 93.17 %, and the matrix effects ranged from 76.02 to 90.56 %. These results indicated that both the matrix effects and extraction recoveries were within acceptable limits.
Compounds
Spiked concentration
(ng/mL)Extraction recovery (%)
RSD
(%)Matrix
effect (%)RSD
(%)
Scopolamine
0.6
81.55 ± 8.05
9.87
87.97 ± 11.49
13.06
6
84.94 ± 2.11
2.49
81.48 ± 2.80
3.44
76.8
84.35 ± 4.81
5.70
82.69 ± 5.50
6.66
Anisodamine
4
84.51 ± 5.67
6.71
84.60 ± 4.48
5.29
40
78.33 ± 3.52
4.49
86.63 ± 3.34
3.85
512
76.42 ± 2.79
3.65
83.04 ± 4.84
5.83
Hyoscyamine
4
83.82 ± 3.64
4.35
84.50 ± 3.76
4.45
40
79.28 ± 8.00
10.09
82.99 ± 3.39
4.08
512
80.48 ± 4.23
5.25
82.04 ± 2.04
2.48
Protocatechuic acid
2
84.83 ± 4.02
4.74
76.02 ± 3.64
4.79
20
82.97 ± 7.95
9.58
79.41 ± 10.88
13.70
256
80.52 ± 2.33
2.90
78.86 ± 5.36
6.80
Fabiatrin
4
81.25 ± 4.04
4.97
78.03 ± 9.87
12.66
40
78.75 ± 4.16
5.29
78.67 ± 3.88
4.93
512
82.44 ± 7.38
8.95
86.67 ± 5.70
6.58
Scopolin
2
86.85 ± 5.72
6.58
81.86 ± 10.67
13.03
20
80.49 ± 5.49
6.82
78.48 ± 5.43
6.92
256
80.88 ± 4.92
6.08
90.56 ± 5.77
6.37
4-Hydroxybenzoic acid
2
83.14 ± 9.12
10.97
81.45 ± 6.35
7.79
20
83.77 ± 4.12
4.92
80.07 ± 2.56
3.19
256
80.10 ± 11.31
14.12
80.69 ± 4.05
5.02
Caffeic acid
2
79.51 ± 8.09
10.18
89.29 ± 9.10
10.19
20
85.72 ± 11.18
13.04
80.31 ± 7.80
9.71
256
86.26 ± 4.97
5.76
84.50 ± 5.26
6.22
Tropic acid
20
93.17 ± 9.84
10.56
78.89 ± 4.50
5.70
200
91.54 ± 7.74
8.45
78.93 ± 2.93
3.72
2560
86.15 ± 5.79
6.72
80.48 ± 4.23
5.25
Scopoletin
4
86.39 ± 9.25
10.70
83.79 ± 5.84
6.98
40
81.35 ± 6.42
7.90
86.87 ± 2.91
3.35
512
83.11 ± 10.82
13.01
84.76 ± 2.22
2.61
Isoquercitrin
2
81.35 ± 4.46
5.48
80.33 ± 5.67
7.06
20
81.82 ± 5.68
6.94
86.40 ± 10.46
12.10
256
81.27 ± 5.81
7.15
81.83 ± 7.06
8.63
Scoparone
0.6
83.20 ± 11.24
13.51
80.57 ± 9.67
12.00
6
80.86 ± 8.98
11.10
85.05 ± 4.43
5.21
76.8
82.41 ± 10.19
12.36
84.23 ± 5.33
6.33
3.3.5 Stability
The stability results are shown in Table 6. The analytes were stable at room temperature for 4 h, in the auto-sampler for 12 h, under three freeze–thaw cycles, and at −80 °C for 7 days. The RSD values were less than 13.06 %, indicating that these analytes were stable under the above conditions.
Compounds
Spiked concentration
(ng/mL)Room temperature
for 4 hAutosampler for 12 h
Three freeze–thaw
cycles−80 °C for 7 days
Measured
(ng/mL)RSD
(%)Measured
(ng/mL)RSD
(%)Measured
(ng/mL)RSD
(%)Measured
(ng/mL)RSD
(%)
Scopolamine
0.6
0.59 ± 0.02
4.19
0.64 ± 0.05
7.17
0.59 ± 0.06
10.30
0.62 ± 0.05
8.26
6
5.77 ± 0.31
5.29
5.86 ± 0.16
2.70
5.96 ± 0.46
7.79
6.28 ± 0.25
4.05
76.8
75.84 ± 7.72
10.18
75.30 ± 3.53
4.68
75.69 ± 2.79
3.68
71.66 ± 5.49
7.65
Anisodamine
4
4.05 ± 0.21
5.10
4.29 ± 0.27
6.40
4.15 ± 0.19
4.55
4.13 ± 0.33
8.02
40
40.92 ± 2.30
5.62
38.73 ± 1.62
4.19
41.44 ± 2.06
4.96
42.46 ± 1.60
3.77
512
504.68 ± 24.24
4.80
524.34 ± 24.29
4.63
516.33 ± 22.52
4.36
519.63 ± 38.80
7.47
Hyoscyamine
4
3.95 ± 0.22
5.45
3.83 ± 0.18
4.78
3.92 ± 0.26
6.60
4.12 ± 0.23
5.53
40
39.82 ± 1.70
4.27
39.07 ± 1.95
5.00
41.82 ± 1.48
3.54
41.03 ± 1.61
3.93
512
520.46 ± 24.21
4.65
520.63 ± 24.60
4.73
507.81 ± 29.07
5.73
513.61 ± 17.64
3.44
Protocatechuic acid
2
2.05 ± 0.15
7.40
1.89 ± 0.14
7.45
1.93 ± 0.21
10.85
2.07 ± 0.16
7.67
20
21.10 ± 1.53
7.24
19.19 ± 1.13
5.88
20.43 ± 1.34
6.54
20.73 ± 0.61
2.95
256
258.98 ± 6.08
2.35
259.73 ± 19.79
7.62
263.92 ± 15.00
5.68
262.52 ± 7.51
2.86
Fabiatrin
4
3.97 ± 0.11
2.78
3.83 ± 0.20
5.20
3.81 ± 0.17
4.53
4.08 ± 0.13
3.22
40
39.98 ± 1.00
2.49
38.72 ± 2.29
5.93
40.12 ± 1.91
4.76
41.02 ± 3.62
8.84
512
503.62 ± 26.48
5.26
526.02 ± 24.87
4.73
506.80 ± 20.88
4.12
523.43 ± 18.32
3.50
Scopolin
2
2.05 ± 0.11
5.50
2.15 ± 0.14
6.64
2.03 ± 0.12
6.13
2.10 ± 0.12
5.84
20
19.67 ± 0.77
3.90
18.85 ± 0.72
3.83
19.94 ± 0.68
3.40
20.80 ± 1.01
4.86
256
253.94 ± 6.14
2.42
264.55 ± 22.99
8.69
266.25 ± 6.83
2.56
266.84 ± 12.34
4.63
4-Hydroxybenzoic acid
2
2.07 ± 0.13
6.42
2.02 ± 0.13
6.65
1.97 ± 0.06
3.04
1.95 ± 0.10
5.18
20
19.70 ± 0.81
4.13
20.61 ± 0.78
3.80
20.40 ± 1.04
5.11
20.84 ± 0.86
4.12
256
266.00 ± 9.59
3.61
264.06 ± 14.51
5.50
263.45 ± 17.39
6.60
261.22 ± 14.73
5.64
Caffeic acid
2
1.94 ± 0.21
10.88
2.12 ± 0.18
8.43
2.05 ± 0.07
3.30
2.02 ± 0.22
11.02
20
19.88 ± 0.47
2.39
20.07 ± 1.07
5.32
19.82 ± 0.77
3.87
20.88 ± 1.36
6.50
256
258.28 ± 16.63
6.44
260.00 ± 6.64
2.55
265.10 ± 16.59
6.26
264.15 ± 9.29
3.52
Tropic acid
20
21.02 ± 0.66
3.15
20.54 ± 0.85
4.13
19.77 ± 2.58
13.06
19.58 ± 0.77
3.91
200
198.65 ± 14.51
7.30
202.67 ± 13.20
6.51
206.11 ± 9.54
4.63
200.49 ± 10.89
5.43
2560
2627.14 ± 76.20
2.90
2548.56 ± 57.95
2.27
2515.33 ± 75.77
3.01
2615.37 ± 54.20
2.07
Scopoletin
4
4.03 ± 0.11
2.70
4.07 ± 0.23
5.63
4.00 ± 0.12
3.09
3.96 ± 0.24
6.11
40
39.80 ± 0.94
2.37
40.15 ± 1.73
4.30
39.92 ± 1.38
3.46
40.76 ± 1.97
4.82
512
507.99 ± 23.78
4.68
521.40 ± 20.08
3.85
512.75 ± 32.15
6.27
512.64 ± 25.98
5.07
Isoquercitrin
2
2.06 ± 0.07
3.56
1.95 ± 0.10
4.89
2.04 ± 0.14
6.68
2.01 ± 0.06
2.91
20
19.83 ± 0.52
2.63
19.07 ± 1.32
6.92
20.44 ± 1.26
6.16
20.15 ± 1.54
7.64
256
251.41 ± 13.80
5.49
260.44 ± 15.58
5.98
257.45 ± 9.47
3.68
260.76 ± 9.26
3.55
Scoparone
0.6
0.59 ± 0.02
4.03
0.63 ± 0.03
4.65
0.58 ± 0.03
5.97
0.61 ± 0.07
11.38
6
6.10 ± 0.26
4.31
6.12 ± 0.28
4.52
6.11 ± 0.24
3.94
6.18 ± 0.32
5.14
76.8
79.27 ± 5.54
6.98
78.21 ± 2.58
3.30
78.25 ± 2.75
3.52
80.35 ± 2.73
3.40
3.4 Pharmacokinetic study
In this study, a high sensitivity UHPLC-MS/MS method was developed to determine twelve compounds in rat plasma after administration of PR extract. However, the plasma concentrations of some compounds were too low to attain a complete pharmacokinetic curve, such as protocatechuic acid, caffeic acid, and isoquercitrin. This may be caused by their low content in PR extract. Eventually, a total of nine detectable compounds were fitted with pharmacokinetic parameters. The mean plasma concentration–time curves of the other nine components are shown in Fig. 3. The main pharmacokinetic parameters, elimination half-life (T1/2), time to reach maximum concentration (Tmax), maximum concentration (Cmax), and area under the curve (AUC), are summarized in Table 7.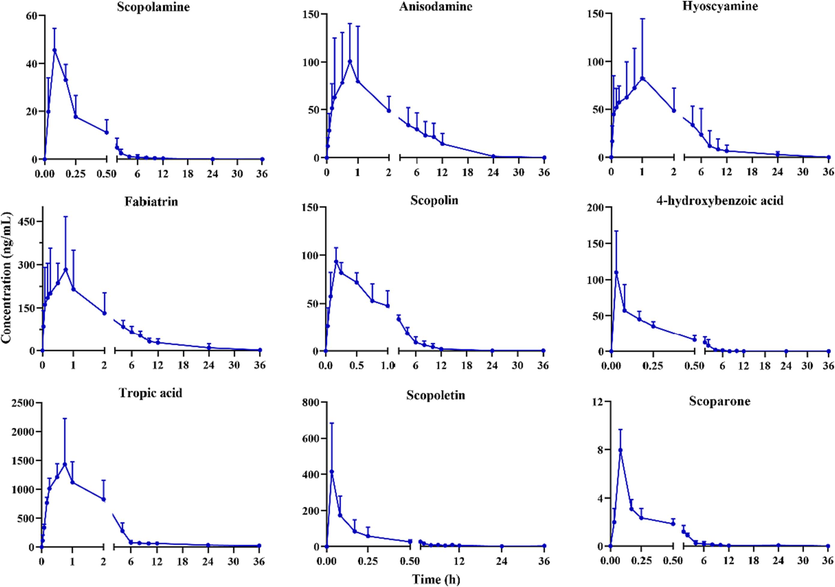
Mean plasma concentration–time curves of scopolamine, anisodamine, hyoscyamine, fabiatrin, scopolin, 4-hydroxybenzoic acid, tropic acid, scopoletin, and scoparone after oral administration of PR extract (mean ± SD, n = 6).
Compounds
Tmax
(h)Cmax
(ng/mL)T1/2
(h)AUC(0-t)
(h·ng/mL)AUC(0-∞)
(h·ng/mL)CLz/F
(L/h/kg)
Scopolamine
0.08 ± 0.00
45.60 ± 9.04
2.99 ± 0.79
30.36 ± 13.00
30.37 ± 13.31
23.48 ± 6.37
Anisodamine
0.75 ± 0.27
142.35 ± 43.30
3.15 ± 1.68
570.90 ± 272.72
571.90 ± 272.04
1.36 ± 0.52
Hyoscyamine
0.88 ± 0.14
124.86 ± 30.02
2.08 ± 0.21
409.23 ± 254.71
409.24 ± 254.71
1.88 ± 0.48
Fabiatrin
0.81 ± 0.24
360.72 ± 172.63
6.45 ± 0.74
1317.65 ± 521.24
1333.83 ± 521.43
0.52 ± 0.17
Scopolin
0.21 ± 0.04
96.02 ± 13.15
6.16 ± 1.89
261.99 ± 60.90
264.93 ± 60.78
2.44 ± 0.56
4-Hydroxybenzoic acid
0.05 ± 0.06
113.91 ± 51.22
0.41 ± 0.07
53.94 ± 22.72
53.94 ± 22.72
10.16 ± 2.48
Tropic acid
0.70 ± 0.21
1553.51 ± 736.52
9.87 ± 1.77
4793.51 ± 986.20
5222.61 ± 1336.85
0.11 ± 0.03
Scopoletin
0.08 ± 0.07
432.44 ± 245.83
7.12 ± 1.65
260.58 ± 58.49
273.54 ± 59.68
2.03 ± 0.86
Scoparone
0.08 ± 0.00
7.98 ± 1.73
4.22 ± 0.16
5.88 ± 1.16
5.88 ± 1.16
85.01 ± 14.44
As shown in Table 7, the AUC(0-t) and AUC(0-∞) values of all nine compounds were close, indicating that the monitoring time of this study was appropriate. The AUC(0-t) value of tropic acid was larger than the other analytes, indicating that this component had a higher level of plasma exposure. The Cmax value of tropic acid was 1553.51 ± 736.52 ng/mL, and the blood concentration was higher than other compounds, which was related to the fact that scopolamine and anisodamine were metabolized to tropic acid in vivo (Chen et al., 2008; Chen et al., 2005a, Chen et al., 2005b). Meanwhile, fabiatrin also had a higher level of plasma exposure, which might be attributed to its higher content in PR extract.
The Tmax values of scopolamine, anisodamine, hyoscyamine, fabiatrin, scopolin, 4-hydroxybenzoic acid, tropic acid, scopoletin, and scoparone were 0.08, 0.75, 0.88, 0.81, 0.21, 0.05, 0.70, 0.08, and 0.08 h. These results showed that these nine components were absorbed quickly in vivo. The Tmax values of scopolamine, scopolin, scopoletin, and scoparone were similar to those previously reported (Zhang et al., 2014; Zhang et al., 2020; Li et al., 2019; Yin et al., 2012). The T1/2 values of scopolamine, anisodamine, hyoscyamine, 4-hydroxybenzoic acid, and scoparone were 2.99, 3.15, 2.08, 0.41 and 4.22 h, respectively, indicating that these five analytes are eliminated shortly after oral administration of PR extract. The T1/2 values of fabiatrin, scopolin, 4-hydroxybenzoic acid, and tropic acid were 6.45, 6.16, 9.87, and 7.12 h, respectively, which revealed that these four analytes are present in vivo for a relatively longer period of time and may result in a more durable effect.
4 Conclusions
An UHPLC-MS/MS method was developed and validated for the simultaneous determination of the twelve components (scopolamine, anisodamine, hyoscyamine, fabiatrin, scopolin, 4-hydroxybenzoic acid, tropic acid, scopoletin, and scoparone) in rat plasma. The results indicated that fabiatrin, scopolin, 4-hydroxybenzoic acid, and tropic acid have longer elimination half-life compared to other compounds. Additionally, the blood concentration and plasma exposure of tropic acid were higher than other compounds ware related to the fact that scopolamine and anisodamine were metabolized to tropic acid in vivo. More importantly, this research was the first pharmacokinetic study of both PR extract and fabiatrin, which provided a reference for the clinical applications and further development of PR.
Acknowledgment
This study was supported by National Natural Science Foundation of China (82274091).
Ethics statement
The animal protocol was approved by the Animal Ethics Committee of Tianjin University of Traditional Chinese Medicine (TCM-LAEC2023059).
Authorship contribution statement
Conceptualization, Jun He and Jihong Feng; formal analysis, Zhenguo Lv; data curation, Tiantian Wu; writing—original draft preparation, Zhenguo Lv; writing—review and editing, Peng Zhao, Yang Liu, Caixia Li and Huizi Ouyang; supervision, Jun He and Jihong Feng. All authors have read and agreed to the published version of the manuscript.
Declaration of competing interest
The authors declare that they have no known competing financial interests or personal relationships that could have appeared to influence the work reported in this paper.
References
- Medicinal plants in the treatment of peptic ulcer disease: a review. Mini Rev. Med. Chem.. 2020;20:662-702.
- [CrossRef] [Google Scholar]
- Antiviral effect of phytochemicals from medicinal plants: Applications and drug delivery strategies. Drug Deliv. Transl. Res.. 2020;10:354-367.
- [CrossRef] [Google Scholar]
- Analysis of scopolamine and its eighteen metabolites in rat urine by liquid chromatography-tandem mass spectrometry. Talanta.. 2005;67:984-991.
- [CrossRef] [Google Scholar]
- Liquid chromatography-tandem mass spectrometry analysis of anisodamine and its phase I and II metabolites in rat urine. J. Chromatogr. B. 2005;824:21-29.
- [CrossRef] [Google Scholar]
- Liquid chromatography-electrospray ionization ion trap mass spectrometry for analysis of in vivo and in vitro metabolites of scopolamine in rats. J. Chromatogr. Sci.. 2008;46:74-80.
- [CrossRef] [Google Scholar]
- Study on the content determination of Scopolin in Huashanshen. Chin Med J Res Prac.. 2012;26:66-68.
- [Google Scholar]
- Anticholinergic treatment in airways diseases. Adv. Ther.. 2009;26:908-919.
- [CrossRef] [Google Scholar]
- Tropane alkaloids in pharmaceutical and phytochemical analysis. Acta Pol. Pharm.. 2002;59:149-160.
- [Google Scholar]
- Neuroprotective herbs for the management of Alzheimer's Disease. Biomolecules.. 2021;11:543.
- [CrossRef] [Google Scholar]
- Brigatinib pharmacokinetics in patients with chronic hepatic impairment. Invest New Drugs.. 2023;41:402-410.
- [CrossRef] [Google Scholar]
- ADME properties of herbal medicines in humans: evidence, challenges and strategies. Curr. Pharmaceut. Des.. 2011;17:357-407.
- [CrossRef] [Google Scholar]
- Preparation and pharmacokinetics in vivo of linarin solid dispersion and liposome. Chin. Herb. Med.. 2022;14:310-316.
- [CrossRef] [Google Scholar]
- Tropane alkaloids: chemistry, pharmacology, biosynthesis and production. Molecules. 2019;24:796.
- [CrossRef] [Google Scholar]
- Pharmacokinetics, pharmacodynamics, toxicity, and formulations of daidzein: An important isoflavone. Phytother. Res.. 2023;37:2578-2604.
- [CrossRef] [Google Scholar]
- An LC-MS/MS method for simultaneous determination of the toxic and active components of cortex periplocae in rat plasma and application to a pharmacokinetic study. Int. J. Anal. Chem.. 2019;1639619
- [CrossRef] [Google Scholar]
- HPLC determination of scopoletin in Physochlainae Radix. Chin J Pharm Anal.. 2011;31:1137-1139.
- [Google Scholar]
- Metabolism, pharmacokinetics, and bioavailability of yuanhuacine in rat using LC-MS. Biomed Chromatogr.. 2023;37:e5540.
- [Google Scholar]
- Pharmacopoeia of People’s Republic of China; China Medical Science and Technology Press: Beijing. China 2020:146-147.
- [Google Scholar]
- Extraction and quantitative analysis of tropane alkaloids in Radix physochlainae by emulsion liquid membrane with tropine-based ionic liquid. J Chromatogr a.. 2019;1583:9-18.
- [CrossRef] [Google Scholar]
- In vivo Pharmacokinetic Drug-Drug Interaction Studies Between Fedratinib and Antifungal Agents Based on a Newly Developed and Validated UPLC/MS-MS Method. Front Pharmacol.. 2021;11:626897
- [CrossRef] [Google Scholar]
- Chemical Compositions of Physochlaina infundibularis Kuang and their antioxidant activity. Mod. Chin. Med.. 2023;25:1020-1025.
- [Google Scholar]
- Medicinal plants for insomnia: a review of their pharmacology, efficacy and tolerability. J. Psychopharmacol.. 2005;19:414-421.
- [CrossRef] [Google Scholar]
- Efficacy of atropine and scopolamine on airway contractions following exposure to the nerve agent VX. Toxicol. Appl. Pharmacol.. 2021;419:115512
- [CrossRef] [Google Scholar]
- UPLC-MS/MS method for the simultaneous determination of imatinib, voriconazole and their metabolites concentrations in rat plasma. J Pharm Biomed Anal.. 2019;166:6-12.
- [CrossRef] [Google Scholar]
- Pharmacokinetics and tissue distribution study of scoparone in rats by ultraperformance liquid-chromatography with tandem high-definition mass spectrometry. Fitoterapia.. 2012;83:795-800.
- [CrossRef] [Google Scholar]
- Preconcentration of tropane alkaloids by a metal organic framework (MOF)-immobilized ionic liquid with the same nucleus for their quantitation in Huashanshen tablets. Analyst.. 2019;144:6989-7000.
- [CrossRef] [Google Scholar]
- Ultrasonic Extraction of Tropane Alkaloids from Radix physochlainae Using as Extractant an Ionic Liquid with Similar Structure. Molecules.. 2019;24:2897.
- [CrossRef] [Google Scholar]
- Simultaneous determination of atropine, scopolamine, and anisodamine from Hyoscyamus niger L. in rat plasma by high-performance liquid chromatography with tandem mass spectrometry and its application to a pharmacokinetics study. J Sep Sci.. 2014;37:2664-2674.
- [CrossRef] [Google Scholar]
- Evaluation of the inhibitory effect of quercetin on the pharmacokinetics of tucatinib in rats by a novel UPLC-MS/MS assay. Pharm. Biol.. 2022;60:621-626.
- [CrossRef] [Google Scholar]
- Simultaneous determination of three coumarins in rat plasma by HPLC-MS/MS for pharmacokinetic studies following oral administration of chimonanthi radix extract. J. Chromatogr. Sci.. 2020;58:922-928.
- [CrossRef] [Google Scholar]
- Chemical constituents from roots and rhizomes of Physochlaina infundibularis. Chin. Trad. Herb. Drugs.. 2013;44:938-941.
- [CrossRef] [Google Scholar]
- Active fragments-guided drug discovery and design of selective tropane alkaloids using ultra-high performance liquid chromatography-quadrupole time-of-flight tandem mass spectrometry coupled with virtual calculation and biological evaluation. Anal. Bioanal. Chem.. 2017;409:1145-1157.
- [CrossRef] [Google Scholar]
Appendix A
Supplementary material
Supplementary data to this article can be found online at https://doi.org/10.1016/j.arabjc.2024.105664.
Appendix A
Supplementary material
The following are the Supplementary data to this article:Supplementary data 1
Supplementary data 1


