

Translate this page into:
Development of a methodology based on headspace-gas chromatography-ion mobility spectrometry for the rapid detection and determination of patin fish oil adulterated with palm oil
⁎Corresponding author. widiastuti.setyaningsih@ugm.ac.id (Widiastuti Setyaningsih)
-
Received: ,
Accepted: ,
This article was originally published by Elsevier and was migrated to Scientific Scholar after the change of Publisher.
Peer review under responsibility of King Saud University.
Abstract
The present research intends to develop a new method based on headspace-gas chromatography-ion mobility spectrometry (HS-GC-IMS) for the detection and determination of patin fish oil adulterated with different percentages of palm oil, because it is a cheaper vegetable oil. Five variables that affect headspace generation (incubation time and temperature, amount of sample, injection volume, and pre-heating time) have been optimized by means of a Box Behnken design in combination with Response Surface Methodology. Then, repeatability and intermediate precision have been studied where coefficients of variation lower than 10% were obtained. This new method has been applied to several samples of patin fish oil adulterated with palm oil at 20 different levels (5–50% palm oil content). The results have confirmed the suitability of the HS-GC-IMS for a rapid, easy, and reliable detection and discrimination of adulterated oil samples since a characteristic fingerprint that allows 100% successful discrimination between adulterated and unadulterated patin oil samples was achieved. Finally, a regression model has been developed to determine each sample’s adulteration level with an error lower than 10% and a coefficient of determination greater than 0.95.
Keywords
Patin fish oil
Palm oil
Adulteration
Ion mobility spectrometry
Chemometrics
Fingerprint

1 Introduction
The numerous research studies that have been carried out during recent years have allowed us to expand our knowledge on the processes taking place in the human body and how different diets, which include the consumption of different kinds of fat, affect human health. Fats have proven to be essential for life as a source of vitamins and energy (Julibert et al., 2019; Bockisch, 1998). Fats consumed by humans may come from animals (such as meat, egg, fish, and milk) or plants (such as beans, coconut, corn, palm, and soybean) (Abbott et al., 2019; Akbari et al., 2019; Wei et al., 2019).
Patin fish oil (PFO) is one of the fat types that is most appreciated by current consumers because of its high content in ω-3 fatty acids. PFO has been proven to be closely associated to the improvement of brain development as well as to the prevention of cancer, cardiovascular diseases or Alzheimer (Cho et al., 2018; Jicha, 2010; Mougios et al., 2001; Saboo et al., 2019; Severson et al., 2018). For this reason, a number of fish oil concentrate pills have been commercialized as dietary supplements, and PFO has even been incorporated into animals’ feed (Jiang et al., 2019; Mengelberg et al., 2018).
However, because of the high concentration of polyunsaturated fatty acids present in PFO, it is highly susceptible to oxidation processes, which means a rapid quality deterioration of this oil (EFSA, 2010; Xu et al., 2015). In order to reduce the amount of oxidation and also for economic reasons, PFO is often adulterated with other cheaper oils, where palm oil (PO) is the most frequently used adulterant (Chong, 2012). Palm oil contains high levels of saturated fatty acids, and consequently, it is solid at ambient temperatures and presents a high resistance to oxidation processes. Furthermore, the PO is one of the cheapest fat types that can be obtained from plants (Lim et al., 2018; Nutongkaew et al., 2019; Sundaraja et al., 2020). Therefore, even if the PO is added to reduce oil susceptibility to oxidation, the adulteration of PFO with PO represents an economic fraud to consumers, since it is commercialized at the same price as pure PFO. In addition, it could pose a moral issue for consumers or even health problems related to allergies. In order to have closer control over these practices, a reliable and practical analytical method is required to detect adulterated oils.
Gas chromatography (GC) has been regularly employed as the standard analytical method to obtain the fish oil samples volatile compounds (VOCs) profile (Song and Liu, 2018) that would be used as a reference for further study on the flavor of the fish products. Some spectroscopic techniques (1H NMR, NIR, and MIR) have also been used to study the VOCs present in fish oil (Azizian et al., 2010; Igarashi et al., 2000; Wu et al., 2014) and also to detect oil adulterations (Esteki et al., 2018a; Ghidini et al., 2019; Guyader et al., 2018; Ozulku et al., 2017). However, GC continues to be the most suitable method to determine oil VOC profiles (Callao and Ruisánchez, 2018; Chen et al., 2014; Esteki et al., 2018b). GC has also been coupled either to headspace (HS) to separate the VOCs from the sample or to Ion Mobility Spectrometry (IMS) in order to increase the selectivity in the oil sample analyses (Contreras et al., 2019; Liedtke et al., 2018; Rouseff and Cadwallader, 2001).
IMS has also been used to determine VOC contents. The compounds in the gas phase were ionized at atmospheric pressure, using ultraviolet radiation, electrospray, laser, or chemical ionization (Eiceman et al., 2013; Gabelica and Marklund, 2018). The ionized compounds, at atmospheric pressure, were separated into a drift tube under a constant electric field. Each ion then moved through the drift tube at a certain time that called drift time. The drift time of each ion is different depending on the size and geometric shape of the ion. Finally, the number of ions that reached the detector was translated into voltage units (signal intensity) (Borsdorf and Eiceman, 2006; Cumeras et al., 2015; Gabelica and Marklund, 2018).
IMS can be used either for the determination of VOC contents as well as to obtain the compounds’ characteristic fingerprints, which would allow discriminating between the different samples. IMS has been increasingly used in recent years because of its wide array of advantages, e.g., it does not require solvents and does not generate any residues. Additionally, IMS can provide a fast response (just a few ms for analyse and in a few minutes for GC pre-separation) and has a low detection limit (ppb range). This analytical technique has been effectively applied in many fields, including food research, for the detection of food fraud related to product adulteration (Aliaño-González et al., 2020; Contreras et al., 2019; Garrido-Delgado et al., 2018; Regueiro et al., 2017; Tzschoppe et al., 2016). Henceforth, this research aimed to develop an analytical method based on HS-GC-IMS to detect the adulteration of PFO with PO, as well as to determine specific adulteration levels.
2 Materials and methods
2.1 Samples
2.1.1 Oils
Patin (Pangasius micronemus) was chosen for the preparation of the fish oil samples since it is one of the most popular freshwater fish kinds in Indonesia and is consequently used as the main raw material in fish oil industries. It was acquired from a freshwater fish farm in Tulungagung (East Java, Indonesia). Patin fish oil (PFO) was elaborated following the Soxhlet method; 100 g of patin fish was extracted using 550 mL of n-hexane for 6 h at 85 °C to extract 55 g of fish oil. Then, the solvent was removed by rotary evaporation for 30 min at 40 °C and 60 rpm. These conditions are in compliance with the method reported by Sahena et al. (2010) with minor changes. The palm oil (PO) was obtained from local markets in East Java, Indonesia. All of the samples were kept at room temperature in glass vials until their analysis.
2.1.2 Adulteration
The adulterated samples (10 g) were prepared according to the following proportions: 5, 7, 10, 12, 15, 17, 20, 22, 25, 27, 30, 32, 35, 37, 40, 42, 45, 47, 49, and 50% (w/w) of PO in PFO. Three samples of unadulterated PFO (0% PO) and two samples of pure PO (100% PO) were also included in the experiments. Hence, a total of 25 samples were available for analysis as follows: 3 samples of pure PFO, 2 samples of pure PO, and 20 samples of adulterated PFO.
The samples were labeled according to their percentage of PO (X%) content and to the sample replication (R1, R2, and R3 when applicable), i.e., X%_Rn. The analysis replicate was also designated as A or B. For example, the first analysis of the duplicate of an unadulterated PFO sample was labeled as 0%_R2_A.
2.2 Headspace-Gas Chromatography-Ion Mobility Spectrometry (HS-GC-IMS)
The samples were analyzed by means of an HS-GC-IMS Flavour Spec (G.A.S., Dortmund, Germany). The vials containing adulterated PFO or pure PFO/PO were placed into the auto-sampler oven. The samples were then agitated and heated to generate their HS. A multi-capillary column MCC OV-5 (5% diphenyl, 95% dimethylpolysiloxane, 20 cm × 0.2 μm, G.A.S., Dortmund, Germany) was used. Nitrogen (99.999%) was used as the drift and carrier gas. The ionization source used was 3H Tritium beta radiation. The GC-IMS conditions were as follows: 55 °C column temperature (T2), 55 °C equipment temperature (T1), 80 °C injector temperature (T3), and 80 °C system temperature (T4). The initial carrier gas flow of 2 mL min−1 was held for 5 min, followed by a gas flow ramp of 5 mL min−1 which was kept for 3 min and then followed by a gas flow ramp of 10 mL min−1, which was held for 2 min and followed by another gas flow ramp of 25 mL min−1 kept for 5 min. The N2 flow inside the drift tube, in the opposite direction to that of the gas flow, was kept at 250 mL min−1. These specific conditions were selected based on the literature and on the previous experience in the research group in similar samples.
A Box-Behnken design with Response Surface Methodology was used to optimize the conditions for the HSs, as described in Section 2.2.1. Generally, the signals received by the IMS detector were not affected by the system and injector temperatures, so these temperatures were fixed at 45 °C and 80 °C, respectively. Meanwhile, the column temperature was set 5 °C over that of the incubation temperature in order to avoid condensation.
HS-GC-IMS presented two-dimensional data matrices: GC information (retention time) along the Y-axis and IMS information (drift time) along the X-axis. This kind of matrix provides a large amount of information and facilitates the identification of each separate compound. However, these matrices contain roughly 4,050,000 data points, which makes them complicated and tedious to be used for quality control analyses. This study proposes Ion Mobility Sum Spectrum (IMSS) for the treatment of IMS data. The IMSS is the resulting spectrum from the total intensities of all the VOC profiles regardless of their GC. Each compound’s drift time is normalized by the software according to the signal from the water in the air that has been ionized by tritium beta radiation, viz., Reaction Ion Peaks (RIP). The value of RIP represents the total of all the ions available for ionization. Hence, it is assigned as the reference signal. IMSS includes the total intensity data from 4500 drift times (from 0.00 to 4.500 (RIP relative)).
Laboratory Analytical Viewer software (LAV) (G.A.S., Dortmund, Germany) was used to calculate each sample’s IMSS. The IMSS allows all the VOCs to appear in the graph (Fig. 1), where the number of drift times was reduced to a 1170 range (drift time 1.030 to 2.200 (RIP relative)).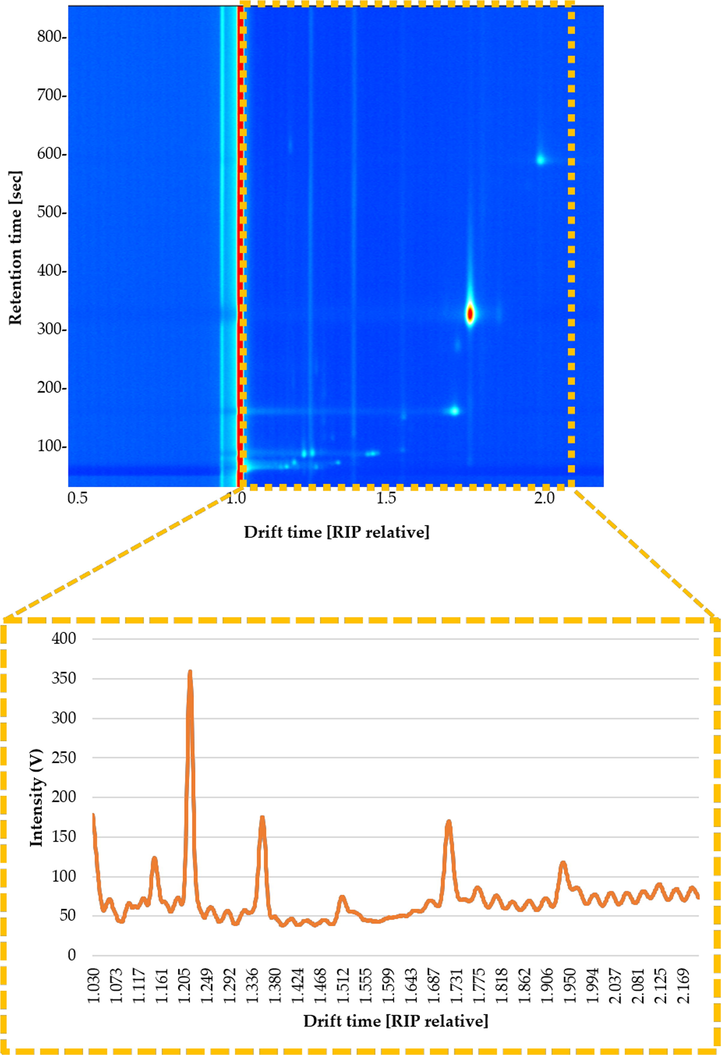
Topographic plot of the GC–IMS spectra obtained from patin fish oil sample under the optimized conditions. The interested zone of each topographic plot is highlighted (yellow rectangle). The graphic below shows the resulting IMSS corresponding to this zone (intensity vs. drift time) after adding the intensities across the chromatographic profile.
2.2.1 Box-Behnken design-Response Surface methodology
Some independent variables have been proven to be related to the signal of the IMS spectra, especially those that affect the levels of the VOCs in the HS injected into the GC-IMS system (Aliaño-González et al., 2020). Such variables comprise the amount of sample, the injection volume, the incubation time, and the temperature (Snow and Slack, 2002). Furthermore, the oils pre-heating time to reach ambient temperature (25 °C) before the analysis was carried out. Therefore, a total of five variables were selected to be optimized, namely the amount of sample, incubation temperature and time, injection volume, and pre-heating time (Table 1). Three levels (low, middle, and high points) were assigned to each variable.
Variable
−1
0
1
x1, incubation time (min)
5
10
15
x2, Incubation temperature (°C)
30
52.5
75
x3, Injection volume (mL)
0.4
0.7
1
x4, Amount of sample (g)
0.1
0.5
0.9
x5, Preheating time (min)
5
15
25
Since a rapid analytical method was to be developed, both incubation and pre-heating time were set at a maximum of 15 and 25 min, respectively. On the other hand, the incubation volume, as well as its temperature, were established based on the equipment options. In contrast, the amount of sample was selected based on previous results with food matrices. Agitation was not considered as an important variable; thus, it was set at 500 rpm for 5 s of agitation and 2 s idle time.
A Box-Behnken design with response surface methodology was selected for the optimization of the analytical conditions. The design was based on 46 experiments with six central points (Table S1). The experiments were conducted in random order.
The main objective of the optimization was to maximize the differences between PFO and PO in order to ensure the highest feasible efficiency with regards to the discrimination between the adulterated samples. Therefore, two types of oil samples (PFO and PO) were analyzed for the 46 basic unit experiments for the BBD. Then, a total of 92 unit experiments were carried out.
2.3 Data analysis
Statgraphics Centurion XVI.I (Statgraphics Technologies, Inc. The Plains, Virginia, USA) was used to generate the BBD and for the RSM analysis to determine the best HS-generating conditions. Such optimum conditions were then applied to the analysis of the adulterated samples based on their IMSSs. Different chemometric tools were employed to evaluate the suitability of the method when applied to the detection of adulterated PFO. Linear Discriminant Analysis (LDA) and Partial Least Squares Regression (PLS) were calculated by means of IBM SPSS Statistics 22 (Armonk, NY, USA) and Unscrambler (version 10.1, Camo Software AS, Oslo, Norway) respectively.
3 Results and discussion
3.1 Optimization of the method
The main goal of this study was to develop an analytical method that is suitable for the detection and determination of the adulteration levels of PFO with PO. The foremost step, namely the optimization of the five headspace variables, was conducted by means of BBD-RSM.
For each set of experiments that comprised 46 runs of the design, two kinds of oil samples were used: pure PFO and pure PO. The IMSS obtained from the analysis and the drift times data were reduced to the range of interest, i.e., 1.030 to 2.200 (RIP relative). The intensity differences between pure PFO and pure PO at the 1170 drift times were calculated for each experimental set. The differences between each drift time were considered as the responses. The experimental discriminant values were then adjusted to the predicted values obtained from the polynomial function model (Eq. (1)).
In this equation, Y is the predicted response; i.e. the difference between the intensities obtained from the PFO and PO samples within the studied drift time range. β0 represents the ordinate at the origin; x1, x2,….., xk are the variables that influence the response. βi represents the linear coefficients; βii are the quadratic coefficients, and; βij are the cross-product coefficients.
The coefficients of the different parameters in the quadratic equation and their significance (p-values) are indicated in Table 2.
Variable
Coefficient
Sum of Squares
Degrees of freedom
Mean Square
F-value
p-Value
β0
3958.72
x1
−1274.55
25,991,600
1
25,991,600
6.78
0.0153
x2
−797.35
10,172,300
1
10,172,300
2.65
0.1159
x3
1012.59
16,405,400
1
16,405,400
4.28
0.0491
x4
43.07
29,679
1
29,679
0.01
0.9306
x5
−646.65
6,690,520
1
6,690,520
1.74
0.1985
x12
1214.69
12,876,800
1
12,876,800
3.36
0.0788
x1x2
−2976.87
35,447,000
1
35,447,000
9.24
0.0055
x1x3
404.37
654,050
1
654,050
0.17
0.6831
x1x4
−221.02
195,396
1
195,396
0.05
0.8232
x1x5
1584.93
10,048,000
1
10,048,000
2.62
0.118
x22
1722.41
25,891,100
1
25,891,100
6.75
0.0155
x2x3
−2203.84
19,427,600
1
19,427,600
5.07
0.0334
x2x4
−3.08
38.0011
1
38.0011
0.00
0.9975
x2x5
−765.85
2,346,120
1
2,346,120
0.61
0.4414
x32
178.87
279,212
1
279,212
0.07
0.7895
x3x4
12.65
640.191
1
640.191
0.00
0.9898
x3x5
−484.60
939,348
1
939,348
0.24
0.6249
x42
−566.82
2,803,890
1
2,803,890
0.73
0.4006
x4x5
−199.36
158,983
1
158,983
0.04
0.8403
x52
671.86
3,939,490
1
3,939,490
1.03
0.3205
Pure error
95,855,800
25
3,834,230
Total
271,085,000
45
The coefficient of determination (R2) of the model was 80% when the significant variables (p < 0.05) were considered. In this case, the significant variables were incubation time (p = 0.0153), injection volume (p = 0.0491), quadratic incubation temperature (p = 0.0155), interaction between incubation time and incubation temperature (p = 0.0055), and interaction between incubation temperature and injection volume (p = 0.0334).
The regression coefficient (β) of the injection volume and the quadratic incubation temperature were 1012.59 and 1722.41, respectively. These positive values indicate a positive effect, which means that the higher the value of the factors, the higher the differences between the samples. On the contrary, a negative value of the regression coefficient of the incubation time (β = −1274.55), the incubation time × the incubation temperature (β = −2976.87) or the incubation temperature × the injection volume (β = −2203.84) indicate a negative effect; hence the lower the value of these factors, the higher the differences between the samples.
3.2 Optimized conditions
Based on the results obtained from the BBD-RSM, the optimum conditions for the analysis to ensure the maximum differences between pure PFO and pure PO were established at 0.36 g sample, 5 min pre-heating time, 75 °C incubation for 5 min and 0.65 mL injection volume. Although the optimum pre-heating and incubation time were at the lowest level in the experimental design domain, 5 min was the minimum time required to reach a stable pre-heating process and to generate a stable headspace. Hence, any pre-heating and incubation time under 5 min were discarded for the experiments. On the other hand, the optimum incubation temperature was at the highest level of the range considered, since this was the maximum temperature provided by the system and, therefore, no higher temperatures could be verified.
3.3 Precisions of the method
Once the optimum conditions for the discrimination of pure PFO and pure PO had been obtained, the precision of the new method was to be determined. Therefore, the intraday and intermediate precision of the method with regards to the differences between the oil samples were determined.
A total of 12 experiments on two types of samples (pure PFO and pure PO), i.e., a total of 24 samples, were analyzed under the established optimum conditions. Six of the experiments were completed on the same day, and the other six were distributed in 3-experimental batches every other two days.
The IMSS was acquired for each analysis, and the sum of the differences between sample intensities at the selected drift times (1.030 to 2.200 (RIP relative)) was calculated. The coefficient of variation (CV) was selected as the statistical reference to determine data variations. A high level of precision of the method was confirmed, since the CV values remained below 10%, both for repeatability (6.1%) and intermediate precision (5.2%).
3.4 Analysis of the adulterated samples
The next step was related to the identification and discrimination of the PFO samples that had been adulterated with the PO. A total of 46 IMSS (3 replica of pure PFO and 20 levels of adulteration in duplicate samples) were determined and reduced to the drift time range of interest (1.030 to 2.200 (RIP relative)). The IMSSs were then normalized to their maximum intensity at each drift time within the range studied.
The chemometric tools were applied in order to discriminate the relevant information and to classify the samples. Therefore, an LDA was applied to the 46 IMSSs at the 1170 drift times, where two groups of samples were considered: (0) unadulterated oils and (1) adulterated oils. As much as 75% of the samples were chosen to develop the method, while 25% of them were used to validate it. A stepwise method was used for the statistical calculations, and 100% of the samples were successfully classified. These results corroborate the suitability of the method to discriminate between samples that had been previously adulterated with palm oil at percentages between 5 and 50%.
All the samples were subjected to LDA to obtain a canonical discriminant function represented in Fig. 2. It can be seen that the unadulterated samples (pure PFO) are located in the positive value area between 3 and 6, while the adulterated samples exhibit negative and lower positive scores than the pure PFO ones. This fact indicates that fully (100%) successful discrimination between unadulterated and adulterated samples was achieved.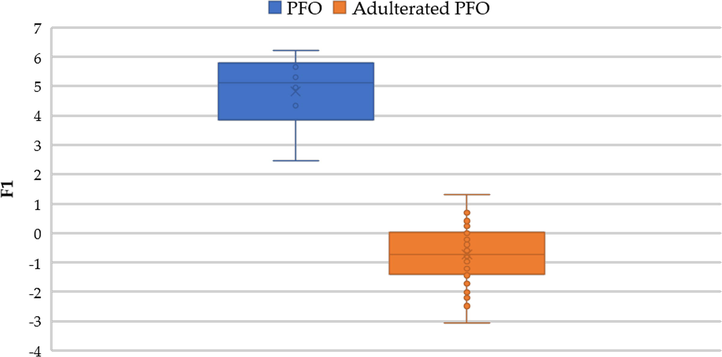
Pure PFO samples (6) adulterated PFO samples (40) represented according to the discriminant scores obtained from the F1 in LDA.
Four drift times were selected as relevant discriminants in the Fisher’s linear discriminant function: 1.150, 1.717, 1.953, and 1.956 (RIP relative). The average intensity of the two groups (pure PFO and adulterated samples) was calculated for each one of the above mentioned four drift times, and the values were normalized to their maximum intensity within each range. A characteristic fingerprint corresponding to each group was obtained. Both groups showed similar intensities at 1.953 and 1.956 (RIP relative) (Fig. 3), which is most likely explained by the presence of particular compounds in the PFO samples. The intensity differences at 1.150 and 1.717 (RIP relative) and the ratios between them allow for the practical detection of oil adulteration.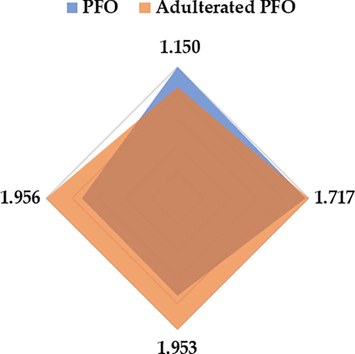
Pure and adulterated PFO characteristic fingerprints.
A Partial Least Square Regression (PLS) was applied in order to design a calibration model that would establish a correlation between each sample’s IMSS and its adulteration level. Such a model should allow determining PO content levels in the adulterated samples.
The model was generated for the following adulteration levels: 5, 7, 10, 15, 17, 20, 22, 27, 30, 32, 35, 40, 42, 45, 47, 49, and 50%. The samples with adulteration levels 12, 25, and 37%, which had not been included in the model construction process, were selected for external validation purposes. The results are presented in Fig. 4. The coefficient of determination of the proposed model was greater than 0.90. The model prediction capabilities were evaluated by calculating the root-mean-square error of calibration (RMSEC) and the root-mean-square error of prediction (RMSEP). The values obtained were 3.6% and 4.9%, respectively.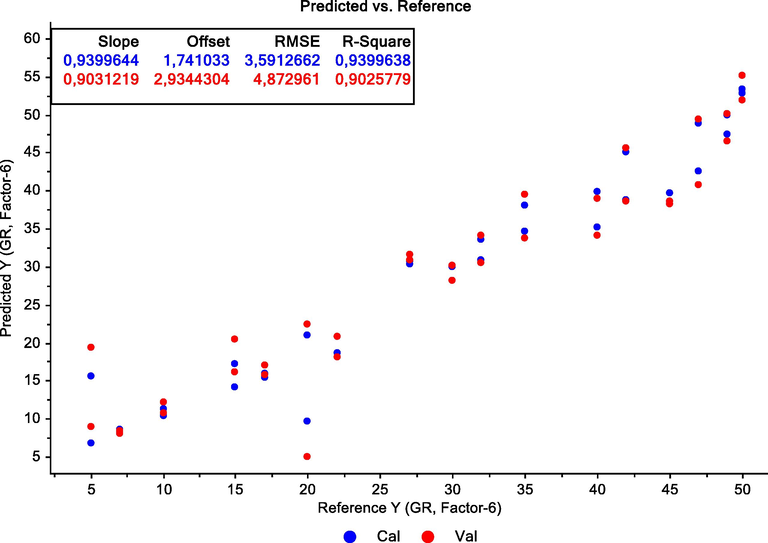
Partial Least Square Regression of fish oil adulterated with palm oil by 5, 7, 10, 15, 17, 20, 22, 27, 30, 32, 35, 40, 42, 45, 47, 49, and 50%.
Finally, the multivariate regression obtained for the method was applied to the validation samples, i.e., the samples with 12, 25, and 37% PO contents. The prediction error average was 8.81% (below 10% in all the cases). These results confirmed the accuracy and robustness of the methodology employed, i.e., the suitability of fingerprints to detect the presence of palm oil in fish oil as well as the appropriateness of a regression model to predict adulteration levels.
4 Conclusions
A method based on HS-GC-IMS has been optimized by applying experimental design to the detection and content-level discrimination of palm oil content in patin fish oil samples. The repeatability and intermediate precision of the developed method have been confirmed by CVs lower than 10%. Furthermore, the method has been applied to a number of oil samples that had been previously adulterated at 20 different levels. Fully (100%) successful discrimination was achieved both for pure PFO and adulterated samples, even when the samples had the lowest adulterant content in the study (5%). A fingerprint has been developed based on just the total signal voltage intensity at each one of four specific drift times, which allows us to consistently detect the presence of PO in a particular PFO sample in just a few minutes. Finally, a model, with a regression error below 10%, has been generated to determine each sample’s adulteration level. Given the discrimination level (100%) and the precision level (<10%) achieved by HS-GC-IMSS in combination with characteristic fingerprints at specific drift times and the corresponding regression model, this methodology can be considered a rapid, reliable and practical way to detect and precisely determine any adulteration of patin fish oil with palm oil. It must be noted that no additional analyses on chemical standards, nor pure patin fish oil, nor palm oil are needed to apply the fingerprint and the regression model, because of the standardized data are used for detection and quantification purposes.
CRediT authorship contribution statement
Anggita Rosiana Putri: Investigation, Formal analysis, Writing - original draft, Funding acquisition. Maria José Aliaño-González: Investigation, Formal analysis, Writing - original draft. Marta Ferreiro: Supervision, Writing - review & editing. Widiastuti Setyaningsih: Conceptualization, Methodology, Formal analysis, Writing - original draft. Abdul Rohman: Supervision, Writing - review & editing. Sugeng Riyanto: Visualization, Writing - review & editing. Miguel Palma: Conceptualization, Validation, Writing - review & editing.
Acknowledgments
A.R.P. acknowledges the financial support received through a research grant of “Peningkatan Kualitas Publikasi Internasional (PKPI)/Sandwich like 2019” and “Pendidikan Magister menuju Doktor untuk Sarjana Unggul (PMDSU)” with a contract number of 3160/UN1.DITLIT/DIT-LIT/PT/2020 awarded by the Directorate General of Higher Education (DIKTI), Ministry of Research, Technology and Higher Education of the Republic of Indonesia.
References
- The effect of high fat, high sugar, and combined high fat-high sugar diets on spatial learning and memory in rodents: a meta-analysis. Neurosci. Biobehav. Rev.. 2019;107:399-421.
- [CrossRef] [Google Scholar]
- Akbari, M., Eskandari, M.H., Davoudi, Z., 2019. Application and functions of fat replacers in low-fat ice cream: a review. Trends Food Sci. Technol. doi:10.1016/j.tifs.2019.02.036
- Novel method based on ion mobility spectroscopy for the quantification of adulterants in honeys. Food Control. 2020;107236
- [CrossRef] [Google Scholar]
- Rapid quantitation of fish oil fatty acids and their ethyl esters by FT-NIR models. Eur. J. Lipid Sci. Technol.. 2010;112:452-462.
- [CrossRef] [Google Scholar]
- Bockisch, M., 1998. The importance of fats. In: Academic Press (Ed.), Fats and Oils Handbook. Elsevier, Cambridge, United Kingdom, pp. 1–52. doi:10.1016/b978-0-9818936-0-0.50006-8.
- Ion mobility spectrometry: principles and applications. Appl. Spectrosc. Rev.. 2006;41:323-375.
- [CrossRef] [Google Scholar]
- An overview of multivariate qualitative methods for food fraud detection. Food Control. 2018;86:283-293.
- [CrossRef] [Google Scholar]
- The analysis of trans fatty acid profiles in deep frying palm oil and chicken fillets with an improved gas chromatography method. Food Control. 2014;44:191-197.
- [CrossRef] [Google Scholar]
- The effect of human thymus fat-derived mesenchymal stem cell on myocardial infarcted rat model. Hear. Lung Circ.. 2018;27:S509.
- [CrossRef] [Google Scholar]
- Chong, C.L., 2012. Measurement and maintenance of palm oil quality. In: Palm Oil. Elsevier, pp. 431–470. doi:10.1016/B978-0-9818936-9-3.50018-6
- Contreras, M. del M., Arroyo-Manzanares, N., Arce, C., Arce, L., 2019. HS-GC-IMS and chemometric data treatment for food authenticity assessment: Olive oil mapping and classification through two different devices as an example. Food Control 98, 82–93. doi:10.1016/J.FOODCONT.2018.11.001.
- Review on ion mobility spectrometry. Part 1: current instrumentation. Analyst. 2015;140:1376-1390.
- [CrossRef] [Google Scholar]
- Scientific opinion on fish oil for human consumption. Food hygiene, including rancidity. EFSA J.. 2010;8:1874.
- [CrossRef] [Google Scholar]
- Use of spectroscopic methods in combination with linear discriminant analysis for authentication of food products. Food Control. 2018;91:100-112.
- [CrossRef] [Google Scholar]
- A review on the application of chromatographic methods, coupled to chemometrics, for food authentication. Food Control. 2018;93:165-182.
- [CrossRef] [Google Scholar]
- Eiceman, G.A., Karpas, Z., Hill., H., 2013. Ion Mobility Spectrometry. third ed. CRC Press. doi:10.1201/b16109.
- Fundamentals of ion mobility spectrometry. Curr. Opin. Chem. Biol.. 2018;42:51-59.
- [CrossRef] [Google Scholar]
- Detection of adulteration in extra virgin olive oils by using UV-IMS and chemometric analysis. Food Control. 2018;85:292-299.
- [CrossRef] [Google Scholar]
- Approaching authenticity issues in fish and seafood products by qualitative spectroscopy and chemometrics. Molecules. 2019;24:1812.
- [CrossRef] [Google Scholar]
- Authentication of edible fats and oils by non-targeted 13C INEPT NMR spectroscopy. Food Control. 2018;91:216-224.
- [CrossRef] [Google Scholar]
- Nondestructive quantitative determination of docosahexaenoic acid and n−3 fatty acids in fish oils by high-resolution 1 H nuclear magnetic resonance spectroscopy. J. Am. Oil Chem. Soc.. 2000;77:737-748.
- [CrossRef] [Google Scholar]
- Alleviated systemic oxidative stress effects of combined atmospheric oxidant capacity by fish oil supplementation: a randomized, double-blinded, placebo-controlled trial. Ecotoxicol. Environ. Saf.. 2019;184:109598
- [CrossRef] [Google Scholar]
- Omega-3 fatty acids: potential role in the management of early Alzheimer’s disease. Clin. Interv. Aging. 2010;45
- [CrossRef] [Google Scholar]
- Julibert, A., Bibiloni, M. del M., Tur, J.A., 2019. Dietary fat intake and metabolic syndrome in adults: a systematic review. Nutr. Metab. Cardiovasc. Dis. 29, 887–905. doi:10.1016/J.NUMECD.2019.05.055
- Coupling laser desorption with gas chromatography and ion mobility spectrometry for improved olive oil characterisation. Food Chem.. 2018;255:323-331.
- [CrossRef] [Google Scholar]
- Lim, S.Y., Abdul Mutalib, M.S., Khaza’ai, H., Chang, S.K., 2018. Detection of fresh palm oil adulteration with recycled cooking oil using fatty acid composition and FTIR spectral analysis. Int. J. Food Prop. 21, 2428–2451. doi:10.1080/10942912.2018.1522332
- Fish oil supplement use in New Zealand: a cross-sectional survey. Complement. Ther. Clin. Pract.. 2018;33:118-123.
- [CrossRef] [Google Scholar]
- Effect of supplementation with conjugated linoleic acid on human serum lipids and body fat. J. Nutr. Biochem.. 2001;12:585-594.
- [CrossRef] [Google Scholar]
- The potential of palm oil production as a pathway to energy security in Thailand. Sustain. Energy Technol. Assess.. 2019;35:189-203.
- [CrossRef] [Google Scholar]
- Rapid detection of adulteration of cold pressed sesame oil adultered with hazelnut, canola, and sunflower oils using ATR-FTIR spectroscopy combined with chemometric. Food Control. 2017;82:212-216.
- [CrossRef] [Google Scholar]
- Targeted approach for qualitative screening of pesticides in salmon feed by liquid chromatography coupled to traveling-wave ion mobility/quadrupole time-of-flight mass spectrometry. Food Control. 2017;78:116-125.
- [CrossRef] [Google Scholar]
- Rouseff R.L., Cadwallader K.R., eds. Headspace Analysis of Foods and Flavors, Advances in Experimental Medicine and Biology. US, Boston, MA: Springer; 2001.
- [CrossRef]
- Saboo, B., Singh, R.B., Bhardwaj, K., Maheshwari, A., Verma, N., Vargova, V., Pella, D., 2019. Fats and oils for health promotion and disease prevention. In: The Role of Functional Food Security in Global Health. Elsevier, pp. 273–285. doi:10.1016/b978-0-12-813148-0.00016-5
- Fatty acid compositions of fish oil extracted from different parts of Indian mackerel (Rastrelliger kanagurta) using various techniques of supercritical CO2 extraction. Food Chem.. 2010;120:879-885.
- [CrossRef] [Google Scholar]
- Roundtable discussion: Dietary fats in prevention of atherosclerotic cardiovascular disease. J. Clin. Lipidol. 2018
- [CrossRef] [Google Scholar]
- Head-space analysis in modern gas chromatography. TrAC Trends Anal. Chem.. 2002;21:608-617.
- [CrossRef] [Google Scholar]
- GC-O-MS technique and its applications in food flavor analysis. Food Res. Int.. 2018;114:187-198.
- [CrossRef] [Google Scholar]
- Confronting the palm oil crisis: Identifying behaviours for targeted interventions. Environ. Sci. Policy. 2020;103:99-106.
- [CrossRef] [Google Scholar]
- Using ion mobility spectrometry for screening the autoxidation of peanuts. Food Control. 2016;64:17-21.
- [CrossRef] [Google Scholar]
- Human milk fat substitutes: Past achievements and current trends. Prog. Lipid Res.. 2019;74:69-86.
- [CrossRef] [Google Scholar]
- Comparison of infrared spectroscopy and nuclear magnetic resonance techniques in tandem with multivariable selection for rapid determination of ω-3 polyunsaturated fatty acids in fish oil. Food Bioprocess Technol.. 2014;7:1555-1569.
- [CrossRef] [Google Scholar]
- An overview on nondestructive spectroscopic techniques for lipid and lipid oxidation analysis in fish and fish products. Compr. Rev. Food Sci. Food Saf.. 2015;14:466-477.
- [CrossRef] [Google Scholar]
Appendix A
Supplementary material
Supplementary data to this article can be found online at https://doi.org/10.1016/j.arabjc.2020.08.026.
Appendix A
Supplementary material
The following are the Supplementary data to this article:Supplementary Table S1
Supplementary Table S1


