

Development of a novel unified quality control strategy for proprietary Chinese medicines
⁎Corresponding authors at: State Key Laboratory Breeding Base of Dao-di Herbs, National Resource Center for Chinese Materia Medica, China Academy of Chinese Medical Sciences, Beijing 100700, PR China. laichangjiang44@126.com (Chang-Jiang-Sheng Lai), huangluqi01@126.com (Lu-Qi Huang)
-
Received: ,
Accepted: ,
This article was originally published by Elsevier and was migrated to Scientific Scholar after the change of Publisher.
Abstract
There is no effective method for unified quality evaluation for the same medicinal materials in similar prescriptions. In this study, we used Ginseng-Fuzi (Aconitum carmichaelii) proprietary Chinese medicines (GFPCMs), with different dosage forms, as examples to develop a new unified quality control strategy. Thus, using a high performance liquid chromatography-tandem mass spectrometry method, coupled with unified quality evaluation strategies to comprehensively characterize the contents of 12 aconitines and 25 ginsenosides containing eight groups of isomers in 10 GFPCMs. Quality control was carried out for the first time for aconitines and ginsenosides in Jianbuqiangshen Pill, Nanbao Capsule, Nvbao Capsule, Pingfengshengmai Capsule, Wumei Pill, and Xinbao Pill. Furthermore, 4 aconitines and 16 ginsenosides were firstly quantified in all 10 GFPCMs. Subsequently, there was a comprehensive comparison of the universality and accuracy of the quality control strategies based on absolute, normalized, and unit content. It was indicated the strategy-based unit content was more practical and effective. As for Fuzi, the total unit content of diester alkaloids should be less than 0.020%, while monoester alkaloids should be more than 0.010%. As for ginseng, the total unit content of Rb1, Rb2, Rc, Rg5, and Re should be higher than 2.0%, and the unit content of Rg5 was a good indicator for the classification of the dosage forms and processing methods. In summary, this strategy showed great potential for supervising the quality of Chinese medicine.
Keywords
Aconitine
Ginsenoside
Proprietary Chinese Medicine
Unified Quality Control Strategy
High Performance Liquid Chromatography-tandem Mass Spectrometry

1 Introduction
Proprietary Chinese medicine (PCM) is widely used for the prevention and treatment of diseases in clinics (Cheng et al., 2011, Liu et al., 2015, Lin et al., 2020, Lu et al., 2020, Xia et al., 2020, Qiu et al., 2021). However, the current mainstream quality control methods for PCMs in the Chinese Pharmacopoeia only specify the content of singlural ingredients (Commission 2020). In recent years, fingerprint (Chang et al., 2008, Xu et al., 2009, Yang et al., 2011, Cao et al., 2020), multi-ingredients quantification (Xu et al., 2009, Yang et al., 2011, Song et al., 2015, Pang et al., 2019, Cao et al., 2020), multivariate statistical analysis (Xu et al., 2009, Ding et al., 2021), and scanning electron microscopy (Peng and Tsai, 2020) have been used individually or in combination for quality evaluation of Chinese medicine prescriptions with high integrality, throughput, and specificity. Whereas, none of them could be effectively conducted for unified quality evaluation of PCMs containing the same Chinese medicine. Therefore, there is an urgent need to find a new unified quality control strategy to ensure their safety and effectiveness. For this reason, we speculated whether it would be possible to establish a method based on normalized content or unit content for unified quality evaluation of complex PCMs.
Previously, our group conducted extensive research on ginseng and Fuzi (lateral root of Aconitum carmichaelii), but the study of unified quality control strategies has not been covered (Lai et al., 2015, Yue et al., 2018, Qiu et al., 2020, Qiu et al., 2020, Chen et al., 2021, Qiu et al., 2021, Qiu et al., 2021). Shenfu preparations containing various dosage forms, e.g. Renshenzaizao Pill (RSP), Shenfuqiangxin Pill (SFP), Xinbao Pill (XBP), have been widely used in TCM clinical. The synergistic attenuation of the compatibility with Fuzi and ginseng has been confirmed in vitro and in vivo (He et al., 2015, Chen et al., 2019, Wei et al., 2019). It has been shown that the compatibility of ginseng and Fuzi can increase the in vivo absorption and the action time of key active components in Fuzi (He et al., 2015, Xu et al., 2020, Xie et al., 2021). However, there is still a lack of a unified quality control method for evaluating the quality of ginseng and Fuzi in Ginseng-Fuzi proprietary Chinese medicines (GFPCMs).
In this study, GFPCMs were used as examples to develop a new unified quality control strategy for effective evaluation of the quality of the same medicinal materials, i.e. ginseng and Fuzi. Firstly, a high performance liquid chromatography-tandem mass spectrometry (HPLC-MS/MS) was developed for the simultaneous determination of 12 aconitines and 25 ginsenosides, including eight groups of isomers of ginsenosides in 10 GFPCMs with multi-type of dosage forms. Secondly, the determined absolute contents were converted to the normalized content and unit content for the development of the quality evaluation methods. The unit content was proposed for quality control PCMs for the first time. The hierarchical clustering analysis (HCA) could clearly distinguish product types and effectively find key quality markers. Ultimately, the new quality evaluation method based on unit content was the most suitable for quality control of ginseng and Fuzi in GFPCMs. Moreover, their practical and effective unit content limit was also proposed for GFPCMs.
2 Experimental
2.1 Materials and reagents
A total of 10 GFPCMs, including Jianbuqiangshen Pill (JBP), Nanbao Capsule (NAC), Nvbao Capsule (NVC), Pingfengshengmai Capsule (PFC), Qiliqiangxin Capsule (QLC), RSP, SFP, Shenguilizhong Pill (SGP), Wumei Pill (WMP) and XBP, were purchased from the local pharmacies of Nanchang, China, the manufactures and batch numbers were detailly listed in Table 1.
| GFPCM | Manufacturer | Batch No. |
|---|---|---|
| JBP | Beijing Tong Ren Tang Co., Ltd. | 20030008 |
| NAC | Jilin Jibang Pharma Co., Ltd. | 20200603 |
| NVC | Jilin Jibang Pharma Co., Ltd. | 20190602 |
| PFC | Shanxi Huakang Pharma Co., Ltd. | 20201102 |
| QLC | Shijiazhuang Yiling Pharma Co., Ltd. | A1911002 |
| RSP | Jiangxi Yaodou Zhangshu Pharma Co., Ltd. | 200801 |
| SFP | Tianjin Zhongxin Pharma Co., Ltd. | 10500002 |
| SGP | Beijing Tong Ren Tang Co., Ltd. | 20010559 |
| WMP | Yunnan Tengyao Pharma Co., Ltd. | 20201029 |
| XBP | Guangdong Taiantang Pharma Co., Ltd. | C20191204 |
The 32 authentic compounds including aconitine (AT), mesaconitine (MAT), hypaconitine (HAT), benzoylaconine (BAC), benzoylmesaconine (BMA), benzoylhypaconine (BHA), aconine (AC), songorine (SGR), indaconitine (INAT), yunaconitine (YUAT), ginsenoside compound K (CK), panaxadiol (PD), panaxatriol (PT), protopanaxatriol (PPT), ginsenoside Rc (Rc), ginsenoside Rd (Rd), 5,6-dehydrogensenoside Rd (De-Rd), ginsenoside Rd2 (Rd2), ginsenoside Re (Re), ginsenoside Rf (Rf), ginsenoside Rg2 (Rg2), ginsenoside Rg3 (Rg3), ginsenoside Rg5 (Rg5), ginsenoside Rg6 (Rg6), ginsenoside Rh1 (Rh1), ginsenoside Rh2 (Rh2), ginsenoside Rk1 (Rk1), ginsenoside Ro (Ro), ginsenoside F3 (F3), ginsenoside F4 (F4), ginsenoside F5 (F5) and Pseudoginsenoside F11 (P-F11) were supplied by Beijing Rongcheng Xinde Technology Development Co., Ltd. (Beijing, China, HPLC purity >98%). The 2 authentic compounds including mesaconine (MA) and hypaconine (HA) were purchased from Chengdu Must Bio-technology Co., Ltd. (Chengdu, Sichuan, China). The 2 authentic compounds including protopanaxadiol (PPD) and ginsenoside Rb2 (Rb2) were acquired from Beijing Bethealth People Biomedical Technology Co., Ltd. (Beijing, China, HPLC purity >98%). The 2 authentic compounds including ginsenoside Rb1 (Rb1) and ginsenoside Rg1 (Rg1) were obtained from Beijing Solarbio Science & Technology Co., Ltd. (Beijing, China, HPLC purity >98%). Pure water was prepared from Mill-Q water purification system (Billerica, MA, USA). Methanol and acetonitrile (HPLC grade) which were purchased from ThermoFisher Scientific (San Jose, CA, USA). Ammonium chloride (AR) was purchased from Aladdin Industrial Corporation (Shanghai, China).
2.2 Standard solutions and sample preparation
Standard stock solutions were prepared by dissolving each reference compound in methanol at a concentration of 1 mg/mL and the solutions were kept at 4 °C until use. The pills were ground into powder using a mortar and pestle, while the powder contents of the capsules were taken after removing the capsule shell. The 0.5 g of each sample was weighed accurately and 5 mL of methanol was added. After weighing, each sample was ultrasonicated for 30 min, and the solvent loss was compensated after cooling to room temperature. Then 100 μL of the extract was mixed with 900 μL of methanol and filtered through a 0.22 μm microporous membrane for HPLC-MS/MS analysis. For the compounds with the content beyond the linear range of the standard curve, the sample was diluted for a certain proportion so that the content of the compound was in the linear range when the sample was determined.
2.3 HPLC-MS/MS conditions
The HPLC analysis was performed using a Shimadzu LC-30AD system (Kyoto, Japan) consisting of a binary pump and a sample manager. Chromatographic separation was performed on a Waters ACQUITY UPLC BEH C18 column (1.7 μm, 2.1 × 100 mm) protected by a Van Guard BEH C18 column (1.7 μm, 2.1 × 5 mm). The column temperature was maintained at 35 °C and the temperature of sample introduction chamber was set at 4 °C. The experiment was carried out at a flow rate of 0.4 mL/min. The injection volume was 2 μL. The gradient mobile phases consisted of acetonitrile (solvent B) and water (solvent A) containing 0.5 mM ammonium chloride. Gradient elution in positive ion mode was performed as follows: 0–2 min, 35% B; 2–4 min, 35%–85% B; 4–6 min, 85%–90% B; 6–7 min, 90%–100% B; 7–9 min, 100% B; 9–9.5 min, 100%–35% B; 9.5–12.5 min, 35 %B. As for gradient elution in negative ion mode: 0–2 min, 35 %B; 2–3 min, 35%–40% B; 3–5 min, 40%–50% B; 5–7 min, 50%–55% B; 7–9 min, 55%–80% B; 9–10 min, 80%–100% B; 10–12 min, 100% B; 12–12.5 min, 100%–35% B; 12.5–15.5 min, 35 %B.
QTRAP 4500 mass spectrometer (Applied Bio-systems, AB Sciex, USA) coupled with ESI source was used to mass analyze. The conditions for MS analysis were as follows: curtain gas was set at 35 psi, collision gas was set at medium, source temperature was set at 550 °C, gas1 and gas2 were both set at 55 psi. The ion spray voltage of positive and negative ion mode was set at 4.5 kV and −4.5 kV, respectively. Multiple reaction monitoring (MRM) mode was adopted for the detection of the target compounds. The declustering potential (DP) and collision energy (CE) were automatically optimized to enhance the intensity of ion pairs of all the target compounds. All final ion pairs and related parameters were determined as Table 2.
| Mode | Compound | RT (min) | Q1 | Q3 | Time (ms) | DP (V) | CE (V) |
|---|---|---|---|---|---|---|---|
| ESI+ | AC | 0.70 | 500.1 | 450.4 | 25 | 100 | 48 |
| ESI+ | MA | 0.70 | 486.1 | 436.0 | 25 | 100 | 49 |
| ESI+ | HA | 0.70 | 470.2 | 438.4 | 25 | 120 | 44 |
| ESI+ | Rg1 | 0.76 | 823.3 | 643.6 | 25 | 38 | 55 |
| ESI+ | SGR | 0.80 | 358.1 | 340.1 | 25 | 129 | 36 |
| ESI+ | BMA | 1.12 | 590.0 | 540.1 | 25 | 120 | 50 |
| ESI+ | BAC | 1.35 | 604.1 | 554.2 | 25 | 124 | 50 |
| ESI+ | BHA | 1.52 | 574.1 | 542.0 | 25 | 120 | 45 |
| ESI+ | F5 | 2.15 | 771.5 | 294.9 | 25 | 30 | 20 |
| ESI+ | F3 | 2.44 | 771.5 | 294.9 | 25 | 30 | 20 |
| ESI+ | MAT | 2.73 | 632.4 | 572.1 | 25 | 120 | 47 |
| ESI+ | Rh1 | 3.09 | 621.2 | 220.9 | 25 | 20 | 45 |
| ESI+ | HAT | 3.39 | 616.1 | 556.2 | 25 | 80 | 44 |
| ESI+ | AT | 3.43 | 646.2 | 586.2 | 25 | 100 | 47 |
| ESI+ | INAT | 3.48 | 630.2 | 570.1 | 25 | 80 | 47 |
| ESI+ | YUAT | 3.48 | 660.2 | 600.2 | 25 | 100 | 46 |
| ESI+ | PPT | 4.41 | 441.3 | 423.5 | 25 | 82 | 17 |
| ESI+ | PT | 4.72 | 441.3 | 423.5 | 25 | 82 | 17 |
| ESI+ | CK | 4.79 | 645.2 | 203.0 | 25 | 19 | 45 |
| ESI+ | Rh2 | 4.91 | 587.1 | 407.1 | 25 | 20 | 29 |
| ESI+ | PPD | 6.78 | 425.3 | 109.1 | 25 | 125 | 25 |
| ESI+ | PD | 6.96 | 461.3 | 443.4 | 25 | 100 | 24 |
| ESI- | Re | 0.81 | 981.3 | 945.5 | 25 | −200 | −52 |
| ESI- | Ro | 0.90 | 955.5 | 793.3 | 25 | −176 | −62 |
| ESI- | Rf | 1.85 | 835.1 | 799.4 | 25 | −127 | −39 |
| ESI- | Rb1 | 1.95 | 1143.4 | 1107.5 | 25 | −219 | −60 |
| ESI- | Rc | 2.40 | 1113.3 | 1077.4 | 25 | −147 | −60 |
| ESI- | Rg2 | 2.83 | 819.2 | 783.5 | 25 | −169 | −42 |
| ESI- | Rb2 | 3.04 | 1113.3 | 1077.4 | 25 | −147 | −60 |
| ESI- | De-Rd | 3.63 | 979.3 | 943.5 | 25 | −210 | −60 |
| ESI- | Rd | 4.09 | 981.3 | 945.5 | 25 | −200 | −52 |
| ESI- | Rd2 | 5.23 | 951.4 | 915.4 | 25 | −150 | −42 |
| ESI- | Rg6 | 5.69 | 801.5 | 765.5 | 25 | −218 | −40 |
| ESI- | F4 | 5.90 | 801.4 | 765.5 | 25 | −174 | −41 |
| ESI- | Rg3 | 7.01 | 819.2 | 783.5 | 25 | −169 | −42 |
| ESI- | Rk1 | 8.89 | 801.1 | 765.5 | 25 | −175 | −40.6 |
| ESI- | Rg5 | 9.01 | 801.4 | 765.5 | 25 | −174 | −41 |
2.4 Linearity, LOD and LOQ
A series of standard mixture solutions were diluted with methanol to obtain calibration solutions (range 0.122–1000 ng/mL) for LC-MS analysis. The calibration curves were constructed from the peak areas (Y) versus the concentrations of each target compound (X), and the correlation coefficients (R2) were calculated. The LOD and LOQ were measured with the signal-to-noise ratios of 3 and 10, respectively.
2.5 Precision, stability and repeatability
The intra-day precision and inter-day precision were used to determine the precision of the established method. The three concentrations of mixed standard solutions were injected 6 times consecutively (intra-day test) and repeated within the next 3 days (inter-day test). The three concentrations of mixed standard solutions were injected at 0, 3, 6, 9, 12 and 24 h respectively to examine the stability. For the repeatability test, five portions of RSP weighed in parallel were extracted according to the sample preparation and were injected into LC-MS for analysis. The relative standard deviation (RSD) was used to evaluate the precision, stability and repeatability.
2.6 Recovery
Recovery was determined by analyzing spiked samples. The RSP was extracted according to the sample preparation and 5 portions were weighed in parallel and each standard added with the same content as extracts. Then 100 μL of the extraction solution was mixed with 900 μL of methanol and filtered through 0.22 μm microporous membrane for analysis.
2.7 Comparison of quality evaluation strategies
Firstly, the prescriptions of GFPCMs were obtained by searching the Chinese Pharmacopoeia and the Drug Standard of Ministry of Public Health, and the mass ratio of Fuzi and ginseng in each prescription were calculated. Secondly, the absolute content, normalized content, and unit content were obtained by Excel software and were performed to HCA with heat map by R software. Finally, the key indicators for classification were determined by analyzing HCA results, and the quality standards of Fuzi and ginseng in GFPCMs were further determined based on these indicators.
3 Result and discussion
3.1 Optimization of HPLC-MS/MS conditions
In pre-experiment, many ginsenosides were difficult to be ionized and failed to produce a high signal response. Therefore, some additives, i.e. formic acid (Guo et al., 2013, Xia et al., 2018), acetic acid (Li et al., 2015), ammonium chloride (Li et al., 2007), and ammonium acetate (Li et al., 2010, Zhou et al., 2017) were used to improve the signal response of ginsenosides. The results showed that 0.1% formic acid and 0.1% acetic acid had no significant effect, while 10 mM ammonium acetate had a weak enhancement. Fortunately, the signal response of most ginsenosides could be enhanced by an order of magnitude at 0.5 mM of ammonium chloride. The chloride adduct ions, [M + Cl]-, were the most abundant ions in the spectra of ginsenosides in negative ion electrospray ionization mass spectrometry. They could be used as parent ions in quantitative analyses. Moreover, the concentration (i.e. 0.1 and 1.0 mM) of ammonium chloride in methanol - water or acetonitrile - water was further optimized. Compared to the controlled concentration (0.5 mM), there was approximately 0.5-fold lowering of response at 0.1 mM (Fig. S1). With the increase of the concentration of ammonium chloride to 1.0 mM, their signal could not be further increased. It was also found that acetonitrile slightly enhanced their signal responses compared to methanol. Moreover, the other ginsenosides and all aconitines also responded well and showed no significant inhibitory effect in positive ion mode after the addition of 0.5 mM of ammonium chloride to water. Finally, the acetonitrile (B) − 0.5 mM aqueous solution of ammonium chloride (A) was adopted as the mobile phase.
The parameters of the ion source were investigated by the injection of ginsenosides and aconitines standards of 1.0 μg/mL, containing 0.5 mM ammonium chloride, directly into the mass spectrometer at a flow rate of 7 μL/min. The results showed that 10 ginsenosides, including Rg1 (2), F5 (9), F3 (10), Rh1 (12), PPT (17), PT (18), CK (19), Rh2 (20), PPD (21), and PD (22), had better signal response in positive ion mode, while another 16 ginsenosides, including Re (23), Ro (24), Rf (25), Rb1 (26), P-F11 (27), Rc (28), Rg2 (29), Rb2 (30), De-Rd (31), Rd (32), Rd2 (33), Rg6 (34), F4 (35), Rg3 (36), Rk1 (37), Rg5 (38), possessed higher sensitivity in negative ion mode. To improve their signal responses, the ionization voltage (3.5–5.0 kV, Fig. S2) and ion source temperature (350–550 °C, Fig. S3) were optimized in positive and negative ion modes. At 3.5–4.0 kV of ionization voltage, there were only a few compounds (e.g. HA, SGR, HAT, AT, INAT, YUAT, and PD) with the intensity above 1.0 × 10⁶ cps. However, almost all compounds had good signal response at 4.0–4.5 kV. These response trends also occurred in negative ion mode. However, their response signals slightly weakened overall at 4.5–5.0 kV of ionization voltages in both positive and negative ion modes. Meanwhile, with the increase of the ion source temperature from 350 °C to 550 °C, the signals of most compounds were enhanced continuously. Thus, the +4.5 kV and −4.5 kV of ionization voltage and the 550 °C of ion source temperature was adopted for this study.
In addition, there were eight groups of isomers of ginsenosides, including MW 460 (PD, PPD), MW 476 (PT, PPT), MW 766 (Rg5, Rg6, Rk1, F4), MW 770 (F3, F5), MW 784 (Rg2, Rg3), MW 800 (Rf, Rg1), MW 946 (Rd, Re) and MW 1078 (Rb2, Rc). They could achieve baseline separation using the optimized chromatographic condition. The total ion chromatogram at this gradient was shown in Fig. 1. It was also found that the column temperature had little effect on their separations at 30 °C − 45 °C (Fig. S4). Aconitines are easily decomposed by heat (Qiu et al., 2020, Qiu et al., 2021), including the analysis process. The column temperature could potentially significantly affect their analytical accuracy. Therefore, the 35 °C was set as the analytical column temperature to avoid the degradation of aconitines.
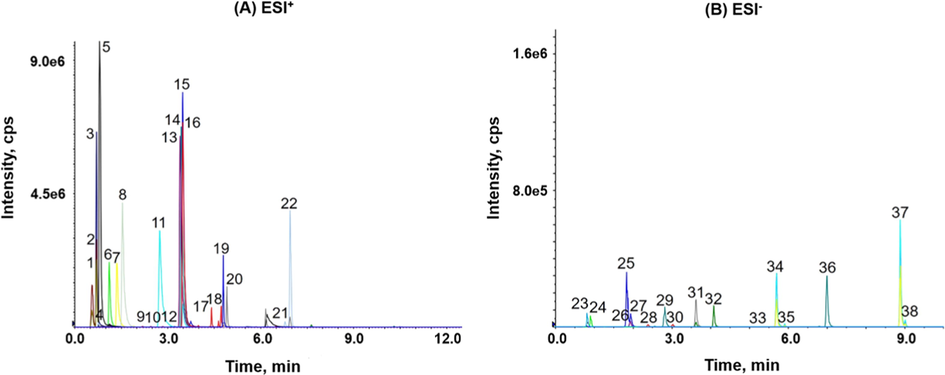
- MRM spectra of standard substances. (A) ESI+: AC (1), Rg1 (2), MA (3), HA (4), SGR (5), BMA (6), BAC (7), BHA (8), F5 (9), F3 (10), MAT (11), Rh1 (12), HAT (13), AT (14), INAT (15), YUAT (16), PPT (17), PT (18), CK (19), Rh2 (20), PPD (21), PD (22); (B) ESI-: Re (23), Ro (24), Rf (25), Rb1 (26), P-F11 (27), Rc (28), Rg2 (29), Rb2 (30), De-Rd (31), Rd (32), Rd2 (33), Rg6 (34), F4 (35), Rg3 (36), Rk1 (37), Rg5 (38).
3.2 Results of method validation
As shown in Table 3, all compounds had good linearity in the range of 0.488–1000 ng/mL. Among the 37 quantified compounds, the LOD of most ginsenosides were below 0.5 ng/mL, and all 12 aconitines could be below 0.03 ng/mL. For all compounds, their RSD values of inter-day and intra-day precision, stability, and repeatability were less than 10 % (Table 4). Their recoveries were in the range of 91.06% − 115.23% with RSD less than 10% (Table 5). The above data indicated that the established method was accurate and reliable for subsequent analysis.
| Compounds | Regression equation | R2 | Linear range (ng/mL) | LOD (ng/mL) | LOQ (ng/mL) |
|---|---|---|---|---|---|
| AT | Y = 1.27e+5X−1.31e+4 | 0.9994 | 0.488–250 | 0.016 | 0.048 |
| MAT | Y = 7.98e+4X−3.27e+4 | 0.9954 | 0.976–1000 | 0.002 | 0.006 |
| HAT | Y = 1.09e+5X−1.28e+4 | 0.9990 | 0.488–500 | 0.032 | 0.095 |
| BAC | Y = 3.86e+4X + 4 | 0.9980 | 0.976–1000 | 0.008 | 0.024 |
| BMA | Y = 2.97e+4X−1.08e+4 | 0.9982 | 0.976–1000 | 0.004 | 0.012 |
| BHA | Y = 7.45e+4X + 3.6e+3 | 0.9859 | 0.488–1000 | 0.002 | 0.006 |
| AC | Y = 1.95e+4X−163 | 0.9968 | 0.488–1000 | 0.016 | 0.048 |
| MA | Y = 2.89e+4X−4.2e+3 | 0.9948 | 0.488–500 | 0.008 | 0.024 |
| HA | Y = 6.19e+4X + 3.14e+4 | 0.9910 | 1.95–500 | 0.008 | 0.024 |
| SGR | Y = 1.37e+5X + 7.67e+4 | 0.9954 | 0.976–250 | 0.008 | 0.024 |
| INAT | Y = 1.46e+5X−1.28e+4 | 0.9990 | 0.488–250 | 0.016 | 0.048 |
| YUAT | Y = 1.07e+5X + 5.14e+3 | 0.9931 | 0.488–500 | 0.008 | 0.024 |
| CK | Y = 1.02e+4X + 1.77e+3 | 0.9962 | 0.488–1000 | 0.041 | 0.163 |
| F3 | Y = 62.8X−1.82e+3 | 0.9990 | 62.5–1000 | 31.250 | 62.500 |
| F4 | Y = 74.1X + 107 | 0.9982 | 1.96–1000 | 0.976 | 1.96 |
| F5 | Y = 59.7X−111 | 0.9954 | 31.3–1000 | 15.625 | 31.250 |
| Rb1 | Y = 472X−383 | 0.9956 | 3.91–1000 | 0.488 | 1.953 |
| Rb2 | Y = 223X−99.4 | 0.9976 | 1.95–1000 | 0.488 | 1.953 |
| Rc | Y = 185X−97 | 0.9946 | 1.95–1000 | 0.488 | 1.953 |
| Rd | Y = 1.33e+3X−1.38e+3 | 0.9960 | 1.95–1000 | 0.488 | 1.953 |
| Rd2 | Y = 51.7X + 128 | 0.9928 | 31.3–1000 | 15.625 | 31.250 |
| De-Rd | Y = 1.98e+3X−1.15e+3 | 0.9964 | 0.976–1000 | 0.244 | 0.977 |
| Re | Y = 316X + 137 | 0.9940 | 1.95–1000 | 0.488 | 1.953 |
| Rf | Y = 3.09e+3X−2.58e+3 | 0.9950 | 1.95–1000 | 0.488 | 1.953 |
| Rg1 | Y = 1.37e+3X−3.75e+3 | 0.9938 | 3.91–1000 | 0.244 | 0.488 |
| Rg2 | Y = 1.69e+3X−3.04e+3 | 0.9980 | 1.95–1000 | 0.488 | 1.953 |
| Rg3 | Y = 3.85e+3X−3.48e+3 | 0.9978 | 1.95–1000 | 0.244 | 0.977 |
| Rg5 | Y = 125X + 488 | 0.9972 | 0.976–1000 | 0.488 | 0.976 |
| Rg6 | Y = 1.49e+3X−16.2e+3 | 0.9982 | 0.976–1000 | 0.244 | 0.977 |
| Rh1 | Y = 163X−808 | 0.9984 | 31.3–1000 | 7.813 | 31.250 |
| Rh2 | Y = 1.09e+4X−4.25e+3 | 0.9978 | 0.976–1000 | 0.041 | 0.163 |
| Rk1 | Y = 6.25e+3X−7.61e+3 | 0.9986 | 1.95–1000 | 0.244 | 0.977 |
| Ro | Y = 622X−1.62e+3 | 0.9948 | 7.81–1000 | 1.953 | 7.813 |
| PD | Y = 4.28e+4X + 2.39e+5 | 0.9906 | 7.81–1000 | 0.041 | 0.163 |
| PPD | Y = 4.53e+3X + 4.5 | 0.9962 | 0.488–1000 | 0.244 | 0.488 |
| PT | Y = 6.22e+3X + 162 | 0.9976 | 0.976–1000 | 0.244 | 0.977 |
| PPT | Y = 4.77e+3X + 1.31e+3 | 0.9982 | 0.976–1000 | 0.244 | 0.977 |
| Compounds | Precision (RSD a, %) | Stability (RSD a, %) | Repeatability (RSD, %) | |
|---|---|---|---|---|
| Inter-day | Intra-day | |||
| AT | 3.33 | 5.97 | 2.39 | 4.10 |
| HAT | 2.41 | 5.69 | 3.22 | 5.37 |
| MAT | 3.18 | 6.50 | 5.62 | 4.27 |
| BAC | 3.64 | 3.90 | 2.46 | 6.39 |
| BMA | 5.55 | 4.75 | 6.38 | 4.42 |
| BHA | 1.88 | 2.77 | 4.54 | 4.40 |
| AC | 5.93 | 3.69 | 3.80 | 3.62 |
| MA | 1.84 | 2.88 | 3.76 | 3.09 |
| HA | 4.20 | 3.23 | 3.64 | - b |
| SGR | 7.10 | 4.49 | 3.71 | 2.41 |
| INAT | 6.41 | 5.86 | 3.40 | 3.86 |
| YUAT | 6.05 | 3.67 | 6.07 | – |
| CK | 3.83 | 4.58 | 5.58 | 4.77 |
| F3 | 2.59 | 6.22 | 6.03 | – |
| F4 | 3.66 | 7.04 | 4.29 | 7.21 |
| F5 | 4.42 | 4.39 | 7.45 | – |
| Rb1 | 3.79 | 9.77 | 3.66 | 5.50 |
| Rb2 | 5.39 | 4.71 | 5.22 | 9.41 |
| Rc | 4.20 | 5.36 | 5.08 | 6.62 |
| Rd | 6.18 | 7.49 | 7.90 | 7.67 |
| Rd2 | 6.06 | 5.72 | 3.94 | 9.63 |
| De-Rd | 6.93 | 6.78 | 6.73 | 8.22 |
| Re | 7.68 | 8.22 | 5.45 | 4.39 |
| Rf | 2.95 | 6.11 | 5.93 | 7.62 |
| Rg1 | 4.88 | 3.57 | 7.47 | 7.96 |
| Rg2 | 4.63 | 3.75 | 8.26 | 5.60 |
| Rg3 | 7.54 | 6.64 | 4.37 | 7.72 |
| Rg5 | 5.61 | 5.98 | 4.86 | 1.55 |
| Rg6 | 1.82 | 6.73 | 3.16 | 8.31 |
| Rh1 | 7.29 | 6.94 | 4.80 | 6.29 |
| Rh2 | 6.62 | 3.36 | 5.52 | 2.08 |
| Rk1 | 6.12 | 5.25 | 3.73 | 5.25 |
| Ro | 5.81 | 5.21 | 5.15 | 6.94 |
| PD | 4.77 | 6.90 | 5.92 | – |
| PPD | 2.53 | 7.04 | 4.75 | 2.91 |
| PT | 5.52 | 5.92 | 3.37 | 3.23 |
| PPT | 6.32 | 3.89 | 5.16 | 1.50 |
a Mean RSD value of three concentrations of each compound.
b “–” indicates that the component is not detected.
| Compounds | Original (μg) | Spiked (μg) | Detected (μg) | Recovery (%) | RSD (%) |
|---|---|---|---|---|---|
| AT | 0.01 | 0.01 | 0.02 | 102.36 | 2.87 |
| MAT | 0.05 | 0.05 | 0.10 | 100.35 | 4.61 |
| HAT | 0.04 | 0.04 | 0.08 | 101.68 | 5.77 |
| BAC | 0.10 | 0.10 | 0.19 | 96.34 | 5.05 |
| BMA | 0.63 | 0.63 | 1.29 | 102.26 | 3.86 |
| BHA | 0.09 | 0.09 | 0.17 | 95.50 | 3.58 |
| AC | 0.02 | 0.02 | 0.04 | 108.37 | 5.06 |
| MA | 0.08 | 0.08 | 0.16 | 102.63 | 5.48 |
| HA | – a | 0.50 | 0.54 | 107.21 | 4.35 |
| SGR | 0.06 | 0.06 | 0.13 | 105.61 | 2.71 |
| INAT | 0.01 | 0.01 | 0.02 | 95.99 | 4.03 |
| YUAT | – | 0.50 | 0.47 | 94.00 | 3.26 |
| CK | 0.02 | 0.02 | 0.04 | 102.68 | 4.15 |
| F3 | – | 0.50 | 0.53 | 105.61 | 3.22 |
| F4 | 48.00 | 48.00 | 92.65 | 96.51 | 4.21 |
| F5 | – | 0.50 | 0.48 | 96.95 | 2.81 |
| Rb1 | 37.17 | 37.17 | 67.69 | 91.06 | 3.10 |
| Rb2 | 2.43 | 2.43 | 4.90 | 100.77 | 3.60 |
| Rc | 6.81 | 6.81 | 15.69 | 115.23 | 4.40 |
| Rd | 10.77 | 10.77 | 22.84 | 106.02 | 4.90 |
| Rd2 | 3.12 | 3.12 | 5.77 | 92.42 | 3.04 |
| De-Rd | 0.11 | 0.11 | 0.24 | 107.52 | 5.46 |
| Re | 50.17 | 50.17 | 100.56 | 100.22 | 4.33 |
| Rf | 0.71 | 0.71 | 1.39 | 98.08 | 4.07 |
| Rg1 | 18.53 | 18.53 | 35.40 | 95.51 | 6.19 |
| Rg2 | 1.36 | 1.36 | 2.66 | 97.94 | 4.25 |
| Rg3 | 3.20 | 3.20 | 6.88 | 107.44 | 3.04 |
| Rg5 | 209.33 | 209.33 | 404.22 | 96.55 | 7.98 |
| Rg6 | 1.16 | 1.16 | 2.25 | 96.88 | 4.97 |
| Rh1 | 0.86 | 0.86 | 1.69 | 98.05 | 7.56 |
| Rh2 | 0.34 | 0.34 | 0.69 | 101.64 | 6.55 |
| Rk1 | 3.34 | 3.34 | 6.62 | 99.12 | 1.97 |
| Ro | 4.96 | 4.96 | 10.77 | 108.59 | 4.03 |
| PD | – | 0.50 | 0.57 | 114.00 | 7.05 |
| PPD | 0.72 | 0.72 | 1.32 | 91.81 | 5.33 |
| PT | 4.78 | 4.78 | 10.03 | 104.93 | 3.14 |
| PPT | 0.98 | 0.98 | 2.19 | 111.61 | 2.27 |
a “–” indicates that the component is not detected.
3.3 Comprehensive determination of 10 GFPCMs
The method was applied to the quantitative analysis of 12 aconitines and 25 ginsenosides in the 10 GFPCMs. In this study, aconitines and ginsenosides were determined for the first time in JBP, NAC, NVC, PFC, WMP and XBP. From the 10 GFPCMs, 4 aconitines (i.e. AC, MA, HA, and INAT) and 16 ginsenosides (i.e. CK, F3, F4, F5, De-Rd, Rd2, Rg2, Rg5, Rg6, Rh1, Rh2, Rk1, Ro, PPD, PT and PPT) were quantified for the first time. As for Fuzi, previous studies have focused on three diester alkaloids (i.e. AT, MAT, and HAT) and three monoester alkaloids (i.e. BAC, BMA, and BHA) (Guo et al., 2013, Zhang et al., 2018, Liu et al., 2021). To comprehensively control the quality of Fuzi in 10 GFPCMs, the three non-ester alkaloids (i.e. AC, MA, and HA) (Liu et al., 2017) and other three active aconitines (i.e. SGR, INAT, and YUAT) were also quantified simultaneously in this study. As for ginseng, previous studies mainly focused on main components, including Rg1, Re, Rb1, Rc, Rd, Rf, and Ro (Xie et al., 2012, Jiang et al., 2017, Commission 2020, Zheng et al., 2020), while no simultaneous quantitative analysis was conducted for 25 ginsenosides containing eight groups of isomers. Meanwhile, these 25 ginsenosides contained multiple rare ginsenosides, which is critical for the quality evaluation of ginseng. This method had a shorter detection time than other studies (Guo et al., 2013, Song et al., 2015, Wang et al., 2016, Yang et al., 2016, Jiang et al., 2017, Xu et al., 2021). All the compounds were detected within 12 min in either positive or negative ion mode. In particular, these eight groups of isomers of ginsenoside were distinguished and quantified simultaneously in 10 GFPCMs for the first time.
All determined contents of 35 compounds in 10 GFPCMs were shown in Table 6. The YUAT and PD could not be detected. Among them, there were significant differences in the contents of aconitines and ginsenosides, especially for the diester alkaloids, monoester alkaloids, and non-ester alkaloids with the content range of 0.10–3.94 μg/g, 0.82–225.90 μg/g, and 0.09–22.55 μg/g, respectively. As for ginsenoside Rg5, its content range was even from 5.77 to 93000 μg/g. These significant variations in contents among these GFPCMs were mainly caused by the different amounts of raw material dosage and processing methods. According to the prescription composition, it was found that the content of key components in GFPCM was not completely consistent with the ranking status of Fuzi and ginseng. For example, the Fuzi and ginseng are not monarch drug or minister drug, i.e. the main traditional Chinese medicine in prescription, in XBP and PFC, but their content of aconitines in XBP and ginsenosides in PFC was higher than those in other GFPCMs.
| Compounds | JBP | NAC | NVC | PFC | QLC | RSP | SFP | SGP | WMP | XBP |
|---|---|---|---|---|---|---|---|---|---|---|
| AT | 0.13 | 0.01 | 0.02 | 0.32 | 0.01 | 0.01 | 0.25 | 0.39 | 0.01 | 0.04 |
| MAT | 0.20 | 0.05 | 0.05 | 0.86 | 0.05 | 0.05 | 0.86 | 2.05 | 0.04 | 0.05 |
| HAT | 1.46 | 0.04 | 0.09 | 2.76 | 0.08 | 0.04 | 1.26 | 1.42 | 0.06 | 3.37 |
| BAC | 2.37 | 0.70 | 1.56 | 3.05 | 2.18 | 0.10 | 1.61 | 0.64 | 0.14 | 26.33 |
| BMA | 7.98 | 5.70 | 5.99 | 32.13 | 20.27 | 0.63 | 19.00 | 10.02 | 0.67 | 123.50 |
| BHA | 0.98 | 1.07 | 3.88 | 2.49 | 2.75 | 0.09 | 0.73 | 0.36 | 0.15 | 76.07 |
| AC | 0.29 | 0.07 | 0.15 | 0.11 | 0.30 | 0.02 | 0.15 | 0.06 | 0.02 | 3.60 |
| MA | 0.26 | 0.26 | 0.30 | 0.40 | 1.05 | 0.08 | 0.62 | 0.25 | 0.08 | 11.17 |
| HA | 0.09 | 0.04 | 0.18 | 0.07 | 0.36 | – a | 0.08 | 0.01 | – | 7.78 |
| SGR | 1.72 | 0.94 | 1.34 | 4.02 | 2.40 | 0.06 | 3.32 | 1.12 | 0.10 | 14.67 |
| INAT | 0.18 | 0.01 | 0.03 | 0.36 | 0.01 | 0.01 | 0.22 | 0.23 | 0.01 | 0.49 |
| YUAT | – | – | – | – | – | – | – | – | – | – |
| CK | 0.28 | 0.12 | 0.15 | 0.27 | 0.50 | 0.02 | 0.03 | 0.07 | 0.02 | 7.07 |
| F3 | 3.24 | 3.04 | 3.12 | 3.37 | 3.95 | – | 3.02 | 3.11 | – | 9.56 |
| F4 | 1.84 | 364.67 | 107.57 | 1932.00 | 82.36 | 48.00 | 1.79 | 4.56 | 35.83 | 11800.00 |
| F5 | – | 0.51 | 0.76 | 0.90 | 2.04 | – | 0.37 | 0.44 | 0.26 | 9.19 |
| Rb1 | 11.73 | 22.50 | 189.90 | 158.00 | 316.80 | 37.17 | 38.80 | 22.20 | 77.77 | 2955.00 |
| Rb2 | 8.63 | 1.05 | 11.79 | 161.20 | 477.60 | 2.43 | 28.77 | 16.87 | 5.09 | 1370.00 |
| Rc | 10.11 | 4.42 | 50.23 | 217.20 | 592.80 | 6.81 | 35.57 | 19.37 | 20.53 | 1595.00 |
| Rd | 4.08 | 10.88 | 56.33 | 64.40 | 171.00 | 10.77 | 12.88 | 9.46 | 20.60 | 1815.00 |
| Rd2 | 2.72 | 2.47 | 17.77 | 36.57 | 98.30 | 3.12 | 8.83 | 3.38 | 7.74 | 620.00 |
| De-Rd | 0.13 | 0.96 | 0.25 | 0.49 | 1.52 | 0.11 | 0.14 | 0.13 | 0.13 | 13.23 |
| Re | 27.27 | 13.08 | 342.00 | 420.00 | 708.00 | 50.17 | 74.40 | 70.67 | 92.33 | 1900.00 |
| Rf | 3.63 | 0.36 | 0.34 | 67.67 | 139.20 | 0.71 | 12.11 | 6.18 | 0.10 | 487.00 |
| Rg1 | 14.37 | 0.95 | 10.88 | 67.60 | 134.40 | 18.53 | 35.10 | 17.63 | 3.62 | 3195.00 |
| Rg2 | 0.57 | 21.40 | 1.79 | 22.23 | 19.50 | 1.36 | 3.20 | 0.34 | 0.71 | 287.00 |
| Rg3 | 0.27 | 55.83 | 6.41 | 46.90 | 48.47 | 3.20 | 0.38 | 0.47 | 1.83 | 2320.00 |
| Rg5 | 6.06 | 1516.67 | 693.00 | 7360.00 | 351.43 | 209.33 | 5.77 | 9.91 | 138.33 | 93000.00 |
| Rg6 | 0.52 | 8.26 | 2.52 | 31.37 | 17.50 | 1.16 | 0.09 | 0.15 | 0.81 | 240.50 |
| Rh1 | – | 4.18 | – | 11.00 | 2.08 | 0.86 | – | – | – | 351.00 |
| Rh2 | 0.10 | 2.39 | 0.36 | 1.92 | 1.29 | 0.34 | 0.05 | 0.09 | 0.17 | 45.63 |
| Rk1 | 0.19 | 19.80 | 6.27 | 68.33 | 83.17 | 3.34 | 0.20 | 0.26 | 1.86 | 1420.00 |
| Ro | 49.30 | 26.33 | 29.47 | 79.60 | 2.93 | 4.96 | 20.83 | 14.77 | 8.12 | 23.40 |
| PD | – | – | – | – | – | – | – | – | – | – |
| PPD | 0.40 | 0.72 | 0.09 | 0.42 | 0.74 | 0.72 | 0.04 | 0.18 | 0.03 | 22.00 |
| PT | – | 0.12 | 0.16 | 0.40 | 0.29 | 4.78 | – | – | 0.08 | 7.57 |
| PPT | 0.06 | 0.43 | – | 1.21 | 0.82 | 0.98 | 0.15 | 0.24 | – | 51.40 |
a “–” indicates that the component is not detected.
3.4 Unified quality control strategies for PCMs
To further compare the differences of contents and to establish a unified quality control strategy, the determined contents of 10 GFPCMs were expressed as the absolute content, normalized content, and unit content for quality evaluations. In particular, the absolute content is the determined content in Table 6. The normalized content is the percentage of the absolute content of each compound in the total contents of the same types of compounds (i.e. aconitines or ginsenosides). Furthermore, they were processed into HCA with heatmap by R software. The high (red) and low (blue) relative contents of the compounds were shown in different colours in Fig. 2. The ginsenosides in XBP, especially Rg5, were significantly higher than those in other GFPCMs (Fig. 2A), resulting in no difference between the other compounds and PCMs. All GFPCMs were divided into the XBP group and the other group. Therefore, the quality evaluation strategy based on the absolute content was not applicable for the unified quality control of PCMs. As shown in Fig. 2B, the normalized mode could clearly distinguish groups and effectively find the quality markers. All 10 GFPCMs were grouped into three clusters mainly relying on the relative contents of BMA and Rg5. In particular, BMA was the major aconitine in all 10 GFPCMs, accounting for more than forty percent. Meanwhile, the Rg5 was the major ginsenoside in NVC, WMP, XBP, RSP, PFC, and NAC, accounting for more than thirty percent, and even more than seventy percent in XBP. Notably, this mode-based normalized content cannot reflect the true quality of the Fuzi and ginseng in GFPCM, but rather reflect their overall profiles. Therefore, it is difficult to accurately identify the extracted raw materials using this mode.
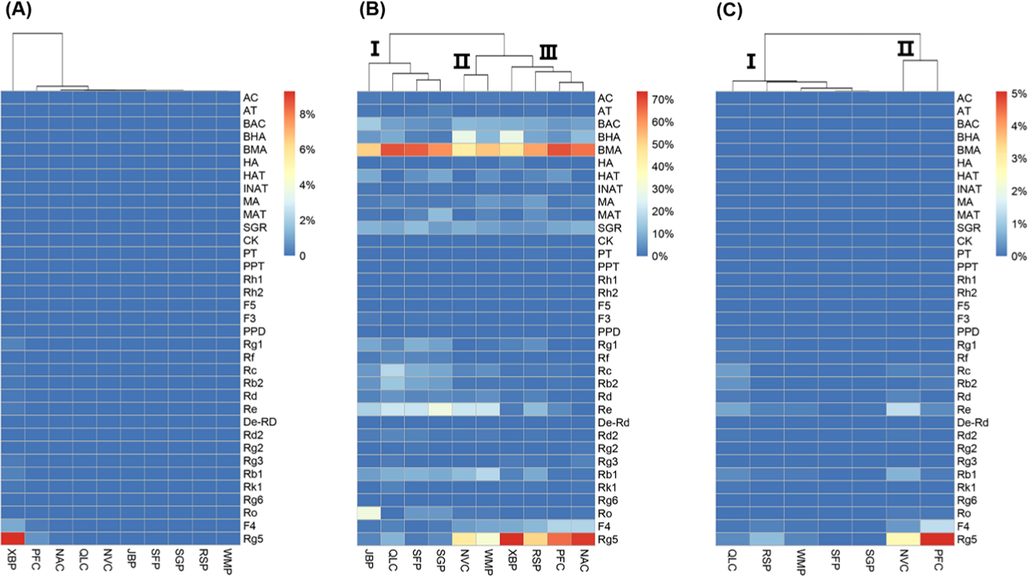
- The heatmap for different quality evaluation methods. (A) Absolute content, (B) Normalized content, (C) Unit content.
In this study, a novel unified quality control strategy-based unit content was proposed and was applied for evaluation of the qualities of Fuzi and ginseng in GFPCM, including their original herbs, prescriptions, and processing methods. Compared with the above two modes, this new strategy could effectively eliminate the influences of the dosage and inferior product. The unit content was calculated by the following formula:
Obviously, ginsenosides were the main distinguishing quality indicators in Shenfu preparations, while aconitines were relatively stable. The total unit content of the three main diester alkaloids and monoester alkaloids were 0.0002%–0.0036% and 0.0017%–0.0515% (Table 7), respectively. It is indicated the content of toxic diester alkaloids in all samples could meet the set limit of Fuzi in Chinese Pharmacopoeia, and more samples, i.e. QLC, SFP, NVC, and PFC, could still meet the set limit of monoester alkaloids. Therefore, the legal content limit of Fuzi, less than 0.020% of diester alkaloids and more than 0.010% of monoester alkaloids, was still suitable for GFPCMs. The unit content of Rg5 could be applied for distinguishing the dosage forms and processing methods of GFPCMs. When its content is greater than 2.0%, it belongs to the type I, otherwise, it belongs to the type II. Moreover, the total unit content of Rb1, Rb2, Rc, Rg5, and Re could indicate the quality of ginseng. This content is preferably greater than 0.2%. In summary, this strategy based on unit content was more accurate and universal than those of the absolute and normalized content, which could effectively eliminate the influences of the dosage and inferior product, effectively regulate the dosage of medicinal materials, and also break through the dilemma of not being able to effectively compare the quality of similar products, which is of great practical significance. With the gradual disclosure of prescriptions, the applicability of this strategy will be gradually expanded for quality evaluation and quality control of the same Chinese medicine in different PCMs.
| Compounds | QLC | RSP | WMP | SFP | SGP | NVC | PFC |
|---|---|---|---|---|---|---|---|
| AT + MAT + HAT | 0.0002 | 0.0008 | 0.0002 | 0.0018 | 0.0019 | 0.0007 | 0.0036 |
| BAC + BMA + BHA | 0.0425 | 0.0064 | 0.0017 | 0.0163 | 0.0053 | 0.0515 | 0.0345 |
| Rb1 | 0.2672 | 0.1447 | 0.1348 | 0.0237 | 0.0215 | 0.7375 | 0.1086 |
| Rb2 | 0.4028 | 0.0095 | 0.0088 | 0.0175 | 0.0163 | 0.0458 | 0.1108 |
| Rc | 0.4999 | 0.0265 | 0.0356 | 0.0217 | 0.0187 | 0.1951 | 0.1493 |
| Rg5 | 0.2964 | 0.8148 | 0.2398 | 0.0035 | 0.0096 | 2.6913 | 5.0600 |
| Re | 0.5971 | 0.1953 | 0.1600 | 0.0454 | 0.0683 | 1.3282 | 0.2888 |
| Rb1 + Rb2 + Rc + Rg5 + Re | 2.0634 | 1.1908 | 0.579 | 0.1118 | 0.1344 | 4.9979 | 5.7175 |
4 Conclusions
In this study, the content of 12 aconitines and 25 ginsenosides containing eight groups of isomers in 10 GFPCMs were comprehensively characterized by HPLC-MS/MS coupled with a unified quality evaluation strategy. The aconitines and ginsenosides were quality controlled in JBP, NAC, NVC, PFC, WMP and XBP for the first time. Furthermore, 4 aconitines and 16 ginsenosides were quantified in all 10 GFPCMs for the first time. Subsequently, the quality control strategy based on absolute, normalized, and unit content was comprehensively compared. The unified quality evaluation-based unit content was more practical and effective for quality control of Fuzi and ginseng in 7 GFPCMs. The total unit content of diester alkaloids in Fuzi of all GFPCMs should be less than 0.020%, while the monoester alkaloids should be above 0.010%. As for ginseng, the total unit content of Rb1, Rb2, Rc, Rg5, and Re should be greater than 2.0%. The unit content of Rg5 was a good indicator for classifying the dosage forms and processing methods. In short, this study proposed and applied a unified quality evaluation strategy for supervision of the quality of each Chinese medicine in complex PCMs.
Author contributions
Chang-Jiang-Sheng Lai and Lu-Qi Huang designed and supported the research; Ze-Yan Chen, Xu-Ya Wei, Ting Tan and Yu-Lin Feng conducted the research; Xu-Ya Wei, Ze-Yan Chen, Juan Guo, Guang-Hong Cui and Chang-Jiang-Sheng Lai analyzed the data and wrote the manuscript; Chang-Jiang-Sheng Lai and Lu-Qi Huang had primary responsibility for the final content.
Acknowledgements
This work was supported by the CACMS Innovation Fund (No. CI2021A05051), the National Natural Science Foundation of China (No. 82074012), and the Fundamental Research Funds for the Central Public Welfare Research Institutes (No. ZZ13-YQ-090-C1).
Declaration of Competing Interest
The authors declare that they have no known competing financial interests or personal relationships that could have appeared to influence the work reported in this paper.
References:
- Development of a comprehensive method combining UHPLC-CAD fingerprint, multi-components quantitative analysis for quality evaluation of Zishen Yutai Pills: A step towards quality control of Chinese patent medicine. J. Pharm. Biomed. Anal.. 2020;191
- [Google Scholar]
- The antioxidant-activity-integrated fingerprint: an advantageous tool for the evaluation of quality of herbal medicines. J. Chromatogr. A.. 2008;1208:76-82.
- [Google Scholar]
- Chemical constituents in different parts of seven species of Aconitum based on UHPLC-Q-TOF/MS. J. Pharm. Biomed. Anal.. 2021;193
- [Google Scholar]
- Different compatibility ratio and clinical application of Shenfutang. Chin. J. Exp. Tradit. Med. Form.. 2019;25:220-225.
- [Google Scholar]
- Efficacy of a Chinese herbal proprietary medicine (Hemp Seed Pill) for functional constipation. Am. J. Gastroenterol.. 2011;106:120-129.
- [Google Scholar]
- Pharmacopoeia of People’s Republic of China (One Edition). Beijing: China Medical Science Press; 2020.
- Study on Chinese patent medicine based on major component analysis and quality control evaluation: A case study of Jizhi Syrup. J. Pharm. Biomed. Anal.. 2021;209
- [Google Scholar]
- Quantitative LC-MS/MS analysis of seven ginsenosides and three aconitum alkaloids in Shen-Fu decoction. Chem. Cent. J.. 2013;7:165.
- [Google Scholar]
- Serum pharmacochemistry analysis using UPLC-Q-TOF/MS after oral administration to rats of Shenfu Decoction. Evid. Based Compl. Alt.. 2015;2015
- [Google Scholar]
- Qualitative and quantitative analysis of multiple components for quality control of Deng-Zhan-Sheng-Mai capsules by ultra high performance liquid chromatography tandem mass spectrometry method coupled with chemometrics. J. Sep. Sci.. 2017;40:612-624.
- [Google Scholar]
- Study on the hydroxyl radical scavenging activity changes of ginseng and ginsenoside-Rb2 by heat processing. Biol. Pharm. Bull.. 2007;30:724-728.
- [Google Scholar]
- An enzymatic protocol for absolute quantification of analogues: application to specific protopanoxadiol-type ginsenosides. Green Chem.. 2015;17:2580-2586.
- [Google Scholar]
- Determination of asperosaponin VI in rat plasma by HPLC-ESI-MS and its application to preliminary pharmacokinetic studies. Biomed. Chromatogr.. 2010;24:550-555.
- [Google Scholar]
- Simultaneous determination of panax notoginsenoside R1, ginsenoside Rg1, Rd, Re and Rb1 in rat plasma by HPLC/ESI/MS: platform for the pharmacokinetic evaluation of total panax notoginsenoside, a typical kind of multiple constituent traditional Chinese medicine. Biomed. Chromatogr.. 2007;21:735-746.
- [Google Scholar]
- Simultaneous determination of seven ginsenosides in rat plasma by high-performance liquid chromatography coupled to time-of-flight mass spectrometry: application to pharmacokinetics of Shenfu injection. Biomed. Chromatogr.. 2015;29:167-175.
- [Google Scholar]
- Efficacy and Safety of Oral Chinese Patent Medicine Combined with Conventional Therapy for Heart Failure: An Overview of Systematic Reviews. Evid. Based Compl. Alt.. 2020;2020:8620186.
- [Google Scholar]
- A review of traditional and current methods used to potentially reduce toxicity of Aconitum roots in Traditional Chinese Medicine. J. Ethnopharmacol.. 2017;207:237-250.
- [Google Scholar]
- Chinese patent medicine for chronic obstructive pulmonary disease based on principles of tonifying Qi, promoting blood circulation by removing blood stasis, and resolving phlegm: a systematic review of randomized controlled trials. J. Tradit. Chin. Med.. 2015;35:1-10.
- [Google Scholar]
- Liu, Y., Liang, D., Sun, H., Wu, Z., Zhang, Y., Li, C., Dong, J., Li, H., Han, C., Xie, H., 2021. Simultaneous determination of six different alkaloids in Shenfuqiangxin pills by HPLCMS /MS. J. Wannan Med. Coll. 40, 18-21.
- Efficacy and safety of Chinese patent medicine injection for COVID-19: A protocol for systematic review and meta-analysis. Medicine.. 2020;99
- [Google Scholar]
- Comprehensive chemical profiling of Yindan Xinnaotong soft capsule and its neuroprotective activity evaluation in vitro. J. Chromatogr. A.. 2019;1601:288-299.
- [Google Scholar]
- Three New Dammarane Glycosides from Heat Processed Ginseng. Arch. Pharm. Res.. 2002;25:428-432.
- [Google Scholar]
- Scanning Electron Microscopy and Liquid Chromatography for Physical and Chemical Inspection of Industrial Pharmaceutical Traditional Chinese Herbal Medicine. ACS Omega.. 2020;5:11563-11569.
- [Google Scholar]
- Real-time toxicity prediction of Aconitum stewing system using extractive electrospray ionization mass spectrometry. Acta Pharm. Sin. B.. 2020;10:903-912.
- [Google Scholar]
- Limitation standard of toxic aconitines in Aconitum proprietary Chinese medicines using on-line extraction electrospray ionization mass spectrometry. Acta Pharm. Sin. B.. 2020;10:1511-1520.
- [Google Scholar]
- Quality tracing evaluation strategies of compatible materials in Aconitum proprietary Chinese medicines. J Pharm Biomed Anal.. 2021;192
- [Google Scholar]
- Quality tracing evaluation strategies of compatible materials in Aconitum proprietary Chinese medicines. J. Pharm. Biomed. Anal.. 2021;192
- [Google Scholar]
- Qiu, Z.D., Zhang, X., Wei, X.Y., Chingin, K., Xu, J.Q., Gao, W., Yang, B., Wang, S.L., Tan, T., Liu, E.H., Xu, H.Y., Cui, G.H., Guo, J., Wang, Y.N., Shen, Y., Zhao, Y.J., Chen, H.W., Lai, C.J.S., Huang, L.Q., 2021. Online discovery of the molecular mechanism for directionally detoxification of Fuzi using real-time extractive electrospray ionization mass spectrometry. J. Ethnopharmacol. 277, 114216.
- Large-scale qualitative and quantitative characterization of components in Shenfu injection by integrating hydrophilic interaction chromatography, reversed phase liquid chromatography, and tandem mass spectrometry. J. Chromatogr. A.. 2015;1407:106-118.
- [Google Scholar]
- Rapid characterization of ginsenosides in the roots and rhizomes of Panax ginseng by UPLC-DAD-QTOF-MS/MS and simultaneous determination of 19 ginsenosides by HPLC-ESI-MS. J. Ginseng Res.. 2016;40:382-394.
- [Google Scholar]
- Research advancement in mechanisms of processing and compatibility for detoxication of Aconitums. Chin. J. Chin. Mater. Med.. 2019;44:3695-3704.
- [Google Scholar]
- Network pharmacology and molecular docking analyses on Lianhua Qingwen capsule indicate Akt1 is a potential target to treat and prevent COVID-19. Cell Prolif.. 2020;53
- [Google Scholar]
- Quality Analysis of American Ginseng Cultivated in Heilongjiang Using UPLC-ESI(-)-MRM-MS with Chemometric Methods. Molecules.. 2018;23:2396.
- [Google Scholar]
- Evaluation of Pharmacokinetics of Aconiti Lateralis Radix of Shenfu Prescription in Rats with Heart Failure. Chin. J. Pharm.. 2021;18:632-636.
- [Google Scholar]
- Steaming-Induced Chemical Transformations and Holistic Quality Assessment of Red Ginseng Derived from Panax ginseng by Means of HPLC-ESI-MS/MSn-Based Multicomponent Quantification Fingerprint. J. Agr. Food. Chem.. 2012;60:8213-8224.
- [Google Scholar]
- Multiple compounds determination and fingerprint analysis of Lidanpaishi tablet and keli by high-performance liquid chromatography. Anal. Chim. Acta.. 2009;633:136-148.
- [Google Scholar]
- Chemical Variations among Shengmaisan-Based TCM Patent Drugs by Ultra-High Performance Liquid Chromatography Coupled with Hybrid Quadrupole Orbitrap Mass Spectrometry. Molecules.. 2021;26:4000.
- [Google Scholar]
- Pharmacokinetic effects of ginsenoside Rg1 on aconitine, benzoylaconine and aconine by UHPLC-MS/MS. Biomed. Chromatogr.. 2020;34
- [Google Scholar]
- Development of a novel method combining HPLC fingerprint and multi-ingredients quantitative analysis for quality evaluation of traditional Chinese medicine preparation. Talanta.. 2011;85:885-890.
- [Google Scholar]
- Identification and differentiation of Panax ginseng, Panax quinquefolium, and Panax notoginseng by monitoring multiple diagnostic chemical markers. Acta Pharm. Sin. B.. 2016;6:568-575.
- [Google Scholar]
- Discoursing on Soxhlet extraction of ginseng using association analysis and scanning electron microscopy. J. Pharm. Biomed. Anal.. 2018;8:312-317.
- [Google Scholar]
- Research on Q-markers of Qiliqiangxin capsule for chronic heart failure treatment based on pharmacokinetics and pharmacodynamics association. Phytomedicine.. 2018;44:220-230.
- [Google Scholar]
- Overall quality control of the chemical and bioactive consistency of ShengMai Formula. J. Pharm. Biomed. Anal.. 2020;189
- [Google Scholar]
- Simultaneous quantification of twenty-one ginsenosides and their three aglycones in rat plasma by a developed UFLC-MS/MS assay: Application to a pharmacokinetic study of red ginseng. J. Pharm. Biomed. Anal.. 2017;137:1-12.
- [Google Scholar]
Appendix A
Supplementary material
Supplementary data to this article can be found online at https://doi.org/10.1016/j.arabjc.2022.103827.
Appendix A
Supplementary material
The following are the Supplementary data to this article:


