

Translate this page into:
Double-spotted pufferfish (Takifugu bimaculatus) skin collagen: Preparation, structure, cytocompatibility, rheological, and functional properties
⁎Corresponding author at: Technical Innovation Center for Utilization of Marine Biological Resources, Third Institute of Oceanography, Ministry of Natural Resources, Xiamen 361005, China. Tel./fax: +86 0592 215527. jdchen@tio.org.cn (Junde Chen),
-
Received: ,
Accepted: ,
This article was originally published by Elsevier and was migrated to Scientific Scholar after the change of Publisher.
Abstract
Collagen has been ubiquitously applied in the food, cosmetic, biomedical, and pharmaceutical industries. However, the existing collagen in the market cannot meet the demand of consumers. In this study, double-spotted pufferfish collagen (DPC) was extracted from the skin of the pufferfish and characterized as type I collagen, which maintains a native triple helical structure. Liquid chromatography-tandem mass spectrometry analysis revealed that α1 and α2 subunits of DPC comprised 378 and 372 uninterrupted Gly-X-Y triplets, respectively, which were 78.3 % and 78.4 % of the total amino acid content. Secondary structure analysis revealed that DPC consisted of 50.23 % α-helices, 26.51 % β-sheets, 23.26 % β-turns, and 0 % random coils. Using XRD, the distance between collagen molecular chains was found to be 11.45 Å. The yield of DPC was 49.83 % ± 1.85 % (dry weight basis), which was higher than that of pigskin collagen. Dynamic sweep and steady-state shear of DPC were significantly affected by temperature and concentration. DPC solutions exhibited shear-thinning rheological behavior. DPC exhibited water holding and oil absorption capacities superior to terrestrial collagen, such as that of chicken feet collagen. The foaming properties and emulsifying properties of DPC were superior to commercial collagen, such as that of black ruff collagen. DPC was nontoxic to MC3T3-E1 cells and had good cytocompatibility. These results suggest that DPC is a new alternative for collagen with potential for further applications in food, cosmetic, and biomedical fields.
Keywords
Pufferfish skin collagen
Structure
Rheology properties
Functional properties
Cytocompatibility

1 Introduction
Collagen is the predominant protein of animal bodies, constituting approximately 30 % of total protein (Chen et al., 2018). Collagen possesses many excellent characteristics, such as a high water absorption capacity, superior biocompatibility, and low immunogenicity. Annual sales of collagen and its derivatives in the global market have reached billions of dollars. The forecast for the global collagen market is positive in the future. The marine collagen market is expected to reach USD 983.84 million by 2025, with a compound annual growth rate of 7.4 % (Coppola et al., 2021). Terrestrial animals (such as cattle, swine, and poultry) are currently the primary sources of collagen extraction; however, sociocultural and religious restrictions have limited the application of collagen from these sources. This has led to a declining supply of terrestrial collagen in recent years. As a consequence, alternative sources of collagen, especially from aquatic animals, have received increasing attention due to fewer or no religious and ethical issues and the possibility for large-scale extraction. Currently, collagen from fish skin has been isolated and characterized from fish such as bigeye tuna (Raju et al., 2019), blacktip shark (Kittiphattanabawon et al., 2010). These fish are caught in such small quantities that they cannot be exploited on a large scale. Currently, a large amount of fish skin resources, including tilapia and grass carp, have become the major collagen of aquatic origin on the market. However, with the improvement of living standards, the amount of collagen currently produced cannot meet the demand of consumers. Therefore, there is an urgent need to develop new alternative fish skin collagen.
Takifugu bimaculatus is a type of pufferfish belonging to Tetraodontiformes. Tetraodontidae is a carnivorous, demersal fish that prefers to live near coral reefs, with a distribution range from the southern Yellow Sea to the South China Sea. Pufferfish represent a traditional delicacy in some Asian countries. In Japan, pufferfish is regarded as the most popularly eaten fish and is an important part of the Japanese diet. Japanese eat pufferfish as sashimi, miso soup, and as a garnish of sliced raw fish (Giusti, et al., 2018). More than 10,000 tons of pufferfish are consumed each year in Japan (Ahn, et al., 2019). In Korea, pufferfish are mainly processed into raw fish slices and directly provided to consumers. The pufferfish market of Korea exceeds 500 billion won, with an average annual growth rate of more than 5 % (Ahn, et al., 2019). In China, pufferfish aquaculture is now a thriving industry. Approximately 100,000 tons of pufferfish are bred in China, which accounts for nearly 70 % of the total pufferfish production in the world, with about 70–80 % exported to Japan, Korea, and the United States of America as whole fish stored at a low temperature or processed into salted dried products (Tao et al., 2012). Furthermore, a ban on pufferfish consumption in 1990 was lifted in China in 2015, which indicated that pufferfish is becoming a Chinese culinary delicacy, and has tremendous market prospects in China (Bi, et al., 2019). Pufferfish skins and small spines have a rough mouthfeel and are discarded (Wang et al., 2019). However, these discarded skins are reported to be rich in collagen, accounting for approximately 30 % of their dry weight. Therefore, these skins are an excellent raw material that can be developed and utilized on a large scale for the production of collagen. Many successful extractions of collagen from pufferfish skin have been reported. Nagai et al. (2002) researched acid and pepsin-solubilized collagens from ocellate pufferfish skin, including the amino acid and subunit composition and denaturation temperature. Huang et al. (2011) compared acid and pepsin-solubilized collagens from the skin of balloon fish, including the amino acid composition, ultraviolet (UV) absorption spectrum, solubility, and thermal stability. Iswariya et al. (2018) studied the UV absorption and Fourier transform infrared (FTIR) spectra, solubility, thermal stability, and cytocompatibility. Wang et al. (2019) compared the characteristics of collagen from river pufferfish and tiger pufferfish by mainly exploring the effect of NaCl concentration on fibril formation ability. However, there are no systematic studies on the rheology and functional characteristics of pufferfish skin collagen.
Rheological and functional properties are the most important properties for the industrial application of collagen. Collagen products and their processing involve liquid aqueous preparations, which are required to have good rheological properties in practical applications. The rheological properties of a collagen solution depend on the collagen concentration and temperature and are determined by using both steady shear and dynamic oscillatory measurements. For example, shear-thinning, viscosity, and viscoelastic properties, which are essential for product processing and design, can be determined by dynamic oscillatory measurements. Consumers prefer cosmetic products that are easy to apply, which is related to shear thinning in rheology. Viscosity, usually considered an important physical characteristic of fluid or semifluid foods, is related to the quality of the product. Sensory qualities and consumer preferences can also be affected by viscoelastic properties. Functional properties (including water and oil affinity, emulsifying capacity, and foaming capacity) of collagen are also important factors that determine the industrial use of collagen, and these functional properties are closely related to its structure (Shevkani et al., 2015). Through the determination of functional characteristics and rheological properties, advantages and disadvantages of collagen in product processing can be understood, so that the potential value of collagen can be better evaluated both from the perspective of scientific research and for practical production and applications.
Therefore, the objective of this study was to isolate collagen from the skin of double-spotted pufferfish and characterize its structural, rheological, biological, and functional properties to evaluate its potential as a new alternative source for the collagen market.
2 Materials and methods
2.1 Material
The skins of double-spotted pufferfish (T. bimaculatus) were purchased from Fujian Feng Sheng Food Co., ltd. (Zhangzhou, Fujian, China). Type I collagen standard from rat tail skin and protein markers (26634) were purchased from Sigma Chemical Co. (St. Louis, MO, USA), and N,N,N’,N’-teramethylethylenediamine (TEMED) was purchased from Bio-Rad Laboratories (Hercules, CA, USA). Acetic acid, sodium chloride, and sodium dodecyl sulfate were purchased from Shantou Xilong Science Co., ltd. (Shantou, Guangdong, China). A tetrodotoxin (TTX) ELISA test kit was purchased from REAGEN, U.S.A. All chemical reagents used in this study were analytical grade.
2.2 Extraction of double-spotted pufferfish collagen (DPC)
DPC was extracted by the method described by Li et al. (2022) with a slight modification. All procedures were conducted at 4 °C. Defatted skins (50 g) were dissolved in 0.5 M acetic acid at a solid/solvent ratio of 1:30 (w/v) and stirred continuously for 12 h (EUROSTAR 20 digital stirrer, IKA, Germany). Then the homogenized solution was centrifuged (Avanti J-26 XP, Beckman, USA) at 9000 rpm for 30 min at 4 °C. The supernatants were salted out by adding NaCl powder to a final concentration of 5 % (w/v). After 2 h, the resulting precipitates were collected by centrifuging at 9000 rpm for 30 min at 4 °C and then redissolved in 0.5 M acetic acid at a solid/solvent ratio of 1:10 (w/v) for 12 h. After becoming fully dissolved, the solutions were placed into a dialysis bag with a molecular weight cut-off of 100 kDa (MD77, Viskase, USA), dialyzed against 40 volumes of 0.1 M acetic acid for 24 h, and then dialyzed against volumes of distilled water for 48 h. The dialysis water was replaced every 8 h. The resulting dialysate was freeze-dried (Telstar, LyoBeta 25, Spain) and stored at − 40 °C. Additionally, to detect the moisture content of the double-spotted pufferfish skin, defatted pufferfish skin (5 g) was placed in a flat weighing bottle and then dried in a drying oven (DHG-9023A, Shanghai, China) at 105 °C for 4 h. Then, the pufferfish skin was placed in a desiccator to cool for 0.5 h, and then weighed. DPC extraction experiments were performed in triplicate and the results were expressed as the mean ± standard deviation (SD).
Pufferfish skin moisture was calculated using the following equation:
where X is moisture content, m1 is the mass of the weighing bottle and the pufferfish skin (g), m2 is the mass of the weighing bottle and the dried pufferfish skin (g), and m3 is the mass of the weighing bottle (g).
Collagen yield was calculated using the following equation:
where M is the dry weight of collagen (g), M0 is wet weight of raw material (g), and X is the moisture content (g).
2.3 Detection of tetrodotoxin
2.3.1 Extraction of tetrodotoxin
Tetrodotoxin extraction was performed using an enzyme-linked immunosorbent assay (ELISA) kit (RNA9701, REAGEN, USA) according to the manufacturer’s instructions. Double-spotted pufferfish skins were homogenized and then boiled in 0.1 M acetic acid at a solid/solvent ratio of 1:5 (w/v) for 30 min. The boiled supernatant samples were centrifuged at 4500 rpm for 10 min, and the precipitate was treated as described above. Then the samples were placed into a separating funnel with an equal volume of ether for multiple degreasings. The pH of each sample was adjusted to 6.5–7.4 with 1 M NaOH. PBST was added to a final volume of 50 mL, and the extracted samples were stored at 4 °C.
2.3.2 ELISA for tetrodotoxin determination
Tetrodotoxin was determined according to the indirect ELISA kit directions provided by the manufacturer. The decreased signal, as indicated by the ratio of absorbance (Bi/B0, where Bi is the absorbance of the sample, and B0 is the absorbance of the blank with no tetrodotoxin added), had a linear relationship with the logarithmic concentration of tetrodotoxin in the samples, within a certain concentration range. The tetrodotoxin concentration of the sample was calculated according to Eq. (3):
TTX concentration (µg/kg) = C × K, (3).
where C is the tetrodotoxin concentration (ng/mL) in the diluted sample extract, and K is the sample dilution multiple (in this extraction method, K was 10).
2.4 Structural analysis
2.4.1 Protein type analysis
Sodium dodecyl sulfate–polyacrylamide gel electrophoresis (SDS-PAGE) was used to identify DPC. SDS-PAGE was performed by the method described in Chen et al. (2019) with a slight modification. Electrophoretic patterns of collagens were determined using an 8 % running gel and 3 % stacking gel and electrophoresed in a mini-protein vertical slab electrophoresis system (PowerPacTM Basic, Bio-Rad Laboratories, Hercules, CA, USA). The gel was stained with a mixture of 0.125 % Coomassie Brilliant Blue R-250 in 50 % (v/v) ethanol and 10 % (v/v) acetic acid. Finally, the gel was destained with methanol/acetic acid/distilled water (5:1:4, v/v/v). Molecular weights were calculated using Quantity-One 4.6.0 software (Bio-Rad Laboratories, USA) and band intensities were quantified by ImageJ analysis software version 1.8.0.
2.4.2 Primary structure analysis
DPC primary structure was determined by using a combination of SDS-PAGE, liquid chromatography–mass spectrometry (LC-MS)/MS methods, and a UniProt database search. Protein identification was performed as described in Chen et al., 2016 with modifications. The gels obtained by SDS-PAGE were cut to obtain the collagen subunits. The gels were washed and then pounded to particles using microtube pestles. The gel pieces were reduced using a reducing solution (10 mM dithiothreitol and 100 mM NH4HCO3) at 56 °C for 45 h and then alkylated with a solution containing 50 mM iodoacetamide and 100 mM NH4HCO3. The gel pieces were dried and reconstituted with a hydrolysate solution (10 ng/µL trypsin in a 50 mM NH4HCO3 solution with 10 % acetonitrile) at room temperature in the dark for 45 min. LC-MS/MS (QEactive Easy-nLC1200, Thermo Fisher Scientific, USA) analysis using an Eksigent nanoLC-Ultra ™ 2D LC system for gradient elution was performed to determine the collagen protein sequences. The UniProt database was used to analyze all MS/MS data (PLGS v2.3, Matrix Science, London, UK).
2.4.3 Secondary structure analysis
2.4.3.1 FTIR
DPC secondary structure was identified by using a Bruker FTIR spectrophotometer (VERTEX 70, Bruker, Germany). The experimental method was carried out using the method described in Priya et al., 2020 with a slight modification. FTIR spectra were tested within the wavelength range of 4000–400 cm−1 at a resolution of 4 cm−1. FTIR spectra were measured from discs containing 2 mg of lyophilized sample mixed with 100 mg of spectrally pure potassium bromide (KBr).
2.4.3.2 Spectral curve-fitting
Spectral curve-fitting was performed by the method described in Li et al. (2022) with a slight modification. The second derivative spectra were analyzed using OMNIC software (version 8.2, Thermo Nicolet, USA). Gaussian curve-fitting analysis of the spectra was conducted using PeakFit software (version 4.12, SeaSolve Software Inc., USA) and fitted toward a minimum standard error (R2 greater than 0.999). The relative percentage of each secondary structure of collagen (α-helices, β-sheets, β-turns, and random coils) was calculated from the attributes of the peak positions of each sub-absorption peak in the amide I region.
2.4.4 Tertiary structure analysis
DPC tertiary structure was identified by X-ray diffraction (XRD). XRD was performed according to the method described in Chen et al. (2016) with a slight modification. Collagen was scanned by an X-ray diffraction instrument (DX-1000, Dan-dong Fangyuan Instrument Co., ltd.). Wavelengths were obtained within a 2θ range of 5°–90° at an angular speed of 2°min−1, and the distance between molecular chains (d) was determined using Eq. (4):
where λ is the X-ray wavelength (11.5406 Å) and θ is the Bragg diffraction angle.
2.5 Physicochemical properties
2.5.1 Determination of denaturation temperature (Td)
The determination of the Td of the DPC was performed by the method of Li et al., 2022 with a slight modification. Collagen was dispersed in 0.5 M acetic acid at a concentration of 20 mg/mL. The viscosity was measured at different temperatures (10–50 °C) by using a rheometer (MCR 302, Anton Paar, Austria), using a CP25-2 measuring cone (2° cone angle, 25 mm cone diameter). Td was defined as the temperature at which the fractional viscosity was 0.5.
2.5.2 Zeta potential
Zeta potential was determined by the method described in Yousefi et al. (2017) with a slight modification. Collagen samples were dissolved in 0.1 M acetic acid to a final concentration of 0.2 mg/mL of DPC solution. The pH of the solution was adjusted to 2, 3, 4, 5, 6, 7, 8, 9, or 10 with 1 M HNO3 or 1 M KOH. The samples were measured using a Zeta autotitrator (Zetasizer Nano ZS90, Malvern Instruments, UK).
2.6 Rheological properties
Rheological experiments were performed using a rheometer (MCR 302, Anton Paar, Austria) equipped with a stainless-steel cone-plate with the geometry CP60-0.5 (0.5° cone angle and 60 mm cone diameter) and a gap of 57 μm. Before measurements, the samples were stabilized at 10 °C for 10 min.
2.6.1 Dynamic sweep tests
Dynamic frequency sweep tests and dynamic temperature sweep measurements were performed by the method described in Zheng et al. (2021) with a slight modification. Dynamic frequency sweeps for DPC sample solutions with different concentrations (5, 10, 15, 20, and 25 mg/mL) were performed from 0.01 to 10 Hz at 20 °C at a constant strain of 30 %. To evaluate the thermal stability of the DPC sample solutions under a shear, dynamic temperature sweeps were measured. DPC solutions (10 mg/mL) at different temperatures (20 °C, 25 °C, 30 °C, 35 °C, and 40 °C) were tested from 0.01 to 10 Hz at a constant strain of 30 %.
2.6.2 Steady shear tests
Steady shear tests were performed by the method described in Zhu et al. (2017) with a slight modification. Steady-state viscosity curves were determined for the DPC solution at different concentrations (5, 10, 15, and 20 mg/mL) at 20 °C, and for the DPC solution (10 mg/mL) at different temperatures (20 °C, 25 °C, 30 °C, 35 °C, and 40 °C).
2.7 Functional properties
2.7.1 Water holding capacity (WHC) and oil absorption capacity (OAC)
WHC and OAC were determined by the method described in Li et al. (2022) with modifications. DPC (200 mg) was added to distilled water (20 mL) or peanut oil (10 mL) and mixed using a vortex mixer (MX-E, SCILOGEX, USA) for 2 min at room temperature. The mixture was held at room temperature for 1 h, then centrifuged at 6000 rpm for 10 min, and the supernatant was carefully removed. The tube was weighed before and after centrifugation and supernatant removal. WAC and OHC were calculated according to Eq. (5):
where W0 is the DPC dry weight (g), W1 is the weight of the tube and dry sample (g), and W2 is the total weight of the precipitate and tube after centrifugation (g).
2.7.2 Foaming capacity (FC) and foaming stability (FS)
FC and FS of DPC solutions were determined by the method described in Ogunwolu et al. (2009) with some modifications. A DPC solution (5 mg/mL) was homogenized (JS25, JUNRUI, Yangzhou, China) at 10,000 rpm for 2 min at room temperature. The sample was then rapidly transferred into a 50-mL graduated cylinder and the volume of foam at different pH values (2, 4, 6, 6.8, 8, or 10) was recorded. After 1 h, the foam stability was determined by measuring the decrease in the volume of foam at each pH. FC and FS were calculated according to Eq. (6) and Eq. (7), respectively:
where V0 represents the volume after whipping at 0 min, and V30 represents the total volume remaining after 30 min.
2.7.3 Emulsifying activity index (EAI) and emulsifying stability index (ESI)
The EAI and ESI of the DPC sample were determined by the method described in Çelik et al., (2019) with modifications. EAI and ESI were tested by using a UV–visible spectrophotometer (UV-2550, Shimadzu, Suzhou, China). The sample solution (5 mg/mL) and corn oil at a 1:3 ratio (v/v) were homogenized at 16000 rpm for 60 s in a homogenizer. The emulsion from the bottom of the sample was removed (50 μL), mixed with 5 mL of SDS (0.1 %, v/v), and the absorbance at 500 nm was measured. The 500 nm absorbances measured at 0 min (A0) and 10 min (A10) were used to calculate EAI and ESI according to Eq. (8) and Eq. (9), respectively:
where, N is the dilution coefficient (1 0 0), c is the DPC concentration (0.005 g/mL), A0 is the absorbance determined at 0 min, A10 is the emulsion absorbance measured after 10 min, and φ is the volume fraction of the oil in the emulsion (6.6/26.6 = 0.248).
2.8 Cytocompatibility
2.8.1 Cell viability and proliferation
Cell viability and proliferation were assessed using a CCK-8 assay according to Ge et al. (2020) with modifications. MC3T3-E1 cells were cultured in a 96-well plate at a density of 1x10⁴ cells/well at 37 °C with 5 % CO2 for 1, 3, or 5 d. The optical density (OD) was measured using a multifunctional microplate reader (SpectralMax M5, Molecular Devices, USA) at 490 nm, and cell viability was calculated using an equation for the relative growth rate (RGR):
where A0, At, and A are the absorbances at 490 nm of the control cell group, the experimental group, and the group without cells, respectively.
2.8.2 Cell morphology
The morphology of MC3T3-E1 was assessed using an inverted microscope (ECLIPSE Ts2, Nikon, Japan) after 1, 3, and 5 d.
2.9 Statistical analyses
Quantitative results were expressed as mean ± standard deviation (SD). Statistical analyses were conducted using SPSS software (version 17.0, IBM SPSS Statistics, Ehningen, Germany). Statistical significance was defined as p < 0.05.
3 Results and discussion
3.1 Yield
After three extraction experiments, 9.16 g, 9.43 g, and 9.11 g of lyophilized DPC samples were obtained, with DPC yields of 49.17 %, 52.35 %, and 47.96 %, respectively (Supplementary Material 1 and 2). The average yield of DPC was 49.83 % ± 1.85 % (dry weight basis, dwb), which was higher than that found in other pufferfish, such as ocellate pufferfish (10.7 %, dwb, Nagai et al., 2002) and Diodon holocanthus (4 %, dwb, Huang et al., 2011). Compared with other fish skin, the yield was higher than sharpnose stingray skin (11.49 ± 0.03 %, dwb, Shaik et al., 2021) and bigeye tuna (13.5 %, dwb, Raju et al., 2019). Additionally, in comparison to mammals, DPC had a higher yield than pigskin collagen (38.9 %, dwb, Jia et al., 2012), indicating that double-spotted pufferfish skin has the potential to develop collagen products.
3.2 Tetrodotoxin toxicity detection
As shown in Supplementary Material 1, the standard curve for tetrodotoxin detection was applied to the indirect competitive ELISA data. From the typical calibration curve illustrated by plotting (B/B0) against the tetrodotoxin concentration, the resulting equation was y = − 0.3802x + 1.0013, with a correlation coefficient (R2) of 0.9895. The linear portion of the standard curve is shown in Supplementary Material 1. The standard recovery rate was 70–120 %, and the coefficients of variation (CVs) for the standard curve were < 10 %. The tetrodotoxin content of both the double-spotted pufferfish skin and DPC were below the lowest detectable concentration of 10.0 ng/mL, and as a result, there was no tetrodotoxin detected. Therefore, the double-spotted pufferfish skin and the DPC samples were nontoxic, which shows the feasibility for DPC use in terms of food safety, and that it can be further developed and utilized in the future.
3.3 Structural analysis
3.3.1 Protein type analysis
As shown in Fig. 1, SDS-PAGE protein patterns of DPC exhibited a similar pattern compared with rat tail type I collagen and mainly consisted of at least two α-chains (α1 and α2), β-chains (dimer) and γ-chains (trimer). Furthermore, this was consistent with silver carp collagen, Ujumuqin sheep bone collagen, and quail feet collagen reported by other researchers (Faralizadeh et al., 2021; Gao et al. 2018; Yousefi et al., 2017). Therefore, DPC is type I collagen. The molecular weights of the different chains were calculated using Quantity-One software. The SDS-PAGE pattern showed two different α-chains, α1 and α2, for DPC at 127 kDa and 117 kDa, respectively. Two α-chains, α1 and α2, of type I collagen from rat tail were 129 kDa and 118 kDa, respectively. The molecular weight of DPC was lower than that of rat rail type I collagen standard. The discrepancy may be due to the different resources of collagen, specifically, resources from mammalian animals versus aquatic animals. Furthermore, the molecular weight of DPC was similar to other collagen sources, such as Ujumuqin sheep ovine bones (α1: MW 126.87 kDa; α2: MW 110.18 kDa) (Gao et al., 2018), quail feet (α1: MW 120 kDa; α2: MW 116 kDa) (Yousefi et al., 2017), and scales of lizard fish (α1: MW < 120 kDa; α2: MW < 110 kDa) (Thuy et al., 2014). Most marine collagen such as walleye pollock collagen (Yan et al., 2007), quail feet collagen (Yousefi et al., 2017), and bigeye tuna collagen (Raju et al., 2019) have α1 and α2 subunits. The molecular weight ratio, α1-chains/α2-chain, was approximately 2:1. However, it was reported that in some collagen, α3(I) migrated electrophoretically to the same position as α1(I), and the molecular weight ratio, α1-chains/α2-chain/α3-chain, was approximately 1:1:1 (Yousefi et al., 2017). Experimental results from LC-MS/MS and a UniProt database search showed that DPC consisted of α1 and α2 subunits but no α3 subunit. The molecular weight ratio of DPC α1-chain/α2-chain determined by ImageJ software (VERSION 1.8.0, National Institute of Mental Health, Bethesda, MD, USA). was approximately 2:1, the same as rat tail collagen, suggesting that DPC is a type I collagen and consists of [(α1)2α2]. Additionally, the purity of DPC was estimated by SDS-PAGE using ImageJ (Vision 8.0, NIH, US) (Chen et al., 2019). The quantification of stained protein bands showed that α1, α2, β, and γ subunits contributed to 95.86 % ± 0.66 % of the total DPC, which exhibited a similar purity compared with the rat tail type I collagen standard (94.86 % ± 0.51 %).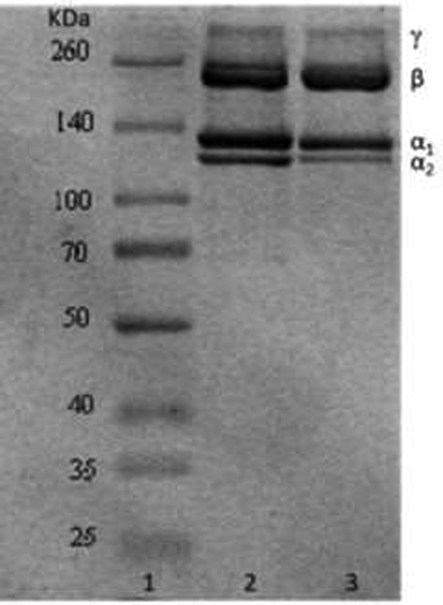
SDS-PAGE pattern. Lanes 1: Marker26634; lane 2: Type Ⅰ rat tail collagen standard; lanes 3: DPC.
3.3.2 Primary structure analysis
The primary structure of DPC was analyzed by using a combination of SDS-PAGE, LC-MS/MS methods, and UniProt database BLAST searches. The protein sequence coverage of collagen chains and the number of matching peptides between collagen chains and the UniProt database were the main parameters used to identify collagen. As shown in Table 1, the α1 subunit score matching type I collagen subunit α1 was 1642. There were 36 peptides in the UniProt database that matched the α1 subunit of type I collagen with 37 % sequence coverage. The subunit α2 score matching the α2 (I) chain was 1626 and contained 27 matching peptides with 29 % sequence coverage. They were composed of 1448 and 1423 amino acids with a calculated molecular mass of 137,229 Da and 135,030 Da, respectively (Supplementary Materials 1 and 2). Thus, peptide sequences detected by LC-MS/MS matched the double-spotted pufferfish type I collagen.
Protein
Accession no.a
Mass (Da)/PI
Covera (%)b
Score
MPc
Chain α1
tr|A0A4Z2CGA3
137229/5.51
37 %
1642
36
Chain α2
tr|A0A4Z2BMR6
135030/9.24
29 %
1656
27
DPC is collagen with a triple helix structure formed by three α subunits intertwined with each other. The conserved sequence Gly-X-Y triplets of collagen α subunits is an important factor to ensure collagen stability. In Gly-X-Y triplets, Gly is glycine, and X and Y can be any amino acid residue except tryptophan. X and Y are usually proline (Pro) and hydroxyproline (Hyp), respectively (Sun et al. 2022).
The amino acid sequence of the DPC α1 subunit included 378 Gly-X-Y triplets (1134 residues), accounting for 78.3 % of the total amino acids in the α1 subunit chains. The conserved sequence Gly-X-Y triplets in the α1 subunit chains were mainly in the center domains (G163-G1179) (Supplementary Material 3). They comprised 339 Gly-X-Y triplets (1017 residues), accounting for 90.4 % of the total content of all the conserved sequences in the α1 (I) chains. Additionally, the N-terminal domain of the α1 subunit chains included 22 Gly-X-Y triplets distributed over nine regions, namely G22-G24, G31-C33, G37-L39, G59-V61, G82-C84, G93-V98, G105-F143, G148-V150, and G156-G158. The C-terminal domain of α1 subunit chains contained 17 Gly-X-Y triplets distributed over 15 regions, namely G1197-G1199, G1234-Q1236, G1256-Y1258, G1265-T1267, G1280-T1282, G1316-F1318, G1323-D1328, G1366-L1368, G1376-N1378, G1386-S1388, G1398-T1400, G1404-T1409, G1432-P1434, G1439-E1441, and G1443-G1445.
The amino acid sequence of the DPC α2 subunit had 372 Gly-X-Y triplets (1116 residues), accounting for approximately 78.4 % of the total amino acids in the α2 subunit chains. As shown in Supplementary Material 4, the conserved sequence Gly-X-Y triplets in the α2 subunit were mainly found in the center domains (G155-G1168). They comprised 338 Gly-X-Y triplets (1014 residues), which accounted for 90.1 % of the total content of all the conserved sequences in the α2 subunit chains. The N-terminal domain of the α2 subunit chains contained 20 Gly-X-Y triplets distributed over eight regions, namely G14-P16, G22-H24, G50-V52, G54-S56, G74-A76, G99-F137, G143-K145, and G150-G152. The C-terminal domains of the α2 subunit chains contained 14 Gly-X-Y triplets distributed over 13 regions, namely G1173-D1175, G1210-R1212, G1232-Y1234, G1241-M1243, G1285-T1287, G1290-T1292, G1337-M1342, G1350-N1352, G1360-S1362, G1372-T1374, G1406-A1408, G1413-D1415, and G1417-D1419.
These results indicated the structural stability of DPC, and that DPC showed promise as a raw material for biofunctional materials.
3.3.3 Secondary structure analysis
3.3.3.1 FTIR
As shown in Fig. 2(a), DPC has characteristic collagen peaks including five amide bands: amide A, B, I, II, and III. These results are consistent with those of collagen extracted from other fish species (Wang et al., 2019; Gao et al., 2018). The amide A band measured at 3295.24 cm−1 was associated with N—H stretching vibrations and was lower than the normal range of 3400–3440 cm−1. As Chen et al., (2019) reported, when the N—H group of a peptide is involved in a hydrogen bond, the position is shifted to a lower frequency. The amide B band was found at 2947.61 cm−1, associated with an asymmetrical stretch of CH2.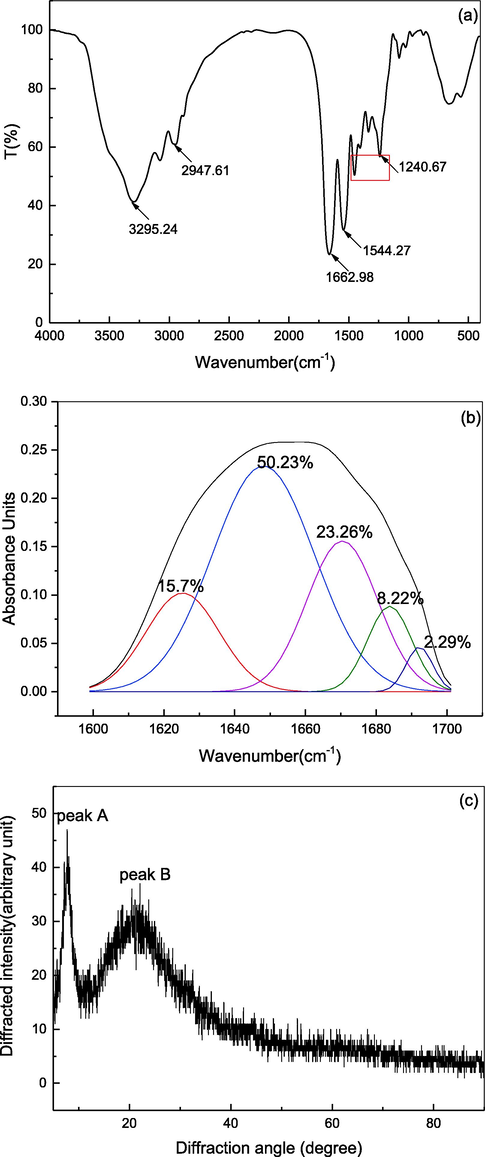
The secondary and tertiary structure of DPC. (a) FTIR spectrum; (b) Spectral curve-fitting; (c) X-ray s spectrum.
The infrared spectrum of amide I, amide II, and amide III was observed at 1662.98 cm−1, 1534 cm−1, and 1240.67 cm−1, respectively, which were related to the degree of molecular order and the triple-helical structure of collagen (Wang et al., 2019). The amide I band was around 1600–1700 cm−1, which was related to the stretching vibration of the carbonyl group (C⚌O) and the secondary structure of collagen (Yan et al., 2007). The shift of the amide II peak to a lower wavelength was related to the increased hydrogen bonding of the NH group (Yousefi et al., 2017). The amide II band usually appears at 1550–1600 cm−1, which indicated N—H bending coupled with a C—N stretching vibration (Krimm and Bandekar, 1986). Therefore, the lower wavelength of the amide II band was related to the increased hydrogen bonding by NH groups. The absorption ratio of the amide III and 1450 cm−1 band was 1.19, which was close to 1, indicating that the prepared collagen had a complete structure and retained the shape of natural collagen (Sun et al., 2017).
3.3.3.2 Spectral curve-fitting
The amide I band, between 1600 and 1700 cm−1, has been shown to be the most sensitive and popular band for studying the secondary structure composition and conformational changes of proteins (Sadat and Joye, 2020). Second derivative analysis and band curve-fitting are mathematical resolution enhancement methods for resolving the protein spectrum into its components and unveiling overlapping peaks and shoulders. The amide I band included α-helices, β-sheets, β-turns, and random coils. As shown in Fig. 2(b), the spectral curve-fitting of DPC showed five major bands related to secondary structure. The component centered between 1646 and 1664 cm−1 was assigned to the α-helix secondary structure. DPC showed a dominant band at 1648 cm−1 comprising 50.2 % of the total α-helix content of the secondary structure. Indeed, α-helices can greatly shorten the length of the peptide chain and strengthen the extensibility. The stability of alpha-helices is important in protein folding and design of bioinspired materials (Qin et al., 2013). Bands in the region of 1610–1640 cm−1 and 1682–1700 cm−1 are usually assigned to a β-sheet structure. As shown in Fig. 2, the three bands centered at 1625 cm−1, 1684 cm−1, and 1692 cm−1 were assigned to β-sheet structures with a content of approximately 26.51 % of the secondary structure. Typical β-turn and random coil peaks are represented by bands at 1664–1681 cm−1 and 1637–1645 cm−1, respectively, which are related to protein unfolding, dissociation, and rearrangement (Li et al., 2022). A β-turn was centered at 1670 cm−1 with a content of approximately 23.26 % of the total amino acids, and random coils were not observed.
The α-helix and β-sheet are generally considered “ordered” secondary structures, while the β-turn and random coil are considered “unordered” protein secondary structures. DPC “ordered” secondary structure composition (76.74 %) was much higher than the “unordered” secondary structure composition (23.26 %). Additionally, compared with other proteins, the amount of “ordered” secondary structure in DPC was higher than that of zein (α-helix, 34 ± 2 %; β-sheet, 42 ± 4 %) (Sadat and Joye, 2020), whey protein isolate (α-helix, 21.7 %; β-sheet, 25.5 %) (Shang et al., 2020), and red drum fish collagen (α-helix, 36.03 ± 0.17 %; β-sheet 35.04 ± 0.59 %) (Chen et al., 2022). These results indicated that the secondary structure of double-spotted pufferfish has tight connections.
3.3.4 Tertiary structure analysis
As shown in Fig. 2(c), DPC had two characteristic collagen peaks (peak A, peak B) at diffraction angles (2θ) 7.74° and 21.41°, respectively, corresponding to the characteristic diffraction peaks of collagen that contains proteins having an ordered structure or ordered structure snippet. Peak A represents a relatively sharp diffraction peak, and peak B represents a rounded and broad diffraction peak. This was consistent with tilapia collagen (Sun et al., 2017). The value of d calculated by the Bragg equation (Equation 3) corresponding to peak A was 11.45 (Å), reflecting the distance between collagen molecular chains, which is related to the triple helix conformation. The d value of peak B was 4.22 Å, indicating the distance between skeletons. This was consistent with Pacific cod, tilapia scales, and grass carp swim bladders (Sun et al., 2017; Chen et al., 2016; Li et al., 2022), in which the d values corresponding to both sharp and broad peak pairs were 11.63 Å and 3.96 Å, 11.569 Å and 4.485 Å, and 11.39 Å and 4.17 Å, respectively. The d value of DPC was lower than the fish skin, indicating that the hydrogen bond between molecules was less weakened, and the collagen was a complete triple helix structure.
3.4 Physicochemical properties
3.4.1 Td
The Td value of collagen is defined as the temperature at which the change in relative viscosity was half completed when the collagen triple helix structure dissociated into random coils in a solution (Chen et al., 2019). The denaturation temperature of DPC was 27.8 °C, which was close to the Td value of the ocellate puffer fish (Takifugu rubripes, Td = 28 °C) and the balloon fish (Diodon holocanthus, Td = 29.64 °C) determined by other researchers (Nagai et.al, 2002; Huang et al., 2011; Wang et al., 2019). The factors affecting the thermal stability of fish collagen are mainly the living environment of fish. Compared with other aquatic animals, the DPC Td was higher than the Td of the backbone of Baltic cod (14.4 °C, Zelechowska et al., 2010), deep-sea redfish (16.1 °C, Wang L et al., 2008), and red stingray skin (23.82 °C, Chen J D et al., 2019). Compared to other collagens, DPC had a relatively high thermal stability and a large content of ordered secondary structures (76.74 %) (Choi and Ma, 2005), which is an advantage for its application in the field of food or biofunctional materials in the future.
3.4.2 Isoelectric potential (pI)
The zeta potential, representing the surface charge of DPC, is shown in Fig. 6 at different pH values, ranging from 2 to 10. The zeta potential result indicated that a zero net charge of DPC was found at pH 6.7, which was its pI.
3.5 Rheological properties
3.5.1 Dynamic sweep tests
The frequency dependence of the storage modulus (elastic modulus) G', loss modulus (viscous modulus) G'', complex viscosity η*, and loss tangent tanδ is shown in Fig. 3. Fig. 3(a–c) shows that at the same frequency, G', G'', and η* increased as the DPC concentration increased. As the concentration increased from 5 mg/mL to 25 mg/mL at 0.01 Hz, G' increased from 0.0199 Pa to 5.87 Pa, and G'' increased from 0.0388 Pa to 7.48 Pa. These results suggest that the viscoelasticity (G', G'') of DPC solutions are greatly affected by concentration, which is similar to that of the swim bladder of grass carp collagen (Li et al., 2022). This is because the entanglement and friction of collagen molecules increase as the concentration increases (Ren et al., 2012), which affect viscoelasticity. At the same time, it can also be observed from the results that G' and G'' increased with increasing frequency (0.1–10 Hz). Using 10 mg/mL of collagen solution as an example, the storage modulus (G') continuously increased from 0.225 Pa to 29.9 Pa with increasing frequency (0.1–10 Hz). Additionally, the loss modulus G'' also increased from 0.617 Pa to 23.2 Pa with increasing frequency (0.1–10 Hz) but was lower than the storage modulus (G').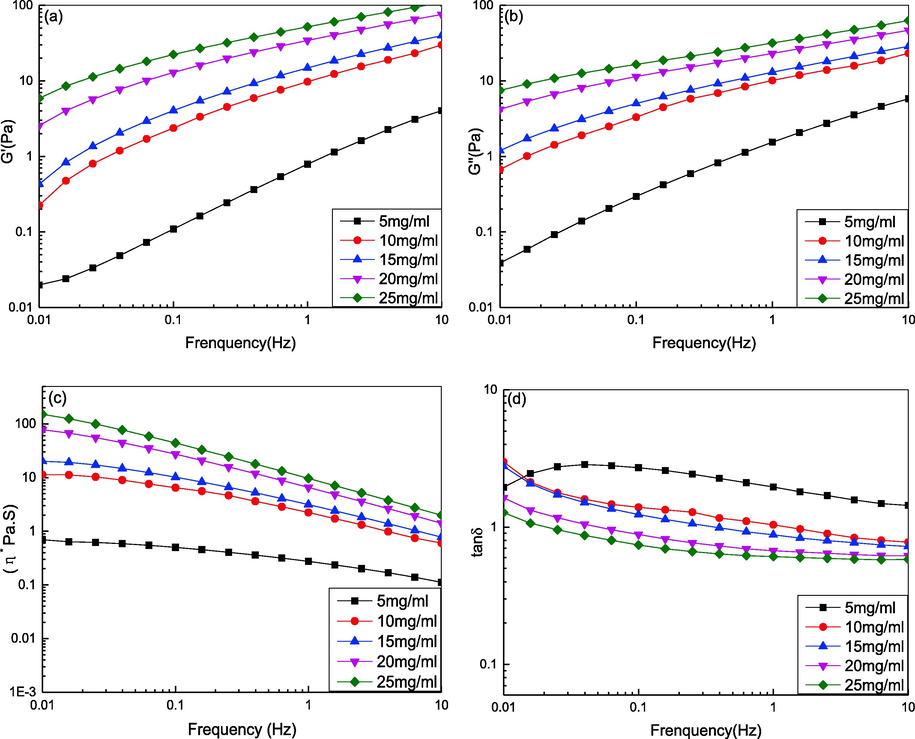
Effect of concentration on the rheological behavior of DPC solution. (a) The storage modulus G'; (b) The loss modulus G“; (c) The complex viscosity η*; (d) Loss tangent (tan δ).
It can be observed from Fig. 3(c) that η* decreased as the shear frequency increased in the range of 0.1–10 Hz, which showed that the collagen solution exhibited shear thinning, pseudoplastic fluid behavior. These results suggest that a high viscosity at low shear rates could contribute to excellent structural stability, whereas a highly pseudoplastic flow could provide good mouthfeel. As Brummer and Godersky (1999) reported, the initial skin feel is related to shear rate and dynamic viscosity. Therefore, DPC has excellent spreadability properties and can be applied in the cosmetics industry.
The loss tangent, tanδ, is defined as the ratio G''/G'. If tan δ < 1, the solution system mainly exhibits viscous behavior (liquid-like behavior), and if tan δ greater than 1, the solution system exhibits elastic behavior (solid-like behavior). Fig. 3(d) shows that in the frequency range of 0.1–10 Hz, the tanδ of the solution collagen gradually decreased as the shear frequency increased. Furthermore, tanδ ranged from more than one to less than one, which illustrated that the rheological behavior changed from viscous to elastic characteristics (Chen et al., 2019). The results suggest that as a dynamic viscoelastic fluid, DPC solutions might be developed as injectable materials for drug delivery, tissue engineering, and repair of dermatological defects because of their excellent viscoelasticity properties.
It can be observed from Fig. 4(a–c) that the G', G'', and η* of DPC decreased as the temperature increased. This showed that the temperature had a significant effect on the rheological properties of DPC. The G' and G'' decreased from 0.156 to 0.125 Pa and from 0.552 Pa to 0.369 Pa, respectively, and η* decreased from 9.13 Pa.s to 6.2 Pa.s when the temperature increased from 20 °C to 25 °C at 0.01 Hz. The viscoelasticity properties of DPC changed slightly because the temperature was lower than the Td (27.8 °C) of DPC. However, the rheological properties of DPC decreased significantly when the temperature increased from 25 °C to 30 °C. G' and G'' decreased from 0.125 to 0.00703 Pa and from 0.369 Pa to 0.00392 Pa, respectively, and η* decreased from 6.2 Pa.s to 0.128 Pa.s. This was mainly because at temperatures above the Td of DPC, the molecular movements of DPC were accelerated, which led to the destruction of the network structure of DPC (Ren et al., 2012). When the temperature was greater than 30 °C, G' and G'' lost their regularity and η* decreased significantly, which reflected the collapse of the DPC triple helix to a random coil (Ren et al., 2012), and the hydrogen bonds between the CO and NH groups of two neighboring chains were broken.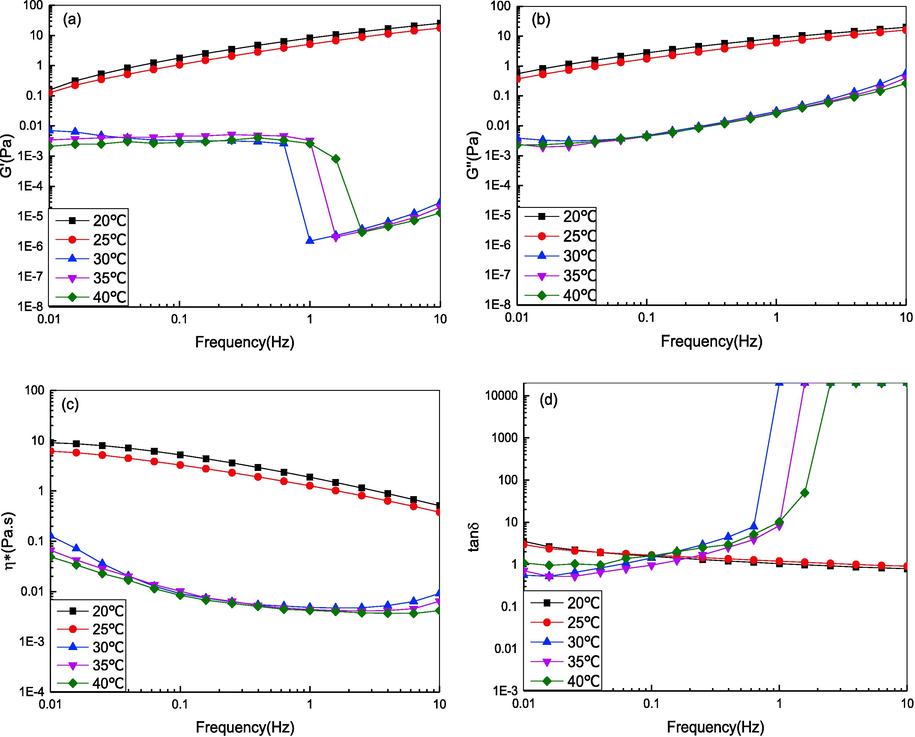
Effect of temperature on the rheological behavior of DPC solution. (a) The storage modulus G'; (b) The loss modulus G“; (c) The complex viscosity η*; (d) Loss tangent (tan δ).
Fig. 4(d) shows that when the temperature was lower than 30 °C, tanδ was greater than one, which demonstrated that the collagen solution exhibited a viscous behavior. The tanδ increased sharply but irregularly when above 30 °C. In the case of cosmetic and food applications, appropriate rheological behavior at different temperatures is essential to design a proper formulation and confirm its applicability under several conditions. Additionally, when the frequency was greater than 1 Hz, the collagen solution exhibited viscous behavior in the low frequency region and elastic rheological behavior in the higher frequency region. This was mainly due to the sharp reduction of G' from the breakdown of the hydrogen bonds that maintained the triple helical structure of collagen (Chen et al., 2019).
3.5.2 Steady shear tests
Fig. 5(a,b) shows the plots of shear stress and viscosity versus shear rate for DPC solutions at various concentrations at 20 °C. The viscosity significantly decreased with increasing shear rate, as shown in Fig. 5(b), which was consistent with previous studies (Li et al., 2022; Zhu et al., 2017). DPC solutions at different concentrations all exhibited typical flow behavior of non-Newtonian shear thinning, which became more conspicuous at higher concentrations. This was mainly because shearing led to the orientation or deformation of the DPC macromolecular networks in the direction of flow. DPC is a type I collagen, which has a right-handed triple helix of three peptide chains. The three strands are supercoiled around each other in a right-handed manner, and a ladder-type intermolecular backbone of N—H···O⚌C hydrogen bonds links adjacent strands. From the point of view of the DPC structure, at higher concentration solutions, the low-energy intra- or intermolecular interactions (including hydrogen bonds, hydrophobic interactions, and Van derWaals forces) were enhanced. The degree of intra- or intermolecular entanglements may offer a high initial resistance to shear, leading to more conspicuous shear-thinning behavior at higher concentrations (Huang et al., 2016). In practice, based on the shear-thinning phenomenon exhibited by the DPC solution, the shear rate can be increased depending on the requirements of the production process, such as by increasing the machine speed or propulsion speed within a certain range of shear rates, in order to reduce the viscosity to increase fluidity and reduce energy consumption, thus improving production efficiency.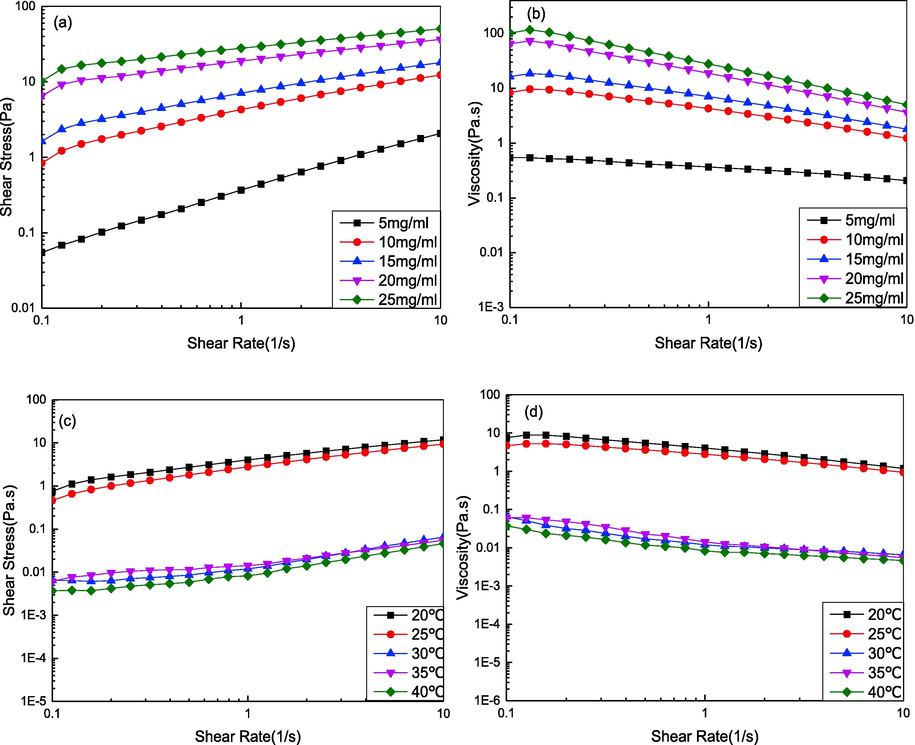
Steady-state rheological properties of DPC. (a) plot of shear stress versus shear rate at various concentrations; (b) plot of viscosity versus shear rate at various concentrations; (c) plot of shear stress versus shear rate at various temperatures; (d) plot of viscosity versus shear rate at various temperatures;
Fig. 5(c, d) shows the plots of shear stress and viscosity against shear rate for the DPC solution (10 mg/mL) at different temperatures. The viscosity significantly decreased with increasing shear rate at the tested temperatures, as shown in Fig. 5(d). Similarly, DPC samples with different temperatures all behaved as typical non-Newtonian shear-thinning fluids. The viscosity significantly decreased with gradually increasing temperatures, especially when the temperature was above 30 °C (Fig. 5(d)). As a macromolecule with molecular weight of approximately 300 kDa, the migration of DPC molecules in solutions is mainly achieved by movement of polypeptide chains, which is further ascribed to its molecular flexibility imparted by glycine. As the temperature increased, the random thermal motion of DPC molecules intensified, and the molecular chains of DPC moved more easily, resulting in decreased viscosity of the solution. Solutions of DPC perhaps had a greater random coil secondary structure composition caused by weakening of hydrogen bonds when the temperature was above 30 °C. These results suggested that to better preserve the natural structure of collagen and to obtain the desired medical properties when DPC is used as a raw material for the preparation of fibers, membranes, and other materials, the temperature should be maintained below 30 °C.
3.6 Functional properties
3.6.1 WHC and OAC
WHC is regarded as an indicator of the ability of a protein to physically hold water against gravity, and is closely correlated to the viscosity, texture, and mouth feel of a food product (Çelik et al., 2019). The OAC of proteins generally reflects their capacity to interact with lipids and is strongly associated with emulsifying properties, flavor retention, and shelf life (Deng, et al. 2019). WHC and OAC are expressed as the amount of oil or water absorbed per gram of protein. The WHC of DPC was 23.93 ± 0.47 mL/g, which was higher than chicken feet collagen (1.9 ± 0.1 mL/g), red stingray collagen (20.76 ± 0.55 mL/g), and sour cherry kernel protein concentrate (2.42 ± 0.09 mL/g) (Dhakal et al., 2018; Chen et al., 2019; Çelik et al., 2019). In general, the high WHC of DPC can benefit aqueous food formulations by maintaining juiciness and softness in foods, for potential applications such as sausages, salami, meat analogues, and ready-to-eat meals. In addition to food applications, DPC can be used as a moisturizer in cosmetic creams for dry skin therapy.
OAC is related to flavor and texture retention in meat and confectionery products, and is affected by nonpolar side chains and hydrophobic amino acids (Zou et al., 2017). In our current study, the OAC of DPC was 31.93 ± 0.085 mL/g, which was very high when compared to that of chicken feet (5.3 ± 0.3 mL/g) and red stingray (Dasyatis akajei) (28.48 ± 0.69 mL/g) (Dhakal et al., 2018; Chen et al., 2019). The higher OAC of DPC may be due to its higher surface hydrophobicity, leading to increased oil absorption by the binding of proteins to the hydrocarbon chains of lipids (Wu et al, 2019). The higher OAC of DPC was also shown to be related to the higher β-sheet content of DPC (Zhu et al., 2020). Additionally, the OAC of DPC was greater than the WHC, indicating that the content of hydrophobic groups in DPC was higher than the content of hydrophilic groups.
In summary, the results show that DPC had a high water and oil absorption capacity, which is useful in the food processing industry. Specifically, the high OAC of DPC makes it a suitable ingredient for bread, cake batters, mayonnaise, sausages, and salad dressings.
3.6.2 Foaming properties
As shown in Fig. 7(a, b), the FC and FS of DPC at a range of pH values (2, 4, 6, 6.7, 8, and 10) generated U-shaped curves. The FC ranged from 8.26 % ± 0.38 % to 20.4 ± 0.57 % and reached its lowest value at pH 6.7 (8.26 % ± 0.38 %). These results could be due to the fact that the lowest foam properties coincided with the lowest solubility, when the DPC molecules aggregated at the DPC pI. When the pH shifted away from 6.7, the solubility and net charge of DPC increased, which led to a corresponding increase in the FC of DPC. The FC of DPC was found to be higher than the FC previously reported for rice bran protein concentrates of Basmati 370 (1.33 ± 0.05–2.50 ± 0.13) (Chandi and Sogi, 2007), casein (3.95 ± 0.07–10.15 ± 0.21 %) (Chandi and Sogi, 2007), and black ruff collagen (5.0 ± 0.01 %) (Bhuimbar et al., 2019). The excellent FC of DPC was related to the higher number of β-sheet structures of DPC. DPC may have a more open conformation due to more β-sheet structures, which promoted water–protein interactions, causing rapid conformational changes at the air–water interface with reduced surface tension, and then increased protein solubility and flexibility, thus increasing foam formation (Celik et al., 2019). The FS was similar to the FC, and ranged from 12.3 ± 0.38 % to 24.5 ± 0.38 %, and reached the lowest value (12.26 % ± 0.38 %) at pH 6.7. The FS increased when the pH was gradually shifted above or below 6.7, which was attributed to surface-active properties and adequate intermolecular interactions at the interface (Çelik et al., 2019). The FS of DPC was higher than that of sodium caseinate (21.75 ± 0.67) (Çelik et al., 2019), casein (0.17 ± 0.002–0.54 ± 0.61 %) (Chandi and Sogi, 2007), and black ruff collagen (0 %) (Bhuimbar et al., 2019).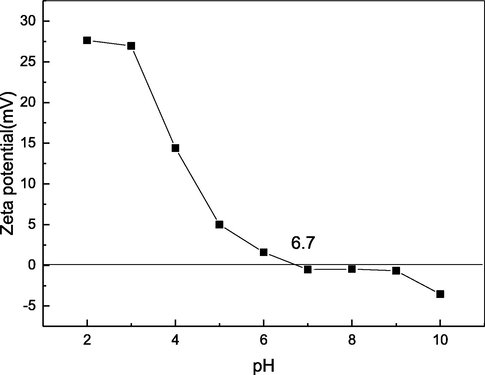
Zeta potential of DPC.
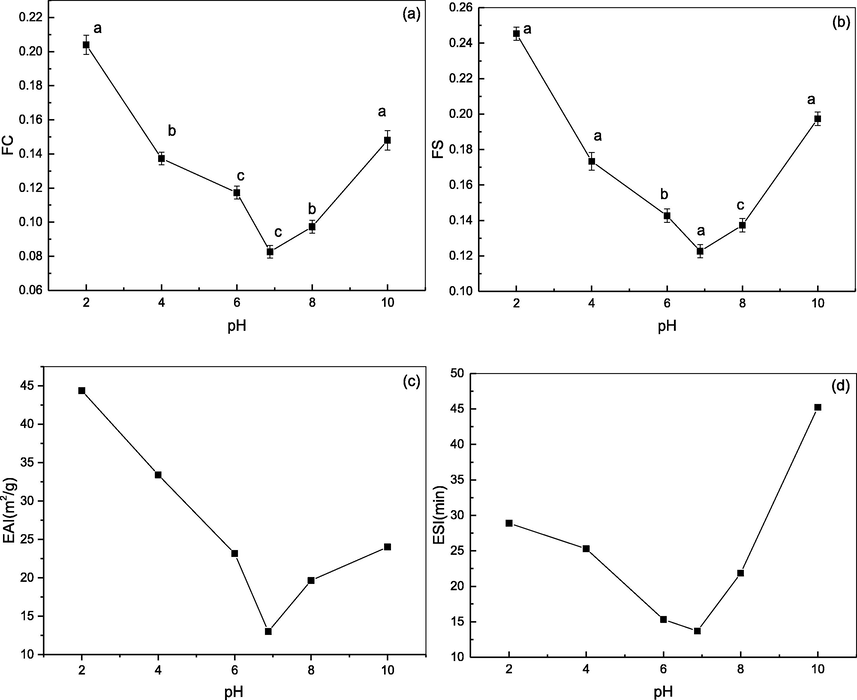
Functional properties of DPC. (a) FC; (b)FS; (c) EAI; (d) ESI. Different letters (a-d) indicate significant differences between samples.
Foaming properties contribute to smoothness, lightness, flavor dispersion, and palatability of foods. In summary, the results revealed that DPC had excellent foaming properties, therefore, could serve as a foaming agent in food systems requiring a high foaming capacity and foaming stability, such as baking, beverages, whipped toppings, and minor food ingredients.
3.6.3 Emulsifying properties
The EAI and ESI of DPC showed V-shaped curves within the tested pH range (2, 4, 6, 6.7, 8, and 10), similar to the relationship between foaming properties and pH. As shown in Fig. 7(c, d), EAI ranged from 44.36 ± 0.001 to 12.99 ± 0.0014 m2/g and reached the lowest value of 12.99 ± 0.0014 m2/g at pH 6.7. The ESI ranged from 45.23 ± 0.0033 min to 13.68 ± 0.0008 min and also reached the lowest point (13.68 ± 0.0008) at pH 6.7. When the pH value of the solution shifted away from the pI of DPC, the electrostatic repulsion between the molecules increased. The folding structure of DPC, determined by the a-helices, β-sheets, β-turns, hydrogen bonds, ionic bonds, and hydrophobic bonds, expanded and the hydrophobic groups inside the protein were exposed to the surface, thus accelerating emulsification (Zhang et al., 2020). These results could be because as the DPC molecules aggregated and precipitated, they were unable to unfold at the oil–water interface, and emulsification performance was minimized at the pI. The EAI of DPC was higher than previously reported for field pea protein isolates (11.8 m2/g) and protein isolates from soy (12.2 m2/g) (Shevkani et al., 2015). The ESI of DPC was higher than that of collagen of black ruff (10.02 ± 1.07 min) (Bhuimbar et al., 2019) and sharpnose stingray collagen (15.01 ± 0.09 min) (Shaik et al., 2021). Compared to other proteins, DPC has a higher EAI and ESI due to its greater β-sheet content (26.51 %), which resulted in increased flexibility and surface hydrophobicity of DPC, and increased interactions between DPC and corn oil as well as DPC molecular rearrangements at the oil–water interface (Zhu et al., 2020). These results indicate that DPC is a potential ingredient for many food formulations, such as salad dressing, sausages, comminuted meats, ice cream, cake batters, and mayonnaise. Additionally, a greater degree of unfolding of polypeptides might have occurred in the KBIs with a lower protein content during the emulsification process; consequently a much greater surface area of the protein was made available, which might have also enhanced the emulsifying activity.
3.7 Cytocompatibility
3.7.1 Cell viability and proliferation
Cellular viability and proliferation of MC3T3-E1 cells were assessed to determine the cytocompatibility of DPC. It can be observed from Fig. 8 that relative cell proliferation rates were 110.35 % ± 5.16 %, 110.43 % ± 3.6 %, and 122.73 % ± 1.44 % on the first, third, and fifth days, respectively. This was higher on the fifth day than that of lizardfish skin collagen (113.43 % ± 2.40 %) (Chen et al., 2021), silver carp skin collagen (97 %) (Faralizadeh et al., 2021), and grass carp swim bladder collagen (115.98 %) (Li et al., 2022). Additionally, the cell viability of the experimental group was higher than that of the control group (p < 0.05), indicating that DPC was biocompatible and positively affected cell viability. The cell viability was greater than 70 %, indicating that DPC was nontoxic to the cells, according to ISO 10993–5 (Faralizadeh et al., 2021). These results indicate that DPC can be incorporated into biomaterials for wound healing and other clinical and cosmetic applications.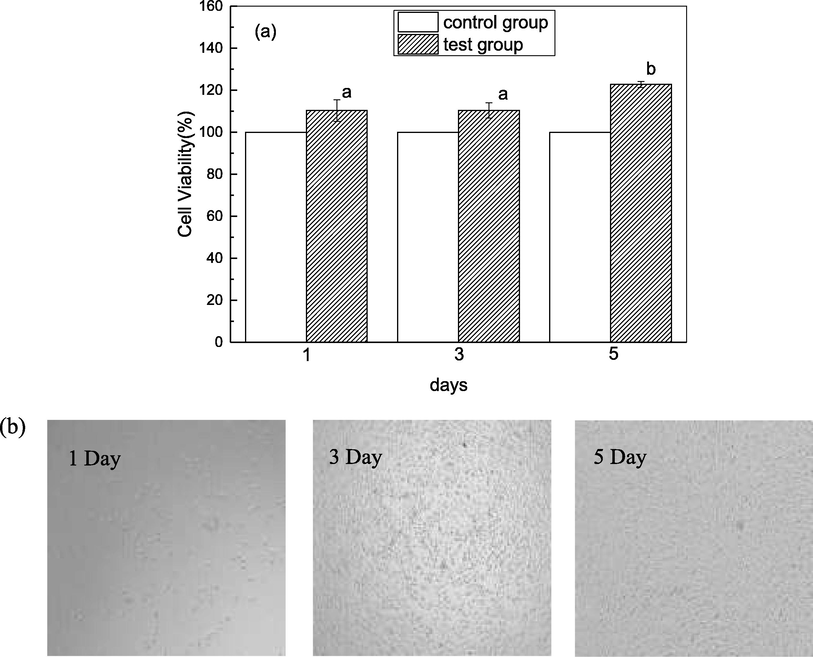
Cytocompatibility. (a) Cell viability of MC3T3-E1 cells treated after 1, 3, 5 days; (b) Morphological changes of MC3T3-E1 cells treated after 1, 3, 5 days. Different letters (a-b) indicate significant differences between samples.
3.7.2 Cell morphology
The cell morphology of MC3T3-E1 cells with DPC is shown in Fig. 8. Microscopic observation of MC3T3-E1 fibroblasts shows normal and complete morphology and regular growth, indicating that cell proliferation was promoted by DPC. This phenomenon was consistent with the CCK-8 results, which demonstrated that collagen from pufferfish skin had good biocompatibility and induced integrin-mediated cellularity. In summary, DPC could be used as a nontoxic and suitable material for biomedical and tissue engineering applications, such as scaffolds.
4 Conclusions
DPC was extracted from double-spotted pufferfish skin with a yield of 49.83 % ± 1.85 % (dwb). DPC was identified by SDS-PAGE as type I collagen [(α1)2α2]. The DPC primary structure analysis results indicated that Gly-X-Y triplets accounted for 78.3 % and 78.4 % of the content of amino acid sequences in the DPC α1 and α2 subunits, respectively. Secondary structures of DPC were quantified as α-helices (50.23 %), β-sheets (26.51 %), β-turn (23.26 %), and random coils (0 %). The DPC ordered secondary structure composition was much higher than the unordered secondary structure composition. The DPC tertiary structure analysis results indicated that the distance between DPC molecular chains was 11.45 (Å), and that DPC maintained a natural triple-helical collagen structure. The dynamic sweep and steady-state shear of DPC were significantly affected by temperature and concentration, and DPC solutions exhibited shear-thinning behavior. G', G'', and η* increased with increasing DPC concentration and decreased as the temperature increased. The rheological behavior of DPC was closely aligned to the requirements of food and cosmetic production, such as cooking, gelling, and pasteurization. It is feasible to realize a range of cosmetic and food industry applications by controlling concentration and temperature. In terms of functional properties, the WHC and OAC of DPC were higher than those of chicken feet collagen, red stingray collagen, and sour cherry kernel protein concentrate. The FC and FS of DPC were higher than those of sodium caseinate, casein, and black ruff collagen. The EAI of DPC was higher than that of field pea protein isolates and soy protein isolates. The ESI of DPC was higher than that of black ruff collagen and sharpnose stingray collagen. These findings together indicate that DPC is a potential ingredient for many food formulations, such as salad dressing, sausages, comminuted meats, ice cream, cake batters, bologna, and mayonnaise. Moreover, MC3T3-E1 cells were able to proliferate and maintain normal morphology in DPC solutions. In conclusion, DPC shows great potential for food, cosmetics, and biomedical applications, and is expected to be an alternative source for the collagen market.
Funding
This work was supported by grants from the National Natural Science Foundation of China (42076120, 41676129, 41106149), and Scientific Research Foundation of the Third Institute of Oceanography, SOA (2019010, 2019016).
CRediT authorship contribution statement
Xiyuan Gao: Conceptualization, Methodology, Formal analysis, Data curation, Writing – original draft. Jianlin He: Software, Formal analysis, Data curation. Junde Chen: Conceptualization, Validation, Resources, Writing – original draft, Writing – review & editing, Supervision, Project administration, Funding acquisition. Yan Zheng: Software, Data curation. Yushuang Li: Software, Data curation. Tong Ye: Data curation.
References
- Processing and quality of natural-tasting steamed fish paste containing unwashed pufferfish Lagocephalus wheeleri surimi. Korean J. Fish. Aquat. Sci.. 2019;52(6):562-570.
- [CrossRef] [Google Scholar]
- Extraction and characterization of acid soluble collagen from fish waste: Development of collagen-chitosan blend as food packaging film. J. Env. Chem. Eng.. 2019;7(2):102983
- [CrossRef] [Google Scholar]
- Mass spectrometry-based metabolomics approach to reveal differential compounds in puffer fish soups: Flavor, nutrition, and safety. Food Chem.. 2019;301:125261
- [CrossRef] [Google Scholar]
- Rheological studies to objectify sensations occurring when cosmetic emulsions are applied to the skin. Colloid. Surface. A.. 1999;152(1–2):89-94.
- [CrossRef] [Google Scholar]
- Effect of pH on protein extraction from sour cherry kernels and functional properties of resulting protein concentrate. J. Food Sci. Technol.. 2019;56(6):3023-3032.
- [CrossRef] [Google Scholar]
- Functional properties of rice bran protein concentrates. J. Food Eng.. 2007;79(2):592-597.
- [CrossRef] [Google Scholar]
- Preparation and Characterization of Thermally Stable Collagens from the Scales of Lizardfish (Synodus macrops). Mar. Drugs. 2021;19(11):597.
- [CrossRef] [Google Scholar]
- Compositional and structural characteristics of pepsin-soluble type I collagen from the scales of red drum fish. Sciaenops ocellatus. Food Hydrocolloid.. 2022;123:107111
- [CrossRef] [Google Scholar]
- Extraction and characterization of acid-soluble collagen from scales and skin of tilapia (Oreochromis niloticus) LWT-Food Sci. Technol.. 2016;66:453-459.
- [CrossRef] [Google Scholar]
- Physicochemical and Functional Properties of Type I Collagens in Red Stingray (Dasyatis akajei) Skin. Mar. Drugs. 2019;17(10):558-577.
- [CrossRef] [Google Scholar]
- Electrodialysis extraction of pufferfish skin (Takifugu flavidus): A promising source of collagen. Mar. Drugs. 2019;17:25.
- [CrossRef] [Google Scholar]
- Conformational study of globulin from common buckwheat (Fagopyrum esculentum Moench) by fourier transform infrared spectroscopy and differential scanning calorimetry. J. Agric. Food Chem.. 2005;53:8046-8053.
- [CrossRef] [Google Scholar]
- Fish waste: from problem to valuable resource. Mar. Drugs. 2021;19(2):116.
- [CrossRef] [Google Scholar]
- Physicochemical and functional properties of Chinese quince seed protein isolate. Food Chem.. 2019;283:539-548.
- [CrossRef] [Google Scholar]
- Optimization of collagen extraction from chicen feet by papain hydrolysis and synthesis of chicken feet collagen based biopolymeric fibres. Food Biosci.. 2018;23:23-30.
- [CrossRef] [Google Scholar]
- Extraction, characterization and biocompatibility evaluation of silver carp (Hypophthalmichthys molitrix) skin collagen. Sustain. Chem. Pharm.. 2021;22:100454
- [CrossRef] [Google Scholar]
- The characterization of acid and pepsin soluble collagen from ovine bones (Ujumuqin sheep) J. Integr. Agric.. 2018;17:704-711.
- [CrossRef] [Google Scholar]
- Comprehensive assessment of Nile Tilapia skin (Oreochromis niloticus) collagen hydrogels for wound dressings. Mar. Drugs. 2020;18(4):178.
- [CrossRef] [Google Scholar]
- Emerging risks in the European seafood chain: Molecular identification of toxic Lagocephalus spp. in fresh and processed products. Food Control. 2018;91:311-320.
- [CrossRef] [Google Scholar]
- Isolation and characterization of acid and pepsin-solubilized collagens from the skin of balloon fish (Diodon holocanthus) Food Hydrocolloid.. 2011;25(6):1507-1513.
- [CrossRef] [Google Scholar]
- Steady, dynamic, and creep-recovery rheological properties of myofibrillar protein from grass carp muscle. Food Hydrocolloid.. 2016;61:48-56.
- [CrossRef] [Google Scholar]
- Isolation and characterization of biocompatible collagen from the skin of puffer fish (Lagocephalus inermis) J. Polym. Environ.. 2018;26(5):2086-2095.
- [CrossRef] [Google Scholar]
- Biochemical properties of skin collagens isolated from black carp (Mylopharyngodon piceus) Food Sci. Biotechnol.. 2012;21(6):1585-1592.
- [CrossRef] [Google Scholar]
- Isolation and properties of acid- and pepsin-soluble collagen from the skin of blacktip shark (Carcharhinus limbatus) Eur. Food. Res. Technol.. 2010;230(3):475-483.
- [CrossRef] [Google Scholar]
- Vibrational spectroscopy and conformation of peptides, polypeptides, and proteins. Adv. Protein Chem.. 1986;38:181-364.
- [CrossRef] [Google Scholar]
- Structural, functional, rheological, and biological properties of the swim bladder collagen extracted from grass carp (Ctenopharyngodon idella). LWT-Food. Sci. Technol.. 2022;153:112518
- [CrossRef] [Google Scholar]
- Collagen of the skin of ocellate puffer fish (Takifugu rubripes) Food Chem.. 2002;78(2):173-177.
- [CrossRef] [Google Scholar]
- Functional properties of protein concentrates and isolates produced from cashew (Anacardium occidentale L.) nut. Food Chem.. 2009;115(3):852-858.
- [CrossRef] [Google Scholar]
- Curcumin-loaded layer-by-layer folic acid and casein coated carboxymethyl cellulose/casein nanogels for treatment of skin cancer. Arab. J. Chem.. 2020;13(1):694-708.
- [CrossRef] [Google Scholar]
- Structure and mechanism of maximum stability of isolated alpha-helical protein domains at a critical length scale. Eur. Phys. J. B.. 2013;36(5):1-12.
- [CrossRef] [Google Scholar]
- Characterization of marine derived collagen extracted from the by-products of bigeye tuna (Thunnus obesus) Int. J. Biol. Macromol.. 2019;135:668-676.
- [CrossRef] [Google Scholar]
- Effect of concentration and temperature on the rheological behavior of collagen from swimming bladder of grass carp. Adv. Mat. Res.. 2012;1793:584-588.
- [CrossRef] [Google Scholar]
- Peak fitting applied to fourier transform infrared and raman spectroscopic analysis of proteins. Appl. Sci.. 2020;10(17):5918.
- [CrossRef] [Google Scholar]
- Functional properties of sharpnose stingray (Dasyatis zugei) skin collagen by ultrasonication extraction as influenced by organic and inorganic acids. Biocatal. Agric. Biotechnol.. 2021;35:102103
- [CrossRef] [Google Scholar]
- Structure and physiochemical characteristics of whey protein isolate conjugated with xylose through Maillard reaction at different degrees. Arab. J. Chem.. 2020;13(11):8051-8059.
- [CrossRef] [Google Scholar]
- Structural and functional characterization of kidney bean and field pea protein isolates: A comparative study. Food Hydrocolloid.. 2015;43:679-689.
- [CrossRef] [Google Scholar]
- Identification and release kinetics of peptides from tilapia skin collagen during alcalase hydrolysis. Food Chem. 2022;378:132089
- [CrossRef] [Google Scholar]
- Characterization of acid- and pepsin-soluble collagen extracted from the skin of Nile tilapia (Oreochromis niloticus) Int. J. Biol. Macromol.. 2017;99:8-14.
- [CrossRef] [Google Scholar]
- Comparison of nutritional composition of farmed pufferfish muscles among Fugu obscurus, Fugu flavidus and Fugu rubripes. J. Food Compos. Anal.. 2012;28:40-45.
- [CrossRef] [Google Scholar]
- Isolation and characterization of acid-soluble collagen from the scales of marine fishes from Japan and Vietnam. Food Chem.. 2014;149:264-270.
- [CrossRef] [Google Scholar]
- Isolation and characterisation of collagens from the skin, scale and bone of deep-sea redfish (Sebastes mentella) Food Chem.. 2008;108(2):616-623.
- [CrossRef] [Google Scholar]
- Comparison of physicochemical characteristics and fibril formation ability of collagens extracted from the skin of farmed river puffer (Takifugu obscurus) and tiger puffer (Takifugu rubripes) Mar. Drugs.. 2019;17(8):462.
- [CrossRef] [Google Scholar]
- Physicochemical and functional properties of protein isolate from maca (Lepidium meyenii) and secondary structure and immunomodulatory activity of its major protein component. Food & Function 2019
- [CrossRef] [Google Scholar]
- Characterization of acid-soluble collagen from the skin of walleye pollock (Theragra chalcogramma) Food Chem.. 2007;107(4):1581-1586.
- [CrossRef] [Google Scholar]
- An alternative source of type I collagen based on by-product with higher thermal stability. Food Hydrocolloid.. 2017;63:372-382.
- [CrossRef] [Google Scholar]
- Isolation and some properties of collagen from the backbone of Baltic cod (Gadus morhua) Food Hydrocolloid.. 2010;24:325-329.
- [CrossRef] [Google Scholar]
- Structural, physicochemical and functional properties of Semen Ziziphi Spinosae protein. RSC Adv.. 2020;10:29555-29566.
- [CrossRef] [Google Scholar]
- Rheological behavior of collagen/chitosan blended solutions. J. Appl. Polym. Sci.. 2021;138(34):50840.
- [CrossRef] [Google Scholar]
- The investigation of protein flexibility of various soybean cultivars in relation to physicochemical and conformational properties. Food Hydrocolloid.. 2020;103:105709.
- [CrossRef] [Google Scholar]
- Insights into the rheological behaviors evolution of alginate dialdehyde crosslinked collagen solutions evaluated by numerical models. Mat. Sci. Eng. C-Mater.. 2017;78:727-737.
- [CrossRef] [Google Scholar]
- Effect of ultrasound assisted extraction on the physicochemical and functional properties of collagen from soft-shelled turtle calipash. Int. J. Biol. Macromol.. 2017;105:1602-1610.
- [CrossRef] [Google Scholar]
Appendix A
Supplementary materials
Supplementary data to this article can be found online at https://doi.org/10.1016/j.arabjc.2022.104402.
Appendix A
Supplementary materials
The following are the Supplementary data to this article:Supplementary data 1
Supplementary data 1


