

Translate this page into:
Eco-friendly green synthesis of functionalized mesoporous silica nanospheres for the determination of Al(III) ions in multiple samples of different kinds of water
⁎Corresponding authors at: Department of Chemistry, Faculty of Applied Science, Umm-Al-Qura University, Makkah, Saudi Arabia (N.M. El-Metwaly). ashahat@aucegypt.edu (Ahmed Shahat), n_elmetwaly00@yahoo.com (Nashwa M. El-Metwaly)
-
Received: ,
Accepted: ,
This article was originally published by Elsevier and was migrated to Scientific Scholar after the change of Publisher.
Abstract
The current work proposed a new green procedure that is not sophisticated to recognize and determine the Al(III) ions in multiple water samples. The suggested method was conducted based upon the direct immobilization of aurintricarboxylic acid reagent into the mesoporous silica nanospheres to shape a unique and novel solid sensor. Al(III)-ATA red-complex has been formed at pH 4.0 and spectrophotometrically measured at 525 nm. Moreover, the complexation was reversible, and the ATA sensor retained his functionality even after six-time reuse/cycles using EDTA as eluent. Univariate and multivariate (partial least squares 1, PLS-1) calibration techniques were utilized for calculating the figures of merit for the determination of the Al(III) ions. The obtained calibration curve was linear from 2.0 to 70 ppb Al(III) ions concentration. The developed method has a detection limit of 3.5 ppb. In addition, the ATA sensor showed high adsorption capacity value (118.53 mg/g) which gives it a great advantage to be applicable as nanocollector for trapping Al(III) ions. The novel ATA sensor showed high degree of selectivity, sensitivity, reproducibility, and stability. The current study explores the effectiveness of the ATA sensor for the first time to produce a green solid sensor to determine the trace amount of Al(III) in diverse water types; tap, mineral, river, well, and sea water.
Keywords
Aluminum
Chemical sensor
Spectrophotometric
Determination
Water

1 Introduction
Aluminum (Al) is the third most common element on our planet's solid surface (Sposito, 1995). Aluminum was widely used in meals, drinking water, medications, and cooking utensils, exposing humans to excessive doses of it (You and Song, 2013). Through treating water within the plant, aluminum salts are predominantly and extensively used as flocculating agents. In multiple developing countries, the aluminum was broadly used as utensils for storing drinking water (Tria et al., 2007). It has been reported that there is a significant interconnection between the levels of Al found in drinking waters and a few human diseases such as osteomalacia, senile dementia and gastrointestinal symptoms (Nordberg, 1990). It is essential indeed to focus on its biological significance. Thus, the determination and assessment of Al in drinking waters is crucial to evaluate its biological effects. Several studies concentrated on the relation between toxicity of aluminum and dangerous disease like Alzheimer (Huat et al., 2019).
According to WHO, several factors can significantly affect the normal Al(III) ion concentration in water systems. Around 0.01 to 0.05 ppm of Al(III) ions often exist in natural waters. Most drinking waters also contain at the ppb levels (WHO, 1998). Therefore, there is increasingly needed to monitor Al(III) ion concentration to avoid coming near its serious limits.
There are many methods that are widely utilized to determine Al(III) ions in environmental samples. These approaches are commonly used, but they have some pitfalls when dealing with severe matrix interferences. Method like GF-AAS is costly and require significant expertise (Şahan et al., 2015). Spectrofluorimetric (Yıldız et al., 2017), and voltammetry (Downard et al., 1991) are other popular methods used for Al(III) ion determination. Alison et al. determined the Al(III) ions by applying single use of chemically changed electrode. Even though their detection system was simple, they possessed specific points of weakness in terms of sensitivity and selectivity (Downard et al., 1991). The zetasizer device has been used by erife and Mustafa to establish a new specific and quick magnetic dispersive solid-phase extraction (MDSPE) approach for the separation/determination of Al(III) in honey samples (Saçmacı and Saçmacı, 2020).
Researchers urge finding analytical methods with unique capabilities such as the easy, quick usage and low cost. Optical chemical sensors possess those capabilities with unique efficiency in terms of sensitivity and selectivity (Radwan et al., 2020; Shahat et al., 2020; Wang and Anslyn, 2011). The performance of the optical chemical sensors can be enhanced by careful choice of the supporting material. Mesoporous silica is among the powerful solid-supporting materials which are one of the top interesting materials. This may be because of its unique characteristics, such as extremely broad surface area that attached with huge-sized pore (Kresge et al., 1992). If compared to other ordinary materials, the surface of mesoporous materials could be changed with organic or inorganic chromophores, which lead to producing novel materials that have special physicochemical properties. Such products, when utilized with reagents, could be used as optical chemical sensors for analyte targets (Shahat et al., 2015; El-Sewify et al., 2018; El-Sewify et al., 2018; Abou-Melha et al., 2021; El-Safty et al., 2013; Altalhi et al., 2021; El-Sewify et al., 2017; Shahat et al., 2017).
In this work, we synthesized mesoporous silica nanospheres (MSNs) material, and it was used as a scaffold. Then we modified its surface by Aurintricarboxylic acid ammonium salt to create the ATA optical chemosensor. This created chemosensor is remarkably stable, rapid, selective, reusable and has a very low detection limit of Al(III) that reaches 3.5 ppb. Univariate and multivariate (partial least squares 1, PLS-1) calibration techniques were utilized for calculating the figures of merit for the determination of the Al(III) ions. Within multiple kinds of water samples, the ATA sensor has also been validated to track Al(III).
2 Experimental
All chemicals used in this study were analytical grade and used without further purification. Milli Q-water was used in all the experiments. Also, all experiments were independently repeated three times. A stock solution of Al(III) (1000 ppm) was purchased from Merck (Darmstadt, Germany).
2.1 Preparedness of mesoporous silica nanospheres
The mesoporous silica nanospheres -solid scaffold- were prepared as previously mentioned, but with some modifications (Shahat and Trupp, 2017). Typically, Milli Q-water (50 mL) was mixed with ethanol (20 mL) and diethyl ether (20 mL) and stirred for 30 min. After that, cetyltrimethylammonium bromide (0.5 g, CTAB, Sigma-Aldrich, USA) was added and stirred for another 30 min. NH4OH (1.0 mL, 25 wt%) was added and shacked for over 30 min. Next, Tetraethyl orthosilicate (2.5 mL, TEOS, Sigma-Aldrich, UK) was added to the above mixture. The gelatinous mixture got was preserved under stirring at □25 ± 2 °C for 8 h. The precipitated silica was isolated by filtration, Milli Q-water was used for washing, and dried at 80 °C for 24 h. Then, after raising the temperature from room temperature to 500 °C gradually over 5 h, it was calcined at 500 °C for 8 h.
2.2 Recognition of supreme Al(III) ion trace amounts using the ATA sensor
The ATA sensor obtained was by direct immobilization of the aurintricarboxylic acid ammonium salt (Sigma-Aldrich, UK) reagent, as described before (Scheme 1) (Shahat et al., 2015; El-Sewify et al., 2018; El-Sewify et al., 2018; Abou-Melha et al., 2021; El-Safty et al., 2013; Altalhi et al., 2021; El-Sewify et al., 2017). The immobilized amount of the aurintricarboxylic acid ammonium salt was calculated as described also before (Shahat et al., 2015; El-Sewify et al., 2018; El-Sewify et al., 2018; Abou-Melha et al., 2021; El-Safty et al., 2013; Altalhi et al., 2021; El-Sewify et al., 2017). So, the immobilized amount of the ATA chromophore was found to be 1.88 mmol per gram of mesoporous silica nanospheres. The resulted novel ATA sensor was used for the optical colorimetric detection of Al(III) ion at multiple values of pH; from (2–12). The system containing a mix of a certain concentration of Al(III) ions (0.07 ppm Al(III)), ∼20 mg of the fabricated ATA sensor and pH buffer solution with the 2–12 range. For the suspended solutions, analytical method was used involving the technique of UV–vis spectrometry (A Shimadzu 2600 UV/Vis spectrophotometer, solid state, Made in Japan). Univariate (Univar) and multivariate (partial least squares 1, PLS-1) calibration techniques were used for determination of Al(III). All software programs used in this paper are available for free (Olivieri and Olivieri, 2018).![Illustrative design of the ATA sensor by direct immobilization of the aurintricarboxylic acid ammonium salt probe onto the MSNs structure, and the reusability of the ATA sensor by using EDTA [0.2 M].](/content/184/2021/14/11/img/10.1016_j.arabjc.2021.103419-fig1.png)
Illustrative design of the ATA sensor by direct immobilization of the aurintricarboxylic acid ammonium salt probe onto the MSNs structure, and the reusability of the ATA sensor by using EDTA [0.2 M].
2.3 Applications for actual specimens
The experimental approach has been successfully applied to water samples, such as tap, mineral, river, well, or sea water. A filter membrane of cellulose was used to filter samples before acidification with HNO3 (1.0% v/v) and being stored at 4.0 ± 1 °C. 50 mL of each sample of water was digested with H2O2 (30% w/v) and HNO3 (65% w/w) to oxidize the organic content of water samples. The solution was kept on a hot plate with stirring to the semi-dried. Those samples with Milli-Q water were diluted to 50 mL and the phosphate buffer solution applied to change the pH of the samples to ∼4.0. 20 mg of the ATA sensor was then applied. The mixture was sonicated for 5 s and stirred for 15 min then measured by the UV–vis spectrophotometer. Inductively coupled plasma Mass Spectrometry (ICP-MS), Perkin Elmer SCIEXDRC-e ICPMS analyzer, was utilized to estimate Al(III) ion concentrations in the real water samples, and before and after the ATA sensor treatment.
3 Results and discussion
3.1 Structure and morphology of the mesoporous silica nanospheres
Using MSNs as a chromophore scaffold is noted for its special characteristics. Such features allow the ability of MSNs to enhance the features of this carried organic reagent in terms of selectivity and sensitivity. The low and wide angles X-ray diffraction patterns were collected to characterize the morphology of the MSNs and its ATA sensor using a X PERT PRO PANalytical (Made in Netherlands). For both the ATA sensor and the parent MSNs, the XRD low angle pattern (Fig. 1A) revealed a shoulder peak at 2θ ≈ 1.8° assuring that regular meso-structured exists. The curve also showed the similarity between the ATA sensor and the parent MSNs carrier, showing that the immobilization method doesn't affect the mesostructured pattern or its order. The XRD wide angle pattern (Fig. 1B) shows the stereotypical characteristic amorphous silica broad peaks at 2θ ≈ 18.0–38.0°. Also, there is no considerable change to this peak when the mesoporous silica was loaded by the ATA reagent.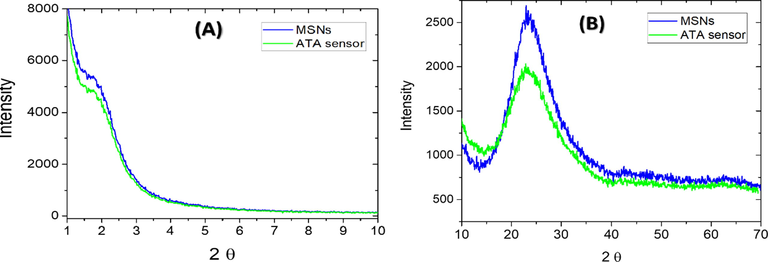
The XRD low angle (A) and the wide angle patterns (B) of the MSNs and the ATA sensor samples.
A Nova 3200 pore size and surface area analyzer was used for measuring N2 adsorption–desorption isotherms. The isotherm of N2 adsorption desorption is known to be a powerful technique for characterizing such mesoporous materials. The average pore width of MSNs and the surface area, along with the ATA sensor, were determined. In the IUPAC sorting, the Brunauer-Emmett-Teller (BET) isotherm points out the type IV adsorption activity, showing the characteristics of mesopores (Fig. 2A) with a precarious pressure adsorption stage p/po = 0.03 and a large hysteresis loop p/po = 0.5–0.8. The BET surface area and the pore volume of the MSNs before addition the ATA reagent were 638.72 m2g−1 and 0.708 cm3g−1, respectively. While after addition, the ATA reagent to form the ATA sensor was 532.27 m2g−1 and 0.59 cm3g−1.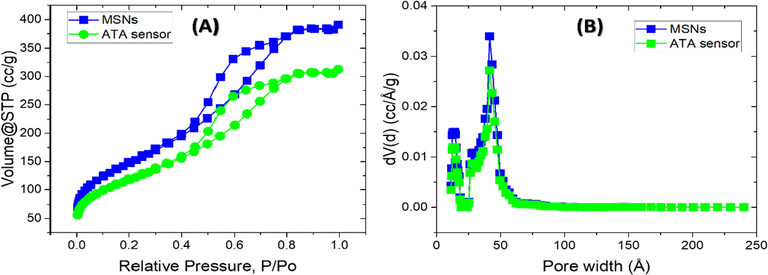
Low-temperature nitrogen adsorption–desorption isotherms (A) and the corresponding pore size distributions (B) of the MSNs carrier and ATA sensor.
A (Hitachi S-4300 field emission) (FESEM) was applied on the MSNs carrier and its ATA sensor to investigate their surface topography and particulate shapes. The MSNs carrier and its ATA sensor, as seen in Fig. 3, emerged as nanospheres, most of them with a diameter of around 90 nm. This was confirmed by using the transmission electron microscope. A HR-TEM (Tecnai G20, Made in Netherlands) has been used on the MSNs carrier and its ATA sensor for the collecting the images of their morphology. The HR-TEM and the FESEM images were found to be in accordance, where the MSNs carrier and its ATA sensor are found as nanospheres with a mean diameter about 90 nm as shown in Fig. 4A and B.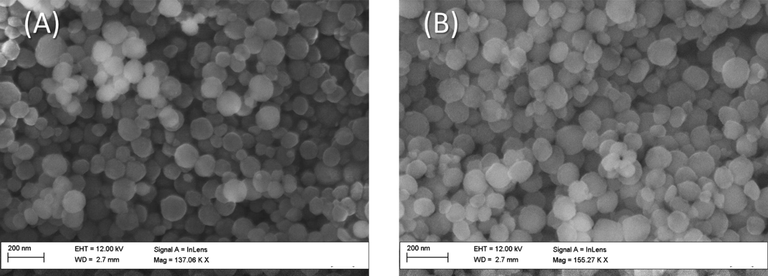
FESEM micrographs of the MSNs (A) and the ATA sensor (B).
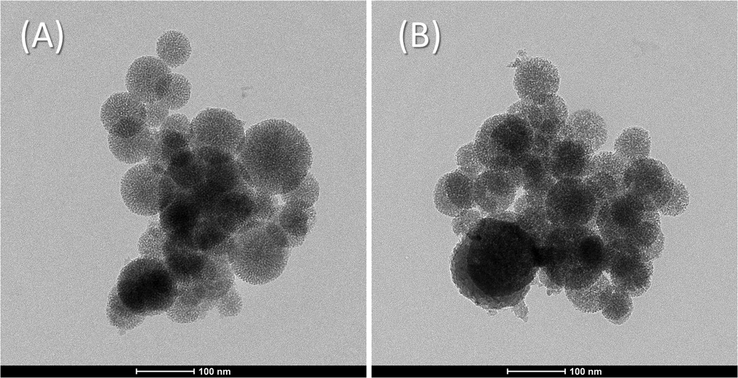
Representative HR-TEM images for the MSNs (A) and the ATA sensor (B).
3.2 Identification process for Al(III) ions by ATA sensor
There are many variables that can affect the efficiency of the chemical sensors. Adjusting these variables heightens the selectivity and the sensitivity of them. These variables were such as the pH, the sensor amount, the response time, and the temperature (Shahat et al., 2015; Kamel et al., 2021; Awual et al., 2015; Awual et al., 2014). To detect the optimum conditions for the identification process of Al(III) ions by ATA sensor these variables were carefully studied. The best pH value for Al(III) ion sensing was selected by measuring the absorbance spectra of [Al(ATA)3] formed in a series of different pH solutions containing 0.07 ppm of Al(III) ion (Fig. 5A). The high absorbance intensity was observed at pH 4.0.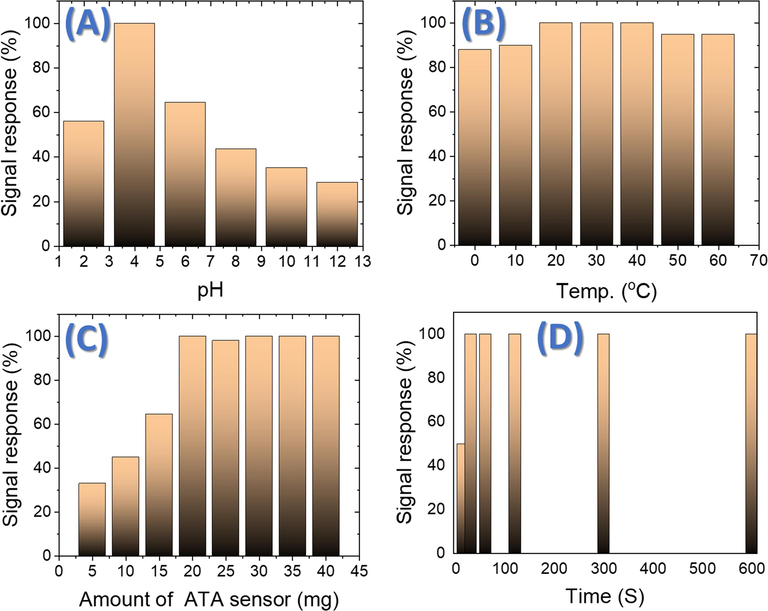
Signal response of the impact of pH changes on 10 mL solution containing of 0.07 ppm Al(III) ions stirring at 25 °C using 20 mg ATA sensor and absorbance at 525 nm (A), effect of temperature on a solution containing of 0.07 ppm Al(III) ions at pH 4 and absorbance at 525 nm (B), effect of amount of the ATA sensor on 10 mL solution stirring at 25 °C, containing of 0.07 ppm Al(III) ions at pH 4 and absorbance at 525 nm (C), effect of time for 10 mL solution stirring at 25 °C, containing of 0.07 ppm Al(III) ions at pH 4 to react with 20 mg ATA sensor at absorbance of 525 nm (D).
The influence of temperature upon this complexation reaction was examined by running the experiment at temperatures varying from 0 to 60 °C. It was discovered that the most suitable temperature range for complexation is 20–40 °C (Fig. 5B). In addition, the signal response decreases above 40 °C. So, we conducted all our measurements at room temperature. The amount of the ATA sensor was also checked using different weighted from 5 to 40 mg sensor (Fig. 5C). Results showed that 20 mg of the ATA sensor was the perfect amount for getting the highest response signal.
The effect of time on the complexation reaction (the reaction of the ATA sensor with Al(III0 ions) was also observed when the reaction was run for 30 s to 10 min (Fig. 5D). It was noticed that after 30 s, the complexation reaction was complete. The maximum color intensity of the complex formed after only 30 s proved this. This time is too short comparing with the reaction of the ATA reagent in aqueous media which take over 20 min (Robtelsky and Ben-bassat, 1965; Tria et al., 2007; Clark and Krueger, 1985).
The reusability of the ATA sensor after reacting with the Al(III) ions has been checked. Many eluents have been tested but EDTA [0.2 M] was found as a perfect recycling reagent (Scheme 1). The used ATA sensor was stirred for 1 h with EDTA [0.2 M]. The recycled ATA sensor was reacted again with Al(III) ions and this process was repeated for six times as shown in Table 1. The sensing efficiency of the ATA sensor was calculated each time described in Table 1. The results indicated that the ATA sensor kept its efficiency (82%) even after six-times recycling. a
(Olivieri and Olivieri, 2018). b
(Olivieri and Olivieri, 2018). c
(Olivieri and Olivieri, 2018). dThe sensing efficiency (E) of the ATA sensors within the recycle numbers was estimated in terms of the sensitivity during the detection of Al(III) and (tR) recovery time. It was calculated as % (A/Ao), where A is the absorbance at λ525 of ATA sensor after reusability and Ao is the initial absorbance. (Olivieri and Olivieri, 2018).
Statistic parameter
Univar
PLS 1
Sensor features of reuse cycles
Ref.
SENa / gamma
1077.4
8678.7
Eluent
No.
tR min
Ed%
LODb (ppb)
3.5
4.3
[0.2 M]
2
20
92
LOQc (ppb)
10.2
13.0
EDTA
4
30
89
Slope
2.598
–
6
50
82
Intercept
0.134
–
Coefficient of determination (R2)
0.9992
0.9994
3.3 The analytical parameters and method validation
By utilizing the solid ATA sensor, the detection range (DR) can be quantitatively evaluated by the UV–vis-spectroscopy experiments as presented in Fig. 6. The color's concentration of the ATA sensor at wavelength 525 nm increased with increasing the Al(III) ions concentration. The calibration plot presented in Fig. 7 elaborates that there is a linear connection between the ATA sensor and the low concentrations of Al(III) ions. The linear curve shown in Fig. 8 demonstrated that, over a concentration ranged from 2 to 70 ppb, the Al(III) ions can be determined with high sensitivity. Figures of merit for the determination of the Al(III) ions were calculated by univar and PLS-1 calibration techniques and summarized in Table 1. The mathematical theories for these figures have been described in relevant literature (Olivieri and Olivieri, 2018), so not to repeat them here. The limit of detection (LOD) and the limit of quantitation (LOQ) were calculated according to IUPAC recommendations based on types I and II errors (false positives and false negatives), and on the propagation of uncertainties in slope and intercept as defined in the Equations presented in Table 1. The LOD value showed that the ATA sensor allowed tracking of Al(III) ions up to 3.5 ppb. The use of nanomaterial (mesoporous silica nanospheres) as a carrier increased the sensitive property of the immobilized reagents, which explains the high sensitivity of the ATA sensor. It is clear from Table 2 that the LOD is relatively low when compared to the other spectrophotometric methods (Winter et al., 1929; Shokrollahi et al., 2008; Ahmed and Hossan, 1995; Rodrigues et al., 2005; Huseyinli et al., 2009; Norfun et al., 2010; Zaręba and Melke, 2000). As noted in numerous articles, chemical sensors using nanomaterials as a scaffold improved their selectivity, sensitivity, reproducibility, and acceptable degree of stability and shelf-life (Shahat et al., 2015; El-Sewify et al., 2018; El-Sewify et al., 2018; Abou-Melha et al., 2021; El-Safty et al., 2013; Altalhi et al., 2021; El-Sewify et al., 2017; Shahat et al., 2017; Shahat and Trupp, 2017).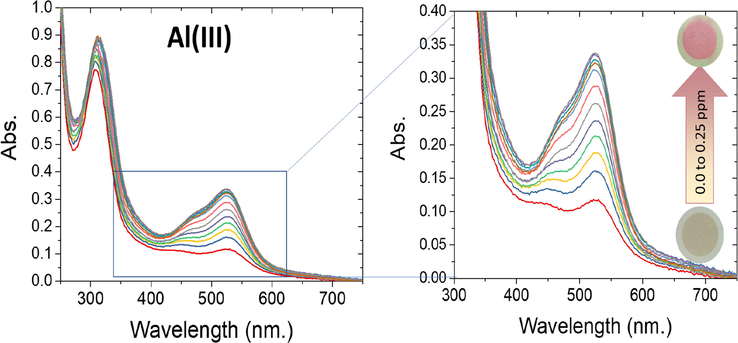
Observed concentration-proportionate color transition profiles and concentration-dependent changes in the absorbance spectra of 20 mg ATA sensor in 10 mL solution containing several concentrations of Al(III) ions at pH 4.0 and stirring at 25 °C.
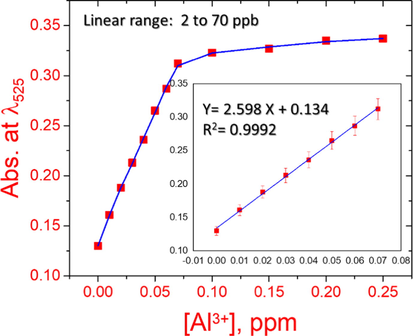
The calibration plot of 20 mg ATA sensor in 10 mL solution containing several concentrations of Al(III) ions at pH 4.0, absorbance at 525 nm and stirring at 25 °C.
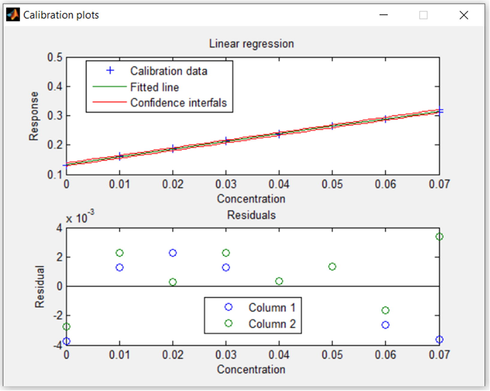
Univariate determination plot of 20 mg ATA sensor in 10 mL solution containing several concentrations of Al(III) ions at pH 4.0, stirring 25 °C, and absorbance at 525 nm.
Reagent / Sensor
pH
LOD ppb
Ref.
Aurintricarboxylic acid in solution
4.5
200
(Winter et al., 1929)
Eriochrome cyanine with N,N-dodecyltrimethylammonium bromide
6
0.14
(Shokrollahi et al., 2008)
Morin
6
100.0
(Ahmed and Hossan, 1995)
Eriochrome cyanine R with cetyltrimethylammonium bromide
4
3.24
(Rodrigues et al., 2005)
2,2′,3,4-Tetrahydroxy-3′,5′-disulphoazobenzene
5
5.0
(Huseyinli et al., 2009)
Guercetin with cetyltrimethylammonium bromide
5.5
24.0
(Norfun et al., 2010)
3-(3′,4′ -dihydroxyphenylazo-1′)-1,2,4-triazole
6.2
0.6
(Zaręba and Melke, 2000)
Aurintricarboxylic acid ammonium salt on mesoporous silica nanospheres
4
3.5
This work
3.4 Effect of interfering species
In order to evaluate selectivity and the possible analytical applications of this chemosensor, the impact of some foreign ions such as Fe3+, Mg2+, Ca2+, Co2+, Ag+, Cd2+, Ni2+, Zn2+, Pb2+, Cu2+, Hg2+, Mn2+, Sr2+, Na+, Sn2+, or K+ have been tested by two ways using the ATA senor. First way, 20 mg ATA sensor was added to a specific concentration of the foreign ion at pH 4. The absorption spectra of these solutions were collected as shown in Fig. 9. In the second way, the absorption spectra were collected for 20 mg ATA sensor, 0.07 ppm of Al(III), and a specific concentration of each of the above foreign ions at the recommended analytical procedure explained above. The tolerance limit for the interfering ions, which gives an error less than ±5% in absorbance reading, is given in Table 3. From Fig. 9 and Table 3, Determination of Al(III) ion was defined with high accuracy, selectivity and precision, while a large amount of alkaline and alkaline earth ions besides some transition metal ions exist. Cu(II) and Fe(III) with a concentration of 10-fold can cause increases of 5% in the signal of the ATA sensor. They can be masked after adding 0.2 M of L-histidine and 0.2 M of ascorbic acid, sequentially. Therefore, this proposed method is suitable for analyzing natural water with high sensitivity and selectivity. * Masked by 0.2 M of ascorbic acid. ** Masked by 0.2 M of L-histidine.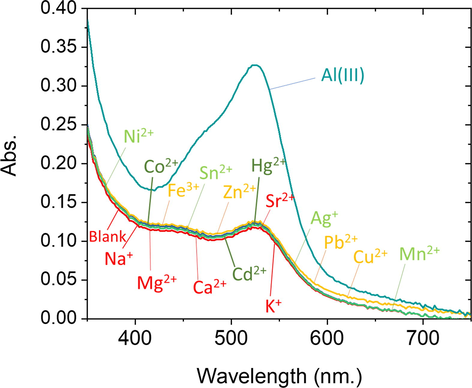
The absorption spectra of 10 mL solution containing 20 mg ATA sensor and Al3+ (0.07 ppm), Fe3+ (10.0 ppm), Mg2+ (50.0 ppm), Ca2+ (50.0 ppm), Co2+ (50.0 ppm), Ag+ (0.07 ppm), Cd2+ (50.0 ppm), Ni2+ (50.0 ppm), Zn2+ (35.0 ppm), Pb2+ (30.0 ppm), Cu2+ (15.0 ppm), Hg2+ (40.0 ppm), Mn2+ (50.0 ppm), Sr2+ (40.0 ppm), Na+ (100.0 ppm), Sn2+ (50.0 ppm), or K+ (100.0 ppm) at pH 4 and after 60 s of contact. The experiments are performed at 25 °C.
Foreign cations’ tolerance limit (ppm)
Fe3+*
Mg2+
Ca2+
Co2+
Ag+
Cd2+
Ni2+
Zn2+
Pb2+
Cu2+**
Hg2+
Mn2+
Sr2+
Na+
Sn2+
K+
10
50
50
50
50
50
50
35
30
15
40
50
40
100
50
100
3.5 Adsorption capacity
The adsorption is always important due to the practical use in large-scale. To estimate the adsorption capacity of the ATA sensor, a batch method was applied. 20 mg ATA solid sensor was added to 50 mL solution containing of 50 ppm of Al(III) ions at pH 4.0. The mixtures were shaken for 15 min, then filtered off and, the remained Al(III) ions in supernatant solution measured by ICP-MS. The adsorption capability was 117.17 mg of Al(III) ions per gram of the ATA sensor.
The influence of the different concentrations of the Al(III) ions on the adsorption capability were also studied (Fig. 10). The Al(III) ion concentrations were varied from 0.1 to 30 ppm. In addition, the ATA sensor amount was fixed at 20 mg, and the solution pH was 4.0. The maximum adsorbed amount of Al(III) ions can be estimated by the Langmuir adsorption isotherm model as was expected from other resemble materials (Shahat et al., 2015; El-Sewify et al., 2018; El-Sewify et al., 2018; Abou-Melha et al., 2021). So, the Langmuir isotherm equation was used to evaluate the adsorbed amount of the Al(III) ions on the ATA sensor at constant temperature (Langmuir, 1918):
where Ce is the concentration of the Al(III) ion at equilibrium (ppm), qe is the quantity adsorbed to the equilibrium ATA sensor (mg/g), qm is the quantity of Al(III) target ion adsorbed to procedure a monolayer (mg/g) coverage, and KL is the equilibrium constant of Langmuir adsorption. The straight line gotten from plotting Ce/qe with Ce of this adsorption experiment confirmed the formation of mono-layer of Al(III) ions coverage the ATA sensor surface (Fig. 10 (inset)). The slope and intercept of the Langmuir linear areas have been used to compute the effective adsorption capability (qm) and the Langmuir coverage constant (KL). The linear adsorption curve demonstrates that it is important to collect a wide range of Al(III) ion concentrations. The isotherm of Langmuir adsorption describes the attempts of adsorption against Al(III) analyte, as shown by a linear graph with a score of 0.988 for the ATA sensor curve. The maximum adsorption capacity was as high as 118.53 mg/g and this was because of the high surface area of the ATA sensor as well as abundant active functional sites.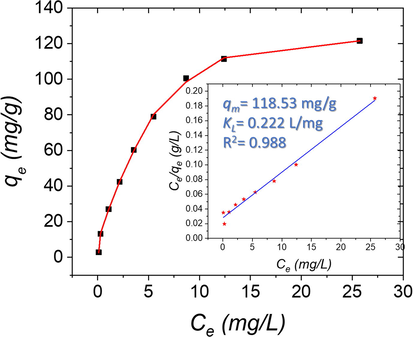
Langmuir adsorption isotherms for Al(III) ions adsorption onto the ATA sensor. The insets display the linear formula of the Langmuir isotherm model at pH = 4.0 and shaken at 25 °C.
4 Application
The reliability of ATA sensor was checked by applying Univar and PLS-1 analysis on the proposed method to estimate Al(III) in real water samples. The precision and accuracy of this ATA sensor for detecting traces of Al(III) ions was evaluated by the mean relative standard deviation (RSD). As seen in Table 4, the relative recovery (RR) was used to illustrate the precision of data collected by the ATA sensor.
Samples
Added (ppb)
Univar
PLS-1
Reference method (ICP-MS) ± SDa (ppb)
Found ± SDa (ppb)
(RSD%)
RR (%)b
Found ± SDa (ppb)
(RSD%)
RR (%)
Tap water
–
25
5010.48 ± 1.36
34.09 ± 1.25
58.98 ± 1.356.04
1.71
1.07–
94
9710.01 ± 0.76
34.50 ± 0.44
58.31 ± 0.337.59
1.27
0.56–
98
9710.25 ± 1.06
34.30 ± 0.85
58.65 ± 0.85
Mineral water
–
25
503.94 ± 0.66
30.53 ± 0.58
53.97 ± 0.6116.81
1.91
1.13–
105
1004.09 ± 0.58
29.50 ± 0.44
53.78 ± 0.7611.79
1.02
1.70–
97
984.24 ± 0.50
28.54 ± 0.29
53.40 ± 0.91
River water
–
25
5012.66 ± 0.62
36.02 ± 0.59
61.16 ± 0.644.94
1.62
1.05–
93
9712.70 ± 0.20
36.87 ± 0.78
61.11 ± 0.111.57
2.11
0.18–
98
9712.68 ± 0.42
36.44 ± 0.68
61.14 ± 0.37
Well water
–
25
5013.31 ± 0.26
36.91 ± 0.75
61.93 ± 0.464.68
1.58
1.04–
94
9713.55 ± 0.46
37.01 ± 0.78
62.46 ± 0.414.70
2.15
0.58–
96
9913.80 ± 0.65
37.12 ± 0.81
63.0 ± 0.37
Sea Water
–
25
5019.85 ± 0.60
46.53 ± 0.59
69.12 ± 0.673.04
1.28
0.98–
106
9918.30 ± 0.71
42.50 ± 0.24
66.98 ± 0.293.87
0.56
0.51–
98
9719.07 ± 0.65
44.51 ± 0.42
68.05 ± 0.48
RMSEc (ppb)
1.30
REPd %
3.73
The data aggregated with the ATA sensor for the detection of Al(III) ions in real samples will endorse our assumption that, this proposed method is dependably extended to the trace monitoring of Al(III) ions in real samples with high selectivity and sensitivity. It is preferable to examine the elliptical joint confidence region (EJCR) for each slope and intercept (Kamel et al., 2021). As shown in Fig. 11, the ellipses for the Al(III) analyte include the theoretically expected values of (1, 0), showing that the proposed method is accurate.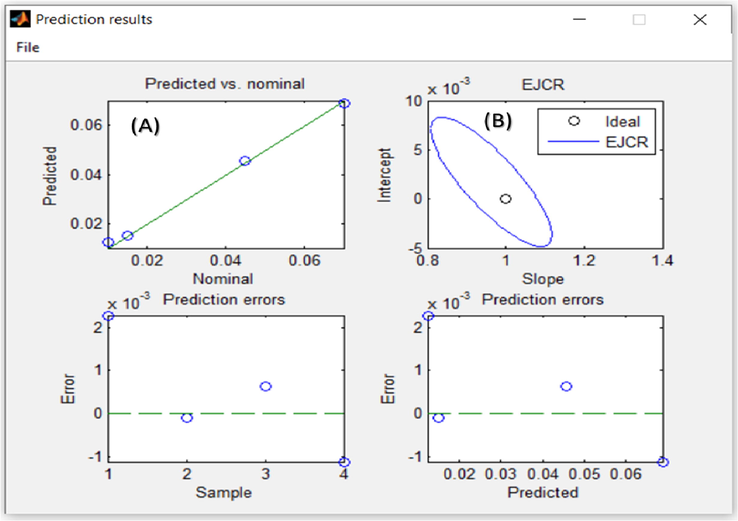
(A) The Al(III) concentrations predicted by the spectrophotometric/PLS method are based on the corresponding nominal values. (B) Elliptical joint area (at 95% confidence level) for the slope and intercept of the least-square weighted data regression shown in the plot (A).
5 Conclusions
A laboratory experiment was conducted to provide a spectrophotometric technique for the determination of Al(III) ions in multiple samples of different water. The proposed method was conducted based upon the preparation of mesoporous silica nanospheres and using it as a scaffold. Direct immobilization of aurintricarboxylic acid reagent into the mesoporous silica nanospheres was done to shape a unique and novel solid sensor. Experimental studies have been done to detect the optimum conditions for the identification process of Al(III) ions by ATA sensor. Al(III)-ATA red-complex has been formed at pH 4.0 and spectrophotometrically measured at 525 nm. Moreover, the complexation was reversible, and the ATA sensor retained his functionality even after six-time reuse/cycles using EDTA as eluent. Univariate and multivariate (partial least squares 1, PLS-1) calibration techniques were utilized for calculating the figures of merit for the Al(III) ions determination. The obtained calibration curve was linear from 2.0 to 70 ppb Al(III) ions concentration. The developed method has a detection limit of 3.5 ppb. In addition, the ATA sensor showed high adsorption capacity value (118.53 mg/g) which gives it a great advantage to be applicable as nanocollector for trapping Al(III) ions. The novel ATA sensor showed high degree of selectivity, sensitivity, reproducibility, and stability. The current study explores the effectiveness of the ATA sensor for the first time to produce a green solid sensor to determine the trace amount of Al(III) in diverse water types; tap, mineral, river, well, and sea water.
Declaration of Competing Interest
The authors declare that they have no known competing financial interests or personal relationships that could have appeared to influence the work reported in this paper.
Reference
- Functionalized silica nanotubes with azo-chromophore for enhanced Pd2+ and Co2+ ions monitoring in E-wastes. J. Mol. Liq.. 2021;329:115585.
- [CrossRef] [Google Scholar]
- Spectrophotometric determination of aluminium by morin. Talanta. 1995;42:1135-1142.
- [CrossRef] [Google Scholar]
- Mesopores silica nanotubes-based sensors for the highly selective and rapid detection of Fe2+ ions in wastewater, boiler system units and biological samples. Anal. Chim. Acta. 2021;1180:338860.
- [CrossRef] [Google Scholar]
- Functionalized novel mesoporous adsorbent for selective lead(II) ions monitoring and removal from wastewater. Sens. Actuators B Chem.. 2014;203:854-863.
- [CrossRef] [Google Scholar]
- Investigation of ligand immobilized nano-composite adsorbent for efficient cerium(III) detection and recovery Chem. Eng. J.. 2015;265:210-218.
- [CrossRef] [Google Scholar]
- Aluminon: its limited application as a reagent for the detection of aluminum species. J. Histochem. Cytochem.. 1985;33(7):729-732.
- [CrossRef] [Google Scholar]
- Voltammetric determination of aluminium(III) using a chemically modified electrode. Anal. Chim. Acta. 1991;251(1-2):157-163.
- [CrossRef] [Google Scholar]
- Mesoporous hexagonal and cubic aluminosilica adsorbents for toxic nitroanilines from water. Environ. Sci. Pollut. Res.. 2013;20(6):3863-3876.
- [CrossRef] [Google Scholar]
- Ratiometric fluorescent chemosensor for Zn2+ ions in environmental samples using supermicroporous organic-inorganic structures as potential platforms. Chem. Sel.. 2017;2(34):11083-11090.
- [CrossRef] [Google Scholar]
- Sensitive and selective fluorometric determination and monitoring of Zn2+ ions using supermicroporous Zr-MOFs chemosensors. Microchem. J.. 2018;139:24-33.
- [CrossRef] [Google Scholar]
- Dual colorimetric and fluorometric monitoring of Bi3+ ions in water using supermicroporous Zr-MOFs chemosensors. J. Lumin.. 2018;198:438-448.
- [CrossRef] [Google Scholar]
- Metal toxicity links to Alzheimer’s disease and neuroinflammation. J. Mol. Biol.. 2019;431(9):1843-1868.
- [CrossRef] [Google Scholar]
- Spectrophotometric determination of aluminium and indium with 2,2,3,4-tetrahydroxy-3,5-disulphoazobenzene. J. Hazard. Mater.. 2009;163(2-3):1001-1007.
- [CrossRef] [Google Scholar]
- A novel sensitive and selective chemosensor for fluorescent detection of Zn2+ in cosmetics creams based on covalent post functionalized Al-MOF. New J. Chem.. 2021;45(18):8054-8063.
- [CrossRef] [Google Scholar]
- Ordered mesoporous molecular sieves synthesized by a liquid-crystal template mechanism. Nature. 1992;359:710-712.
- [CrossRef] [Google Scholar]
- The adsorption of gases on plane surfaces of glass, mica and platinum. J. Am. Chem. Soc.. 1918;40:1361-1403.
- [CrossRef] [Google Scholar]
- Human health effects of metals in drinking water: relationship to cultural acidification. Environ. Toxicol. Chem.. 1990;9(7):887-894.
- [CrossRef] [Google Scholar]
- Reverse flow injection spectrophotometric for determination of aluminium(III) Talanta. 2010;82(1):202-207.
- [CrossRef] [Google Scholar]
- A.C. Olivieri, Principal component analysis, in: Introduction to Multivariate Calibration: A Practical Approach, Springer International Publishing, Cham, Switzerland, 2018.
- Multi-Use Al-MOF chemosensors for visual detection and removal of mercury ions in water, and skin whitening cosmetics. ACS Sustainable Chem. Eng.. 2020;8(40):15097-15107.
- [CrossRef] [Google Scholar]
- The aurintricarboxylates of aluminum, iron and chromium composition, structure and analytical use a heterometric study. Anal. Chim. Acta. 1965;14:344-356.
- [CrossRef] [Google Scholar]
- Flow injection spectrophotometric determination of Al in hemodialysis solutions. J. Pharm. Biomed. Anal.. 2005;36(5):1119-1123.
- [CrossRef] [Google Scholar]
- Application of a new functionalized magnetic graphane oxide for aluminumdetermination at trace levels in honey samples by the zetasizer system. Microchem. J.. 2020;157:104962.
- [CrossRef] [Google Scholar]
- A new automated system for the determination of Al(III) species in dialysis concentrates by electrothermal atomic absorption spectrometry using a combination of chelating resin. Microchem. J.. 2015;122:57-62.
- [CrossRef] [Google Scholar]
- Colorimetric determination of some toxic metal ions in post-mortem biological samples. Sens. Actuators B Chem.. 2015;221:1027-1034.
- [CrossRef] [Google Scholar]
- Large-pore diameter nano-adsorbent and its application for rapid lead(II) detection and removal from aqueous media. Chem. Eng. J.. 2015;273:286-295.
- [CrossRef] [Google Scholar]
- Novel and potential chemical sensors for Au(III) ion detection and recovery in electric waste samples. Microchem. J.. 2020;158:105312
- [CrossRef] [Google Scholar]
- Sensitive, selective, and rapid method for optical recognition of ultra-traces level of Hg(II), Ag(I), Au(III), and Pd(II) in electronic wastes. Sens. Actuators, B. 2017;245:789-802.
- [CrossRef] [Google Scholar]
- Optical recognition and removal of Hg (II) using a new self-chemosensor based on a modified amino-functionalized Al-MOF. Sens. Actuators B Chem.. 2017;253:164-172.
- [CrossRef] [Google Scholar]
- Selective and sensitive spectrophotometric method for determination of sub-micro-molar amounts of aluminium ion. J. Hazard. Mater.. 2008;151(2-3):642-648.
- [CrossRef] [Google Scholar]
- The Environmental Chemistry of Aluminum (second ed.). Boca Ratoiŕ: CRC Press; 1995.
- Determination of aluminum in natural water samples. Anal. Chim. Acta. 2007;588:153-165.
- [CrossRef] [Google Scholar]
- Determination of aluminum in natural water samples. Analytica Chimica Acta. 2007;588:153-165.
- [CrossRef] [Google Scholar]
- Chemosensors Principles, Strategies, and Applications. John Wiley & Sons; 2011.
- WHO, Guidelines for drinking-water quality: aluminium in drinking water, World Health Organization, Geneva, 1998.
- The determination of aluminum in plants. I. A study of the use of aurintricarboxylic acid for the colorimetric determination of aluminum. J. Am. Chem. Soc.. 1929;51:2721-2726.
- [CrossRef] [Google Scholar]
- Synthesis, characterization and application of a new fluorescence reagent for the determination of aluminum in food samples. Food Chem.. 2017;237:942-947.
- [CrossRef] [Google Scholar]
- Determination of picomole concentrations of aluminum (III) in human saliva and urine by a luminol-carboxymethyl chitosan chemiluminescence system. Instrum. Sci. Technol.. 2013;41(5):524-534.
- [CrossRef] [Google Scholar]
- Spectrophotometric determination of aluminium in pharmaceutical preparations by azo dyes of 1,2,4-triazole series. Pharm. Acta Helv.. 2000;74(4):361-364.
- [CrossRef] [Google Scholar]


