

Translate this page into:
Efficacy assessment of natural zeolite containing wastewater on the adsorption behaviour of Direct Yellow 50 from; equilibrium, kinetics and thermodynamic studies
-
Received: ,
Accepted: ,
This article was originally published by Elsevier and was migrated to Scientific Scholar after the change of Publisher.
Abstract
DY50 was removal from wastewater by utilizing the natural zeolite. The adsorption capacity is determined at different operation parameters. The removal rate of DY50 was estimated to be 58.63% for a Zeolite sample.
Abstract
This study aimed to evaluate an efficient method in order to remove Direct Yellow 50 (DY50) dye from aqueous solutions using natural zeolite in a batch system. The results indicated that the removal of DY50 was highly subjective to the pH of the aqueous solution, initial concentration of DY50, adsorbent dosage, temperature, and contact time. The research data was then tailored isothermally to the Freundlich and Langmuir isotherms, and the kinematic results were interrelated to the pseudo-first and second-order models. The removal rate of DY50 was calculated to be 58.63% for a zeolite sample of 0.05 g and 40 mg L−1 as a preliminary dye concentration with 4 hrs of contact time. The description of the adsorptive behaviour of the natural zeolite was presented through a kinetic model of the pseudo-second-order. The change in enthalpy (ΔH), free energy (ΔG), and entropy (ΔS) were also investigated as thermodynamic parameters. The results of this study supported the theory that the initial concentration of DY50, pH of solution, adsorbent mass, contact time, and temperature, greatly affected the adsorption of DY50 on zeolite.
Keywords
Adsorption
Zeolite
Direct Yellow 50 (DY50) dye
Adsorption isotherm
Wastewater treatment

1 Introduction
Water pollution is a highly significant issue in most developing and underdeveloped countries. Recycling the available water resources is depicted to be crucial. The effective treatment of wastewater is vital for society to reduce costs associated with health problems by polluted water.
Among the environmental elements, water is considered to be the most exposed to contamination. This is mostly due to the mixing of liquid wastes within the various natural water bodies. Contributing towards the polluting of various water resources, different industries such as paper, textile, leather and paint factories are observed to be the major players in enhancing the level of pollution as a whole. The leather industry, being the sector utilizing dyes in highest quantities, reportedly produces great quantities of dye-polluted wastewater, comprising of varying chemical compositions (Bulgariu et al., 2019; Al-Abbad and Alakhras, 2020). The compositional elements depend upon various factors, such as the form of the coloured raw material (fabric) and dyes, the methods used for dyeing, and the quantity of dyes used. The amount of dyes in these industries are not the only contaminants found in the waste water released by these industries. Auxiliaries – such as alkalis, acids, salts and surfactants – as well as other impurities – such as waxes, dextrin, fats and bleaches – are also included in the composition. These act as contributors for the build-up of various toxins within the water, making it polluted and unusable (Gong et al., 2010).
“Direct dyes” are considered among the most common colorant types, utilized for the printing and dyeing of cellulosic fibres and similar mixtures. Direct dye is an umbrella term, including those colorants that do not require any fixing or precursory preparations before use, and are mostly azo dyes, similar to acid dyes. Structurally, the dis-azo and tri-azo molecular arrangements are mostly prevalent in the case of direct dyes, with a high dominance of non-metallized orientations for each hue individually (Bauer and Ritter, 1993). These types of dyes are commonly utilized within many industries as primary colorants due to the ease of application that they provide, as well as the wide variety of cost effective and easily available products. Thus, direct dyes are extensively used in different industries in recent times as well (Derudi et al., 2007; Mo et al., 2008).
Zeolites are natural or synthetic hydrated aluminosilicate minerals, commonly possessing a polyhedral 3-D structure based on [SiO]4− and [AlO]5− complexes. These compounds possess a distinctive structure and unique characteristics which allows effective adsorption of a different types of environmental contaminants (Alakhras et al., 2020). The wide and deep pore openings of these minerals enable them to eradicate numerous impurities from different mediums. Zeolite also has a large surface area (20–50 m2/g for natural species), which is a crucial characteristic for adsorbents. Furthermore, naturally occurring zeolites are categorized by low mining cost and availability, resistance to alteration, and bulk density (Mercer and Ames, 1978). For most zeolites, the intra-crystalline voids make up about 20–50% of the total crystal volume (Breck, 1974).
A large quantity of zeolites tends to have an affinity towards ammonium ions (Cooney et al., 1999). Furthermore, the integrity of their molecular structure is maintained even when they lose bound water molecules. Compared to other natural minerals, zeolites also offer good cation exchange properties, allowing their use as cation exchangers (Wang and Peng, 2010). Exploring this aspect, zeolites have been observed to portray effective selectivity for cations of heavy metals, depicting them as valuable anti-pollutants to be utilized for the decontamination of wastewater produced from industries (Colella, 1996; Ibrahim, 2002; Bedelean et al., 2010). Having high adsorption properties, zeolites are also considered to be hydrophilic, generally containing traces of aluminium (Chen et al., 2015). This is due to their wider pore openings on a uniform level throughout their microstructure, as well as homogeneously sized cages and channel systems, enabling zeolites to adsorb foreign substances easily (McCuster and Baerlocher, 2001). Due to these characteristics, zeolites have been recently utilized for applications where adsorbents are required, specifically in the purification and/or separation processes (Wang and Peng, 2010). Overall, zeolites possess highly applicable and fascinating characteristics for example, their affinity to water molecules, adsorptive capacities, catalytic properties, ion-exchanging power, and selectivity in the case of shape – most of which are fundamentally depicted by the structure of the minerals (McCuster and Baerlocher, 2001).
In this paper, we study and conduct an assessment of natural zeolite (NZ), which is obtained from Jordan, for its potential properties as an effective adsorbent for Direct Yellow 50. Batch adsorption techniques for diverse investigative conditions of pH, initial concentrations, contact time, temperature changes, and zeolite dosage are carried out and the examined outcomes are compared and discussed as well. The rationale of this study is the removal of DY50 from wastewater by utilizing the natural zeolite in a batch system and studying the effect of concentration of DY50, the pH of the aqueous solution, the contact time, adsorbent dosage and temperature on the efficacy of DY50 removal.
2 Materials and methods
Almost all chemicals were obtained from commercial sources and were utilized without further modification. DY50 dye was purchased from Merck. Orbital shaker (steady shake, 757), a UV-scanning spectrophotometer UVD-2950 (LABOMED, INC), and pH meter (Metrohm, 525A) were utilized for the test works. The collection of zeolite samples was done from Jordan, which then underwent characterization as per the techniques explained in the research conducted by (Taamneh and Al Dwairi, 2013). The grade of the zeolite samples was identified by means of the X-ray diffraction technique as suggested by the research analysts based upon their study conducted in (Ibrahim and Inglethorpe, 1996). The samples were evaluated based on their physical properties, comprising of acid solubility and attrition resistance test as explained in the research paper by (Ibrahim and Inglethorpe, 1996). The determination of the cation exchange capacity (CEC) was also conducted following the methods utilized by Mercer and Ames in their research in 1978 (Mercer and Ames, 1978).
2.1 Preparation and characterization of zeolite (NZ) tuff
Zeolite tuff is Chabazite as major and Phillipsite as minor minerals (Al Dwairi, 2014). The grain fraction size for this study was selected to be 0.3–1 mm, as the mineral grain size in this range displays the maximum zeolite grade of about 50–65%, as well as appropriate physical characteristics, as depicted in Table 1 (Ibrahim and Inglethorpe, 1996). The spectra of the samples were also characterized using an IRAFFINTT-2 as the Fourier Transform Infrared (FTIR) equipment, with 500–4000 cm−1 as the scan range. The X-Ray Diffraction (XRD) analysis of the powdered specimen were performed by means of the SHIMADZO (XRD-7000), using Cu as target, 40 kV, 30 mA, scan range 5–60° and scan speed of 2 deg/min. Furthermore, SEM (FEI, Inspect S50, Czech Republic) was used before and after absorption tests, operated at accelerating voltage of 20 kV, and micrographs at different magnifications were captured. BET surface area analyzer was used for surface area & pore size analysis, (NOVA 1200 e), using N2 as analysis gas, bath temperature 273 K and analysis time 130.5 min.
Zeolite minerals
NZ
Phillipsite
chabazite
Total Zeolite grade (wt%)
40a
50a
Chemical analysis (wt%)
SiO2
40.35
39.41
Al2O3
10.67
12.32
Fe2O3
12.75
8.75
MgO
7.54
4.23
CaO
11.28
8.52
Na2O
5.86
4.99
K2O
3.05
3.33
TiO2
2.81
1.27
LOI
5.74
16.31
Total
100.05
99.13
Attrition resistance (wt%)
5.5
4.5
Packed-bed density(g/cm3)
1.0
1.0
CEC (meq/g)
2.3
2.2
2.1.1 Preparation of DY50 dye solution
Without any additional purification, the stock of DY50 powder (of the chemical formula C35H24N6Na4O13S4) was taken as a standard solution (water soluble azo-dye, anionic), which was prepared through the dissolution of the required mass of DY50 powder in purified water. The structure of the DY50 powder sample is presented in (Fig. 1). Solutions with other required dye concentrations (1, 3, 5, 7, 10, 15, 20 and 30 ppm) were prepared using serial dilution. These different concentrations were taken in order to procure a calibrated adsorption vs concentration curve, at a pre-set wavelength of λ = 412 nm. The exact concentrations of unknown dye solutions were thus determined through this calibration curve.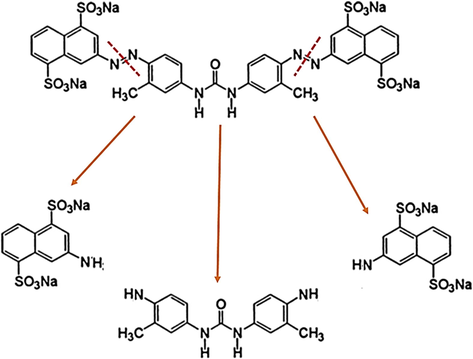
Structure and the breaking routes of Direct Yellow 50 dye.
2.2 Adsorption of DY50 dye solution onto zeolite materials
The batch equilibrium reaction was utilized in order to examine the removal of the dye. First, the DY50 solution (25.0 ml) was placed in a 100-ml container and suspended with a sorbent of 0.05 g for 3 h at 30 °C. The pH was adjusted to the 3.0–10.0 range, taking 1.0 M NaOH and1.0 M HCl. The same process was followed using different intervals (5, 10, 20, 30, 60, 120, 240, 480, and 1440 min) in order to assess the influence on the dye removal due to contact time. Furthermore, the same experiments were conducted at various concentrations for the DY50 dye (20, 30, 40, 50, 70, 100 and 150 mg.L−1) and temperatures (20 °C, 30 °C, 50 °C, and 70 °C). Investigation of the effect of the zeolite amount was also conducted using the dry adsorbent of different weights (0.01, 0.05, 0.1, 0.2, and 1.0 g). Subsequently, filtration of all samples was done and the residual DY50 quantity was measured via UV–Vis spectroscopy (λ 300–800 nm). The absorbance data were taken at maximum absorbance λ.
In an equilibrium condition, the adsorbed amount of the DY50 ions, denoted by “Qe”, was evaluated according to Eq. (1):
Through the adsorption experimentations, the amount of the DY50 filtered and removed at multiple interludes was evaluated using Eq. (2):
3 Results and discussion
3.1 Characterization of zeolite (NZ) samples
NZ commonly exhibits a significantly high content of CaO, up to 11.51%. Such a high level of CaO content depicts a presence of secondary calcite within the samples. The samples of the size fractions 0.3–1 mm have been taken in bulk, containing abundant pyroxene, sideromelane and olivine. These phases are rich in Magnesium (Mg) and Iron (Fe), possessing no, or minimal, LOI percentage (Al Dwairi, 2014). Using the Atomic Absorption Spectrometer, the chemical composition of the rock samples for this study was determined, and the pH was calculated to be 6.6. The main zeolitic tuff minerals in the adsorbent were found to be phillipsite and chabazite through characterization.
3.1.1 BET analysis of zeolite samples
The Brunauer–Emmett–Teller (BET) test explains the process of the adsorption of gas molecules on to a solid surface on a physical scale, serving as the foundation for measuring the specific surface area (SSA) of various sample materials. The specific surface area and pore size of zeolite samples were determined using the N2 adsorption-desorption isotherms.
In this manner, the samples were investigated in order to calculate the rate of adsorption, which consequently provided information on the rate of desorption for zeolite as well. These adsorption-desorption rates were utilized to depict the pore size of the samples, as well as their surface area on which the adsorption-desorption processes occurred (Aysan et al., 2016). Thus, the specific surface area (SSA) for the samples were calculated to be equal to 219.575 m2/g, and pore size was found to be 1.3749 nm. The microporous size is d < 2 nm; therefore, the zeolite tuff exploited in this study can be considered as microporous material (Kuila and Prasad, 2013).
3.1.2 FTIR analysis of zeolite samples
The FTIR testing was conducted on the zeolite samples in order to probe and study the structure of the specimen by monitoring the induced reactions within the zeolitic pores. The vibrational frequencies thus registered within the zeolitic lattice were then scrutinized for the procurement of structural information for the zeolite samples (Bordiga et al., 1992).
The FTIR spectrum of the zeolite samples supported the typical IR spectrum of naturally occurring specimen, where strong peaks were present in the typical range of the natural zeolite, as shown in (Fig. 2). The O–H found in the mineral: lattice termination silanol groups, O–H groups at defect sites, O–H groups attached to cations, O–H stretching vibration, obtained as a result of the intermolecular hydrogen bonding (Ruíz-Baltazar et al., 2015), appeared at 3400–3600 cm−1.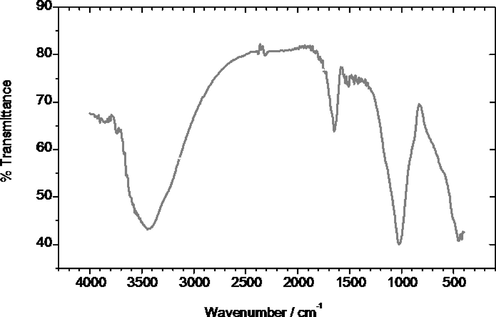
Infrared spectra FTIR of natural zeolite.
This depicts the structural composition and contribution of the hydroxyl groups attached to the base zeolitic structure, which are considered to be an essential component of the zeolite mineral (Mozgawa, 2000). Overall, a minimum of five hydroxyl groups could be groups connected to the extra framework aluminium (EFAL), and the H-form zeolite Y for the abridgement of the hydroxyl groups with Bronsted acidity (Mozgawa, 2000). The IR spectra also presents information on the acidity states, concentrations, and accessibility of the functional groups connected in the structural chain of zeolite. Furthermore, the catalytic properties – through the phenomenon of adsorption of probe molecules–could also be explored and estimated through the IR spectra generated for the zeolite samples (Li, 2005).
In this manner, the FTIR of the zeolite samples provided extensive data on the chemical as well as physical aspects regarding the structural composition of the material (Bordiga et al., 1992). It was found that due to M–OH and H2O, [TO4] structure is represented by the O–T–O asymmetric stretching vibrations occurring at 1025 cm−1 (T = Si or Al) (Dimowa et al., 2018). Furthermore, the band at 1650 cm−1 represented the bending vibration of H2O molecules present in the zeolite channels (Mohapatra et al., 2011).
3.1.3 XRD analysis of zeolite samples
X-Ray Diffraction (XRD) is a highly efficient analysis method essentially utilized for the identification of the phases of samples crystalline in nature, providing information regarding the unit cell dimensions and relevant molecular properties.
The XRD test showed in Fig. 3 that constituents in NZ samples were majorly chabazite and minorly phillipsite as minerals (Seliman and Borai, 2011). Chabazite was observed as grouped rhombohedral crystals, displaying a “pseudo-cubic” tendency. Contrastingly, phillipsite was observed to exist as a spherulitic and prismatic crystal within the pores (Ozpinar et al., 2013). The XRD pattern of the zeolite sample further displayed typical reflection intensity, with four diffraction peaks at 2θ, which can be attributed to chabazite, these are depicted to be 35, 40, 48 and 60, as per the graph generated.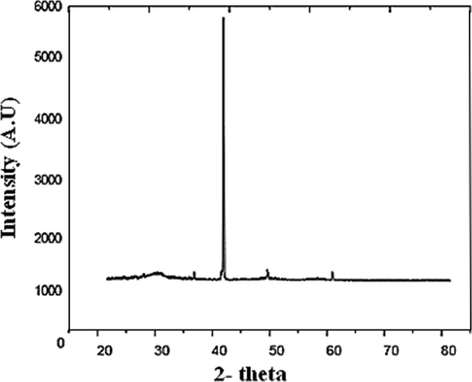
The measured qualitative XRD mineralogical composition of NZ tuff.
3.1.4 SEM image analysis of zeolite samples
Scanning Electron Microscope (SEM) produces microstructural images of different samples through the process of exposing them to electron beams of varying frequencies and wavelength as per the requirements and the material of the sample. Thus, the sample is scanned by means of the incident and focused electron beam, which, in turn interacts with the sample structure, emitting secondary electrons. These are then collected within the microscope as signals, carrying the structural information of the samples, which are then interpreted into images (Goldstein et al., 2017).
The morphology of the surface for zeolite samples was analysed by SEM (FEI, Inspect S50, Czech Republic) before and after adsorption tests. SEM was operated at accelerating voltage of 20 kV, and micrographs at different magnifications were captured. The images were then used to describe the topology and morphology of the surface of zeolite. SEM shows, in (Fig. 4(a) and (b)), that the surface of the zeolite sample was exhibiting either rough or micro/mesoporous morphology with a number of cracks, suggesting the higher surface area which is beneficial for adsorption of materials. A number of fragments or loosely attached particulates were observed as the initial structure of the zeolite samples, consisting of different componential minerals, mainly chabazite and phillipsite (Pandiangan et al., 2017). After adsorption, the morphology of the loaded zeolite sample was observed to have slightly changed from a rough, disjointed and cracked particulate structure, to a smoother and a conjoined solid surface with comparatively fewer cracks, indicating the filling of porous areas by the adsorbed materials. In fact surface area, pore size and porosity of zeolite are critical properties in the fields of catalysis, separation, gas and energy storage, batteries, and many others. Detailed insights into the pore architecture are particularly important because they control transport phenomena and diffusional rates and govern selectivity in catalyzed reactions.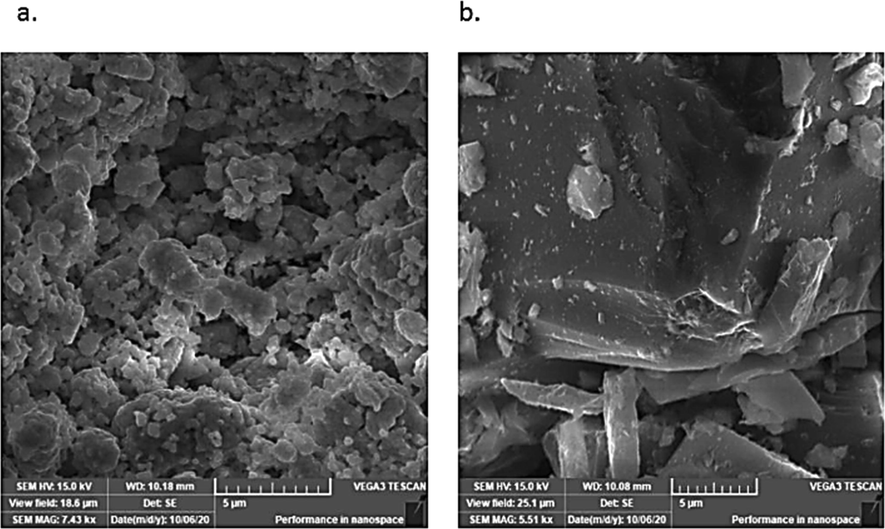
Scanning electron micrograph of zeolite (a) before adsorption and (b) after adsorption.
3.2 Effect of pH on DY50 removal
The influence of the solution pH on to the adsorption rate and level of the DY50 dye, between 3.0 up to 10.0 is illustrated in (Fig. 5). This value of the DY50 solution impacts the surface charge of the adsorbent and the dissociative processes within the functional groups at the active sites of the sample material, consequently impacting the chemistry of the DY50 solution, playing an imperative role in the overall adsorption process (Khraisheh et al., 2004). It was observed that the amount of the adsorbed DY50 by zeolite decreased with an increasing pH. The highest DY50 removal (58.63%) was recorded at pH 3.0 with a zeolite mass of 0.05 g. The pHpzc for zeolite is 6.6, these results indicate the negative charge on the sample surface at pH > pHpzc, and positive charge in pH < pHpzc. It is only right to experiment the adsorption studies at pH lower than 6.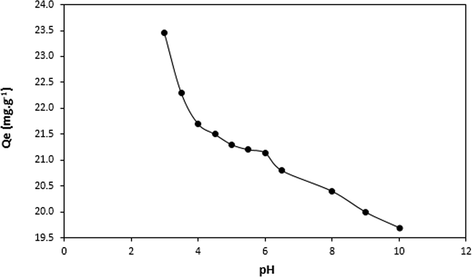
Effect of pH on removal of DY50 by Zeolite (DY = 40 ppm, T = 30 °C, W = 0.05 g and t = 4 h).
3.3 Influence of DY50 concentration and isothermal study
The impact of the DY50 concentration on the adsorption process at pH 3.0 and at 30 °C is shown in (Fig. 6). The figure represents that the initial DY50 concentration has a direct relationship with the adsorptive capacity of the dye onto zeolite. Through observation, it has been depicted that an increase in the former will lead to an increase in the latter as well. In this manner, it has been identified that the adsorptive power of the dye could be manipulated by controlling the initial quantity of the dye used. The adsorption of DY50 onto zeolite was thus investigated with the help of a linearly established plot of the Temkin, Langmuir, and Freundlich isotherm simulations. The current study demonstrated the distribution method of the adsorbed molecules in the equilibrium state between both the solid and liquid phases, which is referred to as isothermal adsorption.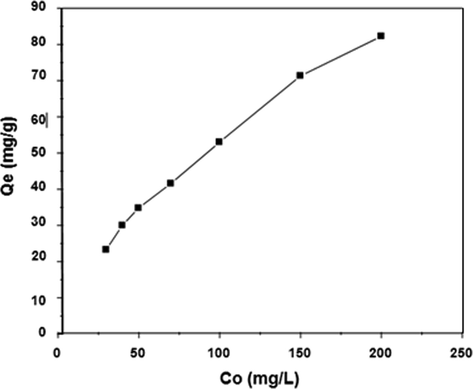
Influence of initial concentration of DY50 on to the equilibrium adsorption capacity of Zeolite (W = 0.05 g, pH = 3, T = 30 °C, t = 4 h).
The Langmuir isotherm model is described by Eq. (3):
The coefficients of the Langmuir adsorption model were Q0 and KL, which are related to the adsorption capacity (mg/g) and energy of the adsorption (L/mg), respectively.
Furthermore, RL, a dimensional constant separation factor was used to express those basic properties of the Langmuir isotherm model and was defined as Eq. (4):
The isotherm can be evaluated based on the value of RL, where the isotherm is linear if RL = 1, the isotherm is unfavorable if RL > 1, while either (0 < RL < 1) is favorable or (RL = 0) is irreversible.
The Freundlich model, which is satisfactory at heterogeneous surfaces and low concentrations, is expressed by Eq. (5):
The constants of the Freundlich adsorption model are KF and n, which are related to the adsorption capacity (mg/g) and adsorption intensity, respectively. The slope and intercept of the linear plot log qe versus log Ce will thus be used to calculate all required parameters.
The influence of indirect adsorption/desorption reactions on the adsorption temperature will be depicted by the Temkin model, the hypothesis of which is built upon the fact that the process of adsorption decreases the adsorption heat of all molecules linearly. The isotherm thus generated from the Temkin model can be represented by Eq. (6):
A and b from the slope and the intercept of plot qe against plot ln Ce are shown in Table 2. The parameters R2 of the isotherms formed through the Temkin, Freundlich, and Langmuir models were 0.965, 0.99, and 0.952, respectively. Also, 83.333 mg/g was calculated to be the maximum removal capacity Q0, and the adsorption coefficient (KL) was 0.0434. The constant KF of the Freundlich isotherm, which reflects the adsorption capacity, was 9.594 mg/g. Also, the Temkin isotherm model was used for the assessment of the adsorption behaviour of the sample. The results from the application of this model proposed that the adsorption energy decreases due to an increase in the surface coverage by the DY50 ions. This was due to the binding energies being regularly distributed at a maximum. Thus, the adsorption process can be visualized based on this model. For this research, the favourable model was depicted to be the Freundlich isotherm, which most suited the equilibrium data across the adsorption isotherm (Ayawei et al., 2017).
Langmuir isotherm
Freundlich isotherm
Temkin isotherm
Q0 (mg g−1)
KL (L mg−1)
RL
R2
KF (mg g−1) (mg L−1)1/n
n
R2
B (J mol−1)
A (L g−1)
R2
83.333
0.0434
0.1869
0.965
9.594
2.2123
0.99
18.62
0.4859
0.952
Table 3. Shows the sorption capacity of zeolite sample for direct yellow removal was compared with various sorbent materials as reported previously. It is noted that the ability of zeolite toward removal DY is almost similar or even superior to another presented sorbents, demonstrating that sorbents synthesized in the current study have a great competence for the treatment of waste effluents.
Sorbents
Qo (mg.g−1)
Ref.
Zeolite
83.33
This study
sugarcane bagasse
65.8
(Sadaf et al., 2015)
resins of polyacrylic
50
(Wawrzkiewicz et al., 2020)
Cotton fiber
28.57
(Ismail et al., 2014)
3.4 Effect of sorbent dosage
Investigating the influence of the amount of the adsorbent is necessary to identify the minimal amount, which may provide adsorption at a maximum. Table 4 shows a change in the zeolite dose from 0.01 g to 0.3 g and its influence on the DY50 removal. According to Table 3, the lowest removal rate of DY50 (56.5%) was in 0.01 g of zeolite whereas 0.2 g and 0.3 g of zeolite showed a removal rate of 60.3% and 60.4%, respectively.
PH
W (g)
Qe (mg/g)
Removal (%)
3
0.01
113.00
56.5
0.025
45.64
57.5
0.05
23.26
58.1
0.1
11.98
59.9
0.2
6.03
60.3
0.3
4.03
60.4
Table 4 and (Fig. 7) revealed an escalation in the DY50 removal rate with arise in the zeolite dosage till it reached a peak where the removal rate was 60.4% at 0.3 g. This might be due to the rise of the availability of adsorption sites being more frequent and thus the adsorption surface. Notwithstanding the enhancement in the DY50 removal rate, a further increase in the adsorbent dosage did not affect the rate proportionally but caused an increase in the available adsorption sites. The possible aggregation or overlapping of the adsorption sites could be the causative for this phenomenon, ultimately leading to a rise in the length of the diffusion path.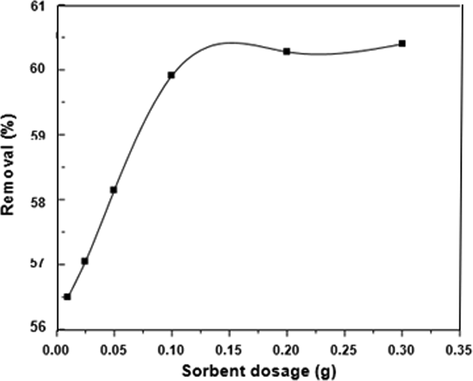
Effect of adsorbent dosage on percentage removal of DY by zeolite (DY = 40 ppm, pH = 3, T = 30 °C, t = 4 h).
3.5 Influence of adsorption time and kinetic analysis
Another variable that affects the adsorption process is the adsorption time, the kinetic analysis of which is shown in (Fig. 8). The kinetic data were processed via two adsorption patterns: the pseudo-first and second kinetic orders, as shown in Eq. (7) and Eq. (8), respectively. The models of the pseudo-first and second kinetic orders could better describe the adsorption of dye on different sorbents (Alabbad, 2019; Alakhras, 2019).
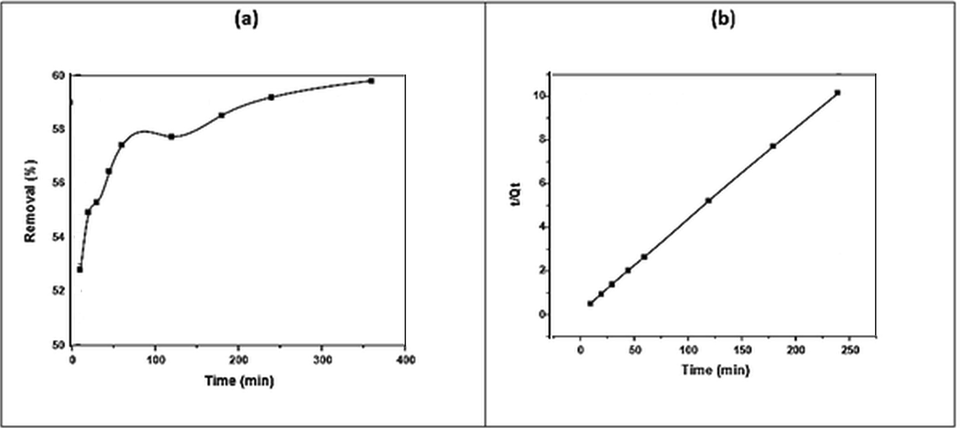
(a) Effect of contact time on DY50 removal by zeolite in (DY = 40 ppm, pH = 3, T = 30 °C, W = 0.05 g), (b) Pseudo-second-order kinetic model.
At DY50 dye concentrations of 97.19 mg/L, the equilibrium was reached at 180 min, reflecting the occupation of the remaining active sites on the adsorbent surface. Specifically, the (
) of the pseudo-second order (0.9999) was greater than the (
) of the pseudo-first order (0.9451) (Table 5).
(Qe)Exp
Pseudo-first-order
Pseudo-second-order
(mg g−1)
(Qe)Cal
K1
R12
(Qe)Cal
K2
R22
(mg g−1)
(min−1)
(mg g−1)
(g mg−1 min−1)
23.91
2.32
0.009212
0.9451
39.68
0.0166
0.9999
Having high adsorption properties, zeolites are often known to be hydrophilic, typically containing aluminium traces. This is due to their larger pore openings in their microstructure at a uniform level as well as homogeneously sized cages and channel structures, allowing zeolites to readily adsorb foreign substances(McCuster and Baerlocher, 2001).
In this study, the kinetic model of the pseudo-second order was dominant and, therefore, there was a direct adsorption rate control in the total kinetics of the adsorption. This was corroborated with the study conducted by (Wu et al., 2009).
3.6 Influence of temperature and thermodynamic investigation
The adsorption of DY50 by the zeolitic sample at pH = 3 and the influence of temperature on it, as well as the thermodynamic investigation, are all illustrated in (Fig. 9).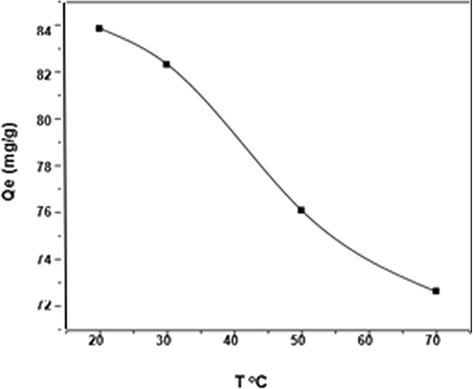
Effect of temperature on DY removal by zeolite (DY = 40 ppm, pH = 3, W = 0.05 g, t = 4 h).
In order to identify whether the adsorptive process is exothermic or endothermic, the evaluation for the thermodynamic functions was conducted within the dye-adsorbent structures. The changes observed in entropy (ΔS), enthalpy (ΔH), and free energy (ΔG) as parameters for thermodynamic property analysis is illustrated in Table 6. All values of ΔG were found to be negative suggesting the exothermic nature of DY50 adsorption onto zeolite. The change in entropy was positive, meaning that during adsorption, the entropy of the system increased. However, it should also be noted that, since the adsorption reaction was not an independent process, the entropy of the universe (including the system and the environment) could increase (Aljeboree et al., 2017). The negative value of ΔS is less in randomness at the solution/solid interface during the adsorption of the metal ions of the DY50 onto the zeolite samples. These parameters have been used to deduce the mechanism of adsorption (Li et al., 2010).
ΔH
ΔS
ΔG (Kjmol−1)
(Kjmol−1)
(J mol−1 K−1)
T = 20 °C
T = 30 °C
T = 50 °C
T = 70 °C
−11.814
−26.5123
−4.01317
−3.8751
−3.1088
−2.7837
Qe(mg.g−1)
83.84
82.3
76.08
72.62
4 Conclusion
The results of DY50 dye removal from water using zeolite showed a significant effect of the pH, initial DY50 concentration, adsorbent mass, contact time, and temperature on the DY50 adsorption on zeolite. DY50 dye adsorption onto the surface of zeolite is satisfactory was confirmed by the three isothermal models. DY50 adsorption capacity was high and sufficiently controlled via a chemisorption process followed the pseudo-second ordered kinetic model. The process of the dye removal is spontaneous and exothermic. The most suitable model from the three mentioned models was represented to be the Freundlich isotherm.
5 Consent for publication
Not applicable.
Acknowledgments
I give thanks to everyone who offered me support and encouragement throughout the study.
Declaration of Competing Interest
The author declares that there are no conflicts of interest regarding the publication of this paper.
References
- Removal of Dye Acid Red 1 from Aqueous Solutions Using Chitosan-iso-Vanillin Sorbent Material. Indo. J. Sci. Tech. 2020:5352-5365.
- [CrossRef] [Google Scholar]
- Estimation the Sorption Capacity of Chemically Modified Chitosan Toward Cadmium Ion in Wastewater Effluents. Orient. J. Chem.. 2019;35(2):757-765.
- [Google Scholar]
- Characterization of Pozzolana from Tafila area and its potential use as soil amendment for plant growth. Jordan J. Earth Environ. Sci.. 2014;6(3):35-40.
- [Google Scholar]
- Kinetics and diffusion analysis for the removal of cadmium ion from aqueous solutions using chitosan-iso-vanillin sorbent. Russian Journal of Physical Chemistry A. 2019;93:2628-2634.
- [CrossRef] [Google Scholar]
- A comparative study of photocatalytic degradation of Rhodamine B using natural-based zeolite composites. Surfaces and Interfaces. 2020;20:100611.
- [CrossRef] [Google Scholar]
- Kinetics and equilibrium study for the adsorption of textile dyes on coconut shell activated carbon. Arabian J. Chem.. 2017;10:S3381-S3393.
- [Google Scholar]
- Use of chabazite, a naturally abundant zeolite, for the investigation of the adsorption kinetics and mechanism of methylene blue dye. Micropor. Mesopor. Mater.. 2016;235:78-86.
- [Google Scholar]
- Bauer, W., Ritter, J., 1993. Tailoring dyes for ink-jet application. Chemistry of Functional dyes. Chapter 8.1, p649, Mita, Tolyo.
- Investigations on some zeolitic volcanic tuffs from Cluj County (Romania), used for zinc ions removal from aqueous solution. Studia UBB Geologia. 2010;55(1):9-15.
- [Google Scholar]
- Low temperature CO adsorption on Na-ZSM-5 zeolites: an FTIR investigation. J. Catal.. 1992;137(1):179-185.
- [Google Scholar]
- Zeolite molecular sieves: structure, chemistry and use. London: Wiley; 1974.
- The utilization of leaf-based adsorbents for dyes removal: A review. Journal of Molecular Liquids. 2019;276:728-747.
- [CrossRef] [Google Scholar]
- An insight into the removal of Pb(II), Cu(II), Co(II), Cd(II), Zn(II), Ag(I), Hg(I), Cr(VI) by Na(I)-montmorillonite and Ca(II)-montmorillonite. Appl. Clay Sci.. 2015;118:239-247.
- [Google Scholar]
- Ammonia removal from wastewaters using natural Australian zeolite. II. Pilot-scale study using continuous packed column process. Separat. Sci. Technol.. 1999;34(14):2741-2760.
- [Google Scholar]
- Biodegradation combined with ozone for the remediation of contaminated soils. Eur. J. Soil Biol.. 2007;43:297-303.
- [Google Scholar]
- Structural peculiarities of natural chabazite modified by ZnCl2 and NiCl2. Bulgarian Chem. Commun.. 2018;50(J):114-122.
- [Google Scholar]
- Scanning electron microscopy and X-ray microanalysis. Springer; 2017.
- Assessing heavy-metal contamination and sources by GIS-based approach and multivariate analysis of urban–rural top soils in Wuhan, central China. Environ. Geochem. Health. 2010;32(1):59-72.
- [Google Scholar]
- Mineral processing characteristics of natural zeolites from the Aritayn Formation of northeast Jordan. Miner. Deposita. 1996;31:589-596.
- [Google Scholar]
- Ibrahim, K. M., 2002. Application of Jordanian faujasite-phillipsite tuff in ammonium removal. In: Studies in Surface Science and Catalysis. Elsevier, 142, 1767–1773.
- Adsorption behaviour of direct yellow 50 onto cotton fiber: Equilibrium, kinetic and thermodynamic profile. Spectrochimica Acta Part A: Molecular and Biomolecular Spectroscopy. 2014;131:657-666.
- [CrossRef] [Google Scholar]
- Removal of Pb (II) from Aqueous Solutions by Zeolites, Porcelanite and Sands: Correlation of Morphology and Chemical Composition to Batch Removal Efficiency. Am. J. Analy. Chem.. 2015;6(04):297.
- [Google Scholar]
- The effect of pH, temperature, and molecular size on the removal of dyes from textile effluent using manganese oxides- modified diatomite. Water Environ. Res.. 2004;76(7):2655-2663.
- [Google Scholar]
- Specific surface area and pore< size distribution in clays and shales. Geophys. Prospect.. 2013;61(2):341-362.
- [Google Scholar]
- Arsenic adsorption onto iron oxide-coated cement (IOCC): regression analysis of equilibrium data with several isotherm models and their optimization. Chem. Eng. J.. 2006;122(1–2):93-106.
- [Google Scholar]
- Li, G., 2005. FT-IR studies of zeolite materials: Characterization and environmental applications [dissertation]. ProQuest Dissertations Publishing.
- Equilibrium, thermodynamics and process design to minimize adsorbent amount for the adsorption of acid dyes onto cationic polymer-loaded bentonite. Chem. Eng.. 2010;158(3):489-497.
- [Google Scholar]
- McCuster, L., Baerlocher, C., 2001. Zeolite structures. In: van Bekkum, H., Flanigen, E.M., Jacobs, A.A., Jansen, J.C. (Eds.), Introduction to zeolites sciences and practice, 2nd ed., Stud. Surf. Sci. Catal. 137, 37–69.
- Zeolite ion exchange in radioactive and municipal wastewater treatment. Natural zeolites; Occurrence, Properties Uses. 1978;25:451-462.
- [Google Scholar]
- Treatment of dye aqueous solutions using nanofiltration polyamide composite membranes for the dye wastewater reuse. Dyes Pigm.. 2008;76:429-434.
- [Google Scholar]
- A comparative study on Pb(II), Cd(II), Cu(II), Co(II)adsorption from single and binary aqueous solutions on additive assisted nano-structured goethite. Int. J. Eng., Sci. Technol.. 2011;2(8)
- [Google Scholar]
- The influence of some heavy metals cations on the FTIR spectra of zeolites. J. Mol. Struct.. 2000;555(1–3):299-304.
- [CrossRef] [Google Scholar]
- The influence of some heavy metals cations on the FTIR spectra of zeolites. Journal of Molecular Structure. 2000;555(1–3):299-304.
- [CrossRef] [Google Scholar]
- Zeolites in mafic pyroclastic rocks from the Sandikli-Afyonkarahisar region, Turkey. Clays Clay Minerals. 2013;61(3):177-192.
- [Google Scholar]
- Synthesis of zeolite-x from rice husk silica and aluminum metal as a catalyst for transesterification of palm oil. J. Mater. Environ. Sci.. 2017;8(5):1797-1802.
- [Google Scholar]
- Preparation and Characterization of Natural Zeolite Modified with Iron Nanoparticles. J. Nanomater. 2015:1-8.
- [Google Scholar]
- Application of a novel lignocellulosic biomaterial for the removal of Direct Yellow 50 dye from aqueous solution: Batch and column study. Journal of the Taiwan Institute of Chemical Engineers. 2015;47:160-170.
- [CrossRef] [Google Scholar]
- Utilization of natural chabazite and mordenite as a reactive barrier for immobilization of hazardous heavy metals. Environmental Science and Pollution Research. 2011;18(7):1098-1107.
- [CrossRef] [Google Scholar]
- The efficiency of Jordanian natural zeolite for heavy metals removal. Appl. Water Sci.. 2013;3(1):77-84.
- [Google Scholar]
- Natural zeolites as effective adsorbents in water and wastewater treatment. Chem. Eng. J.. 2010;156(1):11-24.
- [Google Scholar]
- Polacrylic and polystyrene functionalized resins for direct dye removal from textile effluents. Separation Science and Technology. 2020;55(12):2122-2136.
- [CrossRef] [Google Scholar]
- Characteristics of pseudo-second-order kinetic model for liquid-phase adsorption: a mini-review. Chem. Eng. J.. 2009;151(1–3):1-9.
- [Google Scholar]


