

Translate this page into:
Efficient one-pot synthesis of antimony-containing mesoporous tin dioxide nanostructures for gas-sensing applications
⁎Corresponding author. tm.aqeel@paaet.edu.kw (Tariq Aqeel)
-
Received: ,
Accepted: ,
This article was originally published by Elsevier and was migrated to Scientific Scholar after the change of Publisher.
Peer review under responsibility of King Saud University.
Abstract
Currently, wide-bandgap metal oxide nanomaterials with attractive chemical and physical properties are intensively used for the fabrication of chemiresistive gas sensors and other catalytic devices. However, the low electrical conductance of sensors based on wide bandgap metal oxides is an issue that limits their application in small-scale systems to read out electrical signals and the manufacturing of portable sensing devices. In this regard, combining oxide nanostructures with other elements could be an effective strategy for enhancing their electrical and sensing performances. In this work, we attempted to improve the conductivity and sensitivity of porous tin dioxide to certain gases. Herein, we report a cost-effective and simple method for synthesizing antimony-containing mesoporous tin dioxide (Sb-SnO2) under ambient pressure and temperature. The X-ray diffraction, N2 sorption, transmission electron microscopy, energy-dispersive X-ray, and photoelectron spectroscopy analyses indicate that the prepared Sb-SnO2 material is a nanocrystalline powder with a large surface area. Meanwhile, the successful incorporation of Sb into the SnO2 framework results in increased electrical conductance by at least one order of magnitude or more compared to that of pure SnO2 and other doped SnO2 materials, respectively. The structure shows a very effective sensing response to volatile organic compounds and nitrogen dioxide. Hence, we developed an efficient method for synthesizing highly conductive oxide nanomaterials for use in chemical gas sensing devices.
Keywords
Mesoporous nanomaterial
Antimony doping
Tin dioxide
Nitrogen dioxide
Acetone
Gas sensor

1 Introduction
Tin dioxide is an n-type semiconductor material with a band gap of 3.6 eV (Aswaghosh et al., 2016; Popescu et al., 2001; Shaalan et al., 2016). It is widely employed in different fields, including chemical gas sensing devices (Benhebal et al., 2011; Brunet et al., 2012; Chen et al., 2013; Das et al., 2017; Li et al., 2012; Wagner et al., 2011) and optical detectors (Ganose and Scanlon, 2016; Huang et al., 2014; Suh et al., 2021; Yu et al., 2011). This is mainly due to its relatively low cost, excellent chemical stability, and fast charge transfer (Chowdhury and Bhowmik, 2021; Ponja et al., 2018; Wang et al., 2021). Tailoring the surface chemistry or the morphology of SnO2 affects its band gap (Chakraborty et al., 2021), and eventually its reactivity toward different gaseous compounds. Furthermore, the band gap of semiconducting materials can be affected by many factors, such as doping with other elements (Ganose and Scanlon, 2016; Morris et al., 2001; Noor and Parkin, 2013; Shokr et al., 2000; Terrier et al., 1997; Yu et al., 2011), the formation of structural defects (Morris et al., 2001), and the modification of their crystallite size (Brus, 1984; Manikandan et al., 2016; Masuda, 2022). Moreover, the synthesis of semiconductor materials with porous morphology considerably increases the surface area of these materials, which is crucial to improving their interaction with gaseous and volatile organic compounds (VOCs) (Chowdhury and Bhowmik, 2021; Martinez et al., 2005; Masuda, 2022). The surface area of non-porous SnO2 (Smith and Nie, 2011) could be increased from 10 m2 g−1 to form mesoporous SnO2 of approximately 200 m2 g−1 (Goebbert et al., 1999). The surface area of oxide materials can also be affected by different treatment parameters employed during their calcination (Chen and Cao, 2020; Goebbert et al., 1999; Koo et al., 2017). In addition, heat treatment can affect the crystallite sizes of SnO2 (Goebbert et al., 1999; Noor and Parkin, 2013; Oakton et al., 2016; Zhong et al., 2012). It was found that SnO2 with an increased surface area and reduced crystallite size shows improved surface redox reactions and adsorption/desorption properties, thus leading to enhanced sensitivity of SnO2 toward low gas concentrations (Yamazoe et al., 2003; Masuda, 2022). Moreover, the formation of a framework with interconnected crystallites improves the overall charge transfer in the material, which is beneficial for its sensing response (Aegerter et al., 1997; Noor and Parkin, 2013; Shao et al., 2016).
Further, the introduction of different elements into the SnO2 framework may improve its electrical conductance (Terrier et al., 1997; Zhong et al., 2012) as well as its sensing properties by increasing the surface charge (Chakraborty et al., 2021; Yamazoe et al., 2003). In antimony-doped SnO2, Sb atoms replace Sn atoms in the framework (Zhong et al., 2012), introducing more electrons to the conduction band and generating more structural defects, such as oxygen vacancies (Brus, 1984; Manikandan et al., 2016; Zhong et al., 2012), owing to the higher oxidation state of Sb (Kojima et al., 1997; Terrier et al., 1997). As a result, an additional “defect band” is introduced beneath the main conduction band (Chowdhury and Bhowmik, 2021; Kojima et al., 1997), thus lowering the main band gap of the material and facilitating the transport of more valence electrons at lower energies (Ganose and Scanlon, 2016; Smith and Nie, 2011; Yu et al., 2011). Thus, decreasing the band gap of SnO2 from 3.6 eV to ∼ 3 eV reduces the heating energy required to conduct electricity, leading to a lower operating temperature of the material.
In general, mesoporous SnO2 powders are directly synthesized using solvothermal (hydrothermal), precipitation, and self-templating methods. The self-templating method relies solely on the thermal decomposition of organic ligands attached to the metal in a metal–organic framework in the presence of air. This will convert the organic ligands into gas and the metal into porous crystalline metal oxides (Wang et al., 2021). The solvothermal method, which employs heat treatment of the reaction mixture in a sealed container under internal pressure, was first used to produce mesoporous SnO2 by Chen and Liu (1999). Later, this method was used to prepare SnO2 containing different elements such as F-, Sb-, and In-doped SnO2 (Hao et al., 2014; Oh et al., 2015; Shao et al., 2016). In contrast, SnO2 precipitation occurs in a reaction vessel at atmospheric pressure and was first reported to produce mesoporous SnO2 by Severin and Abdel-Fattah (1998). However, the prepared porous product collapsed during calcination above 350 °C, which could explain the subsequent rare use of this method. We previously reported a highly reproducible method of synthesizing SnO2 based on the modified Severin’s precipitation synthesis, where the mesoporous SnO2 endured multiple heat treatments up to 500 °C (Aqeel et al., 2016). Our improved method produced crystalline mesoporous SnO2 powders containing a wide range of elements. In this study, we employed the aforementioned modified method to synthesize a mesoporous crystalline Sb-containing SnO2 (Sb-SnO2) powder with a large surface area and small crystallite size. The modified structural, morphological, and compositional properties of our Sb-SnO2 material resulted in improved electrical conductivity and sensing performance.
2 Materials and methods
2.1 Chemicals
Hexadecylamine (90%), iPrOH (99%), Sn(OiPr)4 (99%), and SbCl3 (99%) were purchased from Alfa Aesar. Ethanol (99.8%) was obtained from Sigma-Aldrich. All chemicals were used without further purification.
2.2 Synthesis of mesoporous Sb–SnO2
To prepare a mesoporous Sb-SnO2 powder, first, hexadecylamine (0.28 g) was dissolved in isopropyl alcohol (24.4 mL), followed by the addition of Sn(OiPr)4 (1.9 g) and SbCl3 (0.1 g) with continuous stirring at 25 °C. The reaction mixture was slowly stirred in humid air (approximately 80% humidity) at atmospheric pressure and room temperature for 3 d. The precipitated product was filtered and washed with water and ethanol. The surfactant was extracted from the product with ethanol using a Soxhlet extractor overnight (approximately 16 h), and the product was subsequently filtered. Finally, the product was calcined at 300 °C in air for 1 h and then at 400 °C for 15 min (heating rate of 2 °C min−1). The obtained material was denoted as Sb-SnO2.
2.3 Material characterization techniques
The synthesized powder was analyzed using X-ray diffraction (XRD), high-resolution transmission electron microscopy (HRTEM), energy-dispersive X-ray (EDX), and X-ray photoelectron spectroscopy (XPS). XRD measurements were performed using a Bruker AXS D8 ADVANCE diffractometer equipped with a copper target (λ = 1.5418 Å). The DIFFRACplus software was used for the analyses, and the operational parameters were set as follows: 40 kV, 40 mA, 0.1 mm low-angle front slit window size, 1.0 mm for wide-angle scans, 0.5–1.0 mm between the deflection plate and the sample for low-angle scans, and 0.5 steps s−1 in continuous coupled two-theta/theta scan modes. A Micromeritics TriStar analyzer was used for nitrogen gas adsorption–desorption analyses. A JEOL JEM-2011 microscope was utilized to obtain HRTEM images at an operating voltage of 200 kV. The TEM images were captured and analyzed using a Gatan 794 CCD camera and ImageJ software, respectively. The Oxford Link ISIS Semi STEM EDX system equipped with the TEM system was used to determine sample chemical compositions. XPS spectra were obtained using a Thermo Fisher Scientific ESCALAB 250Xi spectrometer equipped with a monochromator and an Al-Kα radiation source (1486.6 eV), and an Avantage data system was employed for spectral recording and processing. The XPS measurement parameters were set as follows: 10–9 Torr analysis chamber pressure, 0.1 eV step size, 100 ms dwell time, and 20 eV pass energy. The C 1 s line (284.6 eV) of adventitious carbon was used to determine binding energy values. A flood gun was used to neutralize charge buildup on the surface of the insulating layer in the standard charge compensation mode.
The gas-sensing tests of the materials prepared in this study were performed as follows: Interdigitated platinum electrodes and a heater were deposited on the surface and backside of the alumina substrate using radio frequency (RF) magnetron sputtering. Next, a 0.14 mg mL−1 dispersion of the Sb-SnO2 powder in ethanol was dropped on the substrate. Subsequently, thermal treatment of the fabricated sensing structure (Scheme 1) was performed in air at 200 °C for 1 h.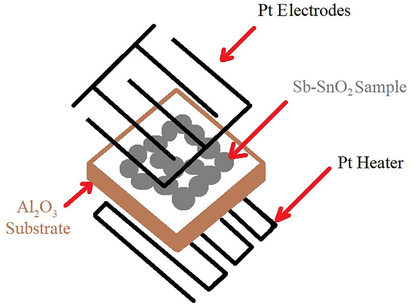
Schematic of the sample for gas sensing measurements.
The sensing properties of the material toward nitrogen dioxide, acetone, ethanol, and hydrogen were investigated in a test chamber using a flow-through technique. The humidity level in the test chamber was set at 40%. Each analyte gas was injected into the chamber at the desired concentration. After each measurement, the test chamber was purified with synthetic air.
3 Results and discussion
3.1 XRD patterns
The small-angle XRD pattern presented in Fig. 1 (a) shows a main diffraction peak corresponding to the (1 0 0) plane of Sb–SnO2, indicating its mesoporous structure. The absence of other peaks indicates that the pores show no long-range order (wormhole-like pores). Moreover, the shape of the main diffraction peak indicates that Sb is well-incorporated into the framework and does not damage the overall pore ordering in the structure (Du et al., 2012; Goebbert et al., 1999; Ponja et al., 2018). As shown in Fig. 1 (b), the wide-angle XRD pattern of Sb–SnO2 confirms its crystalline nature, with only one phase of synthesized SnO2 (Wang et al., 2009). The diffraction peaks can be assigned to the cassiterite (tetragonal) structure of SnO2 (Das et al., 2014; Du et al., 2012; Goebbert et al., 1999; Liu et al., 2012; Müller et al., 2011; Noor et al., 2015; Oh et al., 2015; Shao et al., 2016; Zhong et al., 2012). No additional diffraction peaks were observed that could be attributed to the formation of SbxOy clusters outside the framework. This result also confirms that the substitution of Sb ions does not affect the crystallinity of SnO2 (Oakton et al., 2016; Wang et al., 2009) and Sb ions inserted into the framework (Liu et al., 2012). This is expected because the ionic radius of Sb5+ (0.6 Å) is similar to that of Sn4+ (0.69 Å) (Ponja et al., 2018). Moreover, the average crystallite size was calculated to be 3.5 nm from the full width at half maximum of the (1 1 0) diffraction peak using the Scherrer equation.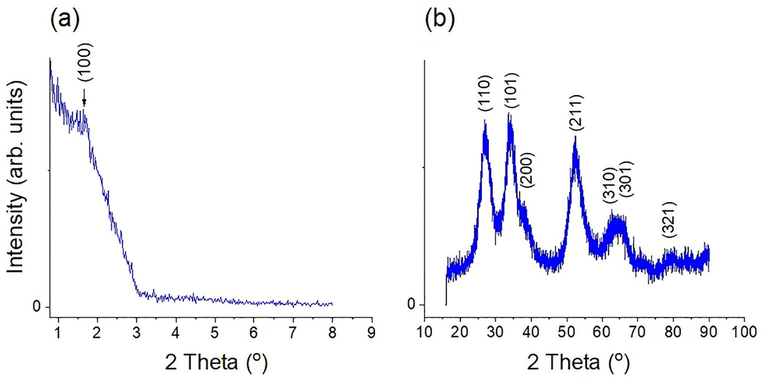
(a) Small-angle and (b) wide-angle XRD patterns of Sb–SnO2.
3.2 XPS spectra
Fig. 2 shows the XPS spectra of the prepared Sb-SnO2 nanomaterial. The binding energies of Sn spin coupling of the 3d orbitals at 486.6 and 495.0 eV exhibit a 3d orbit-splitting shift of 8.4 eV. This corresponds to the Sn4+ oxidation state of SnO2 (Hao et al., 2014; Wang et al., 2009; Feng et al., 2022). As shown in Fig. 2 (b), the Sb 3d5 peak overlaps with the O 1 s peak. After deconvolution of the asymmetric peak, the O 1 s peak at 530.6 eV could be ascribed to the O2− species in the SnO2 lattice (Hao et al., 2014), and the other peak at 531.8 eV to the Sb 3d5 peak. The Sb 3d3 peak is well resolved at 540.0 eV, and its position and symmetrical shape correspond to Sb5+ in Sb2O5 (Hou et al., 2009; Nag et al., 2014; Wang et al., 2009). This is in line with the wide-angle XRD results discussed in Section 3.1. Both Sb peaks confirm the successful substitution of Sb5+ in the SnO2 framework (Ponja et al., 2018). Based on the XPS data, the Sb content incorporated into SnO2 was calculated to be 5 wt%, which is close to the amount of Sb added during Sb–SnO2 synthesis (6 wt%).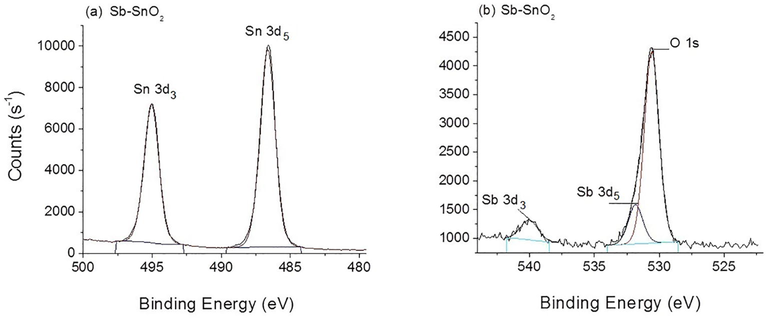
XPS spectra of Sb–SnO2. (a) Sn 3d and (b) Sb 3d and O 1S orbitals.
3.3 N2 Sorption analysis
The N2 sorption analysis was performed for Sb–SnO2 powder and the obtained isotherm curve can be ascribed to the Type I(b) isotherm (Thommes et al., 2015), which is typical for materials with wide micropores and narrow mesopores (Fig. 3 (a)). The shape of this isotherm is generally flat in the relative pressure range of 0.4–0.8, indicating the complete monolayer adsorption of N2. In addition, the sample showed no hysteresis between adsorption and desorption cycles, indicating a narrow pore size distribution (∼25 Å) and no cylindrical pores (absence of capillary condensation). Moreover, the Brunauer–Emmett–Teller (BET) surface area of the sample was determined to be 155 m2 g−1 with an average pore size of 22 Å (Fig. 3 (b)). The results obtained from the isotherm and pore size distribution confirm the successful synthesis of mesoporous Sb–SnO2 material according to IUPAC (Thommes et al., 2015).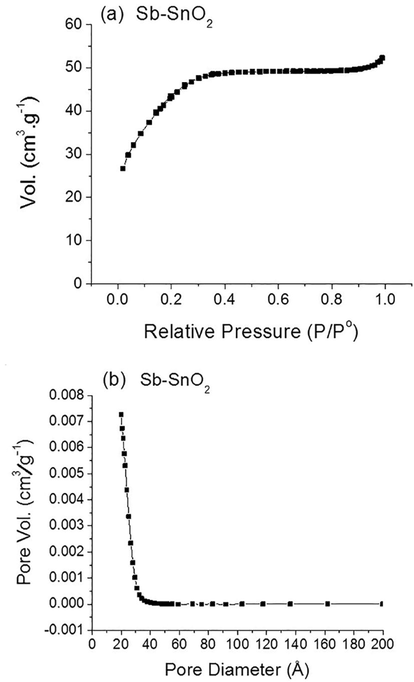
N2 sorption analysis of Sb–SnO2; (a) N2 isotherm (b) with the corresponding pore size distribution.
3.4 TEM analysis
TEM images in Fig. 4 (a) reveal and confirm the presence of wormhole-like pores without the long-range order throughout the Sb–SnO2 material, as previously demonstrated by the small-angle XRD results in Section 3.1. Based on the HRTEM image of the sample in Fig. 4 (b), the d spacing of 0.33 nm corresponds to the crystalline (1 1 0) plane of SnO2. In addition, the sample contains aggregated spherical crystallites, which form a continuous framework around the pores. This confirms that the Sb–SnO2 crystalline structure is chemically connected. The crystallite sizes are approximately 3–4 nm, which is in good agreement with the results obtained from XRD in Section 3.1. We believe that such small crystallite sizes are the result of the short calcination time owing to the extraction of most templating materials before heat treatment. Moreover, no aggregates of SbxOy species were observed in any of the TEM images, confirming that Sb was well incorporated into the framework.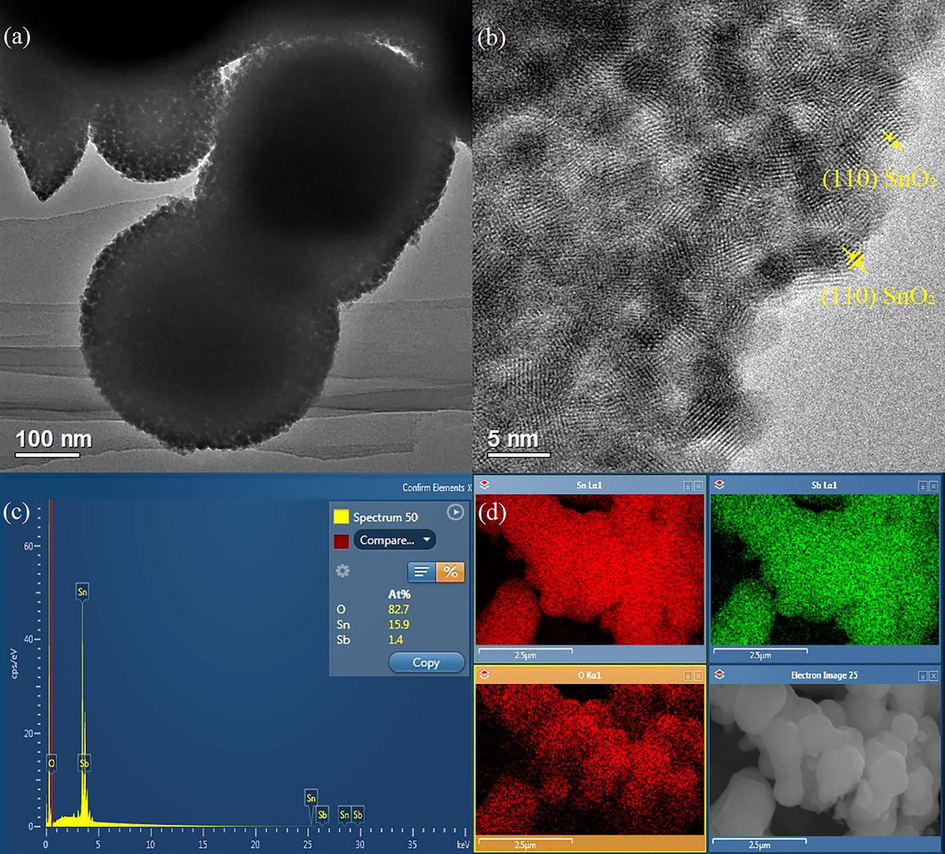
(a) and (b) TEM images, (c) EDX elemental analysis, and (d) color mapping of Sb–SnO2. In the mapping, top left: Sn, top right: Sb, and bottom left: O.
3.5 EDX elemental analysis
The EDX spectrum shows the K and L edges of the elements in the Sb-SnO2 sample (Fig. 4 (c)), confirming the presence of Sn, O, and Sb atoms. This also signifies that Sb has been successfully incorporated into the Sb-SnO2 structure. The inset in Fig. 4 (c) shows the atomic percentages (At%) of the elements in a selected area of the sample; however, the At% values in different selected areas were inconsistent. This might be because of the thickness of the sample. With a thicker sample, it is more difficult for the X-ray beam to penetrate the sample layers. Therefore, an average At% of Sb in SnO2 was calculated and converted into wt%. The determined average Sb content of 4 wt% is similar to that calculated from the XPS data in Section 3.2 and to that added during synthesis (6 wt%). The corresponding EDX mapping images (Fig. 4 (d) and Fig S1) show that all elements are homogeneously distributed throughout the sample. These findings also confirm that Sb (green in Fig. 4 (d) and light blue in Fig. S1) is integrated into the SnO2 framework and does not aggregate on the sample surface.
3.6 Electrical conductance of Sb–SnO2
The electrical conductance of Sb–SnO2 was studied as a function of temperature (Fig. 5). The temperature was increased from 50 to 400 °C in steps of 50 °C. The conductance first increased from 50 to 100 °C, which is typical of semiconductor materials. However, the conductance decreased linearly at higher temperatures because the adsorbed molecular oxygen at the surface was converted to ionic oxygen species (O− and O2−). This led to electron withdrawal from the surface and a decrease in the overall conductance of the material (Nag et al., 2014). In addition, the intensity of “phonons” increases at higher temperatures, resulting in decreased charge mobility and reduced conductance of the material (Terrier et al., 1997). This behavior is typical of semi-metallic materials. Furthermore, the conductance of Sb–SnO2 at 100 °C (9 × 10⁻³ S) is approximately one order of magnitude higher than that of pristine SnO2 (5 × 10⁻⁴ S) prepared using the same method (Aqeel et al., 2020). Hence, the significant enhancement in the SnO2 conductance may result from the presence of electron-donating Sb5+ species in the material (Ponja et al., 2018; Yuan et al., 2011). Moreover, we compared the electrical conductance of the Sb–SnO2 structure with that of pure, doped, and composite SnO2-based materials (Table 1). These results showed that our Sb–SnO2 exhibited the highest electrical conductance among others.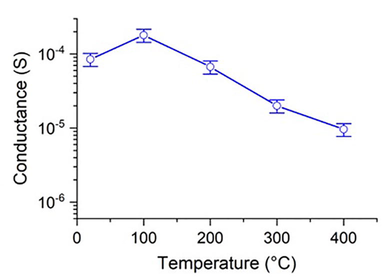
Temperature-dependent conductance of Sb–SnO2.
Material
Conductance (S)
Temp. (°C)
References
SnO2 nanofibers
Pt–SnO2 nanofibers1.7 × 10−8 – 2.0 × 10⁻⁷ 5.0 × 10⁻⁸ –5.3 × 10⁻⁷
100 – 205
Cui, et al., 2022
SnO2
SnO2/Co3O4 composites1.1 × 10−5
1.6 × 10⁻⁵
275
Sun et al., 2021
SnO2
Co–SnO2 nanoparticles3.3 × 10−8 –1.1 × 10⁻⁷
5.0 × 10⁻⁸ –1.0 × 10⁻⁵
20 –160
Zhou et al., 2022
SnO2 nanowires
SnO2/Co3O4 nanowires/nanoparticles1.0 × 10−7
2.0 × 10⁻⁹
300
Kim et al., 2020
Spherical mesoporous SnO2
1.0 × 10⁻⁸−1.1 × 10⁻⁸
250
Feng et al., 2021
SnO2 hollo nanosphere.
Pd–SnO2 hollo–nanosphere1.0 × 10−7
5.0 × 10⁻⁸
200
Cai et al., 2021
SnO2
Sb–SnO2
Pd–Sb–SnO2 nanoparticles4.8 × 10−7– 6.7 × 10⁻⁶
1.4 × 10⁻⁶ – 4.5 × 10⁻⁵
2.5 × 10⁻⁷ –1.0 × 10⁻⁵
100 – 450
Nag et al., 2014
Sb–SnO2 thin film
9.2 × 10⁻⁹
30 – 80
Panday et al., 2022
SnO2
5 × 10⁻⁴
100
Aqeel et al., 2020
Sb–SnO2
9 × 10⁻³
100
This work
3.7 Gas sensing performance of Sb–SnO2-based sensor
To evaluate the gas sensing response of the Sb–SnO2 structure toward reducing gases, its relative conductance variation (S) was determined using Eq. (1):
Here, G0 is the conductance of the sensor in the air, and Gf is the conductance in the presence of the analyzed gas.
The response of Sb–SnO2 toward oxidizing gases was calculated using Eq. (2):
Fig. 6 shows the response of Sb–SnO2 toward 8 ppm of NO2, 100 ppm of H2, and 10 ppm of acetone and ethanol at different temperatures and a relative humidity (RH) of 40%. The Sb–SnO2-based sensor showed a good response toward NO2 at 100 °C (Fig. 6 (a)), but was insensitive to the other gases tested (acetone, ethanol, and H2). At 100 °C, the adsorption of NO2 on the (1 0 1) (Jiang et al., 2012) and (1 1 0) (Kwon et al., 2016) planes of Sb–SnO2 is favored. This temperature represents the activation energy required for NO2 to react with the surface of Sb–SnO2 (Ngoc et al., 2018), owing to suitable adsorption surface energy and charge transfer. Because NO2 has a higher electron affinity than the oxygen species (O2 and O2–) on the surface of Sb–SnO2 at this temperature, interactions between NO2 and molecular oxygen species result in electron withdrawal (Scheme 2) and thus improved sensing response (Wang et al., 2014). At 200 °C, the sensor response toward NO2 is further enhanced by approximately three times (Fig. 6 (b)). Herein, in addition to the presence of molecular oxygen (O2−), dissociative oxygen (O−) species start to dominate on the Sb–SnO2 surface (as an adsorbate), resulting in an improved NO2 response (Park and Mackenzie, 1996; Yamazoe et al., 2003). However, the response of the sensor to NO2 decreases at 300 °C, but remains high enough for NO2 sensing applications (Fig. 6 (c); Table S1). Furthermore, the sensor shows a very weak response to NO2 at 400 °C, which could be attributed to the higher desorption rate of NO2 rather than the adsorption rate (Ngoc et al., 2018).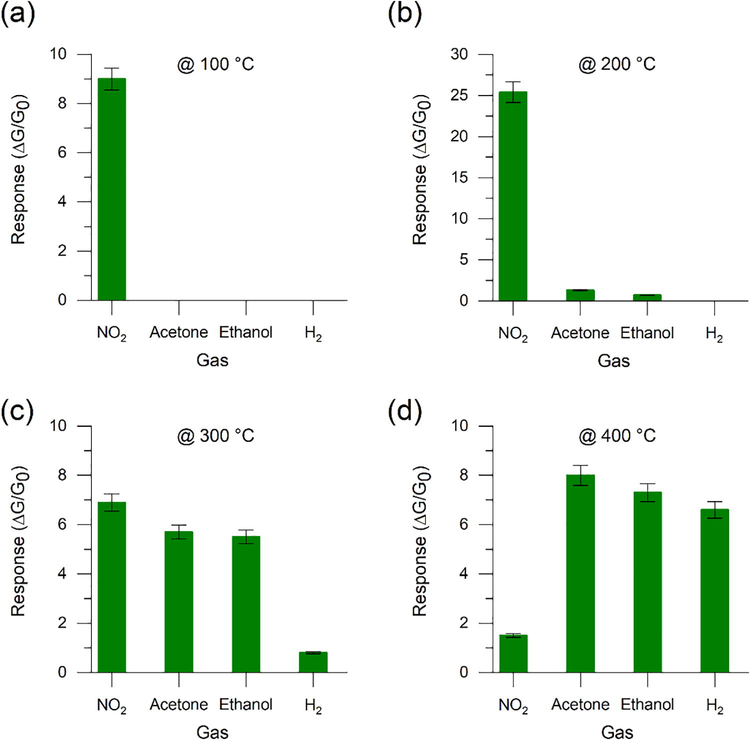
Responses of the Sb–SnO2-based sensor toward 8 ppm of NO2, 10 ppm of acetone, 10 ppm of ethanol, and 100 ppm of H2 at (a) 100, (b) 200, (c) 300, and (d) 400 °C. Relative humidity (RH) in the test chamber was set to 40%.
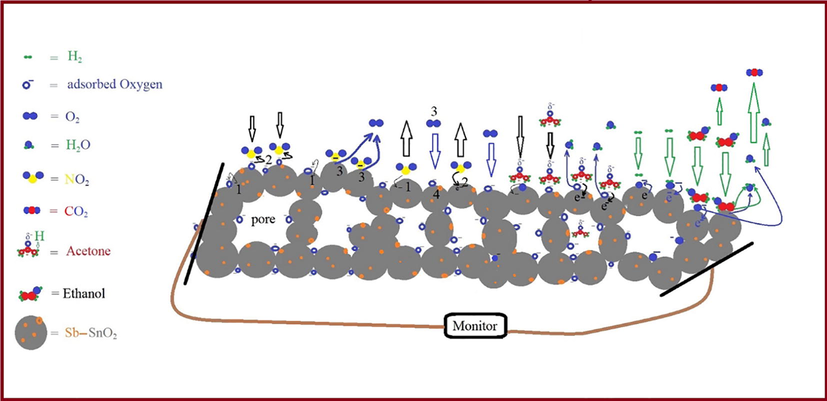
Schematic illustration of gas sensing mechanisms.
In addition, the Sb–SnO2-based sensor shows a weak response to H2 at 300 °C (Fig. 6 (c)), which is the activation energy required for H2 to interact with the Sb–SnO2 surface (Sergiienko et al., 2013; Yamazoe et al., 2003; Yang et al., 2010). Furthermore, the response is remarkably enhanced when the temperature of the sensor is increased to 400 °C (Fig. 6 (d)). This is due to the presence of more dissociative oxygen (O−) species (Park and Mackenzie, 1996; Yamazoe et al., 2003) on the Sb–SnO2 surface at 400 °C than at 300 °C (Scheme 2). These O− species interact with H2, producing water molecules and free electrons (Kwon et al., 2016). H2 + O− → H2O + e−
As shown in Fig. 6 (b), the sensor shows a low response toward acetone and ethanol at 200 °C, which corresponds to their activation energy, as confirmed by previous studies (Chen and Cao, 2020; Ngoc et al., 2018); however, it improves significantly at 300 and 400 °C (Fig. 6 (c) and (d)). At 200 °C, ethanol undergoes dehydration and reacts with the adsorbed molecular oxygen species, resulting in a low response (Yamazoe et al., 2003; Lei et al., 2021). CH3CH2OH + 3O2− → 2CO2 + 3H2O + 3e−
However, at 300 °C, ethanol undergoes dehydrogenation and reacts with dissociative oxygen species, leading to a higher response. CH3CH2OH + O− → CH3COH + H2O + e−
At 400 °C, as the amount of O− (Eberheim et al., 2003; Yamazoe et al., 2003) on the Sb–SnO2 surface increases, the response of the material increases accordingly. This enhances ethanol dehydrogenation on basic surfaces and dehydration on acid sites (Eberheim et al., 2003; Yamazoe et al., 2003).
Acetone (CH3(C = O)CH3) has a carbonyl group (C = O) with a partial positive charge on the carbon and a partial negative charge on the oxygen (Cδ+= Oδ−), owing to the higher electronegativity of the oxygen. Therefore, the partially positive carbon in acetone is more susceptible to a nucleophilic attack by negatively charged oxygen (O−) adsorbed on the surface of Sb–SnO2. Moreover, because Sb is slightly more electronegative than Sn, the oxygen bonded to Sb is more electrophilic and readily attracts the negative double bonds in the acetone molecules (Eberheim et al., 2003). CH3(C = O)CH3 + O− → CH3(C = O)C+H2 + H2O + e−
As a result, the sensor responded more strongly to acetone than to ethanol at 300 and 400 °C (Fig. 6 (c) and (d)). Thus, the oxidation of ethanol and acetone is more effective at higher operating temperatures (Chakraborty et al., 2021; Eberheim et al., 2003). The schematic of the interactions between gaseous compounds and the surface of Sb–SnO2 is presented in Scheme 2.
The porous structure of Sb–SnO2 with a relatively large surface area (155 m2 g−1) facilitates enhanced diffusion of gases/vapors and promotes interactions between gases and adsorbed oxygen species on the sensor surface (Koo et al., 2017). Moreover, despite the simple synthesis procedure of Sb–SnO2, the responses of our sensor to various gas concentrations are comparable with those of previously reported more complicated material structures (Kim et al., 2021; Koo et al., 2017; Vishwakarma and Yadava, 2021). Furthermore, the synthesized Sb–SnO2 exhibits superior sensing performance toward acetone and NO2 compared to the spherical porous SnO2 nanostructure (Feng et al., 2021). Table 2 shows a comparison between the sensing response of the Sb–SnO2 structure and other pure and composite materials toward acetone and NO2. Evidently, Sb–SnO2 demonstrated an excellent sensing response to low concentrations of acetone and NO2 compared to recently reported gas sensors based on other metal oxide nanocomposites.
Materials
Analyte
Concentration (ppm)
Response
Sensing temperature (°C)
References
ZnO nano–cactus
Acetone
10–500
1–3.4
230
Islam et al. 2021
Mesoporous ZnO
Acetone
50
1.8
200
Lei et al., 2021
Mesoporous ZnO–Au
Acetone
50
37
200
SnO2 hollow nanosphere
Acetone
1–100
1–6
200
Cai et al., 2021
Pd–SnO2 hollow nanosphere
Acetone
1–100
1–15
200
BiFeO3
Acetone
1–50
2.5–18.5
244
Xu et al., 2022
Sr–BiFeO3 nanomaterial
Acetone
1–50
2.5 –24.7
208
Co3O4
Acetone
50
3
240
Fan et al., 2023
Co3O4 halloysites nanotubes
Acetone
50
7
240
SnO2
Acetone
50
4
170
Zhang et al., 2022
Ag–SnO2 nanosheets
Acetone
50
5
170
SnO2
Acetone
100
10
110
Jawaher et al., 2018
CeO2
Acetone
100
5
110
CeO2–SnO2 nanocomposites
Acetone
100
16
110
MoO3 nanorods
Acetone
10
1.2
200
Meng et al., 2022
NiMoO4/MoO3 composites
Acetone
10
1.9
200
SnO2
Acetone
10
2
160
Han et al., 2022
PtCu–SnO2 nanoparticles
Acetone
10
2.5
160
Porous ZnSnO3 nanocubes
Acetone
50
4.7
210
Zheng et al., 2021
Porous SnO2 nanoparticles
Acetone
1
0.2
150
John et al., 2021
NO2
1
1.3
150
ZnO/SnO2 nanoparticles
Acetone
–
–
150
NO2
1
0.9
150
3-nm ZIF-8/SnO2 nanoparticles
Acetone
1
0.1
150
NO2
1
0.6
150
BiFeO3 hollow microcubes
Acetone
200
5.2
240
Yu et al., 2021
SnO2
Acetone
5
3.47
400
Koo et al., 2017
PdO@ZnO/SnO2 nanofibers
Acetone
5
6.55
400
SnO2
Acetone
5
5.45
400
PdO@ZnO/SnO2 nanotubes
Acetone
5
10.12
400
SnS
Acetone
25
1.12
RT
Bai et al., 2021
Mn/SnS nanoflakes
Acetone
25
3.7
RT
Spherical mesoporous SnO2
Acetone
50
1.2
250
Feng et al., 2021
NO2
50
2.2
Mesoporous Sb–SnO2
Acetone
1.5–10
4–8
400
This work
Acetone
1.5–10
3.6–5.7
300
NO2
8
25
200
NO2
1–8
2.5–6.9
300
The dynamic responses of the Sb–SnO2-based sensor at different gas concentrations and temperatures are shown in Fig. 7. As shown in Fig. 7 (a) and (b), the baseline for NO2 is not recovered after the gas was turned off at 100 and 200 °C. This may be because NO2, being a strong oxidizing gas, strongly holds the adsorbed electrons, making it difficult for the synthetic air to release these electrons and exchange them with the oxygen molecules present in the test chamber at these temperatures (Li et al., 2015). At 300 and 400 °C, our sensor shows reversible dynamic responses toward all tested gases (Fig. 7 (c) and (d)). Moreover, the dynamic responses are proportional to the gas concentrations, which is crucial for their quantitative analysis. Furthermore, our Sb–SnO2-based sensor exhibits an excellent response to low concentrations of acetone (1.5 ppm) and NO2 (1 ppm) (Fig. 7 (c) and (d)). These results could be attributed to the small crystallite size and large surface area of the fabricated porous Sb–SnO2 nanostructures (Yamazoe et al., 2003). However, while the response towards NO2 decreases significantly, the response to H2 increases significantly at 400 °C (Tables S1 and S2). It is worth noting that the sensing behavior of Sb–SnO2 is typical of an n-type material. Therefore, the conductance of the Sb–SnO2-based sensor increases upon exposure to reducing gases, such as H2, ethanol, and acetone, whereas it decreases when exposed to an oxidizing gas, such as NO2. One possible explanation for the decreased conductance is that NO2 is more electronegative than molecular oxygen and thus withdraws electrons from the Sb–SnO2 conduction band, resulting in a lower concentration of surface electrons and overall conductance of Sb–SnO2.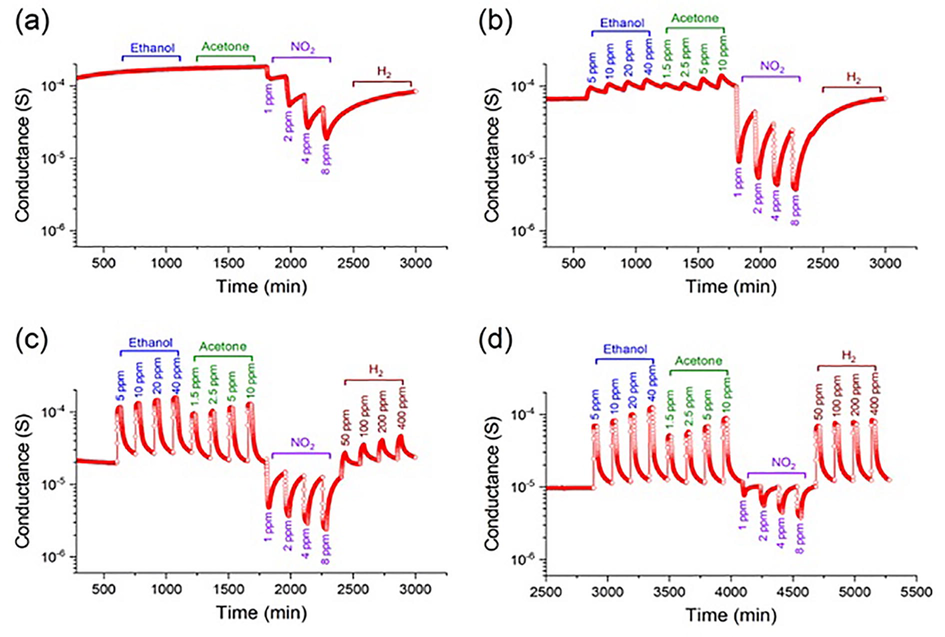
Dynamic responses of the Sb–SnO2-based sensor at different concentrations of ethanol, acetone, NO2, and H2 at (a) 100, (b) 200, (c) 300, and (d) 400 °C.
4 Conclusion
We successfully synthesized crystalline mesoporous Sb–SnO2 nanostructures at ambient pressure and temperature using our modified method. According to the XRD and TEM analyses, the Sb–SnO2 crystallites with a size of 3–4 nm were chemically connected and formed a continuous framework. Furthermore, the Sb–SnO2 nanostructure exhibited a large BET surface area (155 m2 g−1) with a narrow pore size distribution (2–3 nm), which is favorable for excellent gas adsorption in a sensor. The small crystallite and pore sizes result from a short calcination time and efficient removal of the templating materials via Soxhlet extraction. In addition, a higher electrical conductance of the Sb–SnO2 material was achieved compared to the previously reported pristine SnO2 prepared using the same method, other SnO2 composites, and oxide materials. Based on the XPS, XRD, and EDS results, the presence of electron-donating Sb5+ in the (Sb2O5) framework could explain the enhanced conductance of our material. The gas sensing performance of the Sb–SnO2-based sensor in the presence of reducing and oxidizing gases was highly dependent on the operating temperature. Thus, the sensor exhibited a very high response to NO2 between 100 and 300 °C. However, efficient desorption of NO2 was not achieved at 100 and 200 °C, and the conductance of the sensor did not recover to its baseline value. Conversely, Sb–SnO2 exhibited a high and reversible response to low concentrations (1 ppm) of NO2 at 300 °C. studies of the sensing properties of Sb–SnO2 toward acetone and ethanol showed that the increase in the operating temperature and the high number of dissociative oxygen species improved the interactions between the sensor and the gases, ensuring a high sensing response. In addition, the Sb–SnO2 sensor exhibited a slightly higher response to low concentrations of acetone compared to ethanol. Furthermore, the formation of O− species on the surface of Sb–SnO2 and their increased concentration at higher temperatures played a key role in improving the sensing response toward H2. Thus, these findings demonstrate that the synthesis method described in this work can be used to fabricate nanocrystalline doped oxide materials with high conductivity and excellent sensing performance. In light of these findings, we will continue to investigate different Sb concentrations and elements that can be introduced into the SnO2 framework to determine an optimal composition for detecting a specific gaseous compound and studying the effect of humidity on sensor performance.
Author contributions
T.A. synthesized the materials and performed structural and compositional analyses using EDX, XRD, TEM, and N2 sorption analysis, discussed the TEM, EDX, XRD, and part of the N2 sorption results in the manuscript, the relation between the structure and the gas interaction. T.A. wrote most of the manuscript and provided partial financial support from PAAET. V.G. prepared samples for the gas sensing characterization. V.G. and E.C. performed the gas sensing tests, discussed the corresponding results, and provided partial financial support for the gas sensing characterizations. Both E.C. and V.G. proofread and revised the manuscript many times during the writing process. A.B. supervised, analyzed, and discussed the results obtained from the XPS test, discussed one part of the N2 sorption results, and proofread the final version of the manuscript.
Acknowledgment
This work was partially funded by the Public Authority of Applied Education and Training (PAAET), Kuwait (Project No. BE-16-05 titled “Synthesis of crystalline mesoporous tin dioxide framework doped with fluoride and antimony to improve its electrical and optical properties”) and carried out in collaboration with Kuwait University. The assistance provided for the XPS measurements at Kuwait University (Project No. GS01/05) is acknowledged. The work was also funded by the “Multi-Messenger and Machine Learning Monitoring of SARS-CoV-2 for Occupational Health & Safety” (4 M SARS-CoV-2) project under the Special Integrative Fund for Research (FISR), Ministry of University and Research (MUR), Italy, NATO Science for Peace and Security Program under Grant No. G5634 “Advanced Electro-Optical Chemical Sensors”, and the “Smart Cities and Communities and Social Innovation” project titled “SWaRM Net/Smart Water Resource Management – Networks” (MUR).
Declaration of Competing Interest
The authors declare that they have no known competing financial interests or personal relationships that could have appeared to influence the work reported in this paper.
References
- Comparative study of SnO2: Sb transparent conducting films produced by various coating and heat treatment techniques. J. Non-Cryst. Solids. 1997;218:123-128.
- [CrossRef] [Google Scholar]
- Novel direct synthesis of mesoporous tin dioxide network intact up to 500 °C. J. Nano Res.. 2016;40:79-89.
- [CrossRef] [Google Scholar]
- Mesoporous polycrystalline SnO2 framework synthesized by direct soft templating method for highly selective detection of NO2. Nanotechnology. 2020;31:105502
- [CrossRef] [Google Scholar]
- Aswaghosh, L., Manoharan, D., Jaya, N.V., 2016. Defect structure and optical phonon confinement in ultrananocrystalline BixSn1-xO2 (x = 0, 0.03, 0.05, and 0.08) synthesized by a sonochemical method. Phys. Chem. Chem. Phys. 18, 5995–6004. https://doi.org/10.1039/C5CP06214D.
- Boosting the acetone sensing of SnS nanoflakes by spin Mn substitution: a novel adsorption-desorption perspective. Environ. Sci. Nano. 2021;8:1096-1108.
- [CrossRef] [Google Scholar]
- Synthesis, characterization and photocatalytic properties of alkali metals doped tin dioxide. J. Mol. Struct.. 2011;1004:222-226.
- [CrossRef] [Google Scholar]
- Comparison of the gas sensing performance of SnO2 thin film and SnO2 nanowire sensors. Sensors Actuators, B. 2012;165:110-118.
- [CrossRef] [Google Scholar]
- Electron-electron and electron-hole interactions in small semiconductor crystallites: the size dependence of the lowest excited electronic state. J. Chem. Phys.. 1984;80:4403-4409.
- [CrossRef] [Google Scholar]
- Hydrogen sensing performance and its enhanced sensing mechanisms of hollow structured-SnO2 nanospheres activated by noble metal nanoparticles. J. Mater. Res. Technol.. 2021;15:1716-1731.
- [CrossRef] [Google Scholar]
- Chakraborty, N., Das, S., Srihari, V., Mondal, D.J., Saha, D., Konar, S., Mishra, A.K., Mondal, S., 2021. Roles of structure and electron mobilization in enhanced ethanol sensing by Al doped SnO2 nanoparticles. Mater. Adv. 2, 3760–3769. https://doi.org/10.1039/D1MA00172H.
- Chen, F., Liu, M., 1999. Preparation of mesoporous tin oxide for electrochemical applications. Chem. Commun. 1829–1830. https://doi.org/10.1039/A904142G
- Ultrasensitive and low detection limit of acetone gas sensor based on ZnO/SnO2 thick films. RSC Adv.. 2020;10:35958-35965.
- [CrossRef] [Google Scholar]
- Nanochemistry and nanomaterials for photovoltaics. Chem. Soc. Rev.. 2013;42:8304-8338.
- [CrossRef] [Google Scholar]
- Micro/nanostructured gas sensors: the physics behind the nanostructure growth, sensing and selectivity mechanisms. Nanoscale Adv.. 2021;3:73-93.
- [CrossRef] [Google Scholar]
- Ultrafine Pt-doped SnO2 mesopore nanofibers-based gas sensor for enhanced acetone sensing. Chin. J. Anal. Chem.. 2022;100188
- [CrossRef] [Google Scholar]
- The role of SnO2 quantum dots in improved CH4 sensing at low temperature. J. Mater. Chem. C. 2014;2:164-171.
- [CrossRef] [Google Scholar]
- Recent advances in nanomaterials for water protection and monitoring. Chem. Soc. Rev.. 2017;46:6946-7020.
- [CrossRef] [Google Scholar]
- Fabrication and excellent conductive performance of antimony-doped tin oxide-coated diatomite with porous structure. Mater. Chem. Phys.. 2012;133:907-912.
- [CrossRef] [Google Scholar]
- Tin oxide sensor element for the detection of organic compounds with hydroxy groups. Phys. Chem. Chem. Phys.. 2003;5:5203-5206.
- [CrossRef] [Google Scholar]
- Enhanced gas sensing property of Co3O4 matrix nanocomposites with halloysite nanotubes toward triethylamine. J. Mater. Res. Technol.. 2023;23:2491-2503.
- [CrossRef] [Google Scholar]
- Self-template synthesis of spherical mesoporous tin dioxide from tin-polyphenol-formaldehyde polymers for conductometric ethanol gas sensing. Sensors Actuators, B. 2021;341:129965
- [CrossRef] [Google Scholar]
- Self-template synthesis of mesoporous Au-SnO2 nanospheres for low-temperature detection of triethylamine vapor. Sensors Actuators, B. 2022;356:131358
- [CrossRef] [Google Scholar]
- Band gap and work function tailoring of SnO2 for improved transparent conducting ability in photovoltaics. J. Mater. Chem. C. 2016;4:1467-1475.
- [CrossRef] [Google Scholar]
- Ultrafiltration conducting membranes and coatings from. J. Mater. Chem.. 1999;9:253-258.
- [CrossRef] [Google Scholar]
- PtCu-SnO2 nanocomposites for ultrasensitive and rapid ultra-low formaldehyde sensing. ChemPhysMater. 2022;1:227-236.
- [CrossRef] [Google Scholar]
- Effects of fluorine ions on the formation and photocatalytic activities of SnO2 nanoparticles with small sizes. RSC Adv.. 2014;4:21548-21552.
- [CrossRef] [Google Scholar]
- Dye-anchored mesoporous antimony-doped tin oxide electrochemiluminescence cell. Adv. Mater.. 2009;21:2492-2496.
- [CrossRef] [Google Scholar]
- Electronic structure and optical properties of Ag-doped SnO2 nanoribbons. RSC Adv.. 2014;4:41819-41824.
- [CrossRef] [Google Scholar]
- “Nano-on-Micro” approach enables synthesis of ZnO nano-cactus for gas sensing applications. Sens. Int.. 2021;2:100084
- [CrossRef] [Google Scholar]
- Hydrothermal synthesis of CeO2–SnO2 nanocomposites with highly enhanced gas sensing performance towards n-butanol. J. Sci.: Adv. Mater. Devices. 2018;3:139-144.
- [CrossRef] [Google Scholar]
- Facile synthesis of SnO2 nanocrystalline tubes by electrospinning and their fast response and high sensitivity to NOx at room temperature. CrystEngComm. 2012;14:2739-2747.
- [CrossRef] [Google Scholar]
- Tuning the selectivity of highly sensitive chemiresistive nanoparticle networks by encapsulation with metal-organic frameworks. J. Mater. Chem. C. 2021;9:17331-17340.
- [CrossRef] [Google Scholar]
- Improved sub-ppm acetone sensing properties of SnO2 nanowire-based sensor by attachment of Co3O4 nanoparticles. J. Mater. Res. Technol.. 2020;9:1129-1136.
- [CrossRef] [Google Scholar]
- An analysis of a highly sensitive and selective hydrogen gas sensor based on a 3D Cu-doped SnO2 sensing material by efficient electronic sensor interface. ACS Sens.. 2021;6:4145-4155.
- [CrossRef] [Google Scholar]
- Microstructure and electrical properties of Sb-Sn-O thin films. J. Non-Cryst. Solids. 1997;218:230-234.
- [CrossRef] [Google Scholar]
- Metal–organic framework templated catalysts: dual sensitization of PdO–ZnO composite on hollow SnO2 nanotubes for selective acetone sensors. ACS Appl. Mater. Interfaces. 2017;9:18069-18077.
- [CrossRef] [Google Scholar]
- Selective improvement of NO2 gas sensing behavior in SnO2 nanowires by ion-beam irradiation. ACS Appl. Mater. Interfaces. 2016;8:13646-13658.
- [CrossRef] [Google Scholar]
- Size-controlled Au nanoparticles incorporating mesoporous ZnO for sensitive ethanol sensing. ACS Appl. Mater. Interfaces. 2021;13:51933-51944.
- [CrossRef] [Google Scholar]
- Novel sensor array based on doped tin oxide nanowires for organic vapor detection. Sens. Actuators, B. 2012;162:251-258.
- [CrossRef] [Google Scholar]
- Fabrication of SnO2-SnO nanocomposites with p-n heterojunctions for the low-temperature sensing of NO2 gas. Nanoscale. 2015;7:12133-12142.
- [CrossRef] [Google Scholar]
- Effect of Sb doping on the microstructure and optoelectrical properties of Sb-doped SnO2 films prepared by spin coating. Phys. Scr.. 2012;85:065601
- [CrossRef] [Google Scholar]
- Manikandan, M., Tanabe, T., Ramesh, G. V., Kodiyath, R., Ueda, S., Sakuma, Y., Homma, Y., Dakshanamoorthy, A., Ariga, K., Abe, H., 2016. Tailoring the surface-oxygen defects of a tin dioxide support towards an enhanced electrocatalytic performance of platinum nanoparticles. Phys. Chem. Chem. Phys. 18, 5932–5937. https://doi.org/10.1039/C5CP04714E.
- Porous tin oxide nanostructured microspheres for sensor applications. Langmuir. 2005;21:7937-7944.
- [CrossRef] [Google Scholar]
- Recent advances in SnO2 nanostructure based gas sensors. Sens. Actuators, B. 2022;364:131876
- [CrossRef] [Google Scholar]
- Synthesis of NiMoO4-functionalized MoO3 nanorods with enhanced TMA gas sensing properties. Sens. Actuators Rep.. 2022;4:100104
- [Google Scholar]
- Surface grafting as a route to modifying the gas-sensitive resistor properties of semiconducting oxides: Studies of Ru-grafted SnO2. Phys. Chem. Chem. Phys.. 2001;3:132-145.
- [CrossRef] [Google Scholar]
- Antimony doped tin oxide nanoparticles and their assembly in mesostructured film. Phys. Status Solidi C Top. Solid State Phys.. 2011;8:1759-1763.
- [CrossRef] [Google Scholar]
- Enhanced gas sensing performance of tin dioxide-based nanoparticles for a wide range of concentrations of hydrogen gas. RSC Adv.. 2014;4:18512-18521.
- [CrossRef] [Google Scholar]
- Ultralow power consumption gas sensor based on a self-heated nanojunction of SnO2 nanowires. RSC Adv.. 2018;8:36323-36330.
- [CrossRef] [Google Scholar]
- Enhanced transparent-conducting fluorine-doped tin oxide films formed by Aerosol-assisted chemical vapour deposition. J. Mater. Chem. C. 2013;1:984-996.
- [CrossRef] [Google Scholar]
- Influencing FTO thin film growth with thin seeding layers: a route to microstructural modification. J. Mater. Chem. C. 2015;3:9359-9368.
- [CrossRef] [Google Scholar]
- Structural differences between Sb- and Nb-doped tin oxides and consequences for electrical conductivity. New J. Chem.. 2016;40:2655-2660.
- [CrossRef] [Google Scholar]
- Preparation of mesoporous Sb-, F-, and in-doped SnO2 bulk powder with high surface area for use as catalyst supports in electrolytic cells. Adv. Funct. Mater.. 2015;25:1074-1081.
- [CrossRef] [Google Scholar]
- Sb incorporated SnO2 nanostructured thin films for CO2 gas sensing and humidity sensing applications. Journal of Alloys and Compounds. 2022;904:164053.
- [CrossRef] [Google Scholar]
- Thickness and microstructure effects on alcohol sensing of tin oxide thin films. Thin Solid Films. 1996;274:154-159.
- [CrossRef] [Google Scholar]
- Enhanced electrical properties of antimony doped tin oxide thin films deposited via aerosol assisted chemical vapour deposition. J. Mater. Chem. C. 2018;6:7257-7266.
- [CrossRef] [Google Scholar]
- Popescu, D.A., Herrmann, J.M., Chimie, Ensuque, A., Bozon-Verduraz, F., 2001. Nanosized tin dioxide : Spectroscopic (UV–VIS , NIR , EPR) and electrical conductivity studies. Phys. Chem. Chem. Phys. 3, 2522–2530. https://doi.org/10.1039/B100553G
- The influence of preparation conditions and doping on the physicochemical and sensor properties of mesoporous tin oxide. Sens. Actuators, B. 2013;177:643-653.
- [CrossRef] [Google Scholar]
- Severin, K.G., Abdel-Fattah, T.M., 1998. Supramolecular assembly of mesostructured tin oxide. Chem. Commun. 1471–1472. https://doi.org/10.1039/A709067F
- Preparation of quantum size of tin oxide: structural and physical characterization. Prog. Nat. Sci. Mater. Int.. 2016;26:145-151.
- [CrossRef] [Google Scholar]
- Generation of highly ordered nanoporous Sb–SnO2 thin films with enhanced ethanol sensing performance at low temperature. New J. Chem.. 2016;40:5523-5530.
- [CrossRef] [Google Scholar]
- Sb-doping effects on optical and electrical parameters of SnO2 films. J. Phys. Chem. Solids. 2000;61:75-85.
- [CrossRef] [Google Scholar]
- Bright and compact alloyed quantum dots with broadly tunable near-infrared absorption and fluorescence spectra through mercury cation exchange. J. Am. Chem. Soc.. 2011;133:24-26.
- [CrossRef] [Google Scholar]
- Light-activated gas sensing: A perspective of integration with micro-LEDs and plasmonic nanoparticles. Mater. Adv.. 2021;2:827-844.
- [CrossRef] [Google Scholar]
- Bimetallic organic framework-derived SnO2/Co3O4 heterojunctions for highly sensitive acetone sensors. New J. Chem.. 2021;45:18150-18157.
- [CrossRef] [Google Scholar]
- Electrical and optical properties of Sb:SnO2 thin films obtained by the sol-gel method. Thin Solid Films. 1997;295:95-100.
- [CrossRef] [Google Scholar]
- Physisorption of gases, with special reference to the evaluation of surface area and pore size distribution (IUPAC Technical Report) Pure Appl. Chem.. 2015;87:1051-1069.
- [CrossRef] [Google Scholar]
- Structural and sensing properties of ethanol gas using Pd-doped SnO2 thick film gas sensor. Environ. Sci. Pollut. Res.. 2021;28:3920-3927.
- [CrossRef] [Google Scholar]
- Wagner, T., Bauer, M., Sauerwald, T., Kohl, C.D., Tiemann, M., 2011. X-ray absorption near-edge spectroscopy investigation of the oxidation state of Pd species in nanoporous SnO2 gas sensors for methane detection. Thin Solid Films 520, 909–912. https://doi.org/10.1016/j.tsf.2011.04.187.
- Ordered Mesoporous Sb-, Nb-, and Ta-doped SnO2 thin films with adjustable doping levels and high electrical conductivity. ACS Nano. 2009;3:1373-1378.
- [CrossRef] [Google Scholar]
- Wang, X., Qiu, S., Liu, J., He, C., Lu, G., Liu, W., 2014. Synthesis of mesoporous SnO2 spheres and application in gas sensors. Eur. J. Inorg. Chem. 863–869. https://doi.org/10.1002/ejic.201301212
- Engineering mesoporous semiconducting metal oxides from metal-organic frameworks for gas sensing. Coord. Chem. Rev.. 2021;445:214086
- [CrossRef] [Google Scholar]
- Highly sensitive ethanol and acetone gas sensors with reduced working temperature based on Sr-doped BiFeO3 nanomaterial. J. Mater. Res. Technol.. 2022;17:1955-1963.
- [CrossRef] [Google Scholar]
- Ultrasensitive and highly selective gas sensors based on electrospun SnO2 nanofibers modified by Pd loading. Adv. Funct. Mater.. 2010;20:4258-4264.
- [CrossRef] [Google Scholar]
- Electronic structures and excitonic transitions in nanocrystalline iron-doped tin dioxide diluted magnetic semiconductor films: an optical spectroscopic study. Phys. Chem. Chem. Phys.. 2011;13:6211-6222.
- [CrossRef] [Google Scholar]
- Hierarchical hollow BiFeO3 microcubes with enhanced acetone gas sensing performance. Dalton Trans.. 2021;50:6702-6709.
- [CrossRef] [Google Scholar]
- Preparation of mesoporous and/or macroporous SnO2-based powders and their gas-sensing properties as thick film sensors. Sensors. 2011;11:1261-1276.
- [CrossRef] [Google Scholar]
- Improved triethylamine sensing properties of fish-scale-like porous SnO2 nanosheets by decorating with Ag nanoparticles. J. Materiomics. 2022;8:518-525.
- [CrossRef] [Google Scholar]
- Size-controlled synthesis of porous ZnSnO3 nanocubes for improving formaldehyde gas sensitivity. RSC Adv.. 2021;11:20268-20277.
- [CrossRef] [Google Scholar]
- Effect of calcining temperature and time on the characteristics of Sb-doped SnO2 nanoparticles synthesized by the sol–gel method. Particuology. 2012;10:365-370.
- [CrossRef] [Google Scholar]
- Formaldehyde gas sensor with extremely high response employing cobalt-doped SnO2 ultrafine nanoparticles. Nanoscale Adv.. 2022;4:824-836.
- [CrossRef] [Google Scholar]
Appendix A
Supplementary material
Supplementary data to this article can be found online at https://doi.org/10.1016/j.arabjc.2023.104797.
Appendix A
Supplementary material
The following are the Supplementary data to this article:Supplementary data 1
Supplementary data 1


