

Translate this page into:
Efficient photocatalysis of Cu doped TiO2/g-C3N4 for the photodegradation of methylene blue
⁎Corresponding author. charitha.t@sliit.lk (Charitha Thambiliyagodage)
-
Received: ,
Accepted: ,
This article was originally published by Elsevier and was migrated to Scientific Scholar after the change of Publisher.
Peer review under responsibility of King Saud University.
Abstract
The release of dyes into normal water reservoirs has become a tremendous environmental problem and the development of methods to remove such dyes is essential. A novel photocatalyst was fabricated in which Cu doped to TiO2 was coupled with g-C3N4 (Cu-TiO2/g-C3N4) in different weight percentages as 10, 30 and 50%, hydrothermally. Pure TiO2 consisted of both Anatase and Rutile phases where slight lattice distortions were observed in the Cu-doped TiO2 as evidenced by the XRD and Raman analysis. Cu was present at 1.7% by weight respective to TiO2 according to the XRF analysis. Spherical and irregularly shaped aggregated Cu-doped TiO2 nanoparticles in the range of 15–55 nm were heterogeneously distributed on the g-C3N4 matrix as observed by TEM and SEM. The band gap of TiO2 (3.0 eV) was reduced to 2.67 upon doping with Cu. The band gap of g-C3N4 was found to be 2.81 eV and that of Cu-TiO2/g-C3N4 in different weight percentages were in the range of 2.82 to 2.88 eV. Synthesized photocatalysts were tested on the ability to degrade methylene blue under UV and Visible light. Cu-TiO2/50% g-C3N4 showed the highest rate constant (4.4 × 10⁻³ min−1) which is 5 and 9.8 times greater than TiO2 and g-C3N4, respectively. The rate constant decreased with the introduction of EDTA and Isopropyl alcohol as they scavenge holes and hydroxyl radicals, respectively. The photocatalytic activity of all the nanomaterials increased with the increasing concentration of persulfate due to the increasing concentration of SO4●- and OH● produced. Synthesized nanomaterials effectively adsorb methylene blue under dark conditions following the pseudo-second-order kinetics suggesting that methylene blue molecules were chemisorbed to the adsorbents. The adsorption rate constant resulting in the best-performing photocatalyst was 0.122 g mg−1 min−1. Hence, it is evident that Cu-TiO2/g-C3N4 can effectively degrade methylene blue.
Keywords
Cu doped TiO2
g-C3N4
Methylene blue
Photodegradation
UV
Visible

1 Introduction
Water pollution is a tremendous problem being emerged in the last few decades due to industrialization, urbanization and economic revolution. Organic pollutants including but not limited to dyes, pesticides, and pharmaceuticals are released to water reservoirs and cause severe hazardous effects because they persist in the environment as they are resistant to degradation. Therefore, water purification is eliciting attracting scientists to mitigate the severe effects resulting from the pollutants. Among the many organic pollutants that are being discharged into water, dyes which are released from textile, paper, paint (Al-Tohamy et al., 2022; Parmar et al., 2022; Silva et al., 2021) etc. industries play a major role as they are constituted of heavy metals (Singha et al., 2021) and aromatic compounds (Faria et al., 2008) in addition to the dye molecules. Dyes in aquatic environments cause health risks to living organisms, reduce the light penetration into the water body and hence reduce the photosynthetic efficiency of aquatic plants which also leads to producing anoxic conditions that impact the aquatic fauna and flora (Dutta & Bhattacharjee, 2022). They degrade the aesthetic value of the water bodies due to the persistent colours and increase the biological and chemical oxygen demand (Azanaw et al., 2022). Further, they get accumulated in the food chain and promote toxicity leading to many severe health conditions (Lellis et al., 2019). Therefore, it is vital to remove the dyes from normal water reservoirs. Many methods including membrane filtration (Ramutshatsha-Makhwedzha & Nomngongo, 2022), adsorption (Birniwa et al., 2022; Gunathilaka et al., 2021), ion exchange (Lu et al., 2022), coagulation (Ihaddaden et al., 2022), oxidation (Javanbakht & Mohammadian, 2021), hydrogenation catalysis (J. Thambiliyagodage et al., 2016) etc. have been employed to remove dyes from contaminated water. However, these methods possess different disadvantages such as sludge production, high cost, incomplete removal, poor mass transfer, low permeability, unsuitable for larger volumes, formation of toxic byproducts etc. despite their advantages of being effective in a wide range of dyes, eco-friendliness, effective decolourization etc (Moosavi et al., 2020). Hence, it is necessary to develop a new technique to alleviate the existing problem which could overcome the drawbacks shown by the established methods and be more advantageous including being efficient.
The advanced oxidation process (AOP) involves the generation of reactive oxygen species such as OH●, O2–●, H2O2, and O3 which degrade the pollutant molecules into harmless products. Degradation of methylene blue by many AOP methods including ozonation (Babar et al., 2022), photocatalysis (Thambiliyagodage, Kumara, et al., 2022), Fenton (Kirchon et al., 2020), sonolysis (Bezzerrouk et al., 2021), and electrochemical oxidation (Samarghandi et al., 2020) have been reported. However, these methods possess disadvantages such as toxicity of by products, the requirement of large quantities of H2O2, effective in low pH, the requirement of sophisticated equipment, highly expensive etc. (X. Li et al., 2021; Lyu et al., 2016; Pirsaheb & Moradi, 2021). Photocatalysis is advantageous over the other methods because methylene blue is degraded into harmless products such as CO2, H2O, NH4+, SO42- and NO3– (Charitha et al., 2021).
Semiconductors are employed in mineralizing organic molecules via AOP and the most widely used semiconductor is TiO2 due to its stability, non-toxicity and low cost (Guo et al., 2019). However, TiO2 bearing a band gap of 3.2 eV in general is active only in the UV range limiting its applicability in the visible range (Sharma et al., 2019). TiO2 has been doped with metals like Fe (Thambiliyagodage & Mirihana, 2021), Cu (Lee et al., 2021), and Mn (Lee et al., 2021), and non-metals such as N (Thambiliyagodage & Usgodaarachchi, 2021), C (Pandi et al., 2022), and S (T. Li et al., 2021) to reduce the band gap to increase the visible light sensitivity. However, the photocatalytic activity is reduced due to the electron-hole pair recombination even though in general the photocatalytic activity in visible light is enhanced via reducing the band gap. Therefore, to enhance the charge separation TiO2 has been coupled with other semiconductors forming type I and type II heterojunctions. Semiconductors including WO3 (H. Li et al., 2021), Fe2O3 (Fawzi Suleiman Khasawneh & Palaniandy, 2021), BiOI (Liao et al., 2022), and MoS2 (Y. Wu et al., 2022) form type I heterojunctions with TiO2 while semiconductors like CuO (Shi et al., 2019), CdSe (M. Yang et al., 2018), V2O5 (Ghosh et al., 2018), CeO2 (Tuyen et al., 2018), Bi2S3 (Z. Wu et al., 2020), WS2 (Jing & Guo, 2007), Bi2O3 (Lakshmana Reddy et al., 2017) form type II heterojunctions.
g-C3N4 is a metal-free semiconductor which is normally synthesized by precursors such as urea, melamine, cyanamide etc. It is comprised of s-triazine or tri-s-triazine units as the structural monomers where the sheets resemble the structure of the honeycomb. Atoms of one sheet are interconnected via covalent bonds and the sheets are held together by Vander Waals forces (Yu et al., 2023). g-C3N4 has been coupled with other materials including TiO2 (Kobkeatthawin et al., 2022), ZnO (Geng et al., 2021), Fe2O3 (Pham et al., 2022), SnO2 (Van et al., 2022), V2O5 (Preeyanghaa et al., 2022), Bi2O4 (J. Yang et al., 2020), α-MoC1-x quantum dots (Zhu et al., 2022), charcoal (Yu et al., 2020) etc. and also with to maximize the charge separation as g-C3N4 is taken individually electron-hole pair recombination was found to be a problem which leads to lower photocatalytic activity.
According to our knowledge coupling of g-C3N4 with TiO2 doped with metals has not been reported in detail. Metal-doped TiO2 possess a reduced band gap being active in the visible range but shows low photocatalytic activity due to electron-hole pair recombination while as discussed above g-C3N4 also exhibits the same disadvantage. Therefore, coupling such two semiconductors would be advantageous as both the semiconductors are visible active. Hence, Cu doped TiO2 was coupled with g-C3N4 to form a z-scheme heterojunction and the photocatalytic activity of the synthesized nanocomposite was evaluated in the photodegradation of methylene blue.
2 Materials and methods
2.1 Materials
P25 TiO2 (99.5%) and Urea (99.5%) were purchased from Sigma Aldrich, German. CuCl2·2H2O (99%) was procured from Sisco Research Laboratories (Pvt) Ltd, India. Methylene blue (98%) was purchased from Himedia Laboratories (Pvt) Ltd, India. All the chemicals were used as it is without further purification. Distilled water was used for all the experiments.
2.2 Procedure
2.2.1 Synthesis of Cu-TiO2
P25 TiO2 was dispersed in distilled water. CuCl2·2H2O was dissolved in distilled water where the molar percentage of Cu was maintained at 1% with respect to Ti and the obtained solution was added dropwise to the solution containing P25 while stirring. Stirring continued for 24 h and the obtained precipitate was washed with distilled water until the filtrate was negative for Cl- ions for the AgNO3 test. Then the temperature was increased and maintained at 80 °C until all water evaporates. The resulting solid was ground and calcined at 450 °C for 2 h. The product is denoted as Cu-TiO2 in the text.
2.2.2 Synthesis of g-C3N4
The urea was annealed in a tube furnace at 550 °C for 4 h under N2 atmosphere and the resulting yellow colour product was washed with distilled water and ethanol, followed by drying at 80 °C.
2.2.3 Synthesis of Cu-TiO2/C3N4
g-C3N4 was mixed with Cu-TiO2 in different weight percentages as 10, 30 and 50 % and the product was sonicated for 1 h. The resulting mixture was hydrothermally treated at 180 °C for 15 h. The product obtained was washed with distilled water and ethanol and dried at 80 °C.
2.3 Characterization techniques
X-ray diffraction (XRD) patterns were collected using an Advance Bruker system using CuKα (λ = 0.154 nm) radiation and 2θ varying from 5°-80° at a scan speed of 2°/min. Raman spectra were acquired by a Bruker Senterra Raman microscope spectrometer. The morphology of the nanomaterials was observed by both scanning electron microscope (SEM) and transmission electron microscope (TEM). The transmission electron microscope was operated at 200 kV (JEOL - JEM – 2100). The sample (1 µl) was mounted on a holey carbon copper grid and allowed to dry at room temperature before TEM analysis. SEM images were collected by Hitachi SU6600 Analytical Variable Pressure FE-SEM (Field Emission Scanning Electron Microscope). Samples were mounted on a carbon tape pasted on a stub and the samples were sputtered with gold to neutralize the charge. The chemical composition of the samples was analyzed by X-ray fluorescence (XRF) using a HORIBA Scientific XGT-5200 X-ray analytical microscope equipped with a Rh anode X-ray tube operated at a maximum voltage of 50 kV. The surface chemistry of the nanomaterials was analyzed by X-ray photoelectron spectroscopy (XPS) using Thermo ScientificTM ESCALAB Xi + X-ray Photoelectron Spectrometer. Shimadzu 1800 UV/Visible spectrophotometer utilizing a precision Czerny-Turner optical system was used to analyze diffuse reflectance spectra of the prepared powder samples. The measurements were carried out through the range of 400 to 750 nm with a bandwidth of 1.0 nm (wavelength accuracy +- 0.1 nm). The absorbance of MB samples was measured by a Shimadzu UV-1990 double-beam UV–Visible spectrophotometer.
2.4 Photocatalysis
Each synthesized photocatalyst (200 mg) was shaken with 100 ml of 10 mg/L MB solution in dark for 1 h to reach the adsorption and desorption equilibrium during which aliquots were taken in different time intervals to study the adsorption kinetics. After that, the samples were exposed to a UV–Visible source operated with a 100 W mercury lamp (253 nm) and 100 W LED (589 nm) light and aliquots were withdrawn in 15 min time intervals to study the photocatalytic performance. To study the effect of scavengers EDTA (4 mM) and IPA (4 mM) were added just before exposing them to the light source. Similarly, to study the effect of persulfate on photocatalysis persulfate was added to the reaction mixture in different concentrations as 2, 4 and 8 mM and the photocatalysis experiments were carried out as described above.
3 Results and discussion
3.1 XRD analysis
XRD analysis was performed to determine the crystal structure of the synthesized nanomaterials. The XRD pattern of g-C3N4 shows two peaks at 13.00° and 27.04° which correspond to (1 0 0) and (0 0 2), respectively. XRD pattern of P25 TiO2 shows peaks at 27.57°, 36.18°, 41.37°and 56.73° which are attributed to (1 1 0), (1 0 1), (1 1 1) and (2 2 0) planes of the Rutile phase and the peaks at 25.46°, 37.95°, 38.72°, 39.31°, 48.17°, 54.07°, 55.18°, 62.83°, 68.94°, 70.34° and 75.21° assigned to (1 0 1), (1 0 3), (0 0 4), (1 1 2), (0 0 2), (1 0 5), (2 1 1),(2 0 4), (1 1 5), (2 2 0) and (2 1 5) the Anatase phase (Fig. 1 (a)). The same peaks were observed in Cu-TiO2 and Cu-TiO2 composited with g-C3N4. The Interlayer distance (d) and the crystallite size (L) of the synthesized nanomaterial were calculated by equations 1 and 2, respectively, where,
λ - wavelength of the X-ray source
θ - diffraction angle
L - crystallite size
β - half maximum of the peak in radians
K - Scherer's constant (0.9)
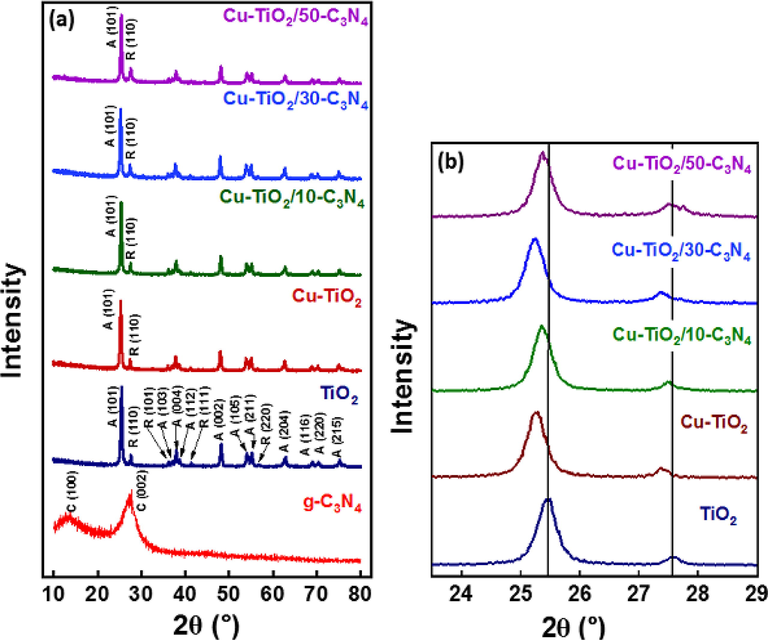
- (a) XRD pattern of the synthesized nanomaterials (b) partially enlarged XRD patterns between 24° and 29°.
The interlayer distance and the crystallite size of g-C3N4 were 0.3293 nm and 2.591 nm and the number of planes in the synthesized g-C3N4 was 8. (1 0 1) plane of the Anatase phase and (1 1 0) of Rutile phase was considered for the calculation of the interlayer distance and crystallite size of those phases in P25 TiO2 and they were calculated to be 0.3495 nm and 18.622 nm, respectively, for Anatase phase and 0.3232 nm and 29.263 nm, respectively, for Rutile phase. The number of planes in the Anatase phase is 53 and in the Rutile phase is 90.
Peaks corresponding to the same planes were considered for calculations of the same parameters in Cu-TiO2 and Cu-TiO2 composited with g-C3N4. Table 1summarizes all the data calculated relative to the crystalline structure of the synthesized nanomaterials. But peak positions of the (1 0 1) plane of Anatase and (1 1 0) plane of Rutile reduced in Cu doped sample than that of P25 suggesting the lattice distortion which may have occurred during doping of Cu (Fig. 1 (b)). No crystal peaks corresponding to Cu or oxide of Cu were observed suggesting that Cu has successfully doped to the P25 lattice. Generally, the crystallite size of the Anatase phase increased with the doping of Cu and compositing with g-C3N4. However, no such trend in crystallite size was observed with the Rutile phase. The interlayer distance of both Anatase and Rutile did not change upon doping with Cu or g-C3N4. This suggests that Cu2+ ions have been doped to the Anatase crystal structure of P25. The ionic radius of Cu2+ (73 pm) is quite similar to the ionic radius of Ti4+ (74 pm). Metal ions could be doped to TiO2 interstitially or substitutionally and as the cationic radii of both are quite similar it is suggested that Cu2+ have replaced Ti4+ in the Anatase phase of TiO2 lattice. Further, the absence of peaks attributed to Cu or oxide of Cu could be due to the good dispersion of those compounds if they have formed at the low concentration of Cu (1%) introduced during the synthesis.
Sample
Crystal Plane
2θ (°)
L (nm)
d (nm)
L/d
g-C3N4
C (0 0 2)
27.05
2.591
0.3293
8
TiO2
A (1 0 1)
25.45
18.622
0.3495
53
R (1 1 0)
27.57
29.263
0.3232
90
Cu-TiO2
A (1 0 1)
25.26
18.995
0.3521
54
R (1 1 0)
27.37
21.240
0.3254
65
Cu-TiO2/10- C3N4
A (1 0 1)
25.36
19.317
0.3508
55
R (1 1 0)
27.49
27.816
0.3240
85
Cu-TiO2/30- C3N4
A (1 0 1)
25.24
18.996
0.3525
54
R (1 1 0)
27.37
21.240
0.3255
65
Cu-TiO2/50- C3N4
A (1 0 1)
25.36
19.456
0.3507
55
R (1 1 0)
27.57
14.907
0.3232
46
3.2 Raman analysis
Raman analyses were performed to confirm the crystal structure suggested by XRD analysis (Fig. 2). The Raman spectrum of P25 TiO2 shows peaks at 143 cm−1, 196 cm−1, 396.5 cm−1, 515 cm−1 and 638.5 cm−1 which are attributed to Eg, Eg, B1g, A1g and Eg vibrational modes of Anatase phase (Balachandran & Eror, 1982; Hardcastle, 2011). Peaks relevant to the vibrational modes of the Rutile phase were absent. The Raman spectrum of Cu-TiO2 is identical to that of P25. However, the peak corresponding to the Eg band appeared in P25 at 143 cm−1 while that in Cu-TiO2 appeared at 144 cm−1 suggesting a lattice distortion upon doping with Cu being consistent with the XRD analysis. The Raman spectrum of Cu-TiO2/50-C3N4 is also identical to that of P25 and no peaks corresponding to g-C3N4 were observed.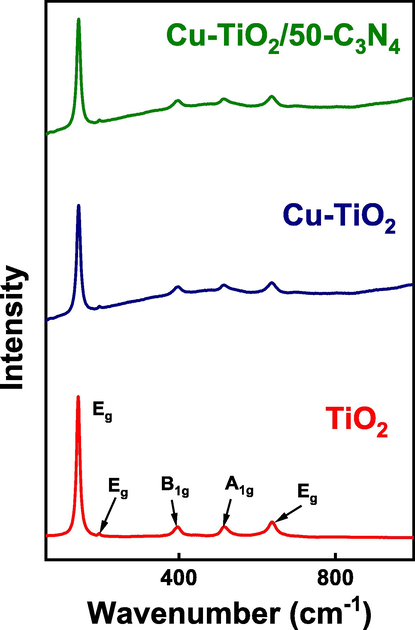
Raman spectra of TiO2, Cu-TiO2 and Cu-TiO2/50-C3N4.
3.3 TEM analysis
Transmission Electron Microscopy (TEM) is used to study the morphology of nanomaterials synthesized at the nanoscale. TEM image of g-C3N4 (Fig. 3 (a)) shows that thin and fluffy g-C3N4 nanosheets are arranged as tremella-like layers. Further, a mesoporous network has been formed in the nanosheets of g-C3N4 as revealed in Fig. 3 (b) due to the polymerization and the elimination of gas molecules during the annealing process. Nitrogen and oxygen in the reaction system can generate gas bubbles splitting the polymer when it polymerizes resulting in stripping g-C3N4 layers into small layers producing a fluffy structure. TEM image of P25 TiO2 (Fig. 3 (c)) shows spherical homogeneously distributed nanoparticles along with some aggregated irregular shape particles. The crystalline plane arrangement of P25 TiO2 is exhibited in the Higher resolution TEM (HRTEM) image (Fig. 3 (d)). Calculated interlayer distances, 0.23 nm and 0.35 nm correspond to the (1 0 3) plane and (1 0 1) plane of the Anatase phase, respectively. Cu-TiO2 nanoparticles show spherical and irregular shape nanoparticles with some agglomerations (Fig. 3 (e)). HRTEM of Cu-TiO2 (Fig. 3 (f)) clearly shows crystalline plane arrangements with interlayer distances of 0.35 nm and 0.32 nm, corresponding to the (1 1 0) plane of Anatase and (1 0 1) plane of the Rutile phase, respectively. TEM image of Cu-TiO2/50-C3N4 (Fig. 3 (g)) shows spherical and aggregated nanoparticles heterogeneously distributed on a fluffy nanosheet mesoporous network. HRTEM image of Cu-TiO2/50-C3N4 (Fig. 3 (h)) shows the interlayer distances 0.35 nm and 0.23 nm corresponding to (1 0 1) and (1 0 3) planes of Anatase phase, respectively further supporting the crystal nature of the nanoparticles in the composite.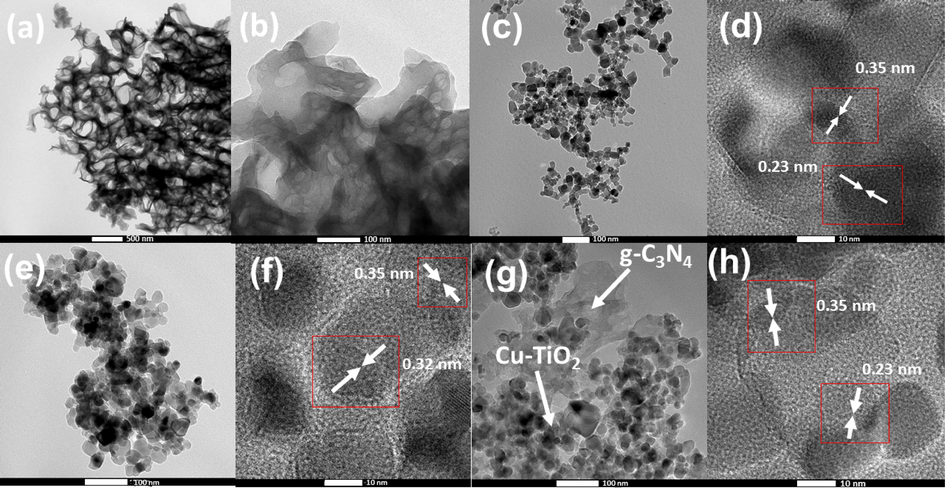
TEM images of (a) g-C3N4 at low magnification (b) g-C3N4 at high magnification (c) P25 TiO2 (d) HRTEM image of P25 TiO2 (e) TEM image of Cu-TiO2 (f) HRTEM image of Cu-TiO2 (g) TEM image of Cu-TiO2/50-C3N4 (h) HRTEM image of Cu-TiO2/50-C3N4.
3.4 SEM analysis
SEM images were collected to study the morphology of the synthesized nanomaterials. SEM image of P25 TiO2 (Fig. 4 (a)) shows the spherical and irregularly shaped nanoparticles with some agglomerations. Upon doping with Cu further agglomerations were observed which could have occurred during the synthesis and annealing (Fig. 4 (b)). SEM image of g-C3N4 (Fig. 4 (c)) exhibited a properly developed macropore structure where ligaments are interconnected to form a disordered macropore network and the insert of Fig. 4 (c) shows the irregularity of the macropores in high magnification. g-C3N4 possesses a well-established mesopore structure as shown in the TEM image (Fig. 3 (b)). These mesopores and macropores together form a hierarchical porous system where the two porous systems are interconnected forming channels for the reagents and products to pass through which is an important characteristic in catalysis. However, such porous structure has been disturbed upon coupling with Cu-TiO2 as shown in Fig. 4 (d) in Cu-TiO2/50-C3N4, as the nanoparticles which are high in weight proportion of the composite, mask and block the porous system. Further, Cu-TiO2 nanoparticles are properly distributed on the g-C3N4 matrix which would facilitate the physical connection of the two materials, Cu-TiO2 and g-C3N4, making them ideal candidates in catalysis.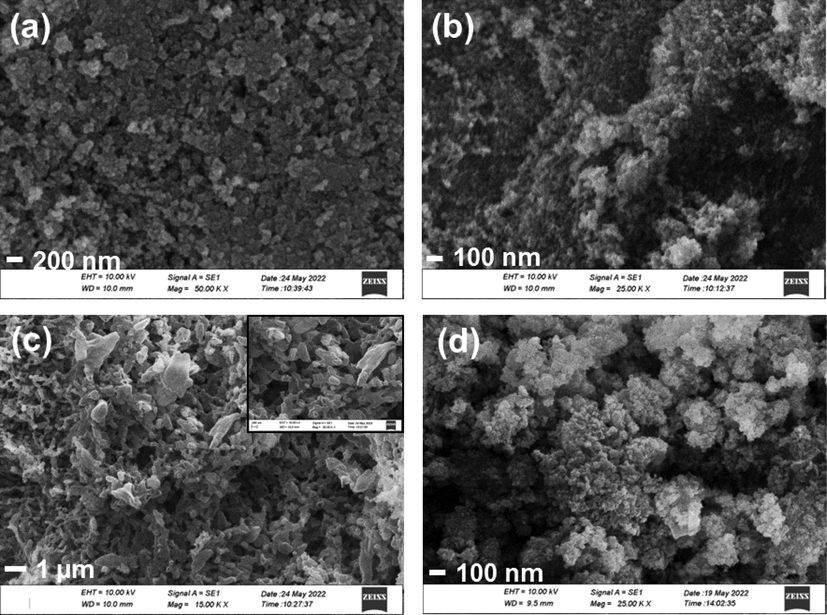
SEM images of (a) P25 TiO2 (b) Cu-TiO2 (c) g-C3N4 (d) Cu-TiO2/50- C3N4.
Brunauer-Emmett-Teller (BET) surface area analysis was performed to study the surface area and the pore size distribution of the samples. Adsorption desorption isotherms and the pore size distribution curves of TiO2, Cu-TiO2, and Cu-TiO2/50-C3N4 are shown in Supplementary Figure 1 (a) and (b), respectively. Isotherms exhibited type IV behaviour indicating the mesoporous structure. The surface area of Cu-TiO2 (82.76 m2/g) is lesser than that of TiO2 (110.99 m2/g) indicating the agglomeration resulted during doping while the surface area of Cu-TiO2/50-C3N4 (35.46 m2/g) is lesser than both. No significant change was found in the total pore volume of Cu-TiO2 (0.38 cc/g) and TiO2 (0.37 cc/g), and that of Cu-TiO2/50-C3N4 (0.08 cc/g) was very low. The pore radius of Cu-TiO2 (9.12 nm) is greater than that of TiO2 (6.66 nm) indicating the generation of more meso and micropores while doping and the pore radius of Cu-TiO2/50-C3N4 is 4.38 nm.
3.5 XPS analysis
X-ray photoelectron spectra were collected to study the surface of the synthesized catalysts. The survey spectrum of P25 TiO2 (Fig. 5 (a)) shows the presence of C, Ti and O and the survey spectrum of Cu-TiO2 (Fig. 5 (b)) exhibits the presence of Cu in addition to C, Ti and O. The presence of C, N and O was revealed in the survey spectrum of g-C3N4 (Fig. 5 (c)) while the survey spectrum of Cu-TiO2/50-C3N4 (Fig. 5 (d)) indicates the presence of all C, O, N, Ti and Cu. The higher-resolution spectra of the synthesized materials were collected to study surface chemistry in detail. The higher resolution spectrum of C 1 s of P25 TiO2 (Fig. 5 (e)) was deconvoluted to three peaks centered at 284.5, 286.2 and 288.5 eV which are attributed to sp2 hybridized C=C, C-O and O-C=O, respectively. The higher resolution spectrum of C 1 s of g-C3N4 is given in Fig. 4 (f) and is deconvoluted to three main peaks centered at 284.5, 288 and 293.4 eV, which are attributed to the sp2 hybridized graphitic C (C–C), sp2 hybridized carbon in N-C=N and π-π transitions, respectively. Interestingly the two peaks appeared at 284.5 and 287.16 eV in the higher resolution spectrum of C 1 s of Cu-TiO2/50-C3N4 (Fig. 5 (g) which were assigned to C=C and N-C=N, respectively. The binding energy of the peak corresponding to N-C = N has shifted to lower binding energy due to the interfacial interactions of g-C3N4 with Cu-TiO2. The higher resolution spectrum of O 1 s of P25 TiO2 (Fig. 5 (h)) is deconvoluted to two peaks at 529.95 and 530.85 eV. The peak at 529.95 eV is assigned to oxygen bound to Ti while the peak at 530.85 eV represents Ti2O3 further revealing the presence of both Ti4+ and Ti3+ in P25 TiO2. The higher resolution spectrum of O 1 s of Cu-TiO2 (Fig. 5 (i) is deconvoluted into three peaks at 529.26, 530.6 and 531.71 eV where the third new peak is attributed to the oxygen present in the hydroxyl group or physisorbed water. The higher resolution spectrum of Ti 2p of P25 TiO2 (Fig. 5 (j)) shows the spin-orbital coupling where the 2p3/2 and 2p1/2 peaks of Ti4+ appeared at 458.2 and 463.8 eV, respectively, while the peak at 456.12 eV with low intensity corresponds to the 2p3/2 of Ti3+. The appearance of Ti 2p peaks in the higher resolution spectrum of Ti 2p of Cu-TiO2 (Fig. 5 (k)) is different to that of P25 TiO2. The peak that appeared at 458.6 eV could be attributed to the Ti3+ and the peak at 459.4 eV could be assigned to the Ti4+ of TiO2 and the binding energy has shifted to higher values upon doping of Cu. As described in the XRD section Cu2+ replaces Ti4+ when Cu is doped to TiO2 because the cationic radii are quite similar. However, once Cu2+ replaces the Ti4+ ¸it creates a charge imbalance where an oxygen atom is also removed creating an oxygen vacancy to compensate for the balance. The most stable site to create the oxygen vacancy is the oxygen site neighbouring to the Cu dopant. Once an oxygen atom is removed the adjacent Cu and Ti ions to which the removed oxygen atom was bound would have five-fold coordination and thus produce the Ti3+ state (Mathew et al., 2018). The higher resolution spectrum of Cu 2p of Cu-TiO2 (Fig. 5 (l)) shows the spin-orbital coupling where the 2p3/2 and 2p1/2 appeared at 933.26 and 953.01 eV, respectively, indicates the presence of Cu2+. The higher resolution spectrum of N 1 s of g-C3N4 (Fig. 5 (m)) shows four sub-peaks at 398.5, 400, 401 and 404 eV, which are assigned to sp2 hybridized N in s-triazine rings (C-N=C), N-C3, N atoms in the heptazine ring and as bridging atom, and π-excitations, respectively. The higher resolution spectrum of N 1 s of Cu-TiO2/50-C3N4 (Fig. 5 (n)) shows only two peaks at 397.6 and 399 eV in which the binding energies have decreased due to the interfacial linkage occurs between g-C3N4 and Cu-TiO2 during the formation of the composite (Tan et al., 2015). The higher resolution spectrum of Ti 2p (Fig. 5 (o)) and Cu 2p (Fig. 5 (p)) of Cu-TiO2/50-C3N4 shows the presence of Ti4+ (458.2 eV) and Cu2+ (933.06 eV), respectively, indicating that unstable Ti3+ has oxidized to Ti4+ in coupling with g-C3N4 during hydrothermal synthesis.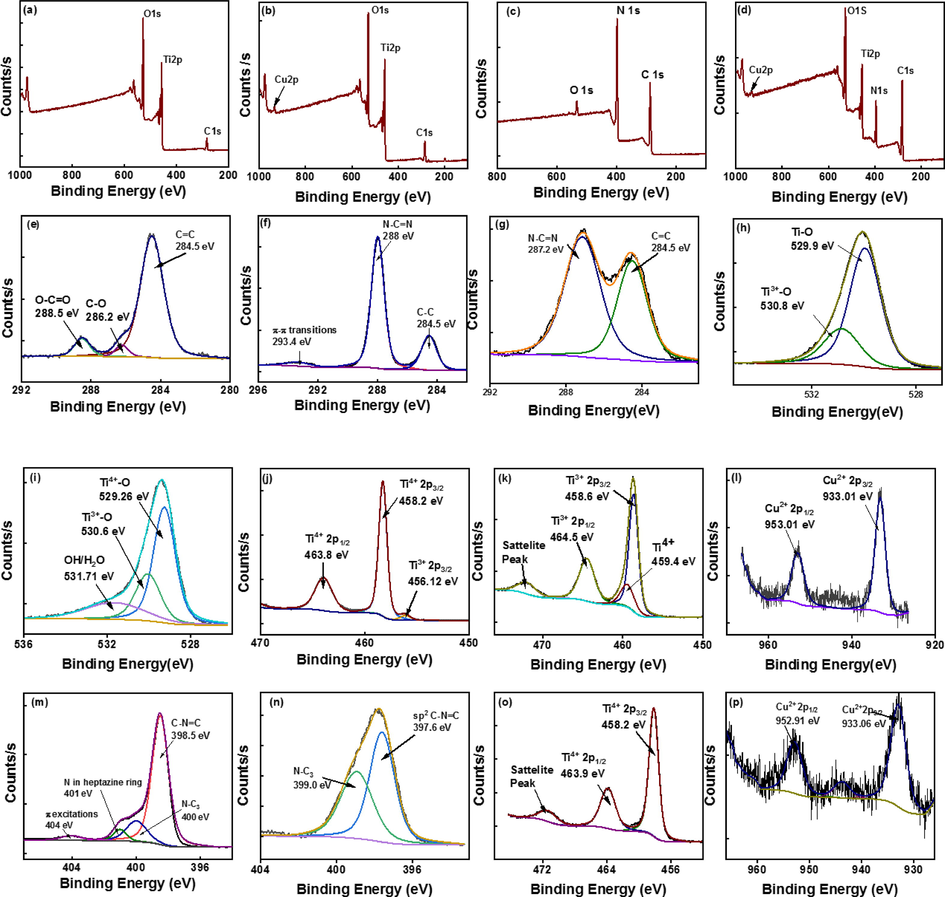
Survey spectra of (a) P25 TiO2 (b) Cu-TiO2 (c) g-C3N4 (d) Cu-TiO2/50-C3N4, C 1 s higher resolution spectrum of (e) P25 TiO2 (f) g-C3N4 (g) Cu-TiO2/50-C3N4, O 1 s higher resolution spectrum of (h) P25 TiO2 (i) Cu-TiO2, Ti 2p higher resolution spectrum of (j) P25 TiO2 (k) Cu-TiO2, of (l) Cu 2p higher resolution spectrum Cu-TiO2, N 1 s higher resolution spectrum of (m) g-C3N4 (n) Cu-TiO2/50-C3N4 (o) Ti 2p higher resolution spectrum of Cu-TiO2/50-C3N4 (p) Cu 2p higher resolution spectrum of Cu-TiO2/50-C3N4.
3.6 XRF analysis
XRF analysis was performed to understand the elemental composition. Six spots were chosen from each sample to perform the analysis to study the elemental distribution throughout the sample. TiO2 purely contain only Ti as shown in Table 2. Cu-TiO2 sample contains an average of 98.35 wt% of Ti and an average of 1.65 wt% of Cu where both the elements are uniformly distributed in all six places analyzed suggesting the homogeneous distribution of Cu on Ti. Therefore, it is evident that Cu has homogeneously doped to TiO2 lattice.
Sample
Element
Spot 1
Mass %Spot 2
Mass %Spot 3
Mass %Spot 4
Mass %Spot 5
Mass %Spot 6
Mass %
P25 TiO2
Ti
100
100
100
100
100
100
Cu-TiO2
Ti
98.38
98.31
98.38
98.38
98.31
98.31
Cu
1.62
1.69
1.62
1.62
1.69
1.69
3.7 UV–Visible diffuse reflectance spectroscopy
The optical absorption behaviours of the synthesized photocatalysts were evaluated by UV–Visible diffuse reflectance spectroscopy (Supplementary Figure 2 (a)). It could be seen that the TiO2 exhibits the UV range with an absorption edge at 400 nm. The absorption edge of g-C3N4 appeared at 425 nm indicating the visible range absorption while that of Cu/TiO2 is further shifted towards the visible range suggesting high visible light absorption. The behaviours of the absorption spectra of Cu-TiO2/g-C3N4 were quite similar where they indicate visible light sensitivity of the heterojunctions. Tauc plots were constructed using the formula shown in equation 3 to determine the band gap of the synthesized nanomaterials.
Where hv, A, Eg and a represent the photon energy, absorption coefficient, band gap energy and a constant, respectively (Q. Li et al., 2007). n = 2 denotes the direct transitions and n = 1/2 indicates indirect transitions, and the plots corresponding to indirect and direct transitions are shown in Fig. 6 and Supplementary Figure 2 (b), respectively.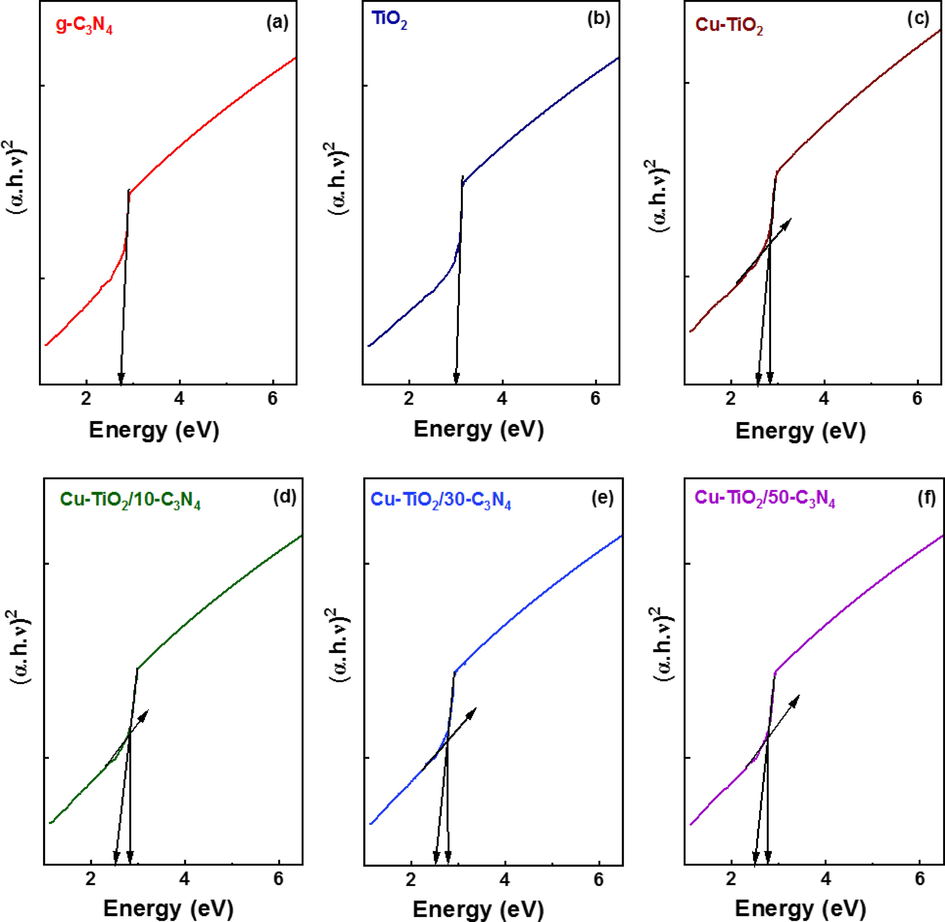
Tauc plots indicating the indirect transitions of (a) g-C3N4 (b) TiO2 (c) Cu-TiO2 (d) Cu-TiO2/10-C3N4 (e) Cu-TiO2/30-C3N4 (f) Cu-TiO2/50-C3N4.
The behaviours of the plots suggest that the indirect transition is more feasible in the synthesized nanomaterials. The band gap of TiO2 was 3.00 eV while that of g-C3N4 is 2.81 eV. The band gap of Cu-TiO2 is found to be 2.67 eV exhibiting prominently visible absorption. A new energy level is created below the CB of TiO2 narrowing down the band gap and further enhancing the visible light absorption. However, the band gap values of g-C3N4 coupled Cu-TiO2 were higher than that of Cu-TiO2 and were similar to each other and to that of g-C3N4. This could be due to the sample used for the analysis being more concentrated with g-C3N4. Further, the particle size directly contributes to the band gap whereas in general particle size is inversely proportional to the band gap. The size of the nanoparticles greatly affects the band gap where the band gap values increase as the particle size decreases. Holes in the valence band and electrons in the conduction band become confined with decreasing particle size and due to this confinement in the electrons and holes the band gap between the valence and conduction bands increases. The shape of the nanomaterials contributes to the band gap values. Volume to surface area ratio varies as the size and shape of the nanomaterials change which contributes to the variation in the number of surface atoms and hence the cohesive energy. Therefore, the band gap varies at the nanoscale due to the change in size and shape (Singh et al., 2018). Therefore, the obtained band gap values are a result of collective factors. It is evident that the coupled heterojunction composites are visible active for photocatalysis. All the calculated band gap values are tabulated in Table 3.
Sample
Band Gap (eV)
for direct transitions (n = 2)
Band Gap (eV) for
indirect transitions (n = 1/2)
g-C3N4
2.73
2.81
TiO2
3
3
Cu-TiO2
2.59
2.67
Cu-TiO2/10-C3N4
2.84
2.88
Cu-TiO2/30-C3N4
2.78
2.84
Cu-TiO2/50-C3N4
2.76
2.82
3.8 Photocatalysis
The photocatalytic activity of the synthesized nanomaterials was evaluated on the degradation of methylene blue under the exposure of UV and visible light. Before exposure to the light, source catalysts were shaken in dark for one hour to reach the adsorption–desorption equilibrium. Adsorption kinetics were studied using pseudo-first-order and pseudo-second-order kinetics models as shown in Fig. 7 (a) and (b). The respective rate constants and the correlation coefficient values are tabulated in Table 4. It is evident that the adsorption followed pseudo-second-order kinetics with a high R2 value suggesting chemisorption of MB to the catalysts. Then the samples were exposed to the light source and the aliquots were withdrawn in 15 min time intervals (Fig. 8). Obtained data were fitted to the first-order kinetics model and the obtained data are tabulated in Table 5. Cu-TiO2/50-C3N4 showed the highest rate constant (4.4 × 10⁻³ min−1) for the photodegradation of MB followed by Cu-TiO2/30-C3N4 (4.1 × 10⁻³ min−1). The photocatalytic activity of Cu-TiO2/50-C3N4 is 9.8 times greater than that of g-C3N4, 4 times greater than Cu-TiO2 and 5 times greater than that of TiO2. g-C3N4 is a visible active photocatalyst and the least photocatalytic activity was observed with g-C3N4 due to the electron-hole pair recombination. Pure TiO2 is only active in the UV range leading to lower photocatalytic activity. Upon doping with Cu, the band gap reduces as a new energy level is constructed below the CB of TiO2 increasing the visible light sensitivity. Therefore, the photocatalytic activity of Cu-TiO2 is higher than that of TiO2. Cu-TiO2/C3N4 composites showed comparatively higher photocatalytic activity due to the proper band alignment which enhances the charge separation and the presence of two visibly active semiconductors, Cu-TiO2 and g-C3N4. Photocatalytic activity of Cu-TiO2/30-C3N4 and Cu-TiO2/10-C3N4 was lower due to the low weight ratio between Cu-TiO2 and g-C3N4 which leads to improper formation of the heterojunction. Therefore, it could be concluded that Cu-TiO2/50-C3N4 is the most sustaining photocatalyst among the nanomaterials synthesized for the degradation of MB. MB was not degraded upon exposure to the light source without any catalyst as shown in the supplementary figure 3.
Mechanism of Photocatalysis
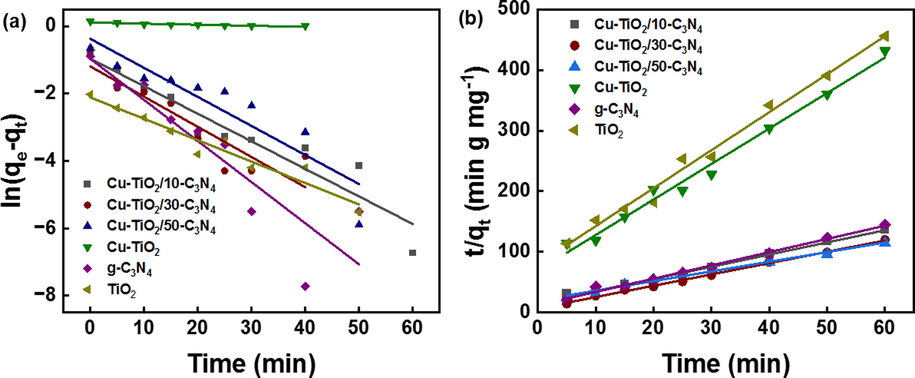
- (a) Pseudo-first-order (b) Pseudo-second-order adsorption kinetic model for adsorption of MB to the synthesized nanomaterials.
| Sample | 1st order rate constant (min−1) | R2 |
2nd Order rate Constant (mg g−1 min−1) |
R2 |
|---|---|---|---|---|
| Cu-TiO2/10-C3N4 | 0.091 | 0.89 | 0.243 | 0.99 |
| Cu-TiO2/30-C3N4 | 0.107 | 0.79 | 0.436 | 0.99 |
| Cu-TiO2/50-C3N4 | 0.100 | 0.82 | 0.122 | 0.98 |
| Cu-TiO2 | 0.004 | 0.8 | 0.479 | 0.99 |
| g-C3N4 | 0.144 | 0.79 | 0.345 | 0.99 |
| TiO2 | 0.070 | 0.93 | 0.481 | 0.99 |
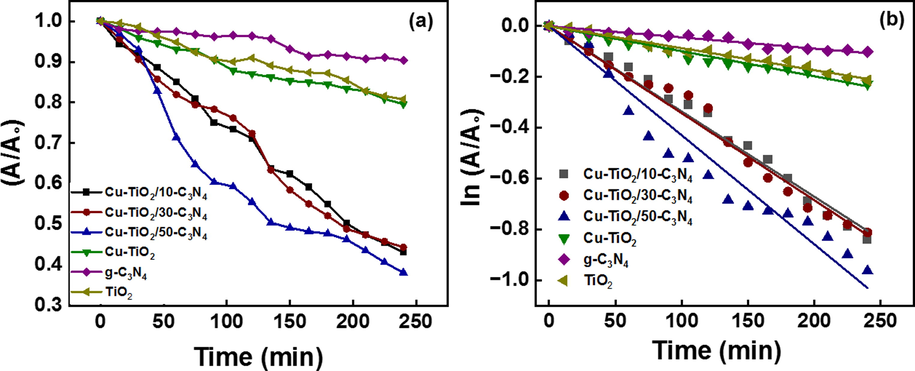
- Photocatalytic degradation of MB in the presence of the synthesized photocatalysts following (a) photocatalytic degradation (b) pseudo-first-order kinetics model.
| Sample | 1st Order rate constant (min−1) |
R2 | 1st Order rate constant in the presence of 4 mM persulfate (min−1) |
|---|---|---|---|
| Cu-TiO2/10-C3N4 | 3.9 × 10⁻³ | 0.99 | 4.9 × 10⁻² |
| Cu-TiO2/30-C3N4 | 4.1 × 10⁻³ | 0.99 | 1.3 × 10⁻¹ |
| Cu-TiO2/50-C3N4 | 4.4 × 10⁻³ | 0.99 | 7.9 × 10⁻² |
| Cu-TiO2 | 1.1 × 10⁻³ | 0.99 | 5.6 × 10⁻² |
| g-C3N4 | 4.5 × 10⁻⁴ | 0.97 | 6.3 × 10⁻² |
| TiO2 | 8.7 × 10⁻⁴ | 0.99 | 4.9 × 10⁻² |
The engineering of the structure of the heterostructure is important to determine the mechanism of photocatalysis. The band gap values of Cu-TiO2 and g-C3N4 calculated from the Tauc plots are 2.67 and 2.80 eV, respectively. The band edge potentials of the conduction band (ECB) and the valence band (EVB) of the above semiconductors were calculated by the formula (4) and (5), respectively.
where X is the electronegativity of the semiconductor, which is the geometric mean of the electronegativity of the constituent atoms, and EC is the energy of the free electrons on the hydrogen scale which is approximately 4.5. X value for Cu-TiO2 is assumed to be similar to that of TiO2 (5.81) as the percentage of Cu incorporated is low compared to Ti (1%) and that of g-C3N4 is 4.73. ECB calculated for TiO2 (Rutile), TiO2 (Anatase) Cu-TiO2 and g-C3N4 are −0.19, −0.39, −0.03 and – 1.18 eV/normal hydrogen electrode (NHE), respectively, and the EVB calculated are 2.81, 2.81, 2.65, and 1.64 eV/normal hydrogen electrode (NHE), respectively. A homojunction was established between the Rutile and Anatase phases of P25 TiO2 as shown in Fig. 9 (a) where the CB band of Rutile lies below that of Anatase facilitating the migration of electrons from the CB of Anatase to that of Rutile. The potential of the VB of both TiO2 Rutile and Anatase (2.81 eV) is greater than that of the standard potential of OH●/OH– (1.99 eV) and OH●/H2O (2.68 eV) facilitating the oxidation of both OH– and H2O to produce OH●. Further, the potential of the CB of TiO2 (Anatase) (-0.39 eV) is greater than that of the standard potential of O2/O2–● (-0.33 eV) favouring the reduction of O2 to O2–●. However, the potential of the CB of TiO2 (Rutile) (-0.19 eV) is smaller than the standard potential of O2/O2–● and hence prohibits the reduction of O2 to O2–●. Further, as the potential of the CB of TiO2 (Rutile) is lower than that of TiO2 (Anatase) there is a net electron transfer from the CB of TiO2 (Anatase) to the CB of TiO2 (Rutile). Hence, the probability of the reduction of O2 to O2–● is lower than expected. Therefore, such produced OH● and O2–● degrade the MB molecules in the presence of UV light. As discussed in the XRD analysis Cu2+ ions have been mainly doped to the TiO2 (Anatase) phase of P25 TiO2 lowering the band gap to 2.67 eV and the CB of Cu-TiO2 lies at −0.03 eV while the VB would be located at 2.64 eV cresting a type I heterojunction. Further, the electrons will travel from the CB of TiO2 (Rutile) to the CB band of Cu-TiO2 while the holes will migrate from the VB of the TiO2 (Rutile) to the VB of Cu-TiO2 and hence cause electron hole pair recombination leading to poor charge separation. The oxidation of H2O to OH● is feasible at the VB of TiO2 (Rutile) but would occurrence be limited as the holes are migrated to the VB of Cu-TiO2 due to the favourable potential difference as shown in Fig. 9 (b). The oxidation of OH– to OH● is favourable and occurs at high probability at the VB of Cu-TiO2 due to the flow of holes to the VB of Cu-TiO2. Hence, OH● contribute to the degradation of MB by Cu-TiO2. The photocatalytic activity of this photocatalyst is comparatively higher than that of both pure TiO2 and g-C3N4 due to its high visible activity. The electrons which migrated to the CB of the Cu-TiO2 from TiO2 (Rutile) then travelled to the VB of g-C3N4 of Cu-TiO2/C3N4 as the z-scheme band alignment created due to the potential difference of the CB of Cu-TiO2 and the VB of g-C3N4 favour the electron transfer. Additional to the reactions occurred at Cu-TiO2 electrons at the VB of g-C3N4 get excited to the CB and the reduction of O2 to O2–● happens at the CB of g-C3N4 as the potential of the CB of g-C3N4 (-1.18 eV) is greater than the reduction potential of O2/O2–●. Hence, both OH● and O2–● are responsible for the degradation of MB in the presence of Cu-TiO2/C3N4 as the photocatalyst.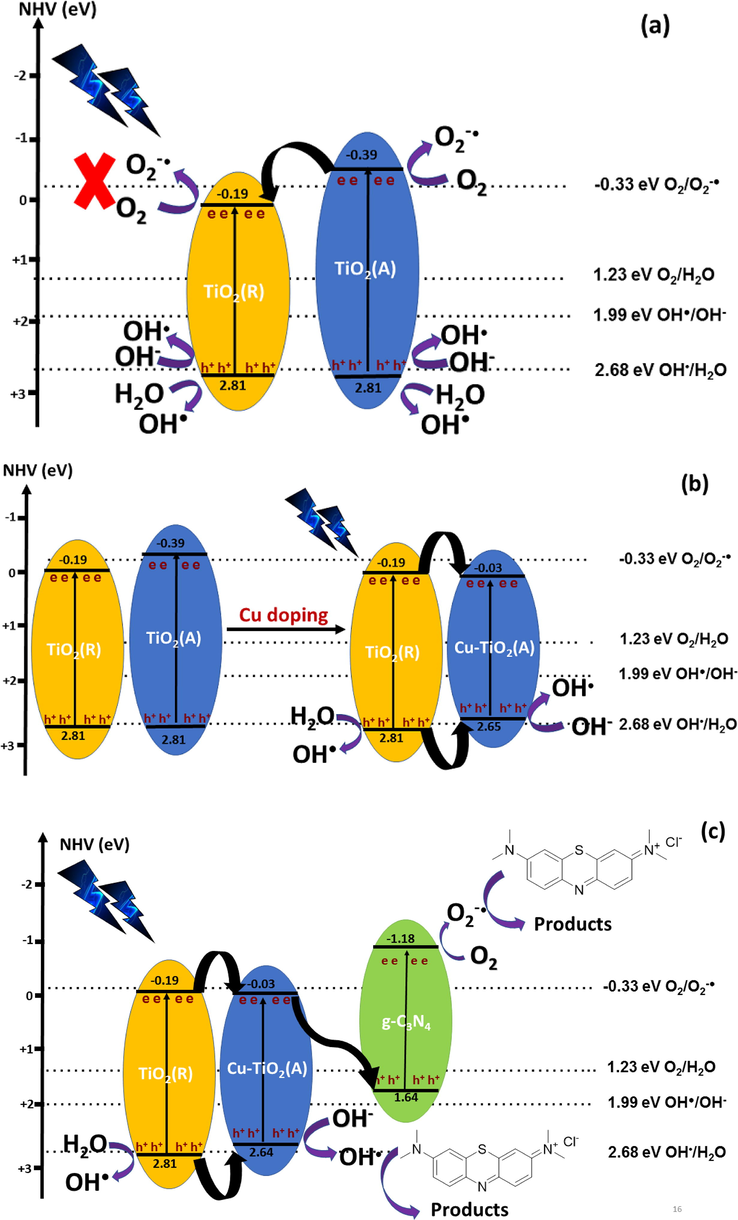
Band alignment of (a) P25 TiO2 (b) Cu-TiO2 (c) Cu-TiO2/g-C3N4.
Cu-TiO2/50 g-C3N4 showed the highest rate constant (4.4 × 10⁻³ min−1) due to the proper ratio of mixing Cu-TiO2 with g-C3N4. Composites made with other ratios where 10% and 30% g-C3N4 were coupled with Cu-TiO2 also effectively contributed to the photodegradation of MB but with lesser activity as the heterojunctions with the proper ratio were not formed. The rate constant per surface area of Cu-TiO2/50 g-C3N4 (1.24 × 10⁻⁴ min−1/m2.g−1) is greater than that of Cu-TiO2 (1.3 x10⁻⁵ min−1/m2.g−1) and TiO2 (7.8 × 10⁻⁶ min−1/m2.g−1) further indicate that the coupling of Cu-TiO2 with g-C3N4 has greatly enhanced the photocatalytic activity.
XPS analysis further supports the above-proposed mechanism. The higher resolution spectrum of N1s of Cu-TiO2/50-C3N4 showed 0.9 eV and 1.0 eV downshifts of the binding energy of the peaks corresponding to C-N = C and N-C3, respectively, compared to those of pure g-C3N4 indicating an increase in the electron density. Hence, those electrons present in the CB of g-C3N4 of Cu-TiO2/50-C3N4 are taken by the O2 and get reduced to O2–● which converts MB to harmless products (Thambiliyagodage, Usgodaarachchi, et al., 2022). Further, the binding energy of Ti 2p of Ti4+ of Cu-TiO2/50-C3N4 shows a 1.2 eV downshift compared to that of Cu-TiO2, while a 0.2 eV downshift in the Cu 2p was also observed in Cu-TiO2/50-C3N4 compared to Cu-TiO2. This indicates an increase in the electron density in the CB of Cu-TiO2 of Cu-TiO2/50-C3N4 which is due to the electron flow from g-C3N4 as suggested by described band alignment. Higher resolution spectra of Cu-TiO2/50-C3N4 used for the photocatalytic reaction (Cu-TiO2/50-C3N4 – L) were acquired to further support the charge transfer mechanism. The higher resolution spectrum of Ti 2p Cu-TiO2/50-C3N4 – L was deconvoluted into five peaks as shown in supplementary figure 4 (a). The peak at 458.7 eV is attributed to the Ti3+ while the peak at 460.9 eV is ascribed to Ti4+ of Ti 2p3/2. The peaks at 464.4 and 466.5 eV correspond to the 2p1/2 of the Ti3+ and Ti4+, respectively. Though only Ti4+ was present in the Cu-TiO2/50-C3N4 interestingly both Ti3+ and Ti4+ were present in the same catalyst which was exposed to the photocatalytic reaction. As shown in Fig. 9 photogenerated electrons in the VB band of TiO2 (Rutile) are transferred to the VB of TiO2 (Anatase) and hence the Ti4+ of anatase reduced to Ti3+ greatly where the ratio of Ti4+/ Ti3+ is 1:2 indicating that 2/3 of Ti4+ have been reduced to Ti3+ when exposed to the reaction in the presence of the light source. The higher resolution spectrum of N 1 s of Cu-TiO2/50-C3N4 – L (supplementary figure 4 (b)) was deconvoluted to three peaks where an additional peak at 398.5 eV corresponding to N in the pyridine ring appeared which indicates the adsorption of MB molecules to the catalyst surface during the catalytic reaction as the MB molecule possesses a pyridine ring in its structure (supplementary figure 5).
To identify the reactive species, the study was conducted in the presence of EDTA and IPA as they scavenge the holes and OH●, respectively. The rate constant for the photodegradation of MB decreased to 3.2 × 10⁻⁴ and 2.9 × 10⁻³ min−1, respectively, in the presence of EDTA and IPA which are 13.8 and 1.5 times lesser than the rate constant when no scavenger is used (4.4 × 10⁻³ min−1) (Fig. 10 (a)). The percentage conversion of MB in the presence of EDTA and IPA reduced to 8 and 48 %, respectively, indicating that both holes and OH● have contributed to the photodegradation of MB where the effect from holes for the photocatalysis is 9.1 times greater than that from OH● (Fig. 10 (b)).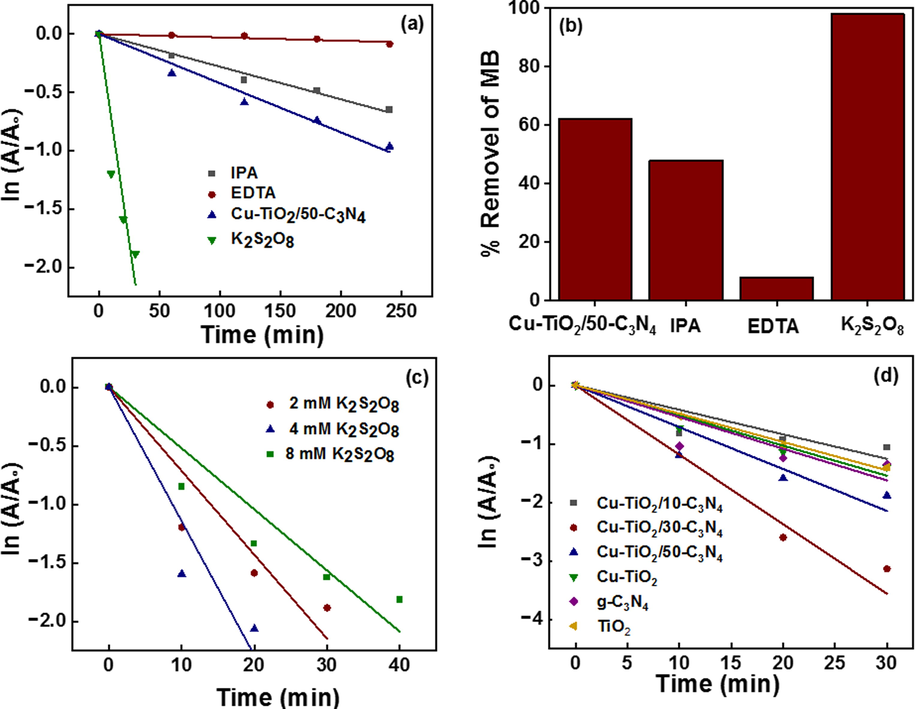
(a) First order kinetics model for the catalytic system with additives; IPA, EDTA, K2S2O8, and no additive (b) % removal of MB with the additives (c) First order kinetics model for the catalytic system with varying concentrations of K2S2O8, (d) effect of K2S2O8 on all the catalytic systems.
The rate constant was increased to 7.9 × 10⁻² min−1 with the addition of persulfate (S2O82-) ions to the medium which increased the rate by 18 times because the SO4-● and OH● produced by the reduction of S2O82- readily degrade MB increasing the conversion of MB to 98% compared to 62 % resulted when persulfate was not used. S2O82- ions are reduced to SO4-● as shown in reaction 1 by the photogenerated electrons and such produced SO4-● reacts with OH– in the medium to produce SO42- and OH● (reaction 2). Further, in the presence of UV light S2O82- degrades to produce 2SO4-● (reaction 3) which would react with OH– to produce OH●. Moreover, in the presence of O2–●, S2O82- produce SO42-, SO4-● and O2 as shown in reaction 4. Additionally, the standard reduction potential of S2O82-/2SO4-● (2.01 eV) is lesser than EVB of Cu-TiO2, the longer O-O bond (1.497 Å) and easiness to break the O-O bond with less energy to produce OH●, making S2O82- a better candidate to improve the reaction rate. The concentration of S2O82- was varied as 2, 4 and 8 mM to study the optimum concentration of S2O82- and the rate constants for the photodegradation of MB were calculated to be 5.6 × 10⁻², 7.9 × 10⁻² and 1.2 × 10⁻¹ min−1, respectively (Fig. 10 (c)). The rate constant increased with increasing concentration of S2O82- as the concentrations of produced SO4-● and OH● increase with increasing concentration of S2O82-.
Moreover, the effect of S2O82- on the photocatalytic activity in the presence of all the synthesized photocatalysts was determined using 4 mM S2O82- solution and the obtained rate constants are tabulated in Table 5. It is observed that the rate constants increased by 13, 32,51,140 and 56 times in the presence of Cu-TiO2/10-C3N4, Cu-TiO2/30-C3N4, Cu-TiO2, g- C3N4 and TiO2, respectively, suggesting that the photocatalysis is greatly increased due to two reasons mainly, which are the production of SO4-● and OH● which readily degrade MB molecules and the prevention of electron-hole pair recombination due to rapid capture of the photogenerated electrons by S2O82- (Fig. 10 (d)). A drastic increase in the reaction rate in the presence of Cu-TiO2/10-C3N4, Cu-TiO2/30-C3N4, Cu-TiO2, g- C3N4 and TiO2 catalysts was observed in the presence of S2O82- because the rate constants without S2O82- were very low. The rate constants for the degradation of MB in the presence of all the composites are higher than that of Cu-TiO2/50-C3N4 reported without S2O82-. Further, with the addition of S2O82- the photocatalytic activity of Cu-TiO2/30-C3N4 resulted to be higher than that of Cu-TiO2/50-C3N4 which showed the highest photocatalytic activity without S2O82-. This suggests that the proper amount of g-C3N4 was not available in Cu-TiO2/30-C3N4 to couple with Cu-TiO2 and a low photocatalytic activity next to Cu-TiO2/50-C3N4 was obtained due to the possible electron-hole pair recombination resulted due to the reduced band gap of Cu-TiO2 (2.67 eV). However, S2O82- readily captures the photogenerated electrons, and thus prevents the electron-hole pair recombination leading to a higher photocatalytic activity.
The reusability of Cu-TiO2/50- C3N4 was tested to study the stability of the photocatalysts (Fig. 11). The total removal of MB in the first cycle (79%) decreased to 69% by the fifth cycle. Positively charged MB molecules have a strong affinity to the negatively charged catalyst surface triggering the chemisorption of MB. Therefore, the catalyst surface could have been saturated by the chemisorbed MB molecules limiting the available surface for the new MB molecules though the catalyst surface was washed with distilled water and ethanol because such washing would mainly remove the physisorbed MB molecules. The porous structure of the catalyst could have been blocked with the chemisorbed MB molecules reducing the surface area and the total pore volume limiting the MB adsorption. Moreover, it was observed that the catalyst particles were agglomerated with prolonged use reducing the surface area and restricting the access of MB molecules to the active sites. Further, there could be a loss in the weight of the catalyst moving from one cycle to the other resulting in a reduction in the total removal of MB.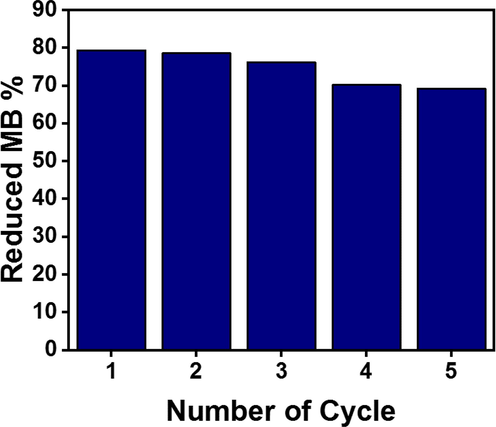
Reusability of Cu-TiO2/50-C3N4.
4 Conclusions
Cu-TiO2 nanoparticles were successfully coupled to g-C3N4 in different weight ratios hydrothermally to synthesize Cu-TiO2/g-C3N4 nanocomposites. Cu has been doped to the Anatase phase of TiO2 which possess both Anatase and Rutile phases without causing significant lattice distortions. Cu-TiO2 nanoparticles were heterogeneously distributed on the g- C3N4 matrix. Adsorption of methylene blue molecules followed second-order kinetics indicating chemisorption of methylene blue molecules to the catalyst surface. The photocatalytic activity of the synthesized nanocomposites was evaluated on the photodegradation of methylene blue and Cu-TiO2/50- C3N4 showed the highest rate constant (4.4 × 10⁻³ min−1) which was 5 and 9.8 times greater the activity of TiO2 and g-C3N4, respectively. The z-scheme band alignment of Cu-TiO2/C3N4 facilitates the charge separation minimizing the electron-hole pair recombination and leading to higher photocatalytic activity. Superoxide radicals, hydroxyl radicals and holes are responsible for the photodegradation of methylene blue as exhibited by the study performed with scavengers. Persulfate ions greatly enhanced the photocatalytic activity where the rate constant of Cu-TiO2/50-C3N4 was increased by 18 times as they generate SO4-● and OH● and prevent the electron-hole pair recombination. Therefore, it could be concluded that the fabricated Cu-TiO2/C3N4 nanocomposites are effective in degrading methylene blue and could be used for environmental remediation effectively.
Acknowledgement
The authors acknowledge the Sri Lanka Institute of Nanotechnology and the University of Moratuwa for providing the instrument facilities.
Funding Statement
This research was supported by the Accelerating Higher Education Expansion and Development (AHEAD) Operation of the Ministry of Higher Education funded by the World Bank.
Declaration of Competing Interest
The authors declare that they have no known competing financial interests or personal relationships that could have appeared to influence the work reported in this paper.
References
- A critical review on the treatment of dye-containing wastewater: Ecotoxicological and health concerns of textile dyes and possible remediation approaches for environmental safety. Ecotoxicol. Environ. Saf.. 2022;231:113160
- [CrossRef] [Google Scholar]
- Textile effluent treatment methods and eco-friendly resolution of textile wastewater. Case Studies in Chemical and Environmental Engineering. 2022;6:100230
- [CrossRef] [Google Scholar]
- Comparative study of ozonation and ozonation catalyzed by Fe-loaded biochar as catalyst to remove methylene blue from aqueous solution. Chemosphere. 2022;307:135738
- [CrossRef] [Google Scholar]
- Raman spectra of titanium dioxide. J. Solid State Chem.. 1982;42(3):276-282.
- [CrossRef] [Google Scholar]
- Enhanced methylene blue removal efficiency of SnO2 thin film using sono-photocatalytic processes. Opt. Mater.. 2021;117:111116
- [CrossRef] [Google Scholar]
- Birniwa, A. H., Abubakar, A. S., Mahmud, H. N. M. E., Kutty, S. R. M., Jagaba, A. H., Abdullahi, S. S., & Zango, Z. U. 2022. Application of Agricultural Wastes for Cationic Dyes Removal from Wastewater. 239–274. https://doi.org/10.1007/978-981-19-2832-1_9.
- Efficient photodegradation activity of α-Fe2O3/Fe2TiO5/TiO2 and Fe2TiO5/TiO2 nanocomposites synthesized from natural ilmenite. Results in Materials. 2021;12:100219
- [CrossRef] [Google Scholar]
- A comparative study between physicochemical and biological methods for effective removal of textile dye from wastewater. Development in Wastewater Treatment Research and Processes. 2022;1–21
- [CrossRef] [Google Scholar]
- Adsorption of aromatic compounds from the biodegradation of azo dyes on activated carbon. Appl. Surf. Sci.. 2008;254(11):3497-3503.
- [CrossRef] [Google Scholar]
- Removal of organic pollutants from water by Fe2O3/TiO2 based photocatalytic degradation: A review. Environ. Technol. Innov.. 2021;21:101230
- [CrossRef] [Google Scholar]
- H2O2 production and in situ sterilization over a ZnO/g-C3N4 heterojunction photocatalyst. Chem. Eng. J.. 2021;420:129722
- [CrossRef] [Google Scholar]
- Fabrication of Hierarchical V2O5 Nanorods on TiO2 Nanofibers and Their Enhanced Photocatalytic Activity under Visible Light. ChemCatChem. 2018;10(15):3305-3318.
- [CrossRef] [Google Scholar]
- Effect of surfactants on morphology and textural parameters of silica nanoparticles derived from paddy husk and their efficient removal of methylene blue. International Conference on Innovations in Energy Engineering & Cleaner Production IEE CP. 2021;21
- [CrossRef] [Google Scholar]
- Fundamentals of TiO2 Photocatalysis: Concepts, Mechanisms, and Challenges. Adv. Mater.. 2019;31(50):1901997.
- [CrossRef] [Google Scholar]
- Raman Spectroscopy of Titania (TiO 2) Nanotubular Water-Splitting Catalysts. In Journal of the Arkansas Academy of. Science. 2011;65(9)
- [Google Scholar]
- Removal of methylene blue (basic dye) by coagulation-flocculation with biomaterials (bentonite and Opuntia ficus indica) J. Water Process Eng.. 2022;49:102952
- [CrossRef] [Google Scholar]
- J. Thambiliyagodage, C., Hakat, Y., & G. Bakker, M. 2016. One Pot Synthesis of Carbon/Ni Nanoparticle Monolithic Composites by Nanocasting and Their Catalytic Activity for 4-Nitrophenol Reduction. Current Catalysis, 5(2), 135–146. https://doi.org/10.2174/2211544705666160610093114.
- Photo-assisted advanced oxidation processes for efficient removal of anionic and cationic dyes using Bentonite/TiO2 nano-photocatalyst immobilized with silver nanoparticles. J. Mol. Struct.. 2021;1239:130496
- [CrossRef] [Google Scholar]
- WS2 sensitized mesoporous TiO2 for efficient photocatalytic hydrogen production from water under visible light irradiation. Catal. Commun.. 2007;8(5):795-799.
- [CrossRef] [Google Scholar]
- Effect of Isomorphic Metal Substitution on the Fenton and Photo-Fenton Degradation of Methylene Blue Using Fe-Based Metal-Organic Frameworks. ACS Appl. Mater. Interfaces. 2020;12(8):9292-9299.
- [CrossRef] [Google Scholar]
- Kobkeatthawin, T., Chaveanghong, S., Trakulmututa, J., Amornsakchai, T., Kajitvichyanukul, P., & Smith, S. M. (2022). Photocatalytic Activity of TiO2/g-C3N4 Nanocomposites for Removal of Monochlorophenols from Water. Nanomaterials 2022, Vol. 12, Page 2852, 12(16), 2852. https://doi.org/10.3390/NANO12162852.
- Nanostructured Bi2O3@TiO2 photocatalyst for enhanced hydrogen production. Int. J. Hydrogen Energy. 2017;42(10):6627-6636.
- [CrossRef] [Google Scholar]
- Cu-doped TiO2 hollow nanostructures for the enhanced photocatalysis under visible light conditions. J. Ind. Eng. Chem.. 2021;99:352-363.
- [CrossRef] [Google Scholar]
- Effects of textile dyes on health and the environment and bioremediation potential of living organisms. Biotechnology Research and Innovation. 2019;3(2):275-290.
- [CrossRef] [Google Scholar]
- S-doped TiO2 photocatalyst for visible LED mediated oxone activation: Kinetics and mechanism study for the photocatalytic degradation of pyrimethanil fungicide. Chem. Eng. J.. 2021;411:128450
- [CrossRef] [Google Scholar]
- Mesoporous WO3-TiO2 heterojunction for a hydrogen gas sensor. Sens. Actuators B. 2021;341:130035
- [CrossRef] [Google Scholar]
- Enhanced visible-light-induced photocatalytic disinfection of E. coli by carbon-sensitized nitrogen-doped titanium oxide. Environ. Sci. Tech.. 2007;41(14):5050-5056.
- [CrossRef] [Google Scholar]
- Electro-catazone treatment of ozone-resistant drug ibuprofen: Interfacial reaction kinetics, influencing mechanisms, and degradation sites. Journal of Hazardous Materials Advances. 2021;4:100023
- [CrossRef] [Google Scholar]
- Construction of BiOI/TiO2 flexible and hierarchical S-scheme heterojunction nanofibers membranes for visible-light-driven photocatalytic pollutants degradation. Sci. Total Environ.. 2022;806:150698
- [CrossRef] [Google Scholar]
- A highly efficient technique to simultaneously remove acidic and basic dyes using magnetic ion-exchange microbeads. J. Environ. Manage.. 2022;304:114173
- [CrossRef] [Google Scholar]
- Enhanced Fenton-catalytic efficiency by highly accessible active sites on dandelion-like copper–aluminum–silica nanospheres for water purification. J. Mater. Chem. A. 2016;4(22):8610-8619.
- [CrossRef] [Google Scholar]
- Cu-Doped TiO2: Visible Light Assisted Photocatalytic Antimicrobial Activity. Appl. Sci.. 2018;8(11):2067.
- [CrossRef] [Google Scholar]
- Application of efficient magnetic particles and activated carbon for dye removal from wastewater. ACS Omega. 2020;5(33):20684-20697.
- [CrossRef] [Google Scholar]
- Complete photocatalytic degradation of tetracycline by carbon doped TiO2 supported with stable metal nitrate hydroxide. Environ. Res.. 2022;207:112188
- [CrossRef] [Google Scholar]
- Microorganism: an ecofriendly tool for waste management and environmental safety. Development in Wastewater Treatment Research and Processes. 2022;175–193
- [CrossRef] [Google Scholar]
- S-Scheme α-Fe2O3/g-C3N4Nanocomposites as Heterojunction Photocatalysts for Antibiotic Degradation. ACS Applied Nano Materials. 2022;5(3):4506-4514.
- [CrossRef] [Google Scholar]
- A systematic review of the sonophotocatalytic process for the decolorization of dyes in aqueous solution: Synergistic mechanisms, degradation pathways, and process optimization. J. Water Process Eng.. 2021;44:102314
- [CrossRef] [Google Scholar]
- Construction of S-scheme 1D/2D rod-like g-C3N4/V2O5 heterostructure with enhanced sonophotocatalytic degradation for Tetracycline antibiotics. Chemosphere. 2022;287:132380
- [CrossRef] [Google Scholar]
- Ramutshatsha-Makhwedzha, D., & Nomngongo, P. N. 2022. Application of Ultrafiltration Membrane Technology for Removal of Dyes from Wastewater. 37–47. https://doi.org/10.1007/978-981-16-4823-6_3.
- Electrochemical degradation of methylene blue dye using a graphite doped PbO2 anode: Optimization of operational parameters, degradation pathway and improving the biodegradability of textile wastewater. Arab. J. Chem.. 2020;13(8):6847-6864.
- [CrossRef] [Google Scholar]
- Surface modification of TiO2 with copper clusters for band gap narrowing. Catal. Today. 2019;321–322:9-17.
- [CrossRef] [Google Scholar]
- CuO/TiO2 heterojunction composites: an efficient photocatalyst for selective oxidation of methanol to methyl formate. J. Mater. Chem. A. 2019;7(5):2253-2260.
- [CrossRef] [Google Scholar]
- Modification of textiles for functional applications. Fundamentals of Natural Fibres and Textiles. 2021;303–365
- [CrossRef] [Google Scholar]
- Size and shape effects on the band gap of semiconductor compound nanomaterials. Journal of Taibah University for Science. 2018;12(4):470-475.
- [CrossRef] [Google Scholar]
- Harmful environmental effects for textile chemical dyeing practice. Green Chemistry for Sustainable Textiles: Modern Design and Approaches. 2021;153–164
- [CrossRef] [Google Scholar]
- Synthesis of g-C3N4/CeO2 nanocomposites with improved catalytic activity on the thermal decomposition of ammonium perchlorate. Appl. Surf. Sci.. 2015;356:447-453.
- [CrossRef] [Google Scholar]
- Thambiliyagodage, C., & Mirihana, S. 2021. Photocatalytic activity of Fe and Cu co-doped TiO2 nanoparticles under visible light. Journal of Sol-Gel Science and Technology 2021 99:1, 99(1), 109–121. https://doi.org/10.1007/S10971-021-05556-4.
- Fabrication of dual Z-scheme g-C3N4/Fe2TiO5/Fe2O3 ternary nanocomposite using natural ilmenite for efficient photocatalysis and photosterilization under visible light. Applied Surface Science Advances. 2022;12:100337
- [CrossRef] [Google Scholar]
- Photocatalytic activity of N, Fe and Cu co-doped TiO2 nanoparticles under sunlight. Current Research in Green and Sustainable Chemistry. 2021;4:100186
- [CrossRef] [Google Scholar]
- Efficient Visible-Light Photocatalysis and Antibacterial Activity of TiO2-Fe3C-Fe-Fe3O4/Graphitic Carbon Composites Fabricated by Catalytic Graphitization of Sucrose Using Natural Ilmenite. ACS Omega 2022
- [CrossRef] [Google Scholar]
- Synthesis of CeO2/TiO2 nanotubes and heterogeneous photocatalytic degradation of methylene blue. J. Environ. Chem. Eng.. 2018;6(5):5999-6011.
- [CrossRef] [Google Scholar]
- Facile construction of S-scheme SnO2/g-C3N4 photocatalyst for improved photoactivity. Chemosphere. 2022;289:133120
- [CrossRef] [Google Scholar]
- Photocatalytically recovering hydrogen energy from wastewater treatment using MoS2 @TiO2 with sulfur/oxygen dual-defect. Appl Catal B. 2022;303:120878
- [CrossRef] [Google Scholar]
- Enhanced photoelectrocatalytic activity of Bi2S3–TiO2 nanotube arrays hetero-structure under visible light irradiation. Int. J. Hydrogen Energy. 2020;45(56):32012-32021.
- [CrossRef] [Google Scholar]
- Construction of a rod-like Bi2O4 modified porous g-C3N4 nanosheets heterojunction photocatalyst for the degradation of tetracycline. New J. Chem.. 2020;44(23):9725-9735.
- [CrossRef] [Google Scholar]
- Controlled synthesis of nanoplate, nanoprism and nanopyramid-shaped CdSe decorated on porous TiO2 photocatalysts for visible-light-driven hydrogen evolution. Ceram. Int.. 2018;44(11):12555-12563.
- [CrossRef] [Google Scholar]
- Fabrication of corncob-derived biomass charcoal decorated g-C3N4 photocatalysts for removing 2-mercaptobenzothiazole. New J. Chem.. 2020;44(37):15908-15918.
- [CrossRef] [Google Scholar]
- Controllable construction 2D-CN photocatalyst for degradation MBT and mechanism insights. Mater. Res. Bull.. 2023;159:112093
- [CrossRef] [Google Scholar]
- Quantum effect and Mo–N surface bonding states of α-MoC1−x modified carbon nitride for boosting photocatalytic performance. Cat. Sci. Technol.. 2022;12(21):6384-6397.
- [CrossRef] [Google Scholar]
Appendix A
Supplementary data
Supplementary data to this article can be found online at https://doi.org/10.1016/j.arabjc.2023.104749.
Appendix A
Supplementary data
The following are the Supplementary data to this article:Supplementary data 1
Supplementary data 1


