

Translate this page into:
Efficient reduction of NOx emissions from waste double-base propellant in co-pyrolysis with pine sawdust
⁎Corresponding author at: School of Chemistry and Chemical Engineering, Nanjing University of Science and Technology, Nanjing 210094, China. hewedong@njust.edu.cn (Weidong He)
-
Received: ,
Accepted: ,
This article was originally published by Elsevier and was migrated to Scientific Scholar after the change of Publisher.
Peer review under responsibility of King Saud University.
Abstract
Abstract
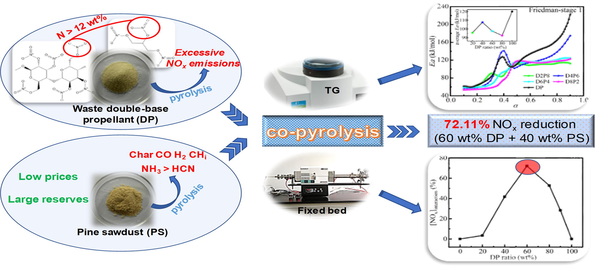
Co-pyrolysis technology containing biomass offers remarkable advantages in reducing NOx emissions economically and efficiently. In this work, it was innovatively introduced to solve the problem of excessive NOx emission during the incineration of waste energetic materials (EMs). The kinetics and NOx emission characteristics of waste double-base propellant (DP), pine sawdust (PS), and their mixtures with different ratios during pyrolysis were investigated by thermogravimetric analysis and fixed-bed experiments. The results showed that there was a significant interaction between DP and PS. Kinetic analysis by Friedman and Kissinger-Akahira-Sunose (KAS) methods demonstrated that the average activation energies of the mixtures with different ratios were smaller than that of DP, indicating that the addition of PS improved the reactivity of co-pyrolysis. In addition, the fixed-bed experiment determined that the lowest NOx emission was achieved during DP pyrolysis alone at 900 ℃. Co-pyrolysis at this temperature was found to have synergistic effects of reduced NOx emissions for different ratios of mixtures. The best synergistic effect was achieved at the mixing ratio of 60 wt% DP and 40 wt% PS, resulting in a 72.11 % reduction in actual NOx emissions compared to the expected value. This study provides a new direction and powerful data support for the clean, efficient and economic treatment of waste EMs, especially for practical engineering strategies.
Keywords
Waste double-base propellant
Pine sawdust
Co-pyrolysis
Reaction kinetics
NOx emission

1 Introduction
Energetic materials (EMs) are mainly used in the domain of national defense to accomplish military operations such as propulsion, projectile, and explosion (Chen et al., 2022b; Wang et al., 2022a; Wang et al., 2022b). Their storage and service life are limited. After reaching their lifespan, the EMs will become waste EMs due to the deterioration of stability and safety (Cho et al., 2020; Park et al., 2016). In general, about thousands to tens of thousands of tons of waste EMs accumulate annually in large military countries (Duijm, 2002). Waste EMs are worldwide hazards caused by their inflammability, explosiveness, and high NOx emissions (Duijm and Markert, 2002). If such hazards are not handled properly, the consequences will be very serious.
Co-pyrolysis/co-combustion technologies are one of the most potential waste treatment methods, which have a broad prospect in reducing pollutant emissions (Chen et al., 2018; Liu et al., 2022; Ulusoy et al., 2021). NOx is the key indicator of pollutant emissions (Van Caneghem et al., 2016). NOx emissions pose a great threat to human health and the ecological environment, which must be strictly controlled and significantly reduced (Gholami et al., 2020). Currently, studies on co-pyrolysis/co-combustion technologies are mainly focused on conventional solid fuels, including coal (Bhattacharyya et al., 2021; Laougé and Merdun, 2021; Merdun and Laougé, 2021), sewage sludge (Chen et al., 2018; Ma et al., 2022; Wang et al., 2020), biomass (Liao et al., 2021; Wang et al., 2016; Yang et al., 2021a), and municipal solid waste (Peng et al., 2016; Suksankraisorn et al., 2010). Merdun et al. (Merdun and Laougé, 2021) analyzed the pyrolysis kinetics of the mixture of greenhouse vegetable waste and coal by thermogravimetry (TG). It was indicated that the mixture of the two has a synergistic effect, with the lowest activation energy at 50 wt% of each. NOx emission characteristics during co-pyrolysis of sewage sludge with corn straw in a tube furnace showed the lowest NOx emissions at a sewage sludge ratio of 75 wt% (Chen et al., 2018). Wang et al. (Wang et al., 2020) studied the combustion and NOx emission characteristics of sludge, biomass, and their mixtures using TG and tube furnaces. The results showed that the combustion characteristics at 80 wt% biomass + 20 wt% sludge improved compared to the theoretical values, while NOx emissions were the lowest. In conventional solid fuels, the fuel nitrogen content varies little, usually not exceeding 2.5 wt%. And the fuel nitrogen is first produced as HCN and NH3 (Glarborg et al., 2003). In contrast, the nitrogen content of most EMs is more than 12 wt%, and nitrogen mainly exists in the form of O-NO2 or N-NO2 (Yan et al., 2009a; Yan et al., 2009b). In this way, NO2 is first generated during the combustion of EMs, leading to serious exceedances of NOx emissions (Baxter et al., 1996; Buckley et al., 1997). There are significant differences in composition and structure between EMs and conventional solid fuels, which will have a great impact on the whole pyrolysis/combustion process after mixing. Therefore, co-pyrolysis/co-combustion technologies of EMs with conventional solid fuels will be a valuable research direction.
NOx emissions tend to decrease with NHi radical concentration (Abelha et al., 2008), and char reduction reactivity to NO (Yang et al., 2021b), which is revealed in co-pyrolysis and co-combustion studies. Biomass has the characteristics of high H/C, O/C, volatile content, low ignition temperature, and generally low sulfur and nitrogen content, which has attracted more and more attention in the field of waste cleaning treatment (Laougé and Merdun, 2021). However, research in the field of EMs mainly focuses on co-combustion with coal, and there are no reports on co-pyrolysis with biomass. Wei et al. (Wei et al., 2019) found that the composite propellant, as one type of EMs, with a very low price could promote the oxidation and ignition of anthracite through the combination of thermogravimetry and Fourier transform infrared spectrometer (TG-FTIR). Ananiev et al. (Ananiev et al., 1997) investigated the co-combustion of composite propellant and coal peat by the fixed bed reactor. The results showed that NOx emissions can be reduced almost to the level of conventional solid fuels during co-combustion. It is generally accepted that biomass produces a greater NH3/HCN ratio than coal (Abelha et al., 2008; Tchapda and Pisupati, 2014). NH3 plays a crucial role in the denitration process as a reducing agent (Van Caneghem et al., 2016). Therefore, it is necessary to comprehensively study the kinetics and NOx emission characteristics of EMs and biomass during co-pyrolysis. In addition, compared with urea and other chemicals used to reduce NOx emissions, as well as catalysts used to promote NOx reduction in the current incineration of waste EMs, biomass is one of the most abundant renewable energy sources in the world, with a very low price (Laougé and Merdun, 2021). Hence, co-pyrolysis technologies of EMs and biomass can also reduce the cost of waste clean treatment to a great extent.
Double-base propellants occupy an important position in EMs (Li et al., 2021; Yan et al., 2009a; Yan et al., 2009b). In this paper, waste double-base propellant (DP) and biomass pine sawdust (PS) were selected for co-pyrolysis studies. The pyrolysis behaviors of DP, PS, and their mixtures with different ratios were studied by thermogravimetric analysis (TGA) and the pyrolysis kinetics were calculated using the Friedman and Kissenger-Akahira-Sunose (KAS) methods. Furthermore, the NOx emission characteristics were evaluated by fixed-bed experiments. The temperature conditions for the lowest NOx emissions during DP alone pyrolysis were found. The synergistic effect was highlighted by the deviation between the experimental and expected values of NOx emissions during co-pyrolysis. With a view to providing a theoretical basis for the industrial application of DP-PS co– pyrolysis and control of NOx.
2 Methodology
2.1 Materials
Waste double-base propellant (DP), mainly composed of nitrocellulose and nitroglycerin, were provided by Luzhou North Chemical Industry Co., ltd. (Sichuan, China). Pine sawdust (PS) from Lianyungang, China. First, DP and PS were mechanically crushed. For the sake of safety, DP added an appropriate amount of distilled water during the crushing process. Then, they were dried in an oven (55 ℃) for three days. Finally, the desired size range of 75–150 μm was sieved. In our work, DP and PS were mechanically mixed in certain mass ratios. The mass ratios of DP in the experimental samples were selected as 0 wt%, 20 wt%, 40 wt%, 60 wt%, 80 wt%, 90 wt%, and 100 wt%, which were denoted by PS, D2P8, D4P6, D6P4, D8P2, D9P1, and DP, respectively. To prevent moisture absorption, the prepared samples were stored in a desiccator for backup.
Due to the characteristics of inflammability and extremely fast gas production rate, the proximate analysis of DP was determined by the thermogravimetric method (Czajka, 2018). The proximate analysis of PS was performed according to ASTM standards. Their ultimate analysis and lower heating values were tested using an elemental analyzer (Thermo FLASH2000, USA) and an oxygen bomb calorimeter (SDC712, China), respectively. Test results were listed in Table 1. Mad, Aad, Vad and FCad represent the content of moisture, ash, volatile and fixed carbon on air dried basis, respectively. Cad, Had, Nad, Sad and Oad represent the content of carbon, hydrogen, nitrogen, sulfur and oxygen on air dried basis, respectively. LHV represents a lower heating value.
Materials
Proximate analysis (wt%)
Ultimate analysis (wt%)
LHV (MJ/kg)
Mad
Aad
Vad
FCad
Cad
Had
Nad
Sad
Oad
DP
0.53
0.86
98.54
0.07
22.11
2.51
14.91
0.00
60.47
8.14
PS
1.95
0.34
88.81
8.90
47.17
6.48
0.12
0.03
46.20
17.37
2.2 Thermogravimetric analysis
Thermogravimetric analysis (TGA) experiments (PerkinElmer STA 8000, USA) were performed under an inert atmosphere (N2). The sample mass for each experiment was 1 ± 0.05 mg. To calculate the kinetic parameters, four different heating rates (β) at 2, 5, 10, and 20 ℃∙min−1 were selected, and the nitrogen flow rate was 20 mL∙min−1. A blank test was performed prior to each experiment to obtain a baseline to eliminate systematic errors in the instrument.
In order to study the interaction between DP and PS mixing, the deviation between the TG experimental value and the calculated value (ΔTG) was introduced to quantify the synergistic or inhibitory effect between the mixtures (Liao et al., 2021). A negative value of ΔTG indicates a synergistic effect, while a positive value of ΔTG indicates an inhibitory effect. The calculation equation is as follows.
where, ωDP and ωPS are the mass ratios of DP and PS in the mixture. TGDP, exp and TGPS, exp are the experimental TG values of DP and PS pyrolysis alone, respectively. TGcal and TGexp are calculated and experimental TG values of the mixture, respectively.
2.3 Kinetic analysis
The kinetic analysis is based on the Arrhenius equation (Deng et al., 2022; Laougé and Merdun, 2021), described as Eq. (3):
where α is the mass conversion ratio (%), t is the time (min), A is the pre-exponential factor, Ea is the activation energy (kJ·mol−1), R is the ideal gas constant, T is the temperature (℃), and f(α) is the mechanical function of the reaction.
When the heating rate (β = dT/dt, ℃·min−1) is constant, Eq. (3) can be transformed as follows.
Eq. (5) is the integral form of Eq. (4).
Therefore, Eq. (5) is the expression of the kinetic mechanism.
The essence of the isoconversional method is to establish the relationship between activation energy and mass conversion ratio (Ea-α). Kinetic equations at a series of specific α describe the entire reaction process, which avoids the disadvantage of simple linear fitting with only one Ea. Since the model-free method does not consider any reaction model, errors related to the choice of kinetic model can be eliminated. For kinetic analysis, the isoconversional method used in this work was based on the model-free method Friedman (Budrugeac, 2018; Sánchez-Jiménez et al., 2013) and Kissinger-Akahira-Sunose (KAS) (Bhattacharyya et al., 2021; Laougé and Merdun, 2021), which has high reliability, and was calculated by NETZSCH Kinetics Neo software.
The Friedman isoconversional method is a widely used differentiation method (Budrugeac, 2018; Sánchez-Jiménez et al., 2013). Unlike the conventional integration method, it provides an exact value of the Ea, even though the Ea is a function of the reaction fraction. If f(α) is assumed to be constant at any specific α, then ln(β∙dα/dT) has a linear relationship with 1/T. Hence, the Ea and the pre-exponential factor (A) can be obtained from the slope and intercept of the line ln(β∙dα/dT)-1/T, respectively. The equation used to determine Ea is as follows.
The KAS isoconversional method is a popular integration method (Bhattacharyya et al., 2021; Laougé and Merdun, 2021). In the KAS model, Ea is obtained from the line of ln(β/T2)-1/T. For a given value of α, the slope of the line is equal to -Ea/R. Ea is defined by the following equation.
2.4 Fixed-bed experiment
To study the NOx emission characteristics during co-pyrolysis, pyrolysis experiments of DP, PS, and their mixtures with different ratios were carried out in a fixed-bed experimental system. The system consists of a gas cylinder, mass flow controller, electric heating tube furnace, flue gas filter, buffer tank, and flue gas analyzer (MGA6, Germany), as shown in Fig. 1. Due to the fast reaction speed and gas production of DP, the buffer tank can be set to achieve smooth airflow. The MGA6 flue gas analyzer is based on the principle of non-dispersive infrared, and the sampling flow rate is about 1 L∙min−1. The detailed technical specifications are shown in Table S1. During the experiment, the feeding gas (N2) flow rate was 1 L∙min−1, which was controlled by the mass flow controller. The set temperatures of the experiments, i.e., the center temperature of the tube furnace chamber, were 400 ℃, 600 ℃, 800 ℃, 900 ℃, and 1000 ℃, measured by a thermocouple extended into the center of the furnace tube. The total mass of the samples in each experiment was 50 mg, which was repeated three times to ensure the accuracy of the experimental results.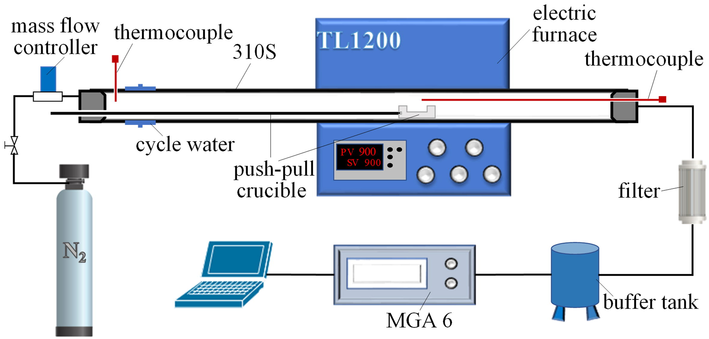
Schematic diagram of the fixed-bed experimental system.
In this experimental system, the wall and push–pull rod of the tube furnace are 310S stainless steel, and the crucible is made of corundum material, which ensures the pyrolysis safety of the propellant. A thermocouple and circulating water cooling are arranged at the inlet of the tube furnace to ensure that the inlet temperature is less than 50 ℃. In this way, the crucible containing the sample before the experiment is placed at the inlet of the tube furnace to prevent the decomposition of the sample before it enters the center of the chamber. The crucible is connected to the push–pull rod by means of a thread. When the gas indicator of the flue gas analyzer is stable at the set airflow concentration, the sample is rapidly pushed into the center of the chamber through the push–pull rod. To ensure the gas tightness of the furnace chamber during the push–pull process, the push–pull rod is connected to the plug at the inlet end by a sealing ring. After one experiment, the crucible is pulled out by a push–pull rod and the ash remaining in the crucible can be further analyzed.
The actual NOx emissions (mNOx, mg) are determined by the integral value of the gas release curve, as shown in Eq. (8).
where, t0 is the sampling start time (s), Δt is the sampling duration (s), Q is the sampling flow rate (L∙min−1), CNOx is the instantaneous concentration of NOx (ppm), 46 is the molecular weight of NOx (calculated as NO2, g∙mol−1), 22.4 is the molar volume of gas (L∙mol−1).
To evaluate the interaction of DP and PS in NOx emissions during co-pyrolysis, the expected value of NOx emissions was introduced (Chen et al., 2018), denoted as [mNOx]c. It is the weighted average of NOx emissions, calculated by the following equation.
where, ωDP and ωPS are the mass ratios of DP and PS in the mixture (wt%), [mNOx](DP) and [mNOx](PS) are the actual NOx emissions when DP and PS are pyrolyzed separately (mg).
The deviation between the experimental and expected values of NOx emissions was used as an evaluation criterion for the DP and PS interaction (synergy/inhibition) (Chen et al., 2018), noted as [NOx]interaction. It represents the percentage increase/decrease of NOx emissions in co-pyrolysis compared to pyrolysis alone. A positive value of [NOx]interaction represents that the interaction is synergistic, indicating that co-pyrolysis of DP and PS can reduce NOx emissions. Conversely, the interaction of DP and PS co-pyrolysis on NOx emissions is inhibitory when the [NOx]interaction value is negative. The equation is as below.
where [mNOx]e is the actual NOx emission during pyrolysis of the mixture (mg).
2.5 Characterization of pyrolysis residue
The morphology of the residual ash was observed by a scanning electron microscope (SEM) (FEI Quanta FEG 250, USA) at an acceleration voltage of 5–10 kV after gold sputtering coating. The relative elemental content of the residue surface was determined by Energy Dispersive X-ray Spectroscopy (EDS), an accessory to SEM.
3 Results and discussion
3.1 Interaction relationship of DP and PS mixtures
The interactions of DP, PS, and their mixtures with different ratios were studied by the thermogravimetric analysis (TGA) method under an inert atmosphere (N2) and heating rate of 20 ℃∙min−1. Fig. 2a plotted the TG-DTG curves of DP, PS, and their mixtures with different ratios. As can be seen from the figure, there were two main stages in the weight-loss process of DP alone pyrolysis. 100–195 ℃ was the process of volatilization and thermal decomposition of nitroglycerin in DP, and 195–275 ℃ corresponded to the process of thermal decomposition of nitrocellulose in DP. The weight-loss process of PS pyrolysis alone had only one major stage, starting with thermal decomposition at 270 ℃ and ending at 430 ℃, corresponding to the release process of volatile from PS. When they were mixed in different ratios, TG and DTG curves were between DP and PS.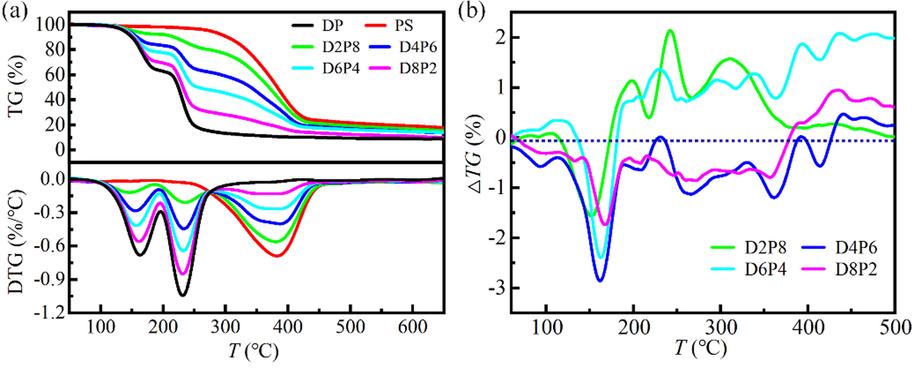
Thermogravimetric analysis results at a heating rate of 20 ℃∙min−1. (a) TG-DTG curves, (b) deviation analysis.
According to TG and DTG curves, the weight-loss process during co-pyrolysis of the mixture mainly had three stages, which correspond to the volatilization and thermal decomposition of nitroglycerin in DP, the thermal decomposition of nitrocellulose in DP, and the release of volatile in PS. The first two stages could reflect the effect of PS on DP. With the increase of PS, the peak temperature of DTG decreased gradually in the first stage and basically remained constant in the second stage. This indicated that the presence of PS promoted the volatilization and thermal decomposition of nitroglycerin, but had no effect on the thermal decomposition of nitrocellulose. In the third stage, the peak of DTG became gentle as the DP increased.
The deviation between the TG experimental value and the calculated value (ΔTG) for the mixtures with different DP and PS ratios was presented in Fig. 2b. For the convenience of analysis, the weight-loss process during co-pyrolysis of the mixture was combined into two stages: stage 1 (50–270 ℃) and stage 2 (270–500 ℃), where stage 1 corresponds to the volatilization and thermal decomposition of nitroglycerin, and the thermal decomposition of nitrocellulose in DP, and stage 2 corresponds to the release of volatile in PS. In stage 1, the ΔTG of the mixtures with different ratios was generally negative, indicating the presence of synergy. At stage 2, the ΔTG curves of the mixtures with the DP ratios of 40 wt% and 80 wt% showed a trend of first negative and then positive, indicating that the interaction was first synergistic and then inhibitory. In addition, the mixtures with the DP ratios of 20 wt% and 60 wt% ΔTG were positive, showing inhibitory effects. These interactions between DP and PS during co-pyrolysis lay the foundation for the cleaning treatment of waste EMs, indicating that this is a promising idea.
3.2 Kinetics of DP, PS and their mixtures
To evaluate the effect of different ratios on the kinetics of the mixture, the Friedman and KAS isoconversional methods were used to calculate the kinetic parameters. The activation energy (Ea) plays an important role in kinetic analysis and is referred to as the minimum energy that reactants must possess in order to carry out a specific reaction (Laougé and Merdun, 2021; Merdun and Laougé, 2021). Four heating rates of 2, 5, 10, and 20 ℃∙min−1 were selected for TGA under an inert atmosphere (N2), and the results were calculated by NETZSCH Kinetics Neo software. For comprehensive analysis, the weight-loss process during co-pyrolysis of the mixture was also combined into two stages: stage 1 (50–270 ℃) and stage 2 (270–500 ℃).
Taking the mixture with a DP ratio of 60 wt% (D6P4) as an example, the variation of mass conversion ratio (α) with temperature (T) in stage 1 and stage 2 was shown in Fig. 3a and 3b, respectively. The kinetic results of the two stages calculated by the Friedman and the KAS method were given in Fig. 3 and Fig. 4, respectively. Wherein, Fig. 3c, 3d, 4a, and 4b displayed the linear fitting results under different α, and Fig. 3e, 3f, 4c, and 4d presented the Ea-α curves obtained from the fitting lines. From Fig. 3 and Fig. 4, it can be seen that the trends of Ea with α obtained by the two methods in stage 1 and stage 2 were approximately the same. In stage 1, there were two obvious processes in the variation of Ea with α: volatilization and thermal decomposition of nitroglycerin (α less than 0.4) and thermal decomposition of nitrocellulose (α greater than 0.4). And the Ea of the latter was significantly larger than that of the former. In stage 2, Ea increased with α (0.1–0.9) and increased substantially in the later stages. This is related to the gradual decrease in volatile content and the increase in the share of carbon and ash. Carbon and ash, which are not involved in the reaction, cover the pore structure of the residue and hinder the reaction process (Liao et al., 2021), leading to a significant increase in Ea.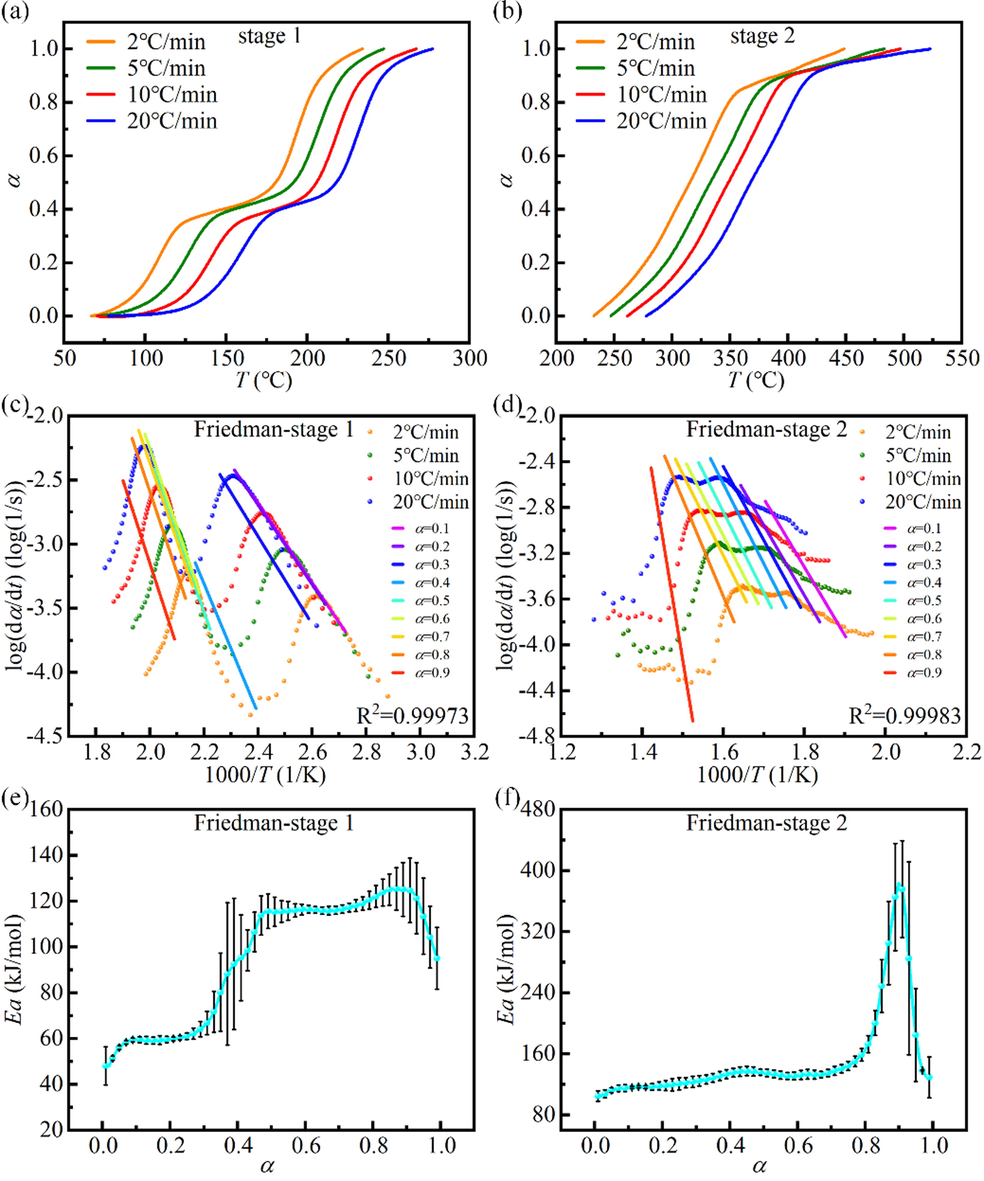
Kinetic results of the mixture with a DP ratio of 60 wt% (D6P4) calculated by Friedman isoconversional method. (a), (b) α-T curves in stage 1 and stage 2. (c), (d) Fitting results at different α in stage 1 and stage 2. (e), (f) Ea-α curves in stage 1 and stage 2.
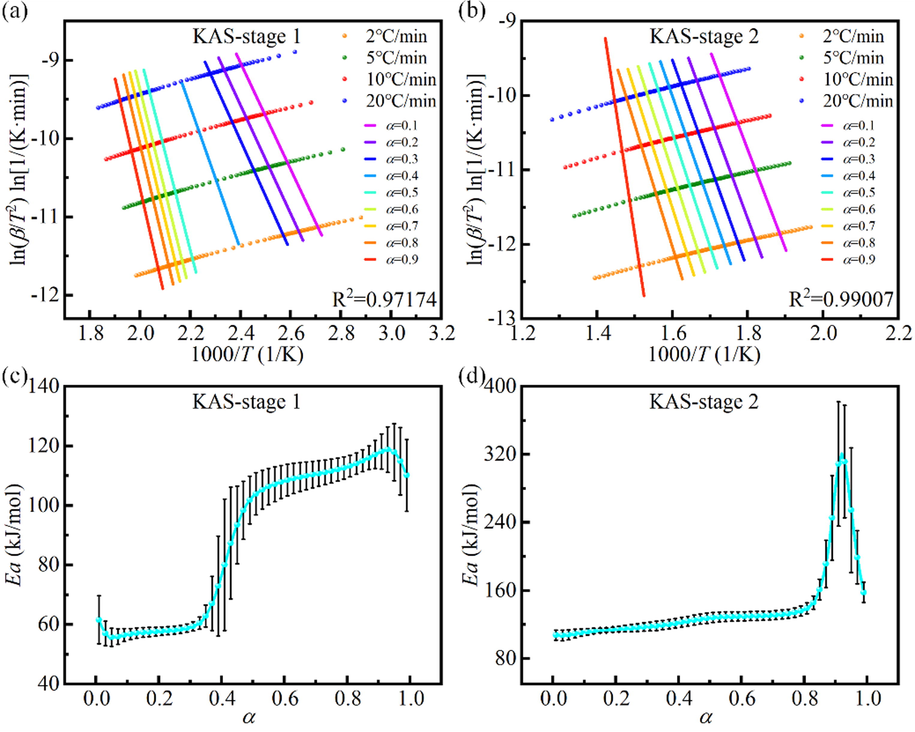
Kinetic results of the mixture with a DP ratio of 60 wt% (D6P4) calculated by KAS isoconversional method. (a), (b) Fitting results at different α in stage 1 and stage 2. (c), (d) Ea-α curves in stage 1 and stage 2.
As well, the kinetic results for DP, PS, and their mixtures with different ratios derived from both methods were shown in Fig. 5, including Ea-α curves and average Ea-DP ratio curves. The trends obtained by Friedman and KAS methods were similar, but the former had a higher average Ea, which also reflected the difference between the differential and integral methods.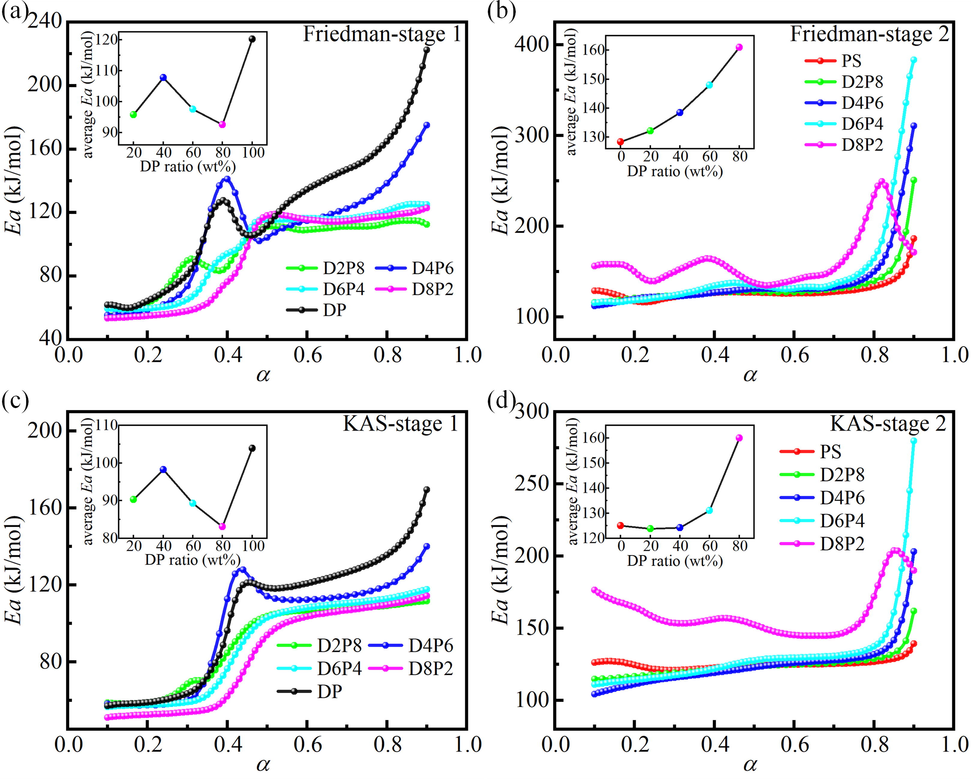
Kinetic results for DP, PS, and their mixtures with different ratios calculated by Friedman and KAS isoconversional methods. (a), (c) Ea-α curves and average Ea-DP ratio curves in stage 1. (b), (d) Ea-α curves and average Ea-DP ratio curves in stage 2.
In stage 1, the average Ea of all mixtures was less than that of DP. This indicated that the addition of PS would promote the co-pyrolysis reaction. EDS experiments on ash showed the presence of the alkali metal potassium (K) in PS, which may be attributed to the catalytic effect of alkali metals in PS (Hu et al., 2017; Wang et al., 2016). In the DP ratio range of 20 %-100 %, the average Ea showed an increase, then a decrease, and then an increase with the increase of the DP ratio (the panel of Fig. 5a and 5c). The lowest average Ea was reached at 80 wt% DP (D8P2), with an average Ea of 92.6 kJ∙mol−1 and 83.1 kJ∙mol−1 obtained by Friedman and KAS methods, respectively. The complex variation of the average Ea of mixtures with different mixing ratios revealed that the interaction between DP and PS was very complex. On the one hand, the alkali metal in PS promotes the pyrolysis of DP. On the other hand, the density of PS (0.5 g∙m−3) is smaller than that of DP (1.6 g∙cm−3), and a large amount of PS wraps DP, which hinders heat transfer and diffusion (Zhou et al., 2019). The interaction of the two aspects eventually leads to complex changes in the average Ea of the mixture. Overall, PS exerted a promotional effect on the pyrolysis process of DP.
In stage 2, it can be seen from the Ea-α curves that the trends of D8P2 (i.e., DP ratio of 80 wt%) was significantly different from the other curves. In addition, the average Ea-DP ratio curves showed that the average Ea reached the maximum when the DP ratio was 80 wt%. This may be because the residual residues (fixed carbon and ash) at the end of DP pyrolysis at stage 1 covered the pore structure of PS, hindering the reaction process at stage 2 (Liao et al., 2021). At 80 wt% DP, there were many remaining residues and the hindrance was very serious, resulting in a great change in the trend of Ea with α and a large increase in the average Ea.
Combined with Fig. 2, it can be seen that in stage 1, ΔTG, Friedman and KAS methods all indicate the synergistic effect of mixtures with different ratios. In stage 2, the average Ea of all mixtures calculated by the Friedman method was greater than that of DP, while the average Ea of mixtures calculated by the KAS method with 20 wt% and 40 wt% DP was slightly less than that of DP. Each method has certain reference values and also has some limitations. The mixtures were judged comprehensively by combining the three methods to show an overall inhibitory effect in stage 2.
In summary, the addition of PS had a synergistic effect on the pyrolysis of DP by kinetic analysis. This not only offers an analytical approach to clarify the mechanism of the co-pyrolysis process but also provides strong theoretical support for more efficient treatment of waste EMs through co-pyrolysis with biomass.
3.3 NOx emission characteristics during co-pyrolysis
The NOx emission characteristics of DP, PS and their mixtures with different ratios during pyrolysis in an inert atmosphere (N2) were investigated by fixed-bed experiments. The experimental results showed that the NOx released from DP pyrolysis was mainly in the form of NO. This is because N in DP exists in the form of O-NO2, and NO2 is first released during pyrolysis. NO2 reacts with CH2O released during pyrolysis to form CO, NO, and H2O (Yan et al., 2009a; Yan et al., 2009b). At the same time, NO2 reacts rapidly with H and O radicals to transform into NO (Glarborg et al., 2018).
To determine the temperature conditions with the lowest NOx emissions, the NOx release curves of 50 mg DP during pyrolysis at different temperatures (400 ℃, 600 ℃, 800 ℃, 900 ℃, 1000 ℃) were shown in Fig. 6a. As can be seen from the figure, the peak value of NOx gradually decreased with the increase in temperature. Fig. 6b displayed the variation of NOx emissions with temperature, calculated from the NOx release curves (Fig. 6a) by Eq. (8). The results were that the NOx emissions decreased gradually from 19.94 mg to 11.52 mg as the temperature increased from 400 ℃ to 900 ℃. This is mainly attributed to the increase in the reaction rate of CO, H2, CHi, etc. released by pyrolysis to reduce NO to N2 with the increase in temperature (Glarborg et al., 2018). The global reaction equation is as follows: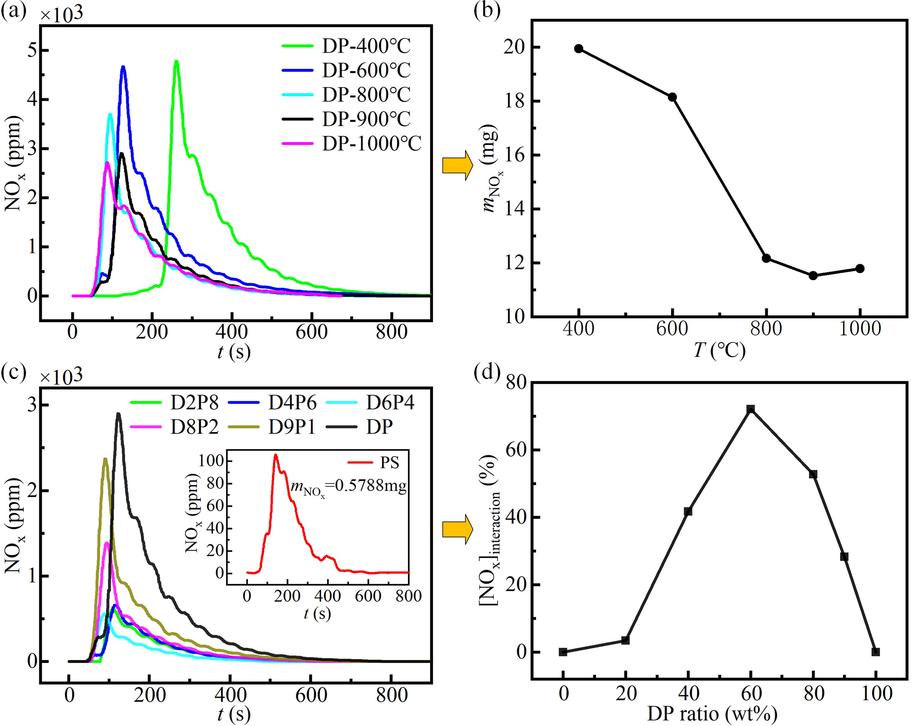
(a) NOx release curves of DP during pyrolysis at different temperatures. (b) NOx emissions of DP during pyrolysis at different temperatures. (c) NOx release curves of DP, PS and their mixtures with different ratios during pyrolysis at 900 ℃. (d) Interaction of mixtures with different ratios in NOx emissions.
When the temperature increased from 900 ℃ to 1000 ℃, the NOx emissions increased slightly. This may be because the pyrolysis rate of DP at 1000 ℃ is too fast, and the residence time of pyrolysis gas in the reactor becomes shorter, resulting in a smaller reduction of NO. Therefore, 900 ℃ is the temperature condition with the lowest NOx emission during DP pyrolysis alone. In the following, the interaction between DP and PS during co-pyrolysis was studied at this temperature.
The NOx release curves of DP, PS and their mixtures with different ratios during pyrolysis at 900 ℃ were plotted in Fig. 6c. Compared with the NOx emission of 50 mg DP pyrolysis alone (11.52 mg), the amount of 50 mg PS was very small, only 0.58 mg. The huge difference in NOx emissions is the reflection of the huge gap in nitrogen content between DP and PS. As can be seen from Table 1, the nitrogen content of PS was 0.12 wt%, while the nitrogen content of DP was as high as 14.91 wt%. Moreover, the lowest NOx peak was observed for D6P4 (i.e., DP ratio of 60 wt%) among the mixtures with different ratios. With the exception of D6P4, the other ratio mixtures showed a gradual increase in the NOx peak with the increase of the DP ratio.
To evaluate the interaction of DP and PS during co-pyrolysis, the percentage increase/decrease of actual NOx emissions compared to the predicted values ([NOx]interaction) was calculated. The results were shown in Fig. 6d. It can be seen from the figure that the [NOx]interaction of the mixtures were all positive, that is, the actual NOx emissions were lower than the expected values. This meant that co-pyrolysis of DP and PS can reduce NOx emissions, and there were synergistic effects when they were mixed in different ratios. Furthermore, with the increase of DP ratios, the synergy first increased and then decreased. When the DP ratio was 60 wt% (D6P4), the NOx emissions reduction percentage was the highest (72.11 %), and the best synergy was achieved. This is strong evidence that co-pyrolysis technology with biomass has shown excellent advantages for the NOx emissions that are a headache when treating waste EMs. This is a feasible way to treat waste EMs economically and cleanly, which is of great significance to practical engineering applications.
3.4 The proposed mechanism of interaction
The interaction mechanism of DP and PS during co-pyrolysis was investigated under the optimum conditions (900℃, DP ratio of 60 wt%). Firstly, the role of char produced by PS on NOx emission in co-pyrolysis was determined. 20 mg PS was pyrolyzed at 900 ℃ in an inert environment (N2) to produce char, which was recorded as PS-char. The obtained PS-char was mixed with 30 mg DP and co-pyrolyzed at 900℃. The NOx release curve was given in Fig. 7a. The results showed that the NOx emissions of the PS-char and DP mixture was reduced by 18.40 %, while that of the PS and DP mixture was reduced by 72.11 %. This suggested that PS-char played a role in reducing NOx emissions during co-pyrolysis, which was the heterogeneous reduction mechanism of char to NOx (Hashemi et al., 2011). However, PS-char was not the main source of synergy between DP and PS.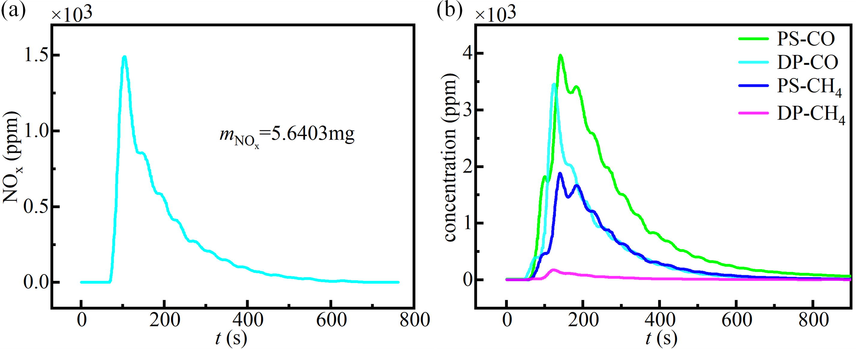
(a) NOx release curve of the mixture of char obtained by pyrolysis of 20 mg PS and 30 mg DP co-pyrolyzed at 900℃. (b) The release curves of CO and CH4 during the pyrolysis of DP and PS alone.
Then, the effect of reducing gases released during pyrolysis was studied. The release curves of CO and CH4 during the pyrolysis of DP and PS alone were seen in Fig. 7b. It can be seen that both CO and CH4 released by PS pyrolysis were more than those released by DP pyrolysis, especially the CH4 increased dramatically. This indicated that PS pyrolysis would release a large amount of CO, CHi. H2 was also the main products of PS pyrolysis (Chen et al., 2022a). CO, CHi, and H2 react with NO to reduce NO to N2, resulting in lower NOx emissions. Moreover, N in PS is mainly released in the form of NH3 (Tchapda and Pisupati, 2014), which acts as a reducing agent and plays an important role in the denitration process (Van Caneghem et al., 2016).
In addition, it can be seen from Table 1 that the LHV of PS is higher than that of DP, and there may be a local high-temperature zone during the pyrolysis of the mixture, which accelerates the rate of the above homogeneous reaction. Char also serves as a catalyst in the above homogeneous reactions (Hashemi et al., 2011), accelerating the reaction rate. Furthermore, it has been reported that alkali metals in biomass could perform a catalytic role (Hu et al., 2017; Wang et al., 2016) to promote the reduction of NO.
Nevertheless, this does not mean that the more PS in the mixture, the better the synergy. PS has a higher O/N ratio, which leads to the formation of more OH and O radicals during pyrolysis (Hu et al., 2017; Wang et al., 2016). These free radicals promote the conversion of N to NO (Glarborg et al., 2018), resulting in an inhibitory effect. At the pyrolysis temperature of 900 ℃, the pyrolysis of DP and PS in the mixture is almost synchronous. There may be a reaction zone on the surface of the solid phase, in which the reduction of NO and the inhibition of O and OH radicals act together. Ultimately, there is an optimal mixing ratio (60 wt% DP + 40 wt% PS) that minimizes NOx emissions. This mechanism research can help further optimize the co-pyrolysis conditions and give full play to the great advantages of co-pyrolysis technology with biomass in the treatment of waste EMs. It is worth expanding in the future.
3.5 Pyrolysis residue analysis
Morphological and surface elemental analysis of the residue after pyrolysis of the raw materials and mixtures contributes to a more comprehensive understanding of the interaction mechanisms. The morphology and surface element content obtained by SEM + EDS were shown in Figs. S1 and S2, respectively. As can be seen from Fig. S1, the microscopic morphologies of the raw material DP and PS were blocky and elongated, respectively, which reflects the differences in their structures. The microscopic morphology of the residues when DP and PS were pyrolyzed alone was similar to that of their respective raw materials. As the DP ratio increased, the morphological properties of the mixture residues tended to be that of the DP alone. Fig. S2 showed that only the raw material surface of DP contained element N, and the surface of residues after pyrolysis of PS and mixtures with different ratios (0–100 wt% DP) did not contain element N. This indicated that all the N elements of DP were released as volatile during the co-pyrolysis process, and PS was not a reduction of NOx emissions in the form of fixed N in the residue. This also served to illustrate the interaction mechanism for the efficient NOx emission reduction described above.
4 Conclusions and further work
The kinetics and NOx emission characteristics of waste double-base propellant (DP) and pine sawdust (PS) during co-pyrolysis were investigated using thermogravimetric analysis and fixed-bed experiments, respectively. The following points may be concluded from the study conducted in this paper.
The kinetic analysis of Friedman and KAS isoconversional methods showed that the average activation energy of the mixtures during co-pyrolysis was smaller than that of DP pyrolysis alone. The addition of PS improved the pyrolysis reactivity of the mixture.
Fixed-bed experiments demonstrated that NO was the main form of NOx released by DP pyrolysis alone. In the range of 400–1000 ℃, the NOx emissions for 50 mg DP alone pyrolysis gradually decreased from 19.94 mg and then slightly increased. The lowest NOx emission was reached at 900 ℃ with 11.52 mg.
In the co-pyrolysis at 900 ℃, the addition of PS with different ratios inhibited the NOx emission of the mixture. At the mixture ratio of 60 wt% DP and 40 wt% PS, the best synergistic effect was achieved, and the actual NOx emission was reduced by 72.11 % compared with the expected value.
This study shows that the co-pyrolysis of DP and PS presents significant advantages in reducing NOx emissions, which provides an available path for clean and economical disposal of waste energetic materials. In particular, it gives a valuable reference for practical applications on an industrial scale.
Further work will study the effect of DP and PS mixtures on NOx emission under different temperature and atmosphere conditions. Most importantly, the mechanism of NOx emission reduction by mixing DP and PS needs to be fully studied.
Data availability
Data will be made available on request.
CRediT authorship contribution statement
Guorui Jin: Conceptualization, Methodology, Validation, Formal analysis, Writing – original draft, Writing – review & editing, Visualization. Moru Wang: Conceptualization, Validation, Writing – review & editing. Jianwei Zhang: Methodology, Writing – review & editing. Ling Chen: Writing – review & editing. Xin Liao: Writing – review & editing, Supervision. Weidong He: Writing – review & editing.
Acknowledgements
Thanks to the Key Laboratory of Special Energy Materials for supporting this study.
Funding information
This research did not receive any specific grant from funding agencies in the public, commercial, or not-for-profit sectors.
Declaration of Competing Interest
The authors declare that they have no known competing financial interests or personal relationships that could have appeared to influence the work reported in this paper.
References
- Release of nitrogen precursors from coal and biomass residues in a bubbling fluidized bed. Energ. Fuel.. 2008;22:363-371.
- [CrossRef] [Google Scholar]
- Solid propellant utilization by the burning propellant-coal and propellant-peat mixtures. Int. J. Energ. Mater. Chem. Propul.. 1997;4:145-152.
- [CrossRef] [Google Scholar]
- Baxter, L., Davis, K., Sinquefield, S., Huey, S., Lipkin, J., Shah, D., Ross, J., Sclippa, G., 1996. Combustion aspects of the reapplication of energetic materials as fuels as a viable demil technology, 26. international symposium on combustion, Naples (Italy), 28 Jul-2 Aug 1996.
- Co-pyrolysis of coal-biomass: study on reaction kinetics and thermodynamics. Biofuel. Bioprod. Bior.. 2021;16:725-742.
- [CrossRef] [Google Scholar]
- Buckley, S.G., Robinson, A.L., Baxter, L.L., 1997. The reapplication of energetic materials as boiler fuels, The 5th Global Demilitarization Symposium and Exhibition.
- A simple and precise differential incremental isoconversional method to kinetic analysis of heterogeneous processes under arbitrary temperature programs. Thermochim. Acta. 2018;661:116-123.
- [CrossRef] [Google Scholar]
- Insight into biomass pyrolysis mechanism based on cellulose, hemicellulose, and lignin: Evolution of volatiles and kinetics, elucidation of reaction pathways, and characterization of gas, biochar and bio-oil. Combust. Flame.. 2022;242:112142
- [CrossRef] [Google Scholar]
- Sol-gel synthesis of insensitive nitrated bacterial cellulose/cyclotrimethylenetrinitramine nano-energetic composites and its thermal decomposition property. Cellul.. 2022;29:7331-7351.
- [CrossRef] [Google Scholar]
- Nitric oxide formation during corn straw/sewage sludge co-pyrolysis/gasification. J. Clean. Prod.. 2018;197:97-105.
- [CrossRef] [Google Scholar]
- Finding the best operating condition in a novel process for explosive waste incineration using fluidized bed reactors. Comput. Chem. Eng.. 2020;142:107054
- [CrossRef] [Google Scholar]
- Proximate analysis of coal by micro-TG method. J. Anal. Appl. Pyrol.. 2018;133:82-90.
- [CrossRef] [Google Scholar]
- Co-combustion characteristics of electrolytic aluminum waste and coal. Fuel. 2022;325:124890
- [CrossRef] [Google Scholar]
- Hazard analysis of technologies for disposing explosive waste. J. Hazard. Mater.. 2002;90:123-135.
- [CrossRef] [Google Scholar]
- Assessment of technologies for disposing explosive waste. J. Hazard. Mater.. 2002;90:137-153.
- [CrossRef] [Google Scholar]
- Technologies for the nitrogen oxides reduction from flue gas: A review. Sci. Total. Environ.. 2020;714:136712
- [CrossRef] [Google Scholar]
- Fuel nitrogen conversion in solid fuel fired systems. Prog. Energ. Combust.. 2003;29:89-113.
- [CrossRef] [Google Scholar]
- Modeling nitrogen chemistry in combustion. Prog. Energ. Combust.. 2018;67:31-68.
- [CrossRef] [Google Scholar]
- A model for nitrogen chemistry in oxy-fuel combustion of pulverized coal. Energ. Fuel.. 2011;25:4280-4289.
- [CrossRef] [Google Scholar]
- Influence of volatiles-char interactions between coal and biomass on the volatiles released, resulting char structure and reactivity during co-pyrolysis. Energ. Convers. Manage. 2017;152:229-238.
- [CrossRef] [Google Scholar]
- Investigation of thermal behavior of pine sawdust and coal during co-pyrolysis and co-combustion. Energy. 2021;231:120895
- [CrossRef] [Google Scholar]
- Shrinking particle reaction model for a waste double-base propellant during alkaline hydrolysis. Propellants. Explos. Pyrot.. 2021;46:1866-1877.
- [CrossRef] [Google Scholar]
- Co-combustion of wheat straw and camphor wood with coal slime: Thermal behaviour, kinetics, and gaseous pollutant emission characteristics. Energy. 2021;234:121292
- [CrossRef] [Google Scholar]
- Co-firing of coal and biomass under pressurized oxy-fuel combustion mode in a 10 kWth fluidized bed: Nitrogen and sulfur pollutants. Chem. Eng. J.. 2022;450:138401
- [CrossRef] [Google Scholar]
- Gas emission characteristics of sewage sludge co-combustion with coal: Effect of oxygen atmosphere and feedstock mixing ratio. Fuel. 2022;322:124102
- [CrossRef] [Google Scholar]
- Kinetic and thermodynamic analyses during co-pyrolysis of greenhouse wastes and coal by TGA. Renew. Energ.. 2021;163:453-464.
- [CrossRef] [Google Scholar]
- Thermal decomposition characteristics of expired single-based propellant using a lab-scale tube furnace and a thermo-gravimetric analysis reactor. J. Therm. Anal. Calorim.. 2016;124:657-665.
- [CrossRef] [Google Scholar]
- Emission, distribution and toxicity of polycyclic aromatic hydrocarbons (PAHs) during municipal solid waste (MSW) and coal co-combustion. Sci. Total. Environ.. 2016;565:1201-1207.
- [CrossRef] [Google Scholar]
- Generalized master plots as a straightforward approach for determining the kinetic model: The case of cellulose pyrolysis. Thermochim. Acta. 2013;552:54-59.
- [CrossRef] [Google Scholar]
- Co-firing of Thai lignite and municipal solid waste (MSW) in a fluidised bed: Effect of MSW moisture content. Appl. Therm. Eng.. 2010;30:2693-2697.
- [CrossRef] [Google Scholar]
- A review of thermal co-conversion of coal and biomass/waste. Energies. 2014;7:1098-1148.
- [CrossRef] [Google Scholar]
- Interactions in NOx chemistry during fluidized bed co-combustion of residual biomass and sewage sludge. Fuel. 2021;294:120431
- [CrossRef] [Google Scholar]
- NOx reduction in waste incinerators by selective catalytic reduction (SCR) instead of selective non catalytic reduction (SNCR) compared from a life cycle perspective: a case study. J. Clean. Prod.. 2016;112:4452-4460.
- [CrossRef] [Google Scholar]
- Synergetic effect of sewage sludge and biomass co-pyrolysis: A combined study in thermogravimetric analyzer and a fixed bed reactor. Energ. Convers. Manage.. 2016;118:399-405.
- [CrossRef] [Google Scholar]
- 3D printing of gun propellants based on laminated object manufacturing. Mater. Manuf. Process.. 2022;37:1246-1256.
- [CrossRef] [Google Scholar]
- Integration of complex geometry gun propellant form function calculation and geometry optimization. Propellants, Explos. Pyrot.. 2022;47
- [CrossRef] [Google Scholar]
- Evaluation of combustion properties and pollutant emission characteristics of blends of sewage sludge and biomass. Sci. Total. Environ.. 2020;720:137365
- [CrossRef] [Google Scholar]
- TG-FTIR study on waste propellants for enhanced combustion of anthracite. Chin. J. Energ. Mater.. 2019;27:304-310.
- [Google Scholar]
- Combustion mechanism of double-base propellant containing nitrogen heterocyclic nitroamines (I): The effect of heat and mass transfer to the burning characteristics. Combust. Flame.. 2009;156:633-641.
- [CrossRef] [Google Scholar]
- Combustion mechanism of double-base propellant containing nitrogen heterocyclic nitroamines (II): The temperature distribution of the flame and its chemical structure. Acta Astronaut.. 2009;64:602-614.
- [CrossRef] [Google Scholar]
- Experimental and numerical investigation of the combustion characteristics and NO emission behaviour during the co-combustion of biomass and coal. Fuel. 2021;287:119383
- [CrossRef] [Google Scholar]
- Study on NOx emission during corn straw/sewage sludge co-combustion: Experiments and modelling. Fuel. 2021;285:119208
- [CrossRef] [Google Scholar]
- Effect of inherent mineral matter on the co-pyrolysis of highly reactive brown coal and wheat straw. Fuel. 2019;239:1194-1203.
- [CrossRef] [Google Scholar]
Appendix A
Supplementary data
Supplementary data to this article can be found online at https://doi.org/10.1016/j.arabjc.2023.104647.
Appendix A
Supplementary data
The following are the Supplementary data to this article:Supplementary data 1
Supplementary data 1


