

Translate this page into:
Electrochemical DNA biosensor for the detection of human papillomavirus E6 gene inserted in recombinant plasmid
⁎Corresponding author. Tel.: +55 81 2126 8484; fax: +55 81 2126 8000. daniellylsantos@hotmail.com (Danielly S. Campos-Ferreira) daniellylsantos@gmail.com (Danielly S. Campos-Ferreira)
-
Received: ,
Accepted: ,
This article was originally published by Elsevier and was migrated to Scientific Scholar after the change of Publisher.
Peer review under responsibility of King Saud University.

Abstract
In the current study, we describe a novel, simple, inexpensive, sensitive, specific, stable and label-free electrochemical DNA biosensor used to identify a target gene cloned into a plasmid. The biosensor was designed with a 23-mer oligonucleotide of guanine-free, which was immobilized on the pencil graphite electrode (PGE) for E6 gene detection from human papillomavirus 16 type (HPV16). The E6 gene was used due to its clinical importance. The optimal probe concentration was obtained in 500 nM. The hybridization detection showed a good linearity in the range of 40–5,000 pg/μL with a detection limit of 16 pg/μL. The electrochemical method showed higher sensitivity and specificity when compared with the agarose gel electrophoresis assay. This technology could be postulated as a new and attractive alternative for cloning analysis in plasmids.
Keywords
Electrochemical DNA biosensor
Direct DNA detection
Inosine-probe
Human papillomavirus 16
Electrophoresis standard method

1 Introduction
There are over 160 known types of human papillomavirus (HPV) (Burk et al., 2013), of which 40 can infect the anogenital epithelium and of these 15 are considered oncogenic (Lin et al., 2010). The HPV 16 and 18, classified as high-risk types (HR), are responsible for approximately 60–80% of cervical cancer occurrence worldwide (Carter et al., 2011; Hendry et al., 2013).
Several studies show that HPV encodes two powerful oncogenes, E6 and E7. These oncogenes are constantly expressed in the HR-HPV and are responsible for the malignant transformation of cervical cancer (Azam and Shams-ul-Islam, 2010; Boccardo et al., 2010; Carter et al., 2011; Stanley, 2010; Vici et al., 2014). Therefore, the E6 and E7 genes represent the ideal targets for development of therapeutic vaccines, which potentially eliminate pre-existing lesions and malignant tumors by generating cellular immunity against HPV-infected cells (Huang et al., 2010; Kawana et al., 2012; Nieto and Salvetti, 2014).
Progress in the molecular cloning techniques has enabled the relatively quick, easy and cheap manufacture of recombinant vector vaccines (Huang et al., 2010; Hung et al., 2008). Recombinant vector vaccines have many advantages over conventional vaccines and may provide a technological solution for microorganisms that have difficulty growing in cell culture or animal models, like HPV (Ferraro et al., 2011; Lin et al., 2010; Ma et al., 2010).
The most popular technique used for molecular cloning analysis is the electrophoresis method in agarose gels. However, this technique requires well-trained personnel and is time-consuming (Chang et al., 2013; Teles and Fonseca, 2008).
DNA biosensors are commonly employed to detect a specific DNA sequence (Pei et al., 2013; Tosar et al., 2010), but less explored for cloning analysis. In the current study we describe a novel, simple, inexpensive, stable and label-free DNA electrochemical biosensor for the detection of HPV 16 E6 gene cloned in the expression vector.
2 Materials and methods
2.1 Materials
Escherichia coli DH5α (Invitrogen – USA) and pGEM-T Easy (pGEM-T) (Promega – USA) were used as host and cloning vectors, respectively. Bacterial growth was performed in a Luria–Bertani (LB) medium (tryptone 10 g/L, yeast extract 5 g/L and NaCl 10 g/L, pH 7.0), supplemented with 100 mg/L ampicillin, 160 μg/mL X-gal and 0.5 mM IPTG (Isopropyl β-d-1-thiogalactopyranoside). T4 DNA ligase, DNA size marker and EcoRI, XbaI and ApaI restriction enzymes were purchased from Invitrogen – USA. DNA polymerase and QIAquick PCR Purification Kit were supplied from Clontech Company – USA and QIAgen – Germany, respectively.
Pencil lead (type 4B), commonly composed of natural graphite, a polymeric binder and clay in different percentages, was used as pencil graphite electrode (PGE).
The 23-mer, guanine-free oligonucleotide (5′-ATI CAC CAA AAI AIA ACT ICA AT-3′, purchased from Integrated DNA Technologies – USA), correspondent to the sense strand of the HPV 16 E6 gene, was employed as HPV probe.
The oligonucleotide solutions and dilute solutions of the plasmids were prepared with 0.5 M acetate buffer (pH 5.0) and kept frozen.
2.2 Construction of recombinant bacteria
The pBR322 vector, containing the HPV 16 gene, was used as the backbone for construction of the pGEM-T. E6 amplification was performed using 20 ng DNA; 10 pmol of specific primers: FE6EcoRI (5′-GCT GAA TTC ATG CAC CAA-3′) and RE6XbaI (5′CGT TCT AGA ATC AGC TGG GT-3′); 2.5 μL Buffer Taq Platinum 10×; 0.5 μL Platinum TaqPol (5 U/μL); 0.5 μL MgCl2 (50 mM); and 0.5 μL dNTP (40 μM).
Amplifications were carried out in Rotor Gene 6.0 (Applied Biosystems – USA) with the following settings: 95 °C for 1 min, followed by 40 cycles at 95 °C for 30 s, 68 °C for 20 s (touchdown each 5 cycles) and 72 °C for 1 min, ending with 72 °C for 1 min. The amplified products were subjected to agarose electrophoresis (Sambrook et al., 1989) and purified with QIAquick PCR Purification Kit.
E6 amplicon was cloned into pGEM-T following the manufacturer’s instructions. The vector was transformed in E. coli DH5α competent cells by heat shock and incubated at 37 °C for 16 h (Sambrook et al., 1989). Recombinant colonies containing pGEM-T were identified through an ampicillin-resistance medium. The plasmid was extracted from the positive recombinant colonies by alkaline lysis and later analyzed by agarose gel electrophoresis (Sambrook et al., 1989). The EcoRI and XbaI restriction enzymes were used to liberate the E6 gene from the pGEM-T/E6 and ApaI was used to linearize the recombinant vector.
E6 gene sequence was confirmed using DYEnamic™ ET Dye Terminators in an automated DNA sequencing system (MegaBACE 750, GE, Life Science – USA). The electropherogram was analyzed using the base calling algorithm by Sequence Analyzer software (GE, Life Science – USA). The sequence obtained was submitted to BLASTN (NCBI – National Center for Biotechnology Information) for comparison with the E6 gene sequence present in NCBI databank.
2.3 Apparatus
The electrochemical experiments were performed using the AUTOLAB PGSTAT 30 (METROHM AUTOLAB – Netherlands) and the GPES 4.9 software package. Voltammetric signals were measured using a system consisting of two electrodes (Ronkainen et al., 2010; Wang et al., 2008). The pencil graphite was used as a working electrode and Ag/AgCl was used as a reference electrode. The working electrode had a surface area of 28 mm2 that corresponded to electrochemical area. The working electrode was polished with an emery-impregnated disk to obtain a smooth surface. The reference electrode was produced by screen-printing in silver-ink (ELECTRODAG – Acheson – USA) on a gold wire, which was then dried at 60 °C.
2.4 Activation of PGE
The electrochemical activation of the surface polished PGEs was carried out applying a fixed potential of +1.8 V in 0.5 M acetate buffer solution (pH 5.0), no stirring, for 5 min (Hejazi et al., 2007; Pournaghi-Azar et al., 2006; Souza et al., 2011).
2.5 Immobilization of the probe on the PGE
The probe immobilization was achieved on the activated PGE by applying a fixed potential of +0.5 V, for 5 min in 0.5 M acetate buffer solution (pH 5.0), no stirring (Hejazi et al., 2007; Pournaghi-Azar et al., 2006; Souza et al., 2011).
2.6 Hybridization
The diluted solutions of the undigested pGEM-T/E6 were denatured at 95 °C, for 5 min, and then immersed in an ice bath for 1 min (Hejazi et al., 2008). The hybridization was performed by immersing the probe-modified PGE into the eppendorf tube, containing 70 μL of the diluted solutions of undigested pGEM-T/E6 at 55 °C, for 5 min. The same protocol was applied for the hybridization of the probe with non-complementary target (undigested pGEM-T/E7), mix target (undigested pGEM-T/E6 and undigested pGEM-T/E7) and in the blank solution, which was composed by 0.5 M buffer acetate (pH 5.0).
2.7 Electrochemical measurements
The electrochemical behavior of the PGE surface was studied using the differential pulse voltammetry (DPV) technique in 20 mM Tris–HCl buffer (pH 7.0) (Hejazi et al., 2007; Pournaghi-Azar et al., 2006; Pournaghi-Azar et al., 2009; Souza et al., 2011). A scanning of the electrode potential was held between +0.3 V and +1.2 V, at a pulse amplitude of 50 mV and a scan rate of 20 mV s−1. The results were treated by means of the GPES software moving average baseline correction, using a “peak width” of 0.01. All the experiments were performed in triplicate at room temperature (23 °C).
2.8 Statistics analysis
Experimental data were analyzed by STATISTICA 8 software. The one-way analysis of variance (ANOVA) was carried out to determine the existence of statistical differences between the samples, then followed by Tukey’s post hoc parametric test (Chan, 2003; Montgomery, 2000; Tukey, 1991). A p value of <0.05 was considered significant.
3 Results and discussion
3.1 Construction of recombinant plasmid pGEM-T/E6
The pBR322 vector containing complete genome of HPV16 was used as template DNA for amplification of the E6 gene. The primers used for amplification contained the appropriate endonuclease restriction sites for posterior cloning into the vector (FE6EcoRI and RE6XbaI). The PCR product (E6 amplicon) was size fractionated using gel electrophoresis. The presence of a 477 bp DNA band confirmed the E6 gene amplification (Fig. S1-A in supplementary information). The E6 amplicon was sequenced to confirm the integrity of the amplification. The nucleotide sequencing was submitted to the BLAST program (NCBI) and showed 100% similarity with the E6 sequence of HPV 16 deposited in the GenBank.
The amplified DNA (E6 amplicon) was ligated to pGEM-T, and the products of the ligation reaction (pGEM-T/E6) were used to transform E. coli DH5α competent cells. Plasmid pGEM-T carries genes that provide resistance to ampicillin (Bury-Moné et al., 2009). Thus, the bacteria were plated on solid LB medium supplemented with ampicillin in order to allow for its growth. The bacterial colonies grown indicated that these bacteria incorporated the plasmid. The plasmid extracted from the positive clones was subjected to enzymatic digestion. Digestion of the plasmid with EcoRI and XbaI confirmed the presence of the DNA inserted (477 bp) in the pGEM-T/E6. According to the gel electrophoresis, the pGEM-T/E6 contained the desired insert (3495 bp), since the E6 gene fragment observed on the gel was of approximately 477 bp, and the pGEM-T vector had a length of approximately 3,018 bp (Fig. S1-B in supplementary information).
3.2 Electrochemical detection of pGEM-T/E6
3.2.1 Influence of the pretreatment on PGE surface
Fig. S2 (supplementary information) shows the DPV voltammograms obtained in 20 mM Tris–HCl buffer (pH 7.0) for non-activated bare PGE, E6 probe immobilized on the non-activated PGE, activated bare PGE, and E6 probe immobilized on the activated PGE.
The electrode surface was pretreated applying a potential of +1.8 V for 5 min in order to obtain a more sensitive and stable analytical signal (Hejazi et al., 2007; Pournaghi-Azar et al., 2006; Souza et al., 2011). Then, the inosine-modified probe (guanine-free) was immobilized on the non-activated and activated PGE. The probe immobilization on the electrode surface occurred by adsorption, which is considered the simplest method to immobilize DNA because it does not require special reagents or nucleic acid modifications (Pividori et al., 2000; Souza et al., 2011).
The inosine oxidation signal was around +0.7 V, well separated from that of the guanine (+0.9 to +1.07 V) (Berti et al., 2009; Palecek, 1960; Tosar et al., 2010; Wang et al., 1998, 2001; Wang and Zhou, 2002). Inosine is a base, which is not naturally present in DNA but can also base-pair with cytosine, as guanine does (Tosar et al., 2010). This fact should be considered when performing detection based on the guanine oxidation signal in real samples (Tosar et al., 2010).
As seen in Fig. S2, no significant difference was observed among the current peaks of the non-activated bare electrode, the activated bare electrode and the probe-modified non-activated electrode. While the signal of probe-modified activated electrode was significantly higher than signals of three other electrodes, which indicate that probe was successfully immobilized on the surface of activated electrode.
These results clearly demonstrate that the application of the potential (+1.8 V) on the PGE surface exerts a positive effect on the adsorption of the oligonucleotides (Souza et al., 2011). The pretreatment of the carbon surface increases its roughness and hydrophilicity, thus facilitating the electrodes’ adsorption to DNA (Pividori et al., 2000; Sabzi et al., 2008; Souza et al., 2011; Wang et al., 1996). So, all experiments were performed on activated PGE.
3.2.2 Effect of probe concentration
The effect of the probe concentration is shown in Fig. 1. Different concentrations of the E6 probe (125–2,000 nM) were immobilized on the activated working electrode surface by applying a fixed potential of +0.5 V in acetate buffer (pH 5.0), for 5 min (Hejazi et al., 2007; Pournaghi-Azar et al., 2006; Souza et al., 2011). This potential improves the stability of the immobilized probe onto carbon surface because it increases the electrostatic attraction between the positively charged carbon surface and the negatively charged hydrophilic sugar-phosphate probe backbone (Palecek et al., 1998; Souza et al., 2011).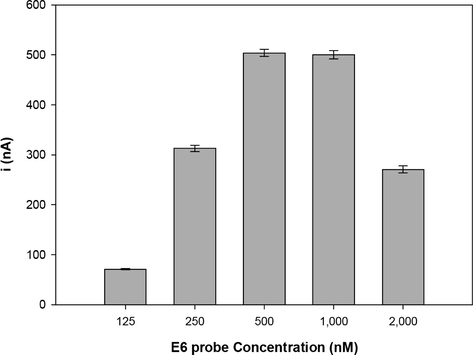
Current peaks of the guanine oxidation signal with different concentrations of the probe analyzed (n = 3). Various concentrations of E6 probe modified activated PGE (125, 250, 500, 1,000 and 2,000 nM). The oxidation signal was obtained by differential pulse voltammetry in 20 mM Tris–HCl buffer (pH 7.0).
As seen in Fig. 1, the peak current increased significantly with the increase in the probe concentration. The results showed that the oxidation peak current increased from 125 nM (71 ± 1 nA) to 1,000 nM (500 ± 8 nA). At a concentration of 2,000 nM, there was a decrease of this peak current (271 ± 7 nA). This can be explained by the massive probe accumulation on the graphite electrode, which can lead to the development of overlapping probes (Pournaghi-Azar et al., 2006), resulting in a lower availability of the inosine bases.
The ANOVA parametric test followed by Tukey’s test were used to compare the data (significant level p < 0.05) (Chan, 2003; Montgomery, 2000; Tukey, 1991). The results showed that there were no statistically significant differences between the concentrations of 500 nM and 1,000 nM (p = 0.97). Therefore, the concentration of 500 nM was selected as optimum concentration for immobilization on the activated electrode.
3.2.3 Hybridization detection
Electrochemical hybridization biosensors can potentially be used in DNA detection (Tosar et al., 2010). They can reduce the time and simplify the protocol of several assays, facilitating detection of specific nucleic acid sequence (Campos-Ferreira et al., 2013; Girousi and Kinigopoulou, 2010; Nascimento et al., 2012; Tang et al., 2009). DNA hybridization is based on the ability of ssDNA to recognize its complementary DNA sequence, forming the DNA duplex chain (hybrid) (Campos-Ferreira et al., 2013; Nascimento et al., 2012; Wang et al., 2008).
Fig. 2 shows the electrochemical detection of label-free DNA hybridization by the DPV technique. After probe immobilization on the activated PGE, the modified-electrode was immersed in a microtube containing the denatured target DNA (undigested pGEM-T/E6). The hybridization was directly detected through guanine oxidation signals present in the plasmid sequence. Label-free detection represents an attractive approach for detecting hybridization reaction because it eliminates the indicator addition step, simplifying the sensing protocol (Labuda et al., 2010; Vagin et al., 2003, 2008; Wang et al., 1999).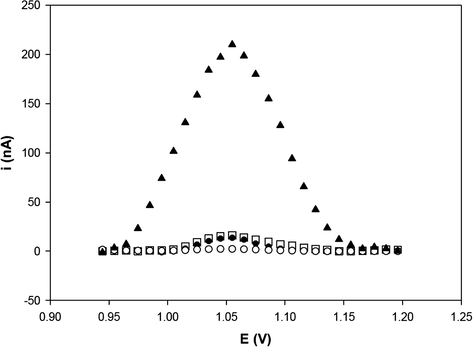
Differential pulse voltammograms of guanine oxidation at activated PGE: before probe immobilization (○), after E6 probe immobilization (●), after hybridization with the undigested plasmid solution (pGEM-T/E6) (▴) and after hybridization with the blank solution (□). Solution concentration: 500 nM solution of E6 probe and 300 pg/μL of target (undigested pGEM-T/E6). The oxidation signal was obtained by differential pulse voltammetry in 20 mM Tris–HCl buffer (pH 7.0).
The voltammogram for probe-modified PGE after hybridization with denatured DNA target showed that there was a significant increase (15-fold) in the oxidation peak current of guanine. This peak current increase represents the hybridization event on the electrode surface.
3.2.4 Analytical performance of the sensor
Firstly, calibration experiments were carried out to evaluate the analytical performance of the sensor. The influence of plasmid concentration on the PGE surface was observed by guanine oxidation signals.
Different concentrations of undigested pGEM-T/E6 (40–15,000 pg/μL) were hybridized on the modified electrode surface and then the guanine oxidation signal was obtained using DPV (Fig. 3).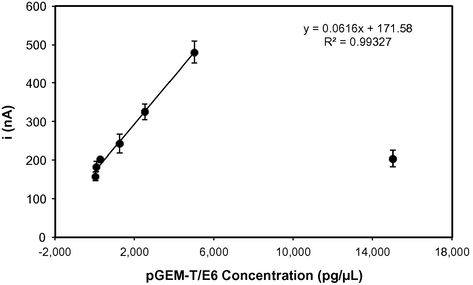
The effect of the different concentrations of the undigested pGEM-T/E6 during hybridization event using DPV response of the guanine oxidation signal (n = 3).The black line represents the linear regression at a concentration range of 40–5,000 pg/μL. The oxidation signal was obtained by differential pulse voltammetry in 20 mM Tris–HCl buffer solution (pH 7.0).
The peak current increased with the increase in the plasmid concentration and reached a maximum value at concentration 5,000 pg/μL (158 ± 11 nA to 480 ± 28 nA). However, when the concentration reached 15,000 pg/μL, there was a decrease in the oxidation signal (204 ± 21 nA). This decrease can be attributed to the saturation of hybridization surface sites, caused by a steric and electrostatic hindrance in the DNA bases (Erdem et al., 2006; Hejazi et al., 2010; Wang and Kawde, 2001; Wong and Melosh, 2010). Therefore, 5,000 pg/μL of pGEM-T/E6 is the maximum concentration allowed in order to form hybrids on the probe-modified electrode surface.
As seen in Fig. 3, the signal was linear up to 5,000 pg/μL, with a determination coefficient (R2) of 0.99327 for the complementary target. The regression equation was I (nA) = 0.0616C (pg/μL) +171.58. The detection limit of the method was 16 pg/μL, estimated by the equation 3σ/a, where σ was the standard deviation of the blank solution, and a was the slope of the liner regression (Skoog et al., 1998). The detection limit is described as the lowest concentration level of the analyte that produces a detectable response above the noise level of the system (Armbruster and Pry, 2008). Table 1 shows detection limits of some electrochemical DNA sensors (based on label as well as label-free detection). As seen in Table 1, the proposed sensor has a low detection limit, comparable to other DNA sensors.
Nucleic acid biosensor
Electrode
Electrochemical technique
Linear range of the hybridization
Detection limit
References
Detection of human interleukine-2 gene
PGEa
DPVb
10–250 nM
36 pg/μL
Pournaghi-Azar et al. (2007)
Electrochemical detection of human papillomavirus (HPV)
PGE
SWVc
–
1.2 ng/μL
Sabzi et al. (2008)
Zirconia based nucleic acid sensor for Mycobacterium tuberculosis detection
Gold
DPV
1–150 ng/μL
0.065 ng/μL
Das et al. (2010)
Nanoparticle based DNA biosensor for tuberculosis detection
Carbon
DPV
0.01–10 ng/μL
0.01 ng/μL
Torres-Chavolla and Alocilja (2011)
Electrochemical DNA biosensor for detection of the E6 gene HPV inserted in recombinant plasmid
PGE
DPV
40–5000 pg/μL
16 pg/μL
This work
The relative standard deviation (RSD) over three independently probe-modified electrodes measured at a 300 pg/μL target was 3%, indicating that this concentration allowed for a remarkable reproducibility of the detection method. Therefore, the concentration of 300 pg/μL was selected to realize the selectivity study.
3.2.5 Selectivity study in optimized conditions
Control experiments with non-complementary target (undigested pGEM-T/E7) and mixture of complementary and non-complementary targets were carried out to assess whether the suggested DNA sensor responds selectively to the target (Fig. 4).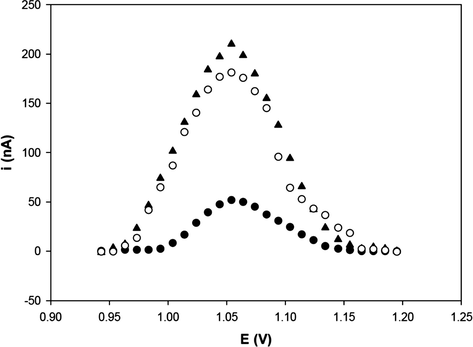
Differential pulse voltammograms of guanine oxidation on the probe-modified PGE: after hybridization with the undigested plasmid solution (pGEM-T/E6) (▴), after hybridization with the non-complementary DNA (undigested pGEM-T/E7) (●) and after hybridization with the undigested mix target (pGEM-T/E6 and pGEM-T/E7) (○). Solution concentration: 300 pg/μL solution of undigested pGEM-T/E6, undigested pGEM-T/E7 and undigested mix target. The oxidation signal was obtained by differential pulse voltammetry in 20 mM Tris–HCl buffer (pH 7.0).
As seen in Fig. 4, the interaction between non-complementary target and immobilized probe did not lead to a significant increase in the guanine oxidation signal. This result suggests that there was no hybridization of the non-complementary target on the probe immobilized onto the PGE.
On the other hand, the interaction between the mixed target and the immobilized probe lead to a significant increase in the guanine oxidation signal, similar to that of the pGEM-T/E6 (complementary target), indicating that there is hybridization when the complementary target is present in the sample. However guanine signal decreases slightly, probably because of partial hybridizations occurred between target and non-complementary target in their mixture solution. These interactions give rise to a slight decrease in availability and hybridization between target and immobilized probe (Pournaghi-Azar et al., 2006; Raoof et al., 2009).
These data demonstrated that this biosensor was able to distinguish between complementary and non-complementary target. The presence of non-complementary samples did not interfere in the specificity of the biosensor.
3.3 Perform biosensor analysis versus electrophoresis for nucleic acid detection
The electrochemical DNA detection performance was compared to the electrophoresis standard method. Samples of different concentrations of the undigested plasmid and linearized plasmid were electrophoresed for 45 min at 80 V on standard 1% agarose gel with ethidium bromide staining (Fig. 5).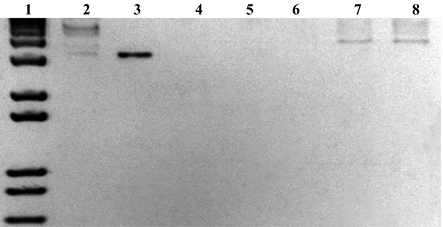
Electrophoresis using a 1% agarose gel stained with ethidium bromide for different concentrations of undigested and linearized plasmid. Lines: (1) 1 kb Plus DNA Ladder (Invitrogen); (2) 120,000 pg/μL of undigested pGEM-T/E6, (3) linearized pGEM-T, (4–8) 40, 2,500, 15,000, 60,000, 120,000 pg/μL of linearized pGEM-T/E6, respectively.
As seen in Fig. 5, the electrophoresis method could not detect the presence of the E6 gene in undigested pGEM-T/E6. Thus, the pGEM-T/E6 was linearized with API enzyme restriction. However, even with the linearized plasmid, the E6 detection was only possible with a plasmid concentration of at least 60,000 pg/μL. In order to detect the presence of the E6 gene at lower concentrations, it was necessary to submit the samples to amplification by polymerase chain reaction (PCR) (Fig. S3 in supplementary information), which makes the electrophoresis technique more expensive (Singh et al., 2010). On the other hand, the proposed biosensor could detect the presence of the E6 gene inserted in undigested plasmid with a concentration starting from 40 pg/μL, with no need for the PCR amplification assay (Fig. 3).
Agarose gel electrophoresis is the standard method used to separate, identify, analyze, characterize and purify DNA fragments. This technique commonly requires the use of specialized apparatus and toxic and mutagenic reagents, such as ethidium bromide labeling (Kirsanov et al., 2010; Singer et al., 1999; Zhang et al., 2008).
The major limitation of this technique is its low sensitivity. Studies demonstrate that DNA detection by the electrophoresis standard method is only possible at concentrations starting from ng (Carman and Williamson, 1989; Yamauchi et al., 2008). In addition, this method does not provide DNA sequence confirmation (Elenis et al., 2008), reporting but the size of the DNA, which could lead to erroneous results in similar size fragments (Pournaghi-Azar et al., 2008). Another difficulty is the DNA analysis of the undigested plasmid. Due to its conformation, the plasmid must usually be linearized by restriction enzyme before running them on a gel. However, this procedure can increase the cost of the method.
The data demonstrate that the biosensor was more sensitive than the electrophoresis standard method. With this electrochemical device it was possible to detect the presence of DNA at a concentration 1,500-fold lower than the electrophoresis method, without the necessity to employ the restriction enzymes and PCR amplification for analyses. Furthermore, with this biosensor it was possible to confirm the target sequence cloned into plasmid because it makes use of the hybridization event to detect the DNA sequence.
4 Conclusions
This paper reports the development of a label-free electrochemical biosensor for the detection of the HPV E6 gene cloned into plasmid pGEM-T. Under optimum conditions, the electrical signal had a linear relationship with the target DNA concentration ranging from 40 to 5,000 pg/μL. The biosensor’s detection limit was 16 pg/μL. Experiments with non-complementary target (E7 gene into pGEM-T) confirmed the selectivity of the biosensor for detecting the E6 gene inserted into pGEM-T.
The electrochemical method showed high sensitivity and specificity when compared with the electrophoresis standard method. The biosensor was able to detect the DNA presence in a 1,500-fold lower concentration than the conventional electrophoresis.
The development of alternative methods, which have high sensitivity and specificity for the DNA detection, is desirable. The proposed method showed a good promise for detecting the presence of a cloned DNA fragment in expression vectors.
Acknowledgments
We are grateful for the financial support from the Conselho Nacional de Desenvolvimento Científico e Tecnológico (CNPq) – Doenças negligenciáveis and Laboratório de Imunopatologia Keizo Asami (LIKA).
References
- Limit of Blank, Limit of Detection and Limit of Quantitation. Clin. Biochem. Rev.. 2008;29:S49-S52.
- [Google Scholar]
- Prevention of human papilloma virus infection with vaccines. J. Pak. Med. Assoc.. 2010;60:676-681.
- [Google Scholar]
- Aligned carbon nanotube thin films for DNA electrochemical sensing. Electrochim. Acta. 2009;54:5035-5041.
- [Google Scholar]
- Global analysis of extracytoplasmic stress signaling in Escherichia coli. PLoS Genet.. 2009;5:e1000651.
- [Google Scholar]
- Electrochemical DNA biosensor for human papillomavirus 16 detection in real samples. Anal. Chim. Acta. 2013;804:258-263.
- [Google Scholar]
- Detection of enzymatically amplified human immunodeficiency virus DNA by oligonucleotide solution hybridization and by incorporation of radiolabeled deoxynucleotides. J. Clin. Microbiol.. 1989;27:2570-2573.
- [Google Scholar]
- HPV infection and cervical disease: a review. Aust. New Zeal. J. Obstet. Gynaecol.. 2011;51:103-108.
- [Google Scholar]
- Biostatistics 102: quantitative data – parametric & non-parametric tests. Singapore Med. J.. 2003;44:391-396.
- [Google Scholar]
- Detection of viruses directly from the fresh leaves of a Phalaenopsis orchid using a microfluidic system. Nanomedicine. 2013;9:1274-1282.
- [Google Scholar]
- Zirconia based nucleic acid sensor for Mycobacterium tuberculosis detection. Appl. Phys. Lett.. 2010;96:133703.
- [Google Scholar]
- Advances in molecular techniques for the detection and quantification of genetically modified organisms. Anal. Bioanal. Chem.. 2008;392:347-354.
- [Google Scholar]
- Direct DNA hybridization at disposable graphite electrodes modified with carbon nanotubes. Anal. Chem.. 2006;78:6656-6659.
- [Google Scholar]
- Clinical applications of DNA vaccines: current progress. Vaccines. 2011;53:296-302.
- [Google Scholar]
- Detection of short oligonucleotide sequences using an electrochemical DNA hybridization biosensor. Cent. Eur. J. Chem.. 2010;8:732-736.
- [Google Scholar]
- Immobilization and voltammetric detection of human interleukine-2 gene on the pencil graphite electrode. Talanta. 2007;71:1734-1740.
- [Google Scholar]
- Electrochemical detection of short sequences of hepatitis C 3a virus using a peptide nucleic acid-assembled gold electrode. Anal. Biochem.. 2010;399:118-124.
- [Google Scholar]
- Construction, electrochemically biosensing and discrimination of recombinant plasmid (pEThIL-2) on the basis of interleukine-2 DNA insert. Biosens. Bioelectron.. 2008;23:1588-1594.
- [Google Scholar]
- “HPV? Never heard of it!”: a systematic review of girls’ and parents’ information needs, views and preferences about human papillomavirus vaccination. Vaccine. 2013;31:5152-5167.
- [Google Scholar]
- Therapeutic human papillomavirus vaccines: current clinical trials and future directions. Exp. Opin. Biol. Ther.. 2008;8:421-439.
- [Google Scholar]
- Therapeutic human papillomavirus (HPV) vaccines: a novel approach. Open Virol. J.. 2012;6(Suppl. 2: M12):264-269.
- [Google Scholar]
- SYBR gold and SYBR green II are not mutagenic in the Ames test. Mutat. Res.. 2010;699:1-4.
- [Google Scholar]
- Electrochemical nucleic acid-based biosensors: concepts, terms, and methodology (IUPAC Technical Report) Pure Appl. Chem.. 2010;82:1161-1187.
- [Google Scholar]
- HPV and therapeutic vaccines: where are we in 2010? Curr. Cancer Ther. Rev.. 2010;6:81-103.
- [Google Scholar]
- Design and Analysis of Experiments. New York: Wiley; 2000.
- Electrochemical DNA biosensor for bovine papillomavirus detection using polymeric film on screen-printed electrode. Biosens. Bioelectron.. 2012;38:61-66.
- [Google Scholar]
- Oscillographic polarography of highly polymerized deoxyribonucleic acid. Nature. 1960;188:656-657.
- [Google Scholar]
- Electrochemical biosensors for DNA hybridization and DNA damage. Biosens. Bioelectron.. 1998;13:621-628.
- [Google Scholar]
- Scaffolded biosensors with designed DNA nanostructures. NPG Asia Mater.. 2013;5:1-9.
- [Google Scholar]
- Electrochemical genosensor design: immobilisation of oligonucleotides onto transducer surfaces and detection methods. Biosens. Bioelectron.. 2000;15:291-303.
- [Google Scholar]
- Direct and rapid electrochemical biosensing of the human interleukin-2 DNA in unpurified polymerase chain reaction (PCR)-amplified real samples. Biosens. Bioelectron.. 2008;24:524-530.
- [Google Scholar]
- Differential pulse voltammetric detection of hepatitis C virus 1a oligonucleotide chain by a label-free electrochemical DNA hybridization biosensor using consensus sequence of hepatitis C virus 1a probe on the pencil graphite electrode. Electroanalysis. 2009;2:1822-1828.
- [Google Scholar]
- Developing an electrochemical deoxyribonucleic acid (DNA) biosensor on the basis of human interleukine-2 gene using an electroactive label. Anal. Chim. Acta. 2006;570:144-150.
- [Google Scholar]
- Detection of human interleukine-2 gene using a label-free electrochemical DNA hybridization biosensor on the basis of a non-inosine substituted probe. Electroanalysis. 2007;19:466-472.
- [Google Scholar]
- A comparative study of carbon nanotube paste electrode for development of indicator-free DNA sensors using DPV and EIS: human interleukin-2 oligonucleotide as a model. Int. Electrochem. Sci.. 2009;4:1436-1451.
- [Google Scholar]
- Electrochemical detection of human papilloma virus (HPV) target DNA using MB on pencil graphite electrode. J. Iran. Chem. Soc.. 2008;5:476-483.
- [Google Scholar]
- Molecular Cloning: A Laboratory Manual. New York: Plenum Press; 1989.
- Comparison of SYBR Green I nucleic acid gel stain mutagenicity and ethidium bromide mutagenicity in the Salmonella/mammalian microsome reverse mutation assay (Ames test) Mutat. Res.. 1999;439:37-47.
- [Google Scholar]
- DNA biosensor for detection of Neisseria gonorrhoeae causing sexually transmitted disease. J. Biotechnol.. 2010;150:357-365.
- [Google Scholar]
- Principles of Instrumental Analysis (5th ed.). Philadelphia: Harcourt Brace; 1998.
- Label-free electrochemical detection of the specific oligonucleotide sequence of dengue virus type 1 on pencil graphite electrodes. Sensors. 2011;11:5616-5629.
- [Google Scholar]
- Pathology and epidemiology of HPV infection in females. Gynecol. Oncol.. 2010;117:S5-S10.
- [Google Scholar]
- Sensitive detection of lip genes by electrochemical DNA sensor and its application in polymerase chain reaction amplicons from Phanerochaete chrysosporium. Biosens. Bioelectron.. 2009;24:1474-1479.
- [Google Scholar]
- Nanoparticle based DNA biosensor for tuberculosis detection using thermophilic helicase-dependent isothermal amplification. Biosens. Bioelectron.. 2011;26:4614-4618.
- [Google Scholar]
- Electrochemical DNA hybridization sensors applied to real and complex biological samples. Biosens. Bioelectron.. 2010;26:1205-1217.
- [Google Scholar]
- Electrochemical transducers based on surfactant bilayers for the direct detection of affinity interactions. Biosens. Bioelectron.. 2003;18:1031-1037.
- [Google Scholar]
- Label-free detection of DNA hybridization at a liquid/liquid interface. Anal. Chem.. 2008;80:1336-1340.
- [Google Scholar]
- Emerging biological treatments for uterine cervical carcinoma. J. Cancer. 2014;5:86-97.
- [Google Scholar]
- Adsorptive stripping potentiometry of DNA at electrochemically pretreated carbon paste electrodes. Electroanalysis. 1996;8:20-24.
- [Google Scholar]
- Flow detection of nucleic acids at a conducting polymer-modified electrode. Anal. Chem.. 1999;71:4095-4099.
- [Google Scholar]
- Pencil-based renewable biosensor for label-free electrochemical detection of DNA hybridization. Anal. Chim. Acta. 2001;431:219-224.
- [Google Scholar]
- Magnetic bead-based label-free electrochemical detection of DNA hybridization. Analyst. 2001;126:2020-2024.
- [Google Scholar]
- Indicator-free electrochemical DNA hybridization biosensor. Anal. Chim. Acta. 1998;375:197-203.
- [Google Scholar]
- Scanning electrochemical microscopic imaging of surface-confined DNA probes and their hybridization via guanine oxidation. J. Electroanal. Chem.. 2002;537:95-102.
- [Google Scholar]
- An electrostatic model for DNA surface hybridization. Biophys. J.. 2010;98:2954-2963.
- [Google Scholar]
- Application of real time PCR for the quantitative detection of radiation-induced genomic DNA strand breaks. J. Insect Biotechnol. Sericol.. 2008;77:17-24.
- [Google Scholar]
- Rapid and cost-effective detection of sequence-specific DNA by monitoring the electrochemical response of 2′-deoxyguanosine 5′-triphosphate in a PCR sample. Analyst. 2008;133:1729-1735.
- [Google Scholar]
Appendix A
Supplementary data
Supplementary data associated with this article can be found, in the online version, at http://dx.doi.org/10.1016/j.arabjc.2014.05.023.
Appendix A
Supplementary data
Supplementary data 1
Supplementary data 1
This document file contains Supplementary Materials.


